colombia power sector report
DESCRIPTION
contains the details of power sector structure of colombia and the regulations applicable in colombia.TRANSCRIPT

- 1 - Any redistribution of this information is strictly prohibited.
Copyright © 2014 EMIS, all rights reserved.
Produced by:
Any redistribution of this information is strictly prohibited.
Copyright © 2014 EMIS, all rights reserved.
Power Sector Colombia
May 2014

- 2 - Any redistribution of this information is strictly prohibited.
Copyright © 2014 EMIS, all rights reserved.
Table of Contents
I. Sector Overview
1. Sector Highlights
2. Main Sector Indicators
3. Power Sector Forecast
4. Electricity Demand, Capacity Forecast
5. Natural Gas Demand Forecast
6. Energy System Balance
7. Power Sector Snapshot
8. Power Sector Snapshot (cont´d)
9. FDI
10.CPI and PPI
11.Government Policy
12.Government Policy (cont'd)
II. Power Generation Overview
1. Power Generation Highlights
2. Power Generation Demand
3. Electricity Input and Water Reserves
4. Electricity Generation
5. Electricity Demand and Consumption
6. Other Energy Indicators
III. Power Generation by Type of Fuel
1. Fuel Consumption
2. Coal Mining
3. Coal Mining (cont´d)
4. Gas Generation
5. Gas Generation (cont´d)
6. Hydropower Generation
7. Hydropower Reserves
8. Renewable Energy
9. Small Power Plants
10.Power Generation SWOT Analysis
11.Power Transmission and Distribution
IV. Power Exports
1. Energy Exports
2. Power Foreign Trade
3. Power Exchange and Trading
4. Power Exchange and Trading (cont´d)
V. Natural Gas Distribution
1. PNG in Colombia
2. Natural Gas Coverage
3. Car Fuel

- 3 - Any redistribution of this information is strictly prohibited.
Copyright © 2014 EMIS, all rights reserved.
Table of Contents
VI. Main Players
1. Ecopetrol S.A.
2. Ecopetrol S.A. (cont´d)
3. Interconexión Eléctrica S.A.
4. Interconexión Eléctrica S.A. (cont´d)
5. Codensa S.A. E.S.P
6. Codensa S.A. E.S.P (cont´d)
7. Empresas Publicas de Medellin E.S.P
8. Empresas Publicas de Medellin E.S.P (cont´d)
9. Emgesa S.A. E.S.P.
10.Emgesa S.A. E.S.P. (cont´d)

- 4 - Any redistribution of this information is strictly prohibited.
Copyright © 2014 EMIS, all rights reserved.
I. Sector Overview
- 5 - Any redistribution of this information is strictly prohibited.
Copyright © 2014 EMIS, all rights reserved.
Power Sector Highlights
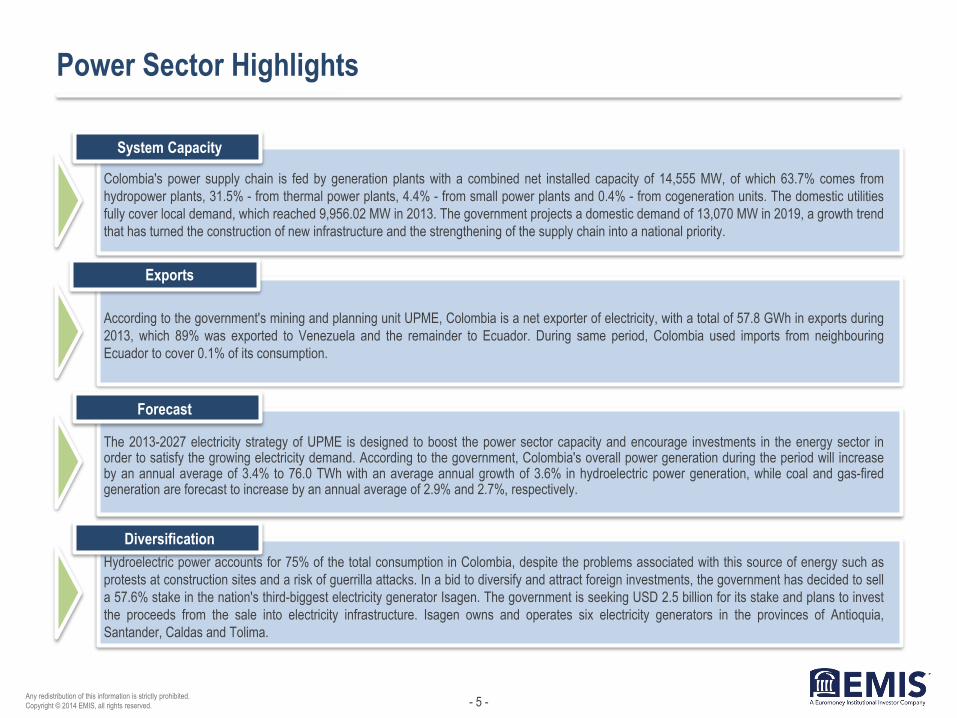
Colombia's power supply chain is fed by generation plants with a combined net installed capacity of 14,555 MW, of which 63.7% comes from
hydropower plants, 31.5% - from thermal power plants, 4.4% - from small power plants and 0.4% - from cogeneration units. The domestic utilities
fully cover local demand, which reached 9,956.02 MW in 2013. The government projects a domestic demand of 13,070 MW in 2019, a growth trend
that has turned the construction of new infrastructure and the strengthening of the supply chain into a national priority.
System Capacity
Exports
Forecast
Diversification
According to the government's mining and planning unit UPME, Colombia is a net exporter of electricity, with a total of 57.8 GWh in exports during
2013, which 89% was exported to Venezuela and the remainder to Ecuador. During same period, Colombia used imports from neighbouring
Ecuador to cover 0.1% of its consumption.
The 2013-2027 electricity strategy of UPME is designed to boost the power sector capacity and encourage investments in the energy sector in order to satisfy the growing electricity demand. According to the government, Colombia's overall power generation during the period will increase by an annual average of 3.4% to 76.0 TWh with an average annual growth of 3.6% in hydroelectric power generation, while coal and gas-fired generation are forecast to increase by an annual average of 2.9% and 2.7%, respectively.
Hydroelectric power accounts for 75% of the total consumption in Colombia, despite the problems associated with this source of energy such as
protests at construction sites and a risk of guerrilla attacks. In a bid to diversify and attract foreign investments, the government has decided to sell
a 57.6% stake in the nation's third-biggest electricity generator Isagen. The government is seeking USD 2.5 billion for its stake and plans to invest
the proceeds from the sale into electricity infrastructure. Isagen owns and operates six electricity generators in the provinces of Antioquia,
Santander, Caldas and Tolima.

- 6 - Any redistribution of this information is strictly prohibited.
Copyright © 2014 EMIS, all rights reserved.
Source:
Comments
Main Sector Indicators
In 2013, the revenues from power generation in Colombia grew at a slightly faster pace in comparison to 2011 and 2012. The total growth rate for the sector
was 4.9% - electric power grew by 4.0%, utility gas by 14.4% and growth on the added value of water supply, sewerage and waste reached 3.8%. This
growth was fuelled by rising consumption from both private and household users. The strong growth of Colombia's economy also contributed to the positive
trend, especially with the rise in electricity consumption by public companies and civil works.
Main Sector Indicators
National Administrative Department of Statistics
2005 2006 2007 2008 2009 2010 2011 2012 2013
Electricity revenues, COP tn 8.5 8.8 9.2 9.3 9.4 9.8 10.1 10.3 10.7
Electricity growth y/y 4.7% 4.3% 3.8% 1.5% 0.8% 4.5% 3.3% 2.0% 4.0%
Utility gas revenues, COP tn 1.2 1.3 1.4 1.3 1.5 1.6 1.7 1.7 2.0
Utility gas growth y/y 4.7% 5% 10% -7,4% 11% 6.5% -1% 1.4% 14.4%
Water supply revenues, COP tn 4.0 4.2 4.3 4.4 4.4 4.5 4.6 4.7 4.8
Water supply growth y/y 2.8 5.7 2.7 1.4 0.3 1.5 2.6 2.1 3.8
Electricity revenues/GDP 2.5% 2.6% 2.7% 2.7% 2.8% 2.9% 3.0% 2.9% 2.1%
Utility Gas revenues/GDP 0.4% 0.4% 0.4% 0.4% 0.4% 0.5% 0.36% 0.36% 0.4%
Water supply revenues/GDP 0.8% 0.8% 0.8% 0.9% 0.9% 0.9% 0.9% 1% 1%
GDP growth y/y 4.7% 6.7% 6.9% 3.5% 1.7% 4.0% 6.6% 4.0% 4.3%
GDP real value, COP tn 340.2 362.9 388.0 401.7 408.4 424.6 452.8 470.9 490.9
Power sector growth y/y 3.8% 3.8% 2.5% 1.4% 2.9% 1.6% 2.4% 3.8% 4.9%
*Colombian currency in constant price 2005 = 100

- 7 - Any redistribution of this information is strictly prohibited.
Copyright © 2014 EMIS, all rights reserved.
Power Sector Forecast
In 2013, Colombia had one of the most expensive residential energy tariffs, totalling USD 0.189 per KWh. The country's energy ministry has set up
an energy efficiency agency, which is responsible for auditing and potentially reducing local electricity prices.
Price Regulation
Biofuels
The governments of Colombia and Panama have expressed plans to build a 614 km transmission line connecting the Colombian and Panamanian
power grids. The line will have an initial transmission capacity of 300 MW, with the option to be extended up to 600 MW. Works on the project have
been delayed and the latest estimated launch of operations is 2018.
Colombia is preparing a regulatory framework and legislative instruments to promote the sustainable production of biofuels. Today, biofuel
producers in the country have access to a special regime which allows them to conduct duty-free import of machinery for production and
transportation. Colombia's current production capacity is 1.1 million litres/day of ethanol and 1.8 million litres/day of biodiesel. Production is
expected to grow by 2% annually in the coming years.
Colombia's government is seeking to raise USD 2.5 billion from the sale of its 57.6% stake in Isagen, which operates six electricity
generators. In March, local judicial authorities have ordered the suspension of the sale due to constitutional concerns.
Isagen
Interconnection

- 8 - Any redistribution of this information is strictly prohibited.
Copyright © 2014 EMIS, all rights reserved.
Source:
Electricity Demand, Capacity Forecast
Electricity National Demand (GWh) National Maximum Capacity (MW)
UPME
Year High Scenario Medium Scenario Low Scenario
2014f 65,000 63,481 61,963
2015f 67,070 65,526 63,983
2016f 69,704 68,134 66,563
2017f 71,773 70,172 68,572
2018f 74,668 73,034 71,401
2019f 77,613 75,944 74,276
2020f 79,708 78,002 76,296
2021f 81,531 79,786 78,040
2022f 83,297 81,510 79,723
2023f 84,654 82,825 82,995
2024f 86,524 84,650 82,776
2025f 88,448 86,529 84,610
2026f 90,308 88,342 86,375
2027f 92,279 90,265 88,250
Year High Scenario Medium Scenario Low Scenario
2014f 10,600 10,352 10,104
2015f 10,776 10,524 10,272
2016f 10,940 10,648 10,429
2017f 11,184 10,923 10,662
2018f 11,418 11,152 10,885
2019f 11,668 11,396 11,124
2020f 11,900 11,623 11,345
2021f 12,120 11,926 11,641
2022f 12,499 12,208 11,916
2023f 12,798 12,500 12,202
2024f 13,072 12,767 12,462
2025f 13,426 13,113 12,800
2026f 13,754 13,433 13,113
2027f 14,091 13,673 13,434

- 9 - Any redistribution of this information is strictly prohibited.
Copyright © 2014 EMIS, all rights reserved.
Source:
Natural Gas Demand Forecast
Natural Gas Demand by Sector Forecast, 2022
Natural Gas Demand by Industry (GBTUD)
Comments
Ministry of Mining and Energy, UPME
214 224 234 242 250 256 263
269 275 280 285 289
293
308 322 336
350 363 378 392 406 420 434 448
461 474
275 267
310
384
519
193 207 226 236 277
317 334 390
214
282 309
340 377
373
469 491 491 491 491 491 491
85 89 92 95 98 101 105 108 111 114 117 120 124
2014 2015 2016 2017 2018 2019 2020 2021 2022 2023 2024 2025 2026
Domestic Industrial Electric Generation Oil Sector Automotive
Domestic 21.5%
Industrial 30.8%
Electric Generation
6.5%
Oil Sector 31.4%
Automotive 8.0%
Petrochemical 1.9%
Domestic natural gas demand is slowing due the fact that service
coverage has nearly reached its peak in 2013 with 6.8 million consumers,
of whom 98.14% are residential, 1.80% - commercial and 0.06% -
industrial consumers. A major increase in the electricity generation sector
is forecast for 2018 due to the expected launch of the transmission
network project between Colombia and Panama. Industry and the oil
sector will be the driving forces behind the forecast demand, as these
two sectors have the largest number of projects (especially in
infrastructure, construction and extraction).

- 10 - Any redistribution of this information is strictly prohibited.
Copyright © 2014 EMIS, all rights reserved.
Source:
Energy System Balance
National Power Transmission Network Indicators
XM Compañía de Expertos en Mercados S.A ESP
2012 2013 Growth
SUPPLY
Net Daily Volume (GWh) 11,180.61 10,495.05 -6.1%
Volume / Useful Capacity 73.4% 69.5% -4.0%
Hydropower Imput (GWh) 56,446.7 49,619.2 -12.1
Net Capacity 14,361 14,559 1.4%
GENERATION
Hydropower (GWh) 44,923.6 41,835.9 -6.9%
Thermal (GWh) 11,506.0 16,838.6 46.3%
Small Hydropower Plants (GWh) 3,212.6 3,170.0 -1.3%
Cogenerators (GWh) 346.6 352.0 1.5%
Total (GWh) 59,988.9 62,196.6 3.7%
INTERNATIONAL EXCHANGE
Exports to Ecuador (GWh) 236.0 662.3 180.6%
Imports from Ecuador (GWh) 6.5 28.5 337.8%
Exports to Venezulea (GWh) 478.4 715.0 49.4%
DEMAND
Commercial (GWh) 59,508.6 61,499.3 3.3%
National, handled by the national transmission company SIN
(GWh) 59,369.9 60,890.3 2.8%
Regulated (GWh) 39,174.7 40,282.0 3.1%
Unregulated (GWh) 19,799.9 20,237.4 2.5%
Unmet due to unavilability, natural disasters or terrorism
(GWh) 89.0 42.5 -52.2%
Maximum load per hour (MW) 9,504 9,383 -1.3%
- 11 - Any redistribution of this information is strictly prohibited.
Copyright © 2014 EMIS, all rights reserved.
Source:
Power Sector Snapshot
World energy consumption by region (quadrillion Btu)
World energy consumption by fuel type (mn tonnes )
World proved natural gas reserves 2013 (tn cub ft)
World Proved Natural Gas Reserves (tn cub ft)
U.S. Energy Information Administration, World Bank, Exxon-Mobil
120 121 126 130 133 137 144
129 132 138 146 152 158 162
199 235 273
306 335 363 383
28 33
37 39
43 46
49
19 20
22 24
27 31
35
29 31
33 35
39 42
47
0
100
200
300
400
500
600
700
800
900
2010 2015 2020 2025 2030 2035 2040
Central & South America
Africa
Middle East
Asia
Europe
Americas Coal 4,382.0
Oil 4,367.3
Natural Gas 3,685.9
Hydroelectricity 963.9
Nuclear Energy 704.3
Renewables 505.5
Biofuels 78.9
3,159 3,287 3,581
3,912 4,038 4,131 4,227 4,447
4,671 4,837 4,967
1,768 1,926 2,177
2,500 2,864 2,987
3,258 3,267
3,959 4,285
4,631
2,211 2,235 2,342
2,923
3,464 3,730 3,960
4,368 4,551
4,650 4,743
453 526 584 627 626 569 630
794 771 839 859 490 563 602 662 782 831 859 964 1,065 1,155 1,246
1990 1995 2000 2005 2010 2012 2015 2020 2025 2030 2035
Liquids Natural Gas
Coal Nuclear Energy
Hydroelectricity
2,824
2,178
515
504
358
269
146
Middle East
Eurasia
Africa
Asia
North America
Central & South America
Europe
- 12 - Any redistribution of this information is strictly prohibited.
Copyright © 2014 EMIS, all rights reserved.
Source:
Comments
Power Sector Snapshot (cont'd)
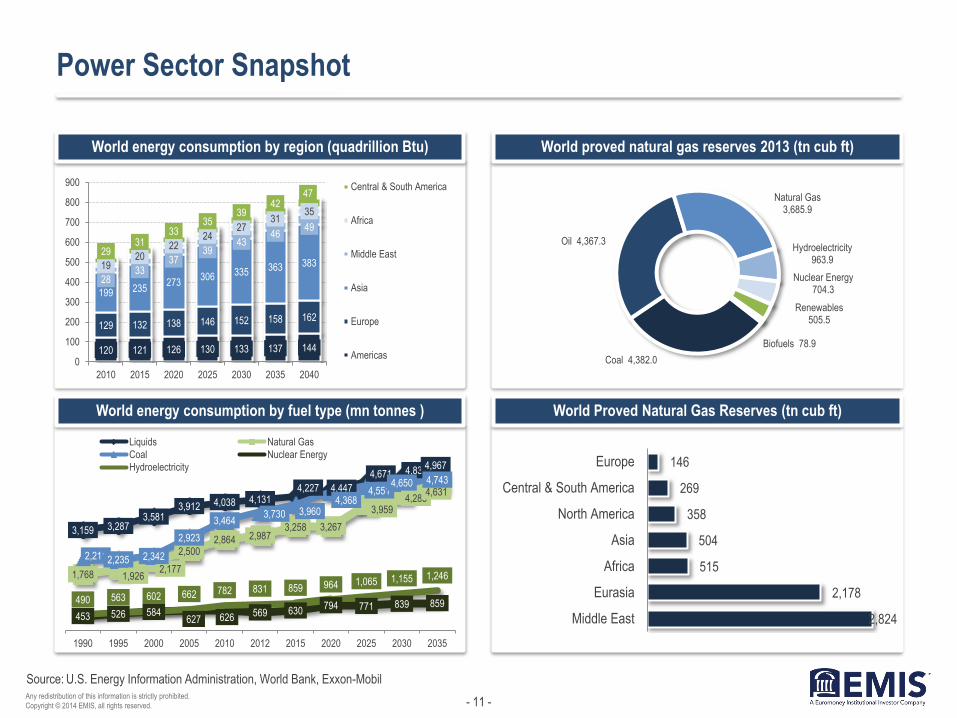
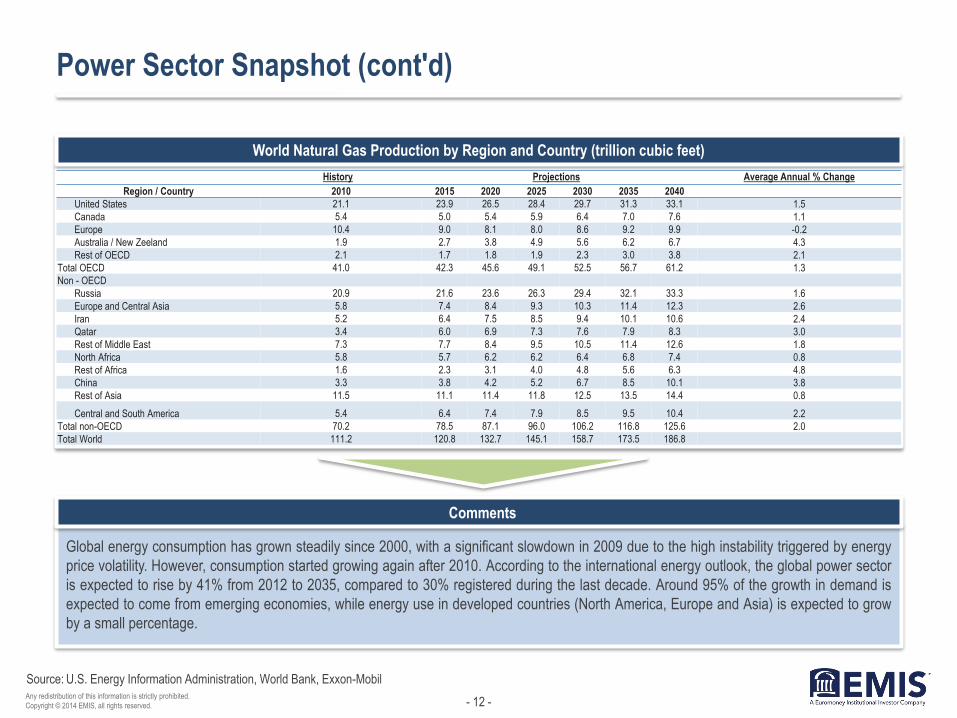
Global energy consumption has grown steadily since 2000, with a significant slowdown in 2009 due to the high instability triggered by energy
price volatility. However, consumption started growing again after 2010. According to the international energy outlook, the global power sector
is expected to rise by 41% from 2012 to 2035, compared to 30% registered during the last decade. Around 95% of the growth in demand is
expected to come from emerging economies, while energy use in developed countries (North America, Europe and Asia) is expected to grow
by a small percentage.
World Natural Gas Production by Region and Country (trillion cubic feet)
U.S. Energy Information Administration, World Bank, Exxon-Mobil
History Projections Average Annual % Change
Region / Country 2010 2015 2020 2025 2030 2035 2040
United States 21.1 23.9 26.5 28.4 29.7 31.3 33.1 1.5
Canada 5.4 5.0 5.4 5.9 6.4 7.0 7.6 1.1
Europe 10.4 9.0 8.1 8.0 8.6 9.2 9.9 -0.2
Australia / New Zeeland 1.9 2.7 3.8 4.9 5.6 6.2 6.7 4.3
Rest of OECD 2.1 1.7 1.8 1.9 2.3 3.0 3.8 2.1
Total OECD 41.0 42.3 45.6 49.1 52.5 56.7 61.2 1.3
Non - OECD
Russia 20.9 21.6 23.6 26.3 29.4 32.1 33.3 1.6
Europe and Central Asia 5.8 7.4 8.4 9.3 10.3 11.4 12.3 2.6
Iran 5.2 6.4 7.5 8.5 9.4 10.1 10.6 2.4
Qatar 3.4 6.0 6.9 7.3 7.6 7.9 8.3 3.0
Rest of Middle East 7.3 7.7 8.4 9.5 10.5 11.4 12.6 1.8
North Africa 5.8 5.7 6.2 6.2 6.4 6.8 7.4 0.8
Rest of Africa 1.6 2.3 3.1 4.0 4.8 5.6 6.3 4.8
China 3.3 3.8 4.2 5.2 6.7 8.5 10.1 3.8
Rest of Asia 11.5 11.1 11.4 11.8 12.5 13.5 14.4 0.8
Central and South America 5.4 6.4 7.4 7.9 8.5 9.5 10.4 2.2
Total non-OECD 70.2 78.5 87.1 96.0 106.2 116.8 125.6 2.0
Total World 111.2 120.8 132.7 145.1 158.7 173.5 186.8

- 13 - Any redistribution of this information is strictly prohibited.
Copyright © 2014 EMIS, all rights reserved.
Comments
Source:
FDI
Colombia attracted a record-high FDI of USD 16.7bn in 2013, which is equal to 4.5% of the country's GDP. In terms of sectors, 46.7% of the inflows went
into mining, 15.9% to manufacturing, 10.4% into transport and communications, 9.4% into financial institutions and 9.4% into commerce.
FDI in Electricity, Gas and Water (USDmn) FDI in Mining, Oil and Derivatives (USDmn)
Central bank
-71
135 68 88
-251 -141
-79
156
36 36
380
819
470
2001 2002 2003 2004 2005 2006 2007 2008 2009 2010 2011 2012 2013
1,044 915 905
1,741
3,282 3,777
4,433
5,203 5,453
4,540
7,516 7,732 7,825
2001 2002 2003 2004 2005 2006 2007 2008 2009 2010 2011 2012 2013

- 14 - Any redistribution of this information is strictly prohibited.
Copyright © 2014 EMIS, all rights reserved.
Source:
CPI and PPI
Consumer and Producer Price Index (COP)
Central bank
107.97 112.69
118.90
115.39 114.82
2%
3.17%
3.73%
2.44%
1.94%
2009 2010 2011 2012 2013
PPI CPI
- 15 - Any redistribution of this information is strictly prohibited.
Copyright © 2014 EMIS, all rights reserved.
Source:
Government Policy
Key Bodies
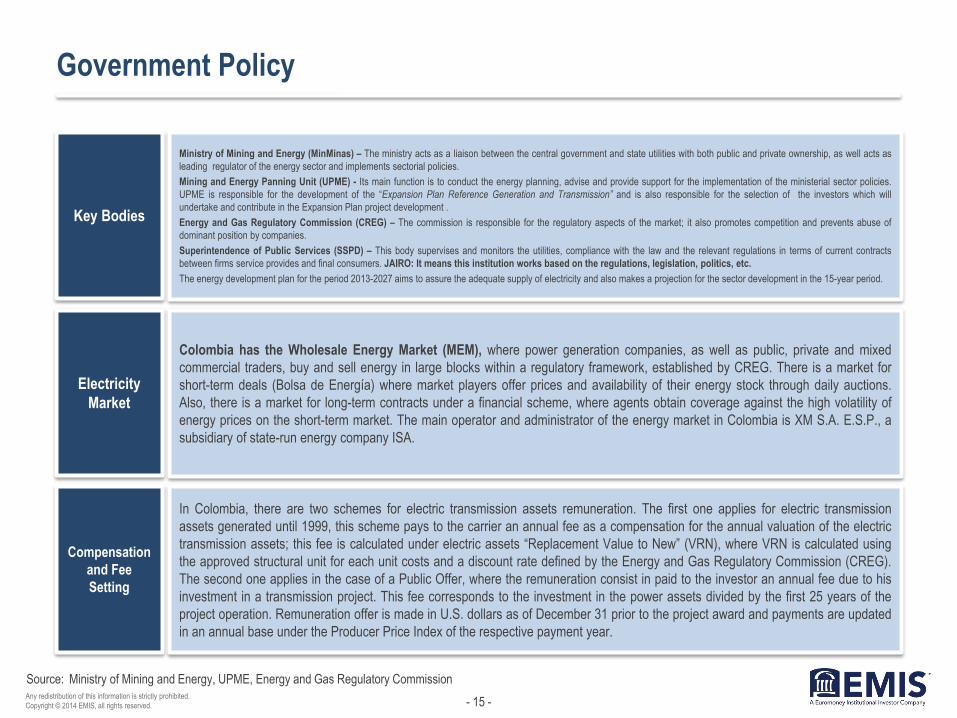
Ministry of Mining and Energy (MinMinas) – The ministry acts as a liaison between the central government and state utilities with both public and private ownership, as well acts as
leading regulator of the energy sector and implements sectorial policies.
Mining and Energy Panning Unit (UPME) - Its main function is to conduct the energy planning, advise and provide support for the implementation of the ministerial sector policies.
UPME is responsible for the development of the “Expansion Plan Reference Generation and Transmission” and is also responsible for the selection of the investors which will
undertake and contribute in the Expansion Plan project development .
Energy and Gas Regulatory Commission (CREG) – The commission is responsible for the regulatory aspects of the market; it also promotes competition and prevents abuse of
dominant position by companies.
Superintendence of Public Services (SSPD) – This body supervises and monitors the utilities, compliance with the law and the relevant regulations in terms of current contracts
between firms service provides and final consumers. JAIRO: It means this institution works based on the regulations, legislation, politics, etc.
The energy development plan for the period 2013-2027 aims to assure the adequate supply of electricity and also makes a projection for the sector development in the 15-year period.
Electricity
Market
Colombia has the Wholesale Energy Market (MEM), where power generation companies, as well as public, private and mixed
commercial traders, buy and sell energy in large blocks within a regulatory framework, established by CREG. There is a market for
short-term deals (Bolsa de Energía) where market players offer prices and availability of their energy stock through daily auctions.
Also, there is a market for long-term contracts under a financial scheme, where agents obtain coverage against the high volatility of
energy prices on the short-term market. The main operator and administrator of the energy market in Colombia is XM S.A. E.S.P., a
subsidiary of state-run energy company ISA.
Compensation
and Fee
Setting
In Colombia, there are two schemes for electric transmission assets remuneration. The first one applies for electric transmission
assets generated until 1999, this scheme pays to the carrier an annual fee as a compensation for the annual valuation of the electric
transmission assets; this fee is calculated under electric assets “Replacement Value to New” (VRN), where VRN is calculated using
the approved structural unit for each unit costs and a discount rate defined by the Energy and Gas Regulatory Commission (CREG).
The second one applies in the case of a Public Offer, where the remuneration consist in paid to the investor an annual fee due to his
investment in a transmission project. This fee corresponds to the investment in the power assets divided by the first 25 years of the
project operation. Remuneration offer is made in U.S. dollars as of December 31 prior to the project award and payments are updated
in an annual base under the Producer Price Index of the respective payment year.
Ministry of Mining and Energy, UPME, Energy and Gas Regulatory Commission
- 16 - Any redistribution of this information is strictly prohibited.
Copyright © 2014 EMIS, all rights reserved.
Government Policy (cont'd)
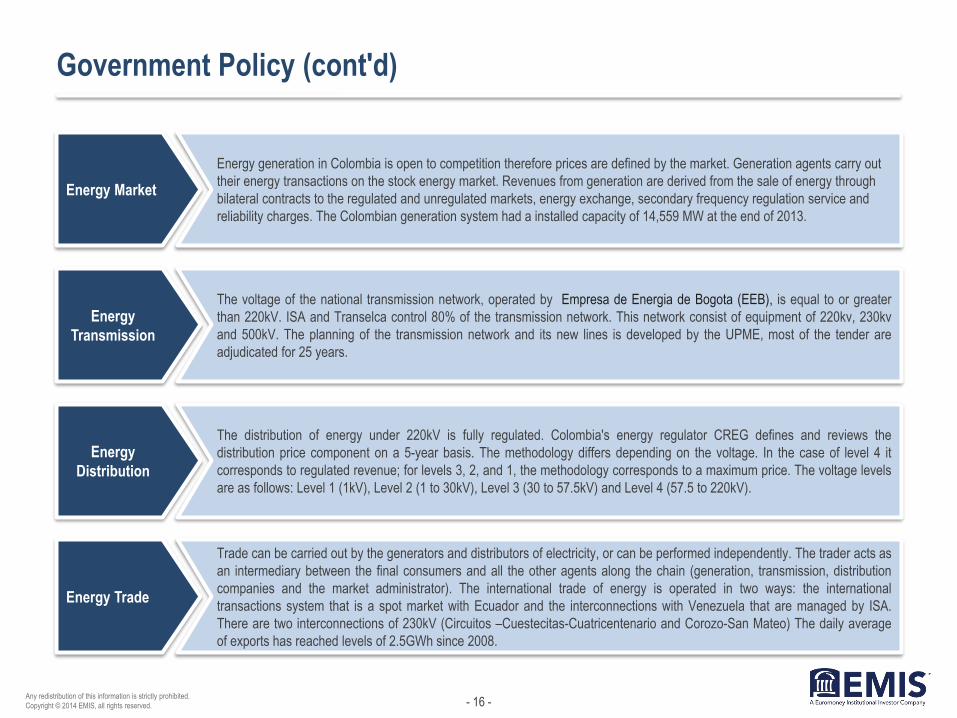
Energy Market
Energy generation in Colombia is open to competition therefore prices are defined by the market. Generation agents carry out
their energy transactions on the stock energy market. Revenues from generation are derived from the sale of energy through
bilateral contracts to the regulated and unregulated markets, energy exchange, secondary frequency regulation service and
reliability charges. The Colombian generation system had a installed capacity of 14,559 MW at the end of 2013.
Energy
Transmission
The voltage of the national transmission network, operated by Empresa de Energia de Bogota (EEB), is equal to or greater
than 220kV. ISA and Transelca control 80% of the transmission network. This network consist of equipment of 220kv, 230kv
and 500kV. The planning of the transmission network and its new lines is developed by the UPME, most of the tender are
adjudicated for 25 years.
Energy
Distribution
The distribution of energy under 220kV is fully regulated. Colombia's energy regulator CREG defines and reviews the
distribution price component on a 5-year basis. The methodology differs depending on the voltage. In the case of level 4 it
corresponds to regulated revenue; for levels 3, 2, and 1, the methodology corresponds to a maximum price. The voltage levels
are as follows: Level 1 (1kV), Level 2 (1 to 30kV), Level 3 (30 to 57.5kV) and Level 4 (57.5 to 220kV).
Energy Trade
Trade can be carried out by the generators and distributors of electricity, or can be performed independently. The trader acts as
an intermediary between the final consumers and all the other agents along the chain (generation, transmission, distribution
companies and the market administrator). The international trade of energy is operated in two ways: the international
transactions system that is a spot market with Ecuador and the interconnections with Venezuela that are managed by ISA.
There are two interconnections of 230kV (Circuitos –Cuestecitas-Cuatricentenario and Corozo-San Mateo) The daily average
of exports has reached levels of 2.5GWh since 2008.
- 17 - Any redistribution of this information is strictly prohibited.
Copyright © 2014 EMIS, all rights reserved.
II. Power Generation Overview
- 18 - Any redistribution of this information is strictly prohibited.
Copyright © 2014 EMIS, all rights reserved.
Power Generation Highlights
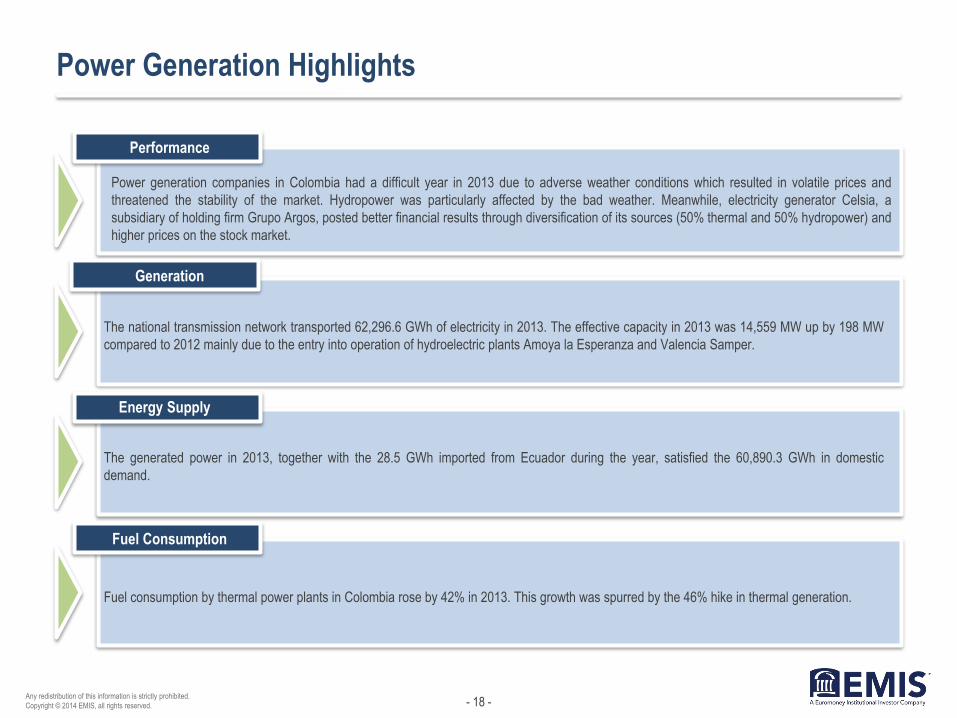
Power generation companies in Colombia had a difficult year in 2013 due to adverse weather conditions which resulted in volatile prices and
threatened the stability of the market. Hydropower was particularly affected by the bad weather. Meanwhile, electricity generator Celsia, a
subsidiary of holding firm Grupo Argos, posted better financial results through diversification of its sources (50% thermal and 50% hydropower) and
higher prices on the stock market.
Performance
Generation
Energy Supply
Fuel Consumption
The national transmission network transported 62,296.6 GWh of electricity in 2013. The effective capacity in 2013 was 14,559 MW up by 198 MW
compared to 2012 mainly due to the entry into operation of hydroelectric plants Amoya la Esperanza and Valencia Samper.
The generated power in 2013, together with the 28.5 GWh imported from Ecuador during the year, satisfied the 60,890.3 GWh in domestic
demand.
Fuel consumption by thermal power plants in Colombia rose by 42% in 2013. This growth was spurred by the 46% hike in thermal generation.

- 19 - Any redistribution of this information is strictly prohibited.
Copyright © 2014 EMIS, all rights reserved.
Comments
Source:
Power Demand
Energy demand in 2013 increased by 2.8%, slightly lower than the 3.8 growth rate registered in 2012. This slowdown was largely due to lower
consumption by traditional consumers such as oil, coal and cement, as well as the fall in public orders. The unfavourable weather conditions,
which brought hydropower generation and reserves to their lowest levels since 2000, also resulted in highly volatile energy prices.
Demand (GWh) Installed Capacity by Technology Type (%)
National Administrative Department of Statistics, XM Compañía de Expertos en Mercados S.A ESP
47,
017
48,8
29
50,8
13
52,8
53
53,
870
54,
679
56,
148
57,
150
59,
370
60,
890
2004 2005 2006 2007 2008 2009 2010 2011 2012 2013
Hydraulic 64.0%
Gas 13.5%
Coal 6.8%
Diesel 6.2% Small
Hydraulic 3.8%
Number 6 fuel oil 2.1%
Gas.Jett A1 1.8%
Small Thermal 0.5%
Cogenerators 0.5%
Jett1 0.3%
Wind 0.1%
- 20 - Any redistribution of this information is strictly prohibited.
Copyright © 2014 EMIS, all rights reserved.
Comments
Source:
Electricity Imputs and Water Reserves
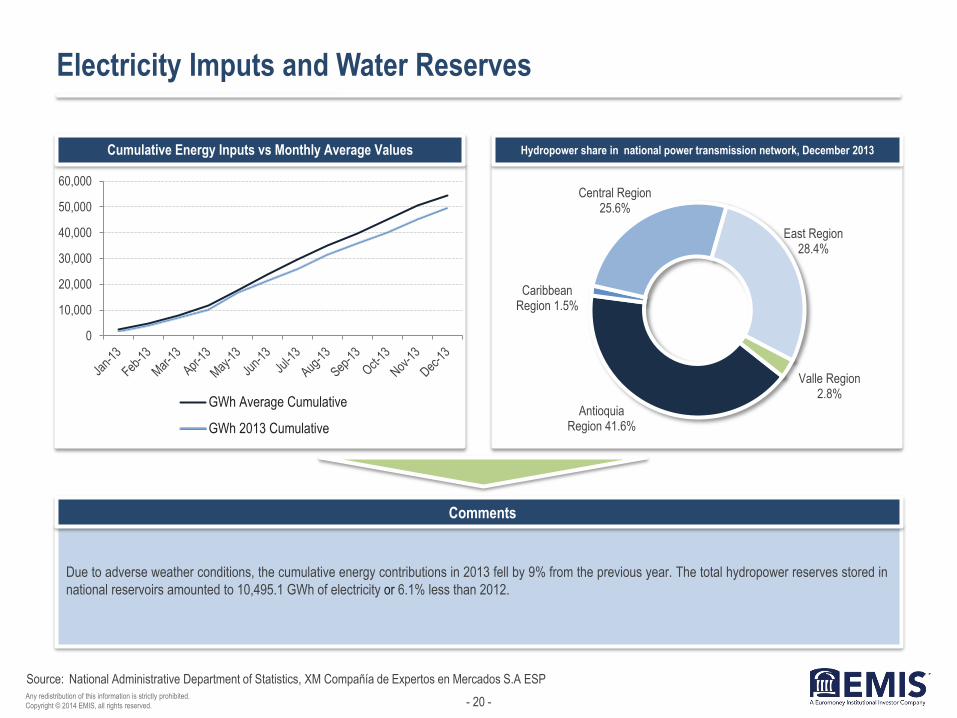
Due to adverse weather conditions, the cumulative energy contributions in 2013 fell by 9% from the previous year. The total hydropower reserves stored in
national reservoirs amounted to 10,495.1 GWh of electricity or 6.1% less than 2012.
Cumulative Energy Inputs vs Monthly Average Values Hydropower share in national power transmission network, December 2013
National Administrative Department of Statistics, XM Compañía de Expertos en Mercados S.A ESP
0
10,000
20,000
30,000
40,000
50,000
60,000
GWh Average Cumulative
GWh 2013 Cumulative
Antioquia Region 41.6%
Caribbean Region 1.5%
Central Region 25.6%
East Region 28.4%
Valle Region 2.8%
- 21 - Any redistribution of this information is strictly prohibited.
Copyright © 2014 EMIS, all rights reserved.
Comments
Source:
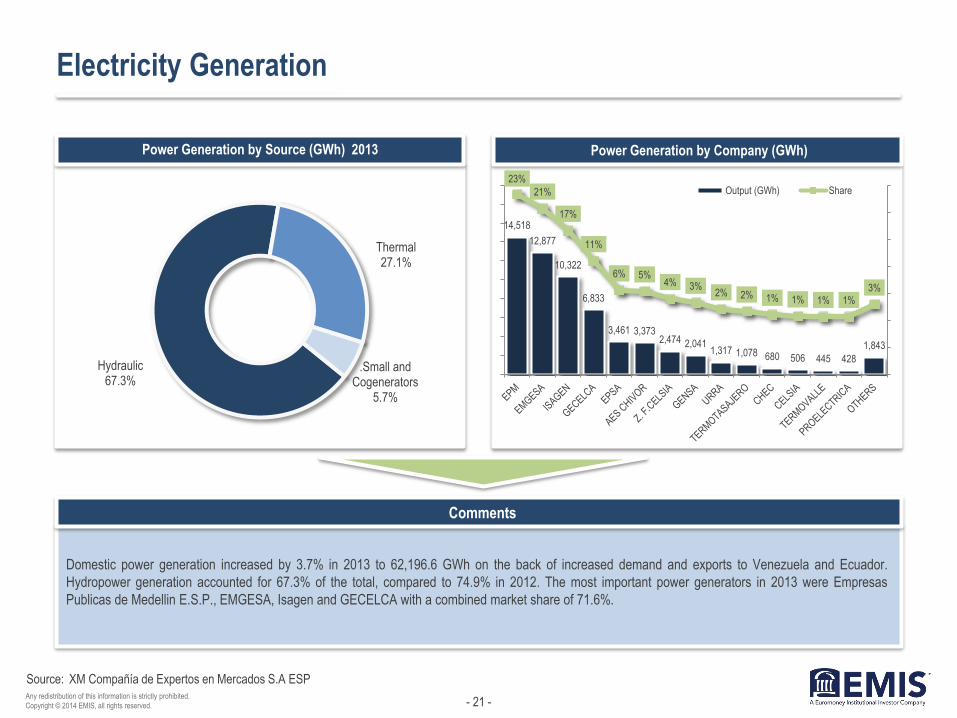
Electricity Generation
Domestic power generation increased by 3.7% in 2013 to 62,196.6 GWh on the back of increased demand and exports to Venezuela and Ecuador.
Hydropower generation accounted for 67.3% of the total, compared to 74.9% in 2012. The most important power generators in 2013 were Empresas
Publicas de Medellin E.S.P., EMGESA, Isagen and GECELCA with a combined market share of 71.6%.
Power Generation by Source (GWh) 2013 Power Generation by Company (GWh)
XM Compañía de Expertos en Mercados S.A ESP
14,518
12,877
10,322
6,833
3,461 3,373 2,474 2,041
1,317 1,078 680 506 445 428
1,843
23%
21%
17%
11%
6% 5% 4% 3%
2% 2% 1% 1% 1% 1%
3%
Output (GWh) Share
Hydraulic 67.3%
Thermal 27.1%
.Small and Cogenerators
5.7%
- 22 - Any redistribution of this information is strictly prohibited.
Copyright © 2014 EMIS, all rights reserved.
Source:
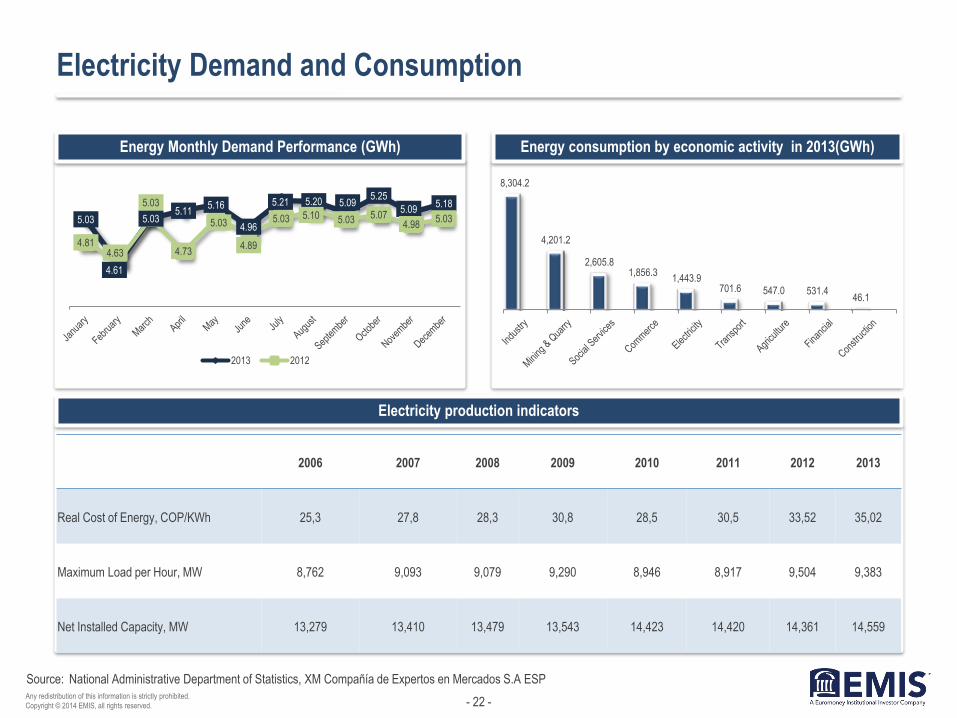
Electricity Demand and Consumption
Energy Monthly Demand Performance (GWh)
Electricity production indicators
Energy consumption by economic activity in 2013(GWh)
National Administrative Department of Statistics, XM Compañía de Expertos en Mercados S.A ESP
5.03
4.61
5.03 5.11
5.16
4.96
5.21 5.20 5.09 5.25
5.09 5.18
4.81 4.63
5.03
4.73
5.03
4.89
5.03 5.10 5.03 5.07 4.98
5.03
2013 2012
8,304.2
4,201.2
2,605.8 1,856.3
1,443.9 701.6 547.0 531.4
46.1
2006 2007 2008 2009 2010 2011 2012 2013
Real Cost of Energy, COP/KWh 25,3 27,8 28,3 30,8 28,5 30,5 33,52 35,02
Maximum Load per Hour, MW 8,762 9,093 9,079 9,290 8,946 8,917 9,504 9,383
Net Installed Capacity, MW 13,279 13,410 13,479 13,543 14,423 14,420 14,361 14,559
- 23 - Any redistribution of this information is strictly prohibited.
Copyright © 2014 EMIS, all rights reserved.
Source:
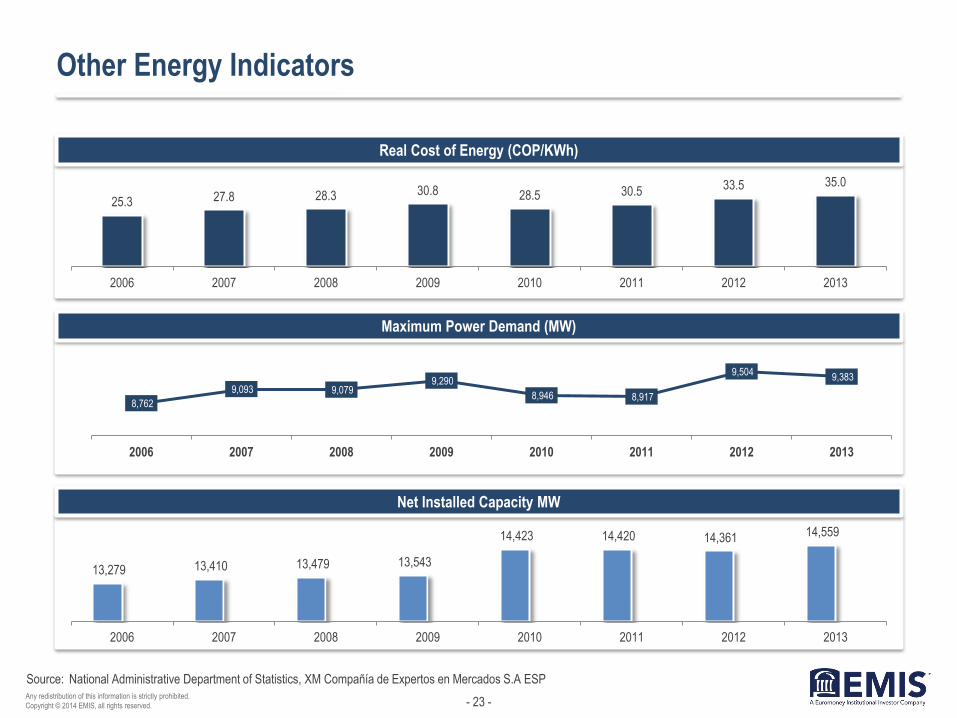
Other Energy Indicators
Real Cost of Energy (COP/KWh)
National Administrative Department of Statistics, XM Compañía de Expertos en Mercados S.A ESP
Maximum Power Demand (MW)
Net Installed Capacity MW
25.3 27.8 28.3 30.8 28.5 30.5 33.5 35.0
2006 2007 2008 2009 2010 2011 2012 2013
13,279 13,410 13,479 13,543
14,423 14,420 14,361 14,559
2006 2007 2008 2009 2010 2011 2012 2013
8,762
9,093 9,079 9,290
8,946 8,917
9,504 9,383
2006 2007 2008 2009 2010 2011 2012 2013

- 24 - Any redistribution of this information is strictly prohibited.
Copyright © 2014 EMIS, all rights reserved.
III. Power Generation by Type of Fuel

- 25 - Any redistribution of this information is strictly prohibited.
Copyright © 2014 EMIS, all rights reserved.
Source:
Comments
Fuels Consumption
Fuel consumption in Colombia rose by 42.4% in 2013, with a total consumption of 151,638.8 GBTU due to a 46% rise in thermal power
generation in 2013.
Fuel Consumption of the Thermal Power Generation Plants GBTU
UPME, National Administrative Department of Statistics
2011 2012 2013 Total Share 2013
Gas 71,359.4 75,576.4 98,224.6 64.8%
Coal 16,748.9 26,894.9 50,017.3 33.0%
Diesel 38.3 1,635.8 1,547.9 1.0%
Fuel Oil No. 6 1,589.0 2,326.0 1,757.8 1.2%
Jet fuel A1 0.0 78.8 91.1 0.1%
Total consumption 89,735.6 106,511.9 151,638.8 100.0%
- 26 - Any redistribution of this information is strictly prohibited.
Copyright © 2014 EMIS, all rights reserved.
Source:
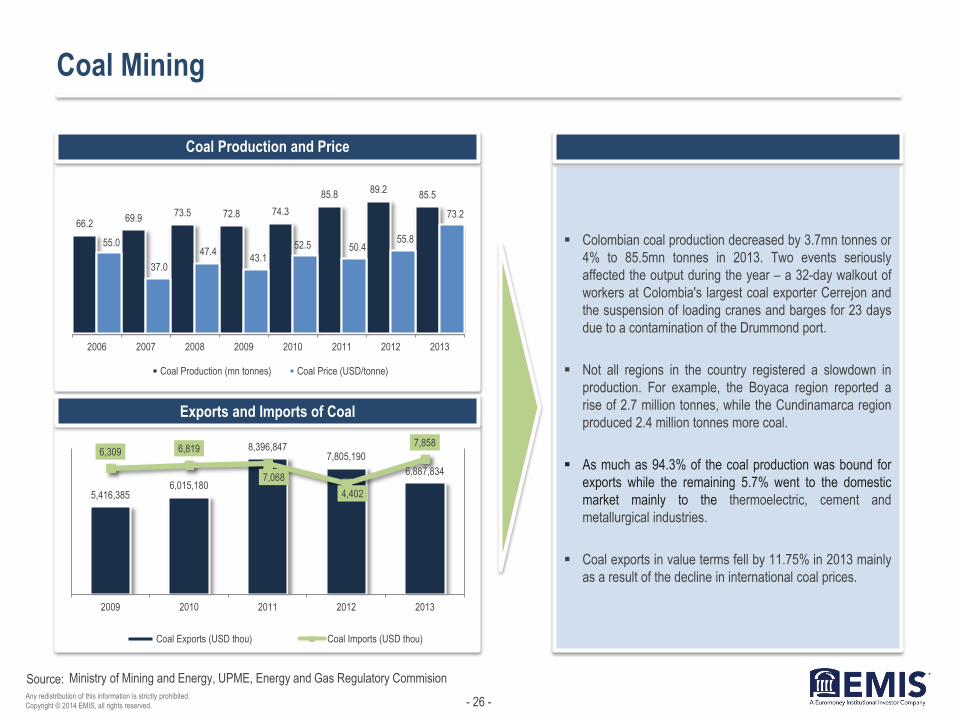
Coal Mining
Coal Production and Price
Colombian coal production decreased by 3.7mn tonnes or
4% to 85.5mn tonnes in 2013. Two events seriously
affected the output during the year – a 32-day walkout of
workers at Colombia's largest coal exporter Cerrejon and
the suspension of loading cranes and barges for 23 days
due to a contamination of the Drummond port.
Not all regions in the country registered a slowdown in
production. For example, the Boyaca region reported a
rise of 2.7 million tonnes, while the Cundinamarca region
produced 2.4 million tonnes more coal.
As much as 94.3% of the coal production was bound for
exports while the remaining 5.7% went to the domestic
market mainly to the thermoelectric, cement and
metallurgical industries.
Coal exports in value terms fell by 11.75% in 2013 mainly
as a result of the decline in international coal prices.
Exports and Imports of Coal
Ministry of Mining and Energy, UPME, Energy and Gas Regulatory Commision
66.2 69.9
73.5 72.8 74.3
85.8 89.2
85.5
55.0
37.0
47.4 43.1
52.5 50.4 55.8
73.2
2006 2007 2008 2009 2010 2011 2012 2013
Coal Production (mn tonnes) Coal Price (USD/tonne)
5,416,385 6,015,180
8,396,847 7,805,190
6,887,834
6,309 6,819
7,068
4,402
7,858
2009 2010 2011 2012 2013
Coal Exports (USD thou) Coal Imports (USD thou)
- 27 - Any redistribution of this information is strictly prohibited.
Copyright © 2014 EMIS, all rights reserved.
Source:
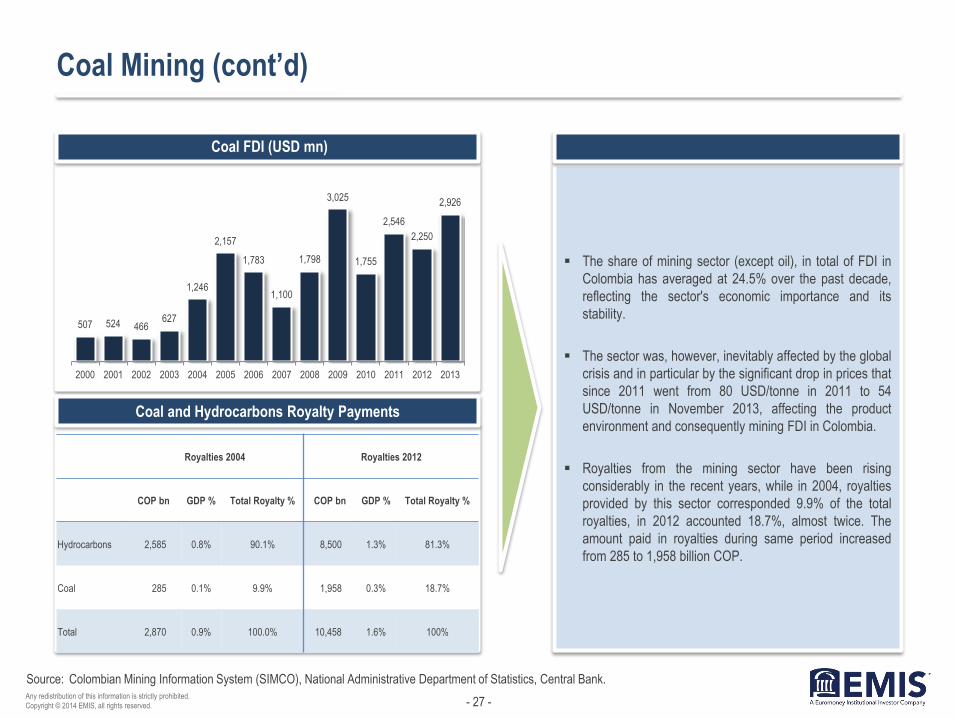
Coal Mining (cont’d)
Coal FDI (USD mn)
The share of mining sector (except oil), in total of FDI in
Colombia has averaged at 24.5% over the past decade,
reflecting the sector's economic importance and its
stability.
The sector was, however, inevitably affected by the global
crisis and in particular by the significant drop in prices that
since 2011 went from 80 USD/tonne in 2011 to 54
USD/tonne in November 2013, affecting the product
environment and consequently mining FDI in Colombia.
Royalties from the mining sector have been rising
considerably in the recent years, while in 2004, royalties
provided by this sector corresponded 9.9% of the total
royalties, in 2012 accounted 18.7%, almost twice. The
amount paid in royalties during same period increased
from 285 to 1,958 billion COP.
Coal and Hydrocarbons Royalty Payments
Colombian Mining Information System (SIMCO), National Administrative Department of Statistics, Central Bank.
507 524 466 627
1,246
2,157
1,783
1,100
1,798
3,025
1,755
2,546
2,250
2,926
2000 2001 2002 2003 2004 2005 2006 2007 2008 2009 2010 2011 2012 2013
Royalties 2004 Royalties 2012
COP bn GDP % Total Royalty % COP bn GDP % Total Royalty %
Hydrocarbons 2,585 0.8% 90.1% 8,500 1.3% 81.3%
Coal 285 0.1% 9.9% 1,958 0.3% 18.7%
Total 2,870 0.9% 100.0% 10,458 1.6% 100%

- 28 - Any redistribution of this information is strictly prohibited.
Copyright © 2014 EMIS, all rights reserved.
Source:
Gas Production
National Gas Production
In 2013, natural gas production in Colombia increased by
4.5%, with over 47% of the output coming from the La
Guajira region.
In December 2013, national demand increased by 3.4% to
1,038 GBTUD, compared with same month in 2012.
According to Colombia's energy ministry, the proved gas
reserves in the Andean nation reached 5,727 GPC in
2012, a figure that should secure gas supply for the
country by 2026.
In 2012, a total of 131 exploratory draw-wells were drilled.
Under a bilateral agreement, Colombia is expected to
start importing gas from Venezuela from the second half
of 2014.
National Production and Reserves
Ministry of Mining and Energy, National Association of Hydrocarbons
1,040 1,064
1,134
1,188 1,179
2010 2011 2012 2013 March 2014
Gas Production (GBTUD)
7,277
8,460
7,058 6,630
7,008
4,384 4,737 5,405 5,463 5,727
319 371 398 387 423
2008 2009 2010 2011 2012
Resereves (GPC) Proved Reserves (GPC) Production (GPC)
- 29 - Any redistribution of this information is strictly prohibited.
Copyright © 2014 EMIS, all rights reserved.
Comments
Source:
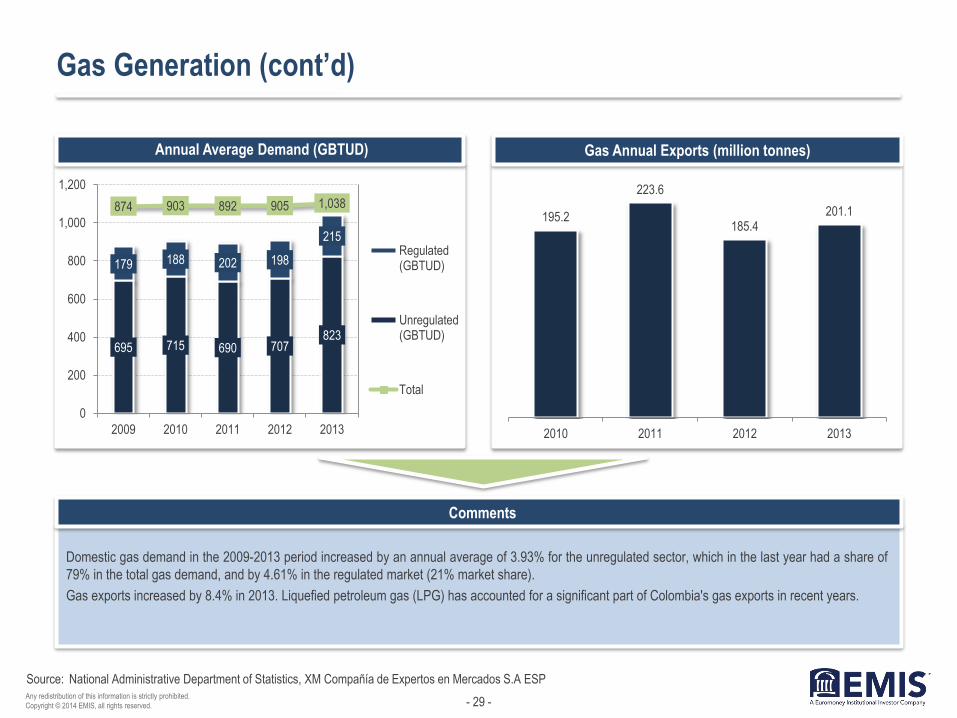
Gas Generation (cont’d)
Domestic gas demand in the 2009-2013 period increased by an annual average of 3.93% for the unregulated sector, which in the last year had a share of
79% in the total gas demand, and by 4.61% in the regulated market (21% market share).
Gas exports increased by 8.4% in 2013. Liquefied petroleum gas (LPG) has accounted for a significant part of Colombia's gas exports in recent years.
Annual Average Demand (GBTUD) Gas Annual Exports (million tonnes)
National Administrative Department of Statistics, XM Compañía de Expertos en Mercados S.A ESP
695 715 690 707 823
179 188 202 198
215
874 903 892 905 1,038
0
200
400
600
800
1,000
1,200
2009 2010 2011 2012 2013
Regulated(GBTUD)
Unregulated(GBTUD)
Total
195.2
223.6
185.4 201.1
2010 2011 2012 2013
- 30 - Any redistribution of this information is strictly prohibited.
Copyright © 2014 EMIS, all rights reserved.
Source:
Comments
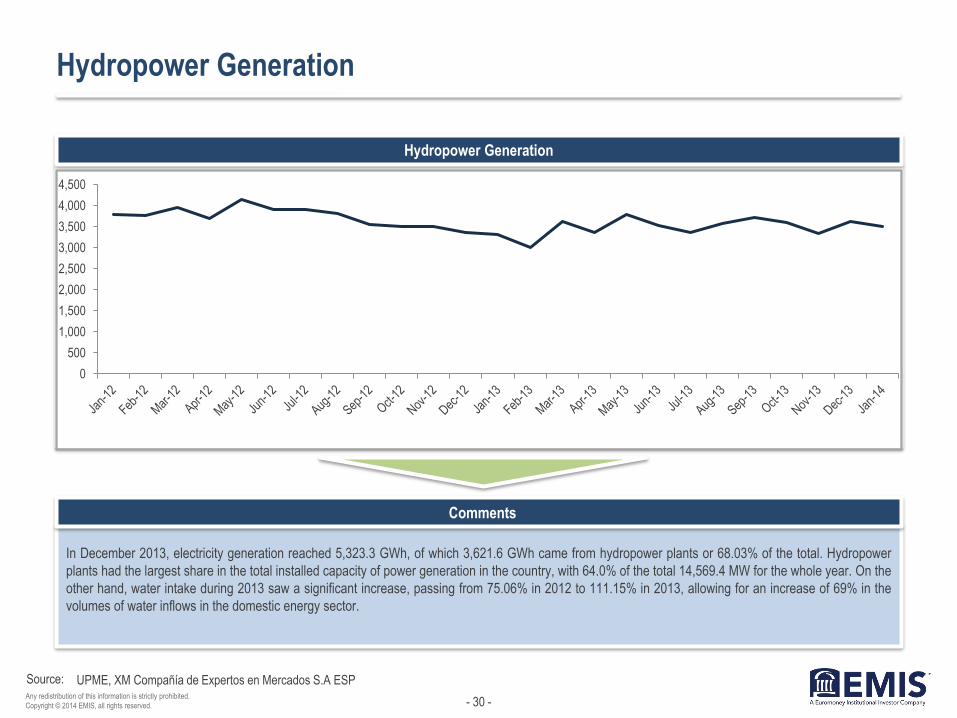
Hydropower Generation
In December 2013, electricity generation reached 5,323.3 GWh, of which 3,621.6 GWh came from hydropower plants or 68.03% of the total. Hydropower
plants had the largest share in the total installed capacity of power generation in the country, with 64.0% of the total 14,569.4 MW for the whole year. On the
other hand, water intake during 2013 saw a significant increase, passing from 75.06% in 2012 to 111.15% in 2013, allowing for an increase of 69% in the
volumes of water inflows in the domestic energy sector.
Hydropower Generation
UPME, XM Compañía de Expertos en Mercados S.A ESP
0
500
1,000
1,500
2,000
2,500
3,000
3,500
4,000
4,500
- 31 - Any redistribution of this information is strictly prohibited.
Copyright © 2014 EMIS, all rights reserved.
Source:
Comments
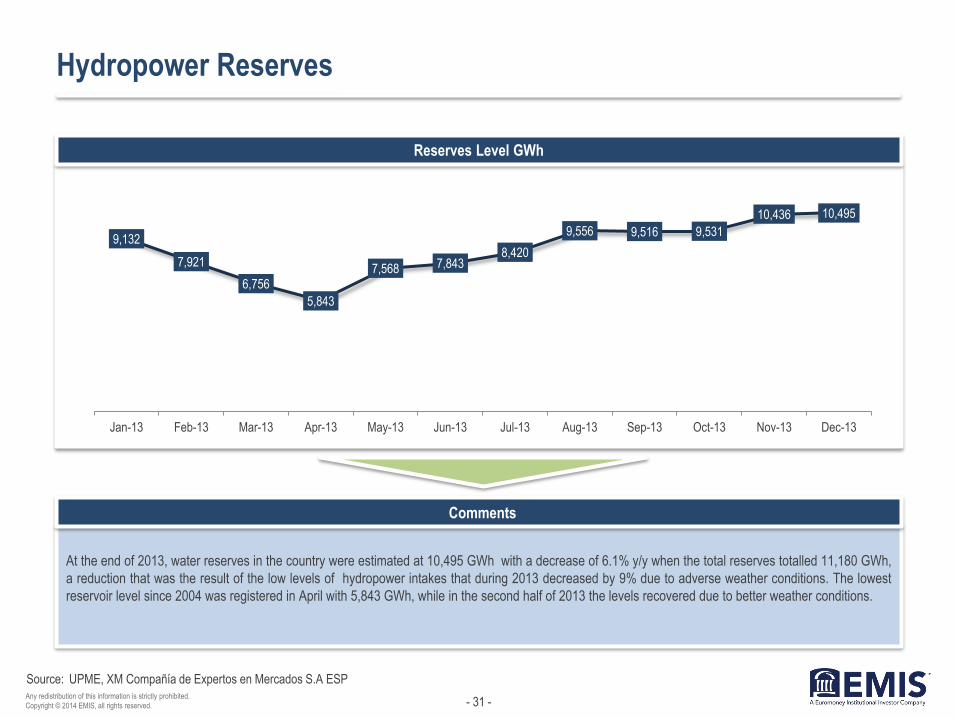
Hydropower Reserves
At the end of 2013, water reserves in the country were estimated at 10,495 GWh with a decrease of 6.1% y/y when the total reserves totalled 11,180 GWh,
a reduction that was the result of the low levels of hydropower intakes that during 2013 decreased by 9% due to adverse weather conditions. The lowest
reservoir level since 2004 was registered in April with 5,843 GWh, while in the second half of 2013 the levels recovered due to better weather conditions.
Reserves Level GWh
UPME, XM Compañía de Expertos en Mercados S.A ESP
9,132
7,921
6,756
5,843
7,568 7,843 8,420
9,556 9,516 9,531
10,436 10,495
Jan-13 Feb-13 Mar-13 Apr-13 May-13 Jun-13 Jul-13 Aug-13 Sep-13 Oct-13 Nov-13 Dec-13

- 32 - Any redistribution of this information is strictly prohibited.
Copyright © 2014 EMIS, all rights reserved.
Source:
Renewable Energy
Colombian Renewable Energy Basket, April 2014
As of April 2014, the net energy installed capacity in the
country stood at 14,665.05 MW, out of which renewable
energy accounted for 725.29 MW or 4.94%.
Small hydropower plants accounted for 77.3% of the
capacity, followed by small thermal plants (11.5%) and
bagasse cogenerators (2.1%).
The northern part of Colombia has the best potential to
generate wind energy where Empresas Publicas de
Medellin (EPM) has put the first wind farm into operation,
with 15 turbines, providing 19.5 MW.
According to the Colombian government, based on recent
biomass production studies, 1.5 million tonnes of
sugarcane, and 450,000 tonnes of rice a year can be
utilised for biofuel.
Net Energy Capacity including Renewable Sources (MW)
Ministry of Foreign Affairs, UPME, XM Compañía de Expertos en Mercados S.A ESP
Small Hydropower
77.3%
Small Thermal 11.5%
Bagasse Cogenerator
9.1%
Wind Power 2.1%
Type Effective Capacity
Hydropower 9,415
Thermal 4,521
Cogeneration Bagasse 66.30
Wind Power 18.42
Small Hydropower 560.98
Small Thermal 83.35
Total Net Effective Capacity 14,665.05

- 33 - Any redistribution of this information is strictly prohibited.
Copyright © 2014 EMIS, all rights reserved.
Source:
Small Power Plants
Net Capacity Small Power Plants as of April 30 , 2014
UPME
Power Plants Capacity / Effective MW Type State
Celsia S.A. E.S.P 39.80 Hydropower Antioquia
Central Hidroelectrica de Caldas S.A. E.S.P 24.22 Hydropower Caldas
Central Termoelectrica El Morro 2 S.A.S. E.S.P. 59.70 Thermal Casanare
Centrales Electricas de Nariño S.A. E.S.P. 27.13 Hydropower Nariño
Compañia de Electricidad de Tulua S.A. E.S.P. 14.19 Hydropower Valle del Cauca
Diceler S.A. E.S.P. 1.25 Hydropower Tolima
Electrificadora de Santander S.A. E.S.P. 18.0 Hydropower Santander
Electrificadora del Huila S.A. E.S.P. 11.14 Hydropower Huila
Emgesa S.A. E.S.P. 75.09 Hydropower Cundinamarca
Empresa de Energia de Cundinamarca S.A. E.S.P. 9.60 Hydropower Cundinamarca
Empresa de Energia de Pereira S.A. E.S.P. 8.50 Hydropower Risaralda
Empresa de Energia del Pacifico S.A. E.S.P. 53.30 Hydropower Valle del Cauca
Empresa Multiproposito de Calarca S.A. E.S.P. 2.0 Hydropower Quindio
Empresa Municipal de Energia Electrica S.A. E.S.P. 4.50 Hydropower Cauca
Empresas Publicas de Medellin E.S.P. 132.04 Hydropower Antioquia
Empresas Publicas de Medellin E.S.P. 18.42 Wind Power Antioquia
Enerco S.A. E.S.P. 2.30 Hydropower Antioquia
Energia del Rio Piedras S.A. E.S.P 7.29 Hydropower Antioquia
Energia Renovable de ColombiaS.A. E.S.P. 2.28 Hydropower Quindio
Enervia S.A. E.S.P. 4.03 Hydropower Antioquia
Generadora Colombiana de Electricidad S.A. E.S.P. 0.38 Hydropower Caldas
Generamos Energia S.A. E.S.P. 0.75 Hydropower Antioquia
Generputumayo S.A.S. E.S.P. 0.47 Hydropower Putumayo
Grupo Gelec S.A.S. E.S.P. 1.48 Hydropower Cauca
Isagen S.A. E.S.P. 19.90 Hydropower Antioquia
La Cascada S.A.S. E.S.P. 61.10 Hydropower Antioquia
Termopiedras S.A. E.S.P. 3.75 Thermal Tolima
Termoyopal Generacion 2 S.A.S E.S.P. 19.90 Thermal Casanare
Vatia S.A. E.S.P. 40.24 Hydropower Cauca
Total Small Power Plants 662.75

- 34 - Any redistribution of this information is strictly prohibited.
Copyright © 2014 EMIS, all rights reserved.
.
…
Source:
Power Generation SWOT Analysis
• Main players such us Ecopetrol EPM and ISA which have
achieved high levels of regional presence, diversifying the
export market and generating new business in the power
sector.
• Building of new energy networks, development of
infrastructure projects and high international presence via
national power transmission network.
• Low share of renewable energy.
• Attacks on the country's electricity infrastructure by guerrillas,
which both jeopardises energy supplies and drives away
potential foreign investors.
• Dissatisfied labour force, which leads to frequent stoppages
and security issues.
• Unfavourable weather conditions.
• Lack of security in regions far from urban centres.
Carrying out the expansion plan of power transmission networks
for the next 15 years, developed by the Ministry of Mines and
Energy and Mining Energy Planning Unit.
The plan features 16 projects worth USD 1.680mn, which would
result in building 3,000 km of power grids.
Power Sector
SWOT Analysis
Strengths Opportunities
Weaknesses Threats

- 35 - Any redistribution of this information is strictly prohibited.
Copyright © 2014 EMIS, all rights reserved.
Source:
Power Transmission and Distribution
Power Transmission Net Income (COPmm)
Power Transmission Losses
UPME
103
,628
102
,873
103
,931
102
,832
105
,253
104
,846
103
,892
103
,989
104
,644
105
,161
104
,979
103
,893
103
,325
102
,699
103
,744
104
,005
105
,330
105
,939
107
,259
107
,557
107
,273
107
,050
106
,378
106
,986
1.6% 1.8% 1.9% 2.0%
1.5% 1.7% 1.7% 1.8%
2005 2006 2007 2008 2009 2010 2011 2012
- 36 - Any redistribution of this information is strictly prohibited.
Copyright © 2014 EMIS, all rights reserved.
Source:
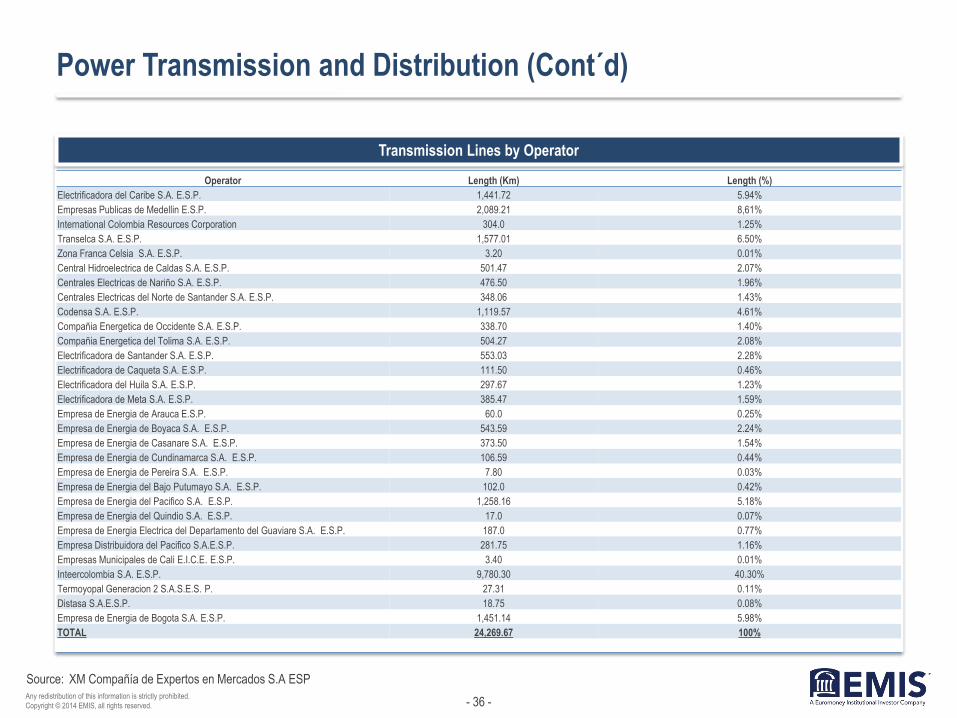
Power Transmission and Distribution (Cont´d)
Transmission Lines by Operator
XM Compañía de Expertos en Mercados S.A ESP
Operator Length (Km) Length (%)
Electrificadora del Caribe S.A. E.S.P. 1,441.72 5.94%
Empresas Publicas de Medellin E.S.P. 2,089.21 8,61%
International Colombia Resources Corporation 304.0 1.25%
Transelca S.A. E.S.P. 1,577.01 6.50%
Zona Franca Celsia S.A. E.S.P. 3.20 0.01%
Central Hidroelectrica de Caldas S.A. E.S.P. 501.47 2.07%
Centrales Electricas de Nariño S.A. E.S.P. 476.50 1.96%
Centrales Electricas del Norte de Santander S.A. E.S.P. 348.06 1.43%
Codensa S.A. E.S.P. 1,119.57 4.61%
Compañia Energetica de Occidente S.A. E.S.P. 338.70 1.40%
Compañia Energetica del Tolima S.A. E.S.P. 504.27 2.08%
Electrificadora de Santander S.A. E.S.P. 553.03 2.28%
Electrificadora de Caqueta S.A. E.S.P. 111.50 0.46%
Electrificadora del Huila S.A. E.S.P. 297.67 1.23%
Electrificadora de Meta S.A. E.S.P. 385.47 1.59%
Empresa de Energia de Arauca E.S.P. 60.0 0.25%
Empresa de Energia de Boyaca S.A. E.S.P. 543.59 2.24%
Empresa de Energia de Casanare S.A. E.S.P. 373.50 1.54%
Empresa de Energia de Cundinamarca S.A. E.S.P. 106.59 0.44%
Empresa de Energia de Pereira S.A. E.S.P. 7.80 0.03%
Empresa de Energia del Bajo Putumayo S.A. E.S.P. 102.0 0.42%
Empresa de Energia del Pacifico S.A. E.S.P. 1,258.16 5.18%
Empresa de Energia del Quindio S.A. E.S.P. 17.0 0.07%
Empresa de Energia Electrica del Departamento del Guaviare S.A. E.S.P. 187.0 0.77%
Empresa Distribuidora del Pacifico S.A.E.S.P. 281.75 1.16%
Empresas Municipales de Cali E.I.C.E. E.S.P. 3.40 0.01%
Inteercolombia S.A. E.S.P. 9,780.30 40.30%
Termoyopal Generacion 2 S.A.S.E.S. P. 27.31 0.11%
Distasa S.A.E.S.P. 18.75 0.08%
Empresa de Energia de Bogota S.A. E.S.P. 1,451.14 5.98%
TOTAL 24,269.67 100%

- 37 - Any redistribution of this information is strictly prohibited.
Copyright © 2014 EMIS, all rights reserved.
IV. Power Exports

- 38 - Any redistribution of this information is strictly prohibited.
Copyright © 2014 EMIS, all rights reserved.
Source:
Comments
Energy Exports
Electricity Exports to Ecuador and Venezuela (GWh)
UPME, XM Compañía de Expertos en Mercados S.A ESP
The total energy exports reached 149 GWh in December 2013. Exports to Ecuador in December 2013 grew by 1,317% compared to same month in 2012
due to adverse weather conditions in Ecuador that decreased its domestic power generation capacity.
43
5 5 - 1
53 59 52 72
111
203 193
180
126
257
103
70 59
46 67
119
155
223
137
34 32 40 54 52 56 63 61
124
63 81
53 68
168 155
133
225
108 124
66 49
58 73
149
jan-
10
Feb
-10
Mar
-10
apr-
10
May
-10
Jun-
10
Jul-1
0
aug-
10
Sep
-10
Oct
-10
Nov
-10
dec-
10
jan
-11
Feb
-11
Mar
-11
apr-
11
May
-11
Jun-
11
Jul-1
1
aug-
11
Sep
-11
Oct
-11
Nov
-11
dec-
11
jan
-12
Feb
-12
Mar
-12
apr-
12
May
-12
Jun-
12
Jul-1
0
aug-
12
Sep
-12
Oct
-12
Nov
-12
dec-
12
jan
-13
Feb
-13
Mar
-13
apr-
13
May
-13
Jun-
13
Jul-1
3
aug-
13
Sep
-13
Oct
-13
Nov
-13
dec-
13D
ec-1
3

- 39 - Any redistribution of this information is strictly prohibited.
Copyright © 2014 EMIS, all rights reserved.
Source:
Comments
Power Trade with Ecuador
Colombia and Ecuador Power Trade (MWh)
XM Compañía de Expertos en Mercados S.A ESP
Since 2002, Colombia has exported 11,645,891.5 MWh of electricity to Ecuador worth a total of USD 973mn. In 2013, Colombian exports to Ecuador
reached 662,343.7 MWh, up by 236,034.5 MWh compared to the previous year.
Energy Exports (MWh) Energy Imports (MWh) Exports (USD thou) Imports (USD thou)
2013 662,343.7 28,502.4 78,442.1 1,682.5
2012 236,034.5 6,510.2 24,148.3 243.2
2011 1,294,591.8 8,218.5 92,995.8 231,3
2010 797,690.0 9,745.0 73,825.1 565.3
2009 1,076,725.6 20,764.1 107,751.0 1,118.5
2008 509,782.2 37,533.3 35,908.4 2,309.4
2007 876,602.3 38,392.6 66,269.4 1,336.0
2006 1,608,628.9 1,070.4 127,104.5 50.0
2005 1,757,882.9 16,028.8 151,733.7 509.8
2004 1,681,088,1 34,974.3 135,109.1 738.0
2003 1,144,521.6 67,202.7 80,309.2 2,334.7
Total 11,645,891.5 268,942.2 973,596.7 11,118.7

- 40 - Any redistribution of this information is strictly prohibited.
Copyright © 2014 EMIS, all rights reserved.
Source:
Comments
Power Exchange and Trading
Wholesale Market Prices (COP/KWh)
UPME, XM Compañía de Expertos en Mercados S.A ESP
In February 2014, energy stock prices stood at an average of 189.38 COP/KWh, higher by 4.71 COP/KWh compared to February 2012.
0
100
200
300
400
500
600
National Exchange Price COP/KWh Average Contracts Price COPKWh Scarcity Price (COP)

- 41 - Any redistribution of this information is strictly prohibited.
Copyright © 2014 EMIS, all rights reserved.
Source:
Power Exchange and Trading (cont'd)
Market Sales by Type (COPmn)
Total Exchange Purchases (COPmn)
UPME
0
2,000,000
4,000,000
6,000,000
8,000,000
10,000,000
National Exchange Sales COP mn Contract Sales COP mn
0
50,000
100,000
150,000
200,000
250,000
300,000
350,000
400,000
- 42 - Any redistribution of this information is strictly prohibited.
Copyright © 2014 EMIS, all rights reserved.
V. Natural Gas Distribution
- 43 - Any redistribution of this information is strictly prohibited.
Copyright © 2014 EMIS, all rights reserved.
Source:
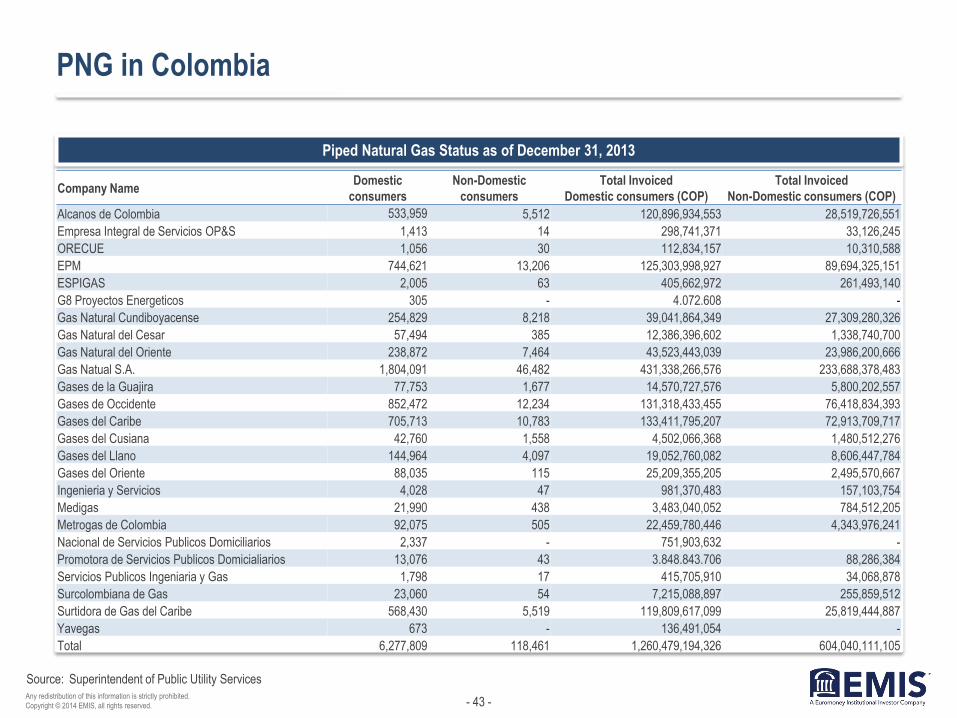
PNG in Colombia
Piped Natural Gas Status as of December 31, 2013
Superintendent of Public Utility Services
Company Name Domestic
consumers
Non-Domestic
consumers
Total Invoiced
Domestic consumers (COP)
Total Invoiced
Non-Domestic consumers (COP)
Alcanos de Colombia 533,959 5,512 120,896,934,553 28,519,726,551
Empresa Integral de Servicios OP&S 1,413 14 298,741,371 33,126,245
ORECUE 1,056 30 112,834,157 10,310,588
EPM 744,621 13,206 125,303,998,927 89,694,325,151
ESPIGAS 2,005 63 405,662,972 261,493,140
G8 Proyectos Energeticos 305 - 4.072.608 -
Gas Natural Cundiboyacense 254,829 8,218 39,041,864,349 27,309,280,326
Gas Natural del Cesar 57,494 385 12,386,396,602 1,338,740,700
Gas Natural del Oriente 238,872 7,464 43,523,443,039 23,986,200,666
Gas Natual S.A. 1,804,091 46,482 431,338,266,576 233,688,378,483
Gases de la Guajira 77,753 1,677 14,570,727,576 5,800,202,557
Gases de Occidente 852,472 12,234 131,318,433,455 76,418,834,393
Gases del Caribe 705,713 10,783 133,411,795,207 72,913,709,717
Gases del Cusiana 42,760 1,558 4,502,066,368 1,480,512,276
Gases del Llano 144,964 4,097 19,052,760,082 8,606,447,784
Gases del Oriente 88,035 115 25,209,355,205 2,495,570,667
Ingenieria y Servicios 4,028 47 981,370,483 157,103,754
Medigas 21,990 438 3,483,040,052 784,512,205
Metrogas de Colombia 92,075 505 22,459,780,446 4,343,976,241
Nacional de Servicios Publicos Domiciliarios 2,337 - 751,903,632 -
Promotora de Servicios Publicos Domicialiarios 13,076 43 3.848.843.706 88,286,384
Servicios Publicos Ingeniaria y Gas 1,798 17 415,705,910 34,068,878
Surcolombiana de Gas 23,060 54 7,215,088,897 255,859,512
Surtidora de Gas del Caribe 568,430 5,519 119,809,617,099 25,819,444,887
Yavegas 673 - 136,491,054 -
Total 6,277,809 118,461 1,260,479,194,326 604,040,111,105

- 44 - Any redistribution of this information is strictly prohibited.
Copyright © 2014 EMIS, all rights reserved.
Source:
Natural Gas Coverage
Natural Gas Consumption by Electric Generation Plant (GBTUD)
Number of Regions Covered by User Type
Concentra Information System
Year Termosierra Termocentro Termovalle Merilectrica Termoemcali Termodorada
2009 19.6 12.7 7.8 2.4 0.4 0.9
2010 21.8 12.7 8.2 0.7 0.1 0.5
2011 1.7 7.9 n/a 2.9 0.3 0.3
2012 14.0 9.4 2.9 3.5 0.6 0.5
2013 7.9 29.3 5.7 5.3 4.3 n/a
Year Domestic Commercial Industrial Total
2009 383 354 141 878
2010 401 365 142 908
2011 434 398 158 990
2012 481 435 163 1,079
2013 501 459 165 1,125
- 45 - Any redistribution of this information is strictly prohibited.
Copyright © 2014 EMIS, all rights reserved.
Source:
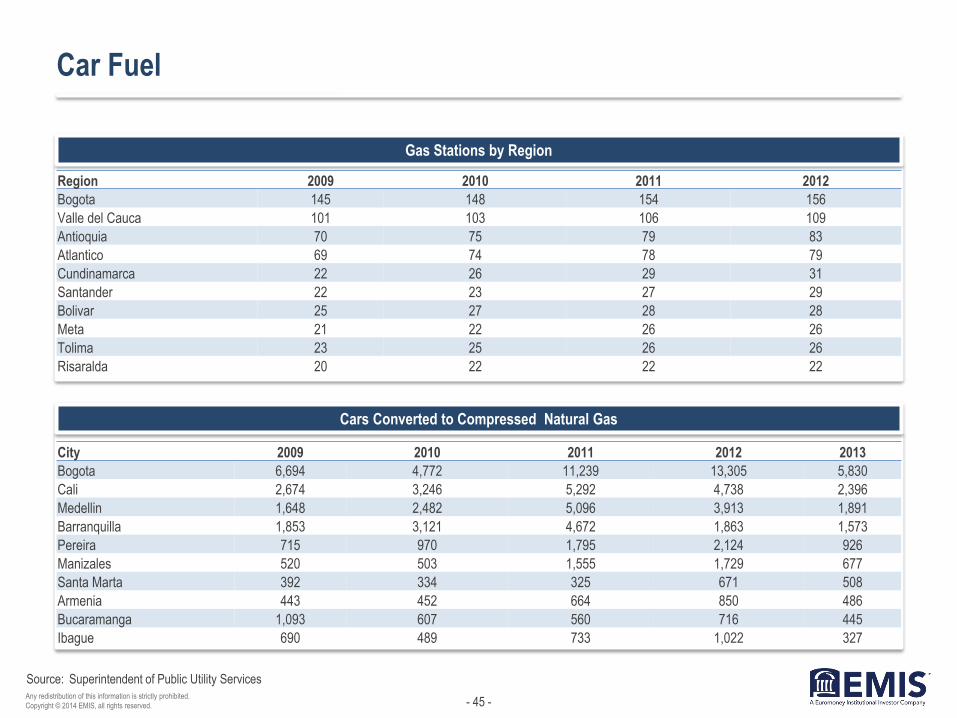
Car Fuel
Gas Stations by Region
Cars Converted to Compressed Natural Gas
Superintendent of Public Utility Services
Region 2009 2010 2011 2012
Bogota 145 148 154 156
Valle del Cauca 101 103 106 109
Antioquia 70 75 79 83
Atlantico 69 74 78 79
Cundinamarca 22 26 29 31
Santander 22 23 27 29
Bolivar 25 27 28 28
Meta 21 22 26 26
Tolima 23 25 26 26
Risaralda 20 22 22 22
City 2009 2010 2011 2012 2013
Bogota 6,694 4,772 11,239 13,305 5,830
Cali 2,674 3,246 5,292 4,738 2,396
Medellin 1,648 2,482 5,096 3,913 1,891
Barranquilla 1,853 3,121 4,672 1,863 1,573
Pereira 715 970 1,795 2,124 926
Manizales 520 503 1,555 1,729 677
Santa Marta 392 334 325 671 508
Armenia 443 452 664 850 486
Bucaramanga 1,093 607 560 716 445
Ibague 690 489 733 1,022 327

- 46 - Any redistribution of this information is strictly prohibited.
Copyright © 2014 EMIS, all rights reserved.
VI. Main Players

- 47 - Any redistribution of this information is strictly prohibited.
Copyright © 2014 EMIS, all rights reserved.
Source:
Ecopetrol S.A.
Financial Indicators (USD mn)
Ecopetrol S.A. is the largest petroleum company in
Colombia. The company is also among the 35
largest petroleum companies in the world and among
the top four petroleum companies in Latin America.
Ecopetrol extracts petroleum, hydrocarbons and
natural gas and accounts for over 60% of the
national oil production. The company was founded in
1948. Ecopetrol is publicly traded and controlled by
the Ministry of Mines and Energy.
In 2013, Ecopetrol S.A. made investments for USD
4.5 million primarily aimed at drilling activities,
especially in the Rubiales and Quifa fields, and
facilities construction, primarily in the Castilla and
Chichimene fields that comprised a total of 22 wells
explored in the year. The company’s investments
also included contributions to Reficar modernization
project, Barrancabermeja refinery and Bioenergy.
For 2014, Ecopetrol expects a Capex of USD 10.6bn
distributed as follows: USD 5.1bn for production,
USD 1.8bn for exploration, USD 2.1bn for refining
and USD 1.4bn for transportation.
Company data
18,785
27,904
32,990 31,734
4,361
7,952 8,468
6,930
2010Y 2011Y 2012Y 2013Y
Total Operating Revenue Net Profit (Loss)

- 48 - Any redistribution of this information is strictly prohibited.
Copyright © 2014 EMIS, all rights reserved.
Source:
Ecopetrol S.A. (cont’d)
Return on Assets and Equity (%)
Ecopetrol in Figures
Capex Breakdown (USD9.5 billion for 2013)
Company data
10.76
24.15
9.90 12.82
18.12 14.88
11.71
19.31
33.59
16.07 20.10
28.08
22.94
18.60
2007 2008 2009 2010 2011 2012 2013
ROA ROE
Production 44%
Exploration 18%
Refining 18%
Transport 19%
Other 1%
Type Indicator 2009 2010 2011 2012 2013
EXPORTS Volume (Kbdc) 302 370 493 521 540
Value (USDmn) 5,825 11,420 16,062 19,127 18,879
PRODUCTION Oil and Gas Ecopetrol Property (Kbpde) 520 616 724 754 788
Total Oil (Kbpd) 426 482 569 591 612
FUELS Gas Sales (Bpd) 68,990 72,940 74,500 76,974 80,401
Diesel Sales (Bpd) 99,730 100,580 109,000 110,746 114,406
TRANSPORT Volumes of Oil Transported (Kbdc) 576,2 770,9 916,2 917,5 950,3
Refined Volumes Transported (Kbdc) 223,3 264,9 289,0 234,0 237,0
RESERVES Oil and Gas (Mbpe) 1,538 1,714 1,857 1,877 1,972
Replacement Index (%) 351% 193% 164% 109% 139%
- 49 - Any redistribution of this information is strictly prohibited.
Copyright © 2014 EMIS, all rights reserved.
Source:
Interconexión Eléctrica S.A.
Financial Indicators (USD mn)
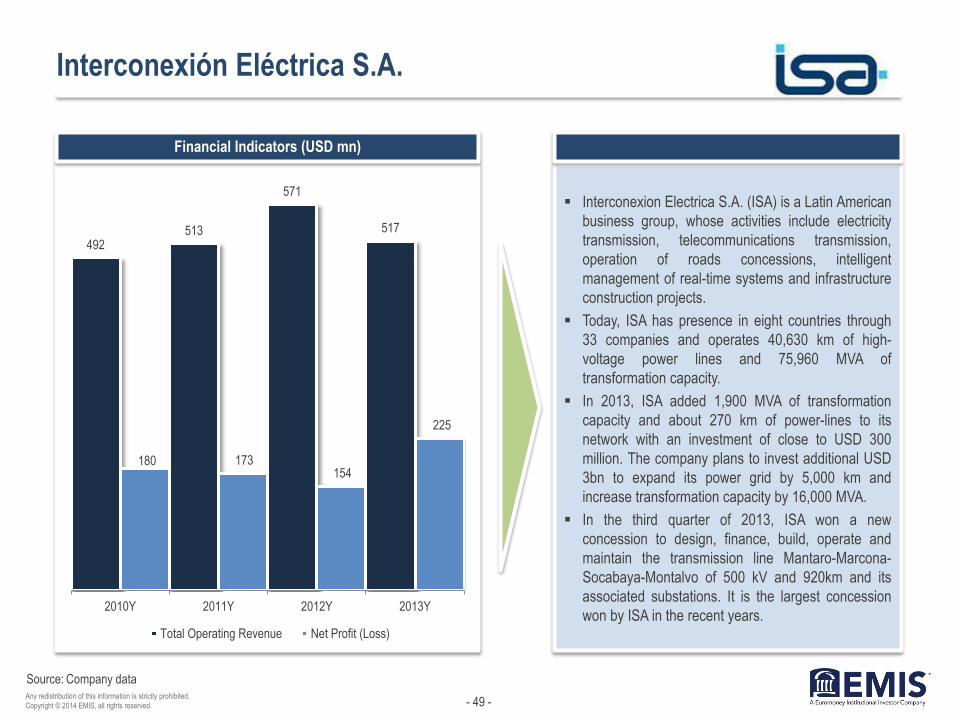
Interconexion Electrica S.A. (ISA) is a Latin American
business group, whose activities include electricity
transmission, telecommunications transmission,
operation of roads concessions, intelligent
management of real-time systems and infrastructure
construction projects.
Today, ISA has presence in eight countries through
33 companies and operates 40,630 km of high-
voltage power lines and 75,960 MVA of
transformation capacity.
In 2013, ISA added 1,900 MVA of transformation
capacity and about 270 km of power-lines to its
network with an investment of close to USD 300
million. The company plans to invest additional USD
3bn to expand its power grid by 5,000 km and
increase transformation capacity by 16,000 MVA.
In the third quarter of 2013, ISA won a new
concession to design, finance, build, operate and
maintain the transmission line Mantaro-Marcona-
Socabaya-Montalvo of 500 kV and 920km and its
associated substations. It is the largest concession
won by ISA in the recent years.
Company data
492 513
571
517
180 173 154
225
2010Y 2011Y 2012Y 2013Y
Total Operating Revenue Net Profit (Loss)

- 50 - Any redistribution of this information is strictly prohibited.
Copyright © 2014 EMIS, all rights reserved.
Source:
Interconexión Eléctrica S.A. (cont’d)
Return on Assets and Equity (%)
Colombian Shareholding
Electric Energy Business Unit Evolution (USD mn)
Electric Infrastructure
Company data
3.56 3.23
3.70 3.81 3.59 3.06
4.22
5.90
4.92 5.15 5.34 5.27
4.46
5.81
2007 2008 2009 2010 2011 2012 2013
ROA ROE
1,803 1,896
1,390 1,322
1,354
726
2011 2012 2013
Income EBITDA
The State 51.4%
Private Investors
31.4%
EPM 10.2%
Ecopetrol 5.3%
EEB 1.7%
Country Company
Operational
Circuit Km Transformation MVA
COLOMBIA ISA
10,144 13,040
TRANSELCA 1,585 3,848
PERU
REP 6,230 2,605
Transmantaro 2,465 4,325
ISA Peru 393 235
BOLIVIA ISA Bolivia
588 370
BRAZIL
CTEEP 18,893 45,587
IEMG 172 3,900
PINHEIROS 6 1,600
EVRECY 154 450
TOTAL
40,630 75,960

- 51 - Any redistribution of this information is strictly prohibited.
Copyright © 2014 EMIS, all rights reserved.
Source:
Codensa S.A. E.S.P
Financial Indicators (USD mn)
Codensa S.A. E.S.P. activities include distribution
and sales of electric energy and other utility-related
activities. The company was established in October
1997 as a joint venture of Empresa de Energia de
Bogota (EEB) and Grupo Endesa.
Codensa is the main electricity distributor in the city
of Bogota. The company is currently managed by
Grupo Endesa, as part of the agreement signed
between this international group and the EEB in the
late nineties.
Codensa has expressed interest in participating in
the privatization of electric companies across
Colombia and has created a unit, Inversora Codensa
S.A.S., for this purpose.
In 2013, Codensa approved an investment budget of
USD 110.5mn aimed at covering local power
demand. Based on this investment budget, Codensa
is working on two new projects Nueva Esperanza
Substation with a high-voltage circuit of 459 MVA and
North Substation of 300 MVA, both in Bogota.
Company data
374 407
1,777
1,667
69
289 278
2010Y 2011Y 2012Y 2013Y
Total Operating Revenue Net Profit (Loss)

- 52 - Any redistribution of this information is strictly prohibited.
Copyright © 2014 EMIS, all rights reserved.
Source:
Codensa S.A. E.S.P (cont’d)
Return on Assets and Equity (%)
Power Purchases
Ownership Structure (%)
Company data
7.6 9.2 9.0 9.0 9.5 9.7
14.1 16.1
17.0 17.0 16.4 17.0
2008 2009 2010 2011 2012 2013
ROA ROE
Empresa de Energia de Bogota S.A.
51.5%
Enersis S.A. 39.1%
Chilectra S.A. 9.4%
Others 0,03%
Type GWh COP mn
Regulated Market 8,769 1,244,044
Contracts 7,995 1,102,035
EMGESA 4,131 573,205
Other Suppliers 3,854 528,830
Stock Market Purchases 773 142,009
Non-Regulated Market 240 33,358
Contracts 221 29,433
EMGESA 105 14,193
Other Suppliers 116 15,241
Stock Market Purchases 19 3,924
Purchases 9,008.29 1,277,402
Stock Market Sales 22.62 3,668
Total Energy Purchases 8,985.67 1,273,734

- 53 - Any redistribution of this information is strictly prohibited.
Copyright © 2014 EMIS, all rights reserved.
Source:
Empresas Publicas de Medellin E.S.P
Financial Indicators (USD mn)
Empresas Publicas de Medellin E.S.P (EPM)
provides water and sewage services, power and gas
fuel distribution, fixed and mobile telephony and
other telecommunications services. EPM group is
comprised of 45 companies, including 20 in
Colombia and 25 in Central America and Caribbean,
South America, the USA and Spain.
In December 2013, EPM approved and investment
program of COP 10.1bn, COP 2.5bn were allocated
to improving infrastructure and COP 1bn would be
transferred to the Municipio de Medellin for public
works investments. The remaining investment
resources would be allocated to different business
projects, including capitalization, production, sales
and others.
In 2013, EPM expanded its international coverage by
creating a new unit in Chile, EPM Chile S.A., and the
acquisition of Tecnologia Intercontinental S.A. de
C.V. through EPM’s Mexican subsidiary EPM Capital
Mexico S.A. de C.V.
Company data
2,351
2,529
3,070
2,847
762 786
992 858
2010Y 2011Y 2012Y 2013Y
Total Operating Revenue Net Profit (Loss)

- 54 - Any redistribution of this information is strictly prohibited.
Copyright © 2014 EMIS, all rights reserved.
Source:
Empresas Publicas de Medellin E.S.P (cont’d)
Return on Assets and Equity (%)
EBITDA Breakdown (%)
EBITDA (USD mn)
EPM Ratios
Company data
7.16 7.22 7.19
5.55 5.33 5.87
5.19
9.01 8.96 9.59
7.90 7.64 8.25
7.43
2007 2008 2009 2010 2011 2012 2013
ROA ROE
677 888
1,262 1,463
1,976 2,119
2,029
2007 2008 2009 2010 2011 2012 2013
Energy 74%
Hodropower 9%
Telecom 17%
TYPE EPM Group 2012 EPM Group 2013
EBITDA Margin 30% 29%
Net Margin 13% 13%
Net Debt 37% 40%
Financial Debt 22% 24%
EBITDA / Financial Expenses 6.52 6.91
Financial Debt / EBITDA 2.02 2.43
- 55 - Any redistribution of this information is strictly prohibited.
Copyright © 2014 EMIS, all rights reserved.
Source:
Emgesa S.A. E.S.P.
Financial Indicators (USD mn)
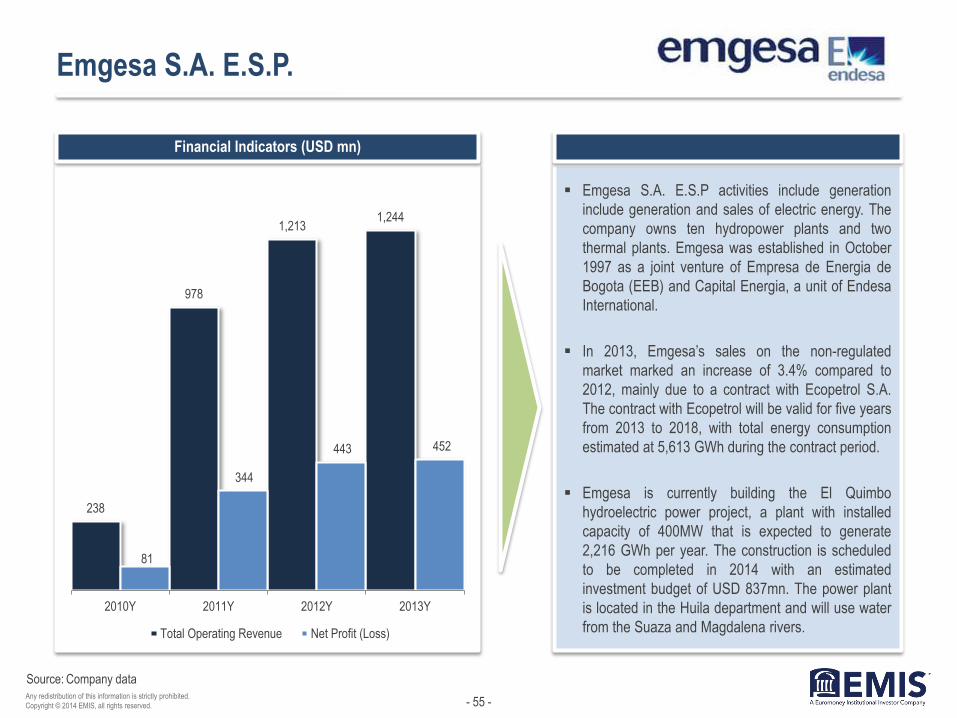
Emgesa S.A. E.S.P activities include generation
include generation and sales of electric energy. The
company owns ten hydropower plants and two
thermal plants. Emgesa was established in October
1997 as a joint venture of Empresa de Energia de
Bogota (EEB) and Capital Energia, a unit of Endesa
International.
In 2013, Emgesa’s sales on the non-regulated
market marked an increase of 3.4% compared to
2012, mainly due to a contract with Ecopetrol S.A.
The contract with Ecopetrol will be valid for five years
from 2013 to 2018, with total energy consumption
estimated at 5,613 GWh during the contract period.
Emgesa is currently building the El Quimbo
hydroelectric power project, a plant with installed
capacity of 400MW that is expected to generate
2,216 GWh per year. The construction is scheduled
to be completed in 2014 with an estimated
investment budget of USD 837mn. The power plant
is located in the Huila department and will use water
from the Suaza and Magdalena rivers.
Company data
238
978
1,213 1,244
81
344
443 452
2010Y 2011Y 2012Y 2013Y
Total Operating Revenue Net Profit (Loss)
- 56 - Any redistribution of this information is strictly prohibited.
Copyright © 2014 EMIS, all rights reserved.
Source:
Emgesa S.A. E.S.P. (cont’d)
Return on Assets and Equity (%)
Power Purchases (GWh)
Ownership Structure (%)
Power Generation by Power Plant
Company data
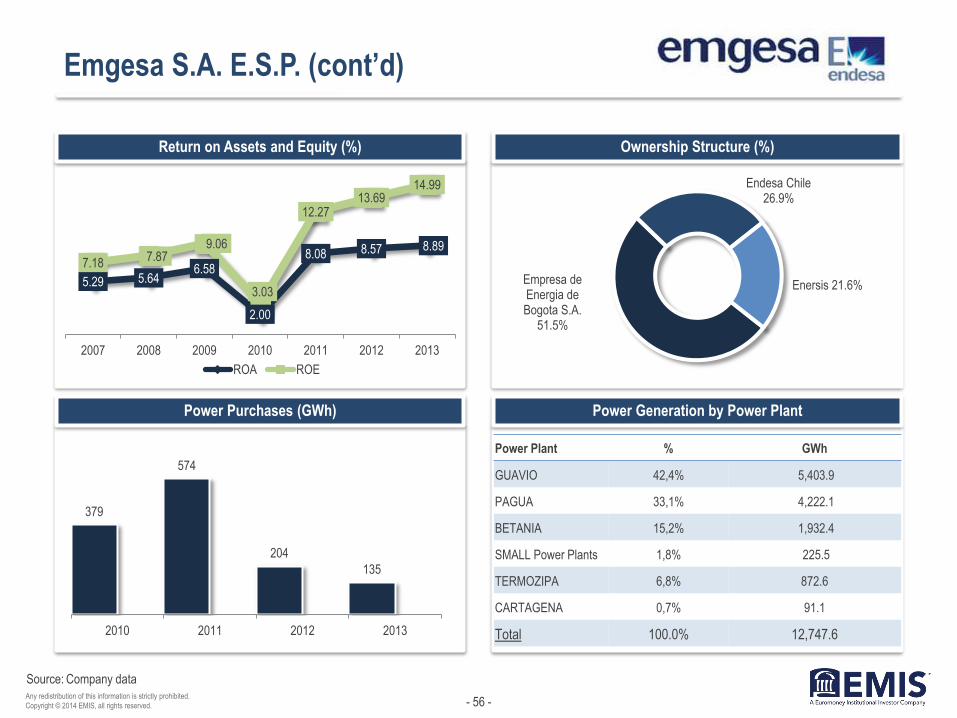
5.29 5.64 6.58
2.00
8.08 8.57 8.89
7.18 7.87
9.06
3.03
12.27 13.69
14.99
2007 2008 2009 2010 2011 2012 2013
ROA ROE
Empresa de Energia de Bogota S.A.
51.5%
Endesa Chile 26.9%
Enersis 21.6%
379
574
204
135
2010 2011 2012 2013
Power Plant % GWh
GUAVIO 42,4% 5,403.9
PAGUA 33,1% 4,222.1
BETANIA 15,2% 1,932.4
SMALL Power Plants 1,8% 225.5
TERMOZIPA 6,8% 872.6
CARTAGENA 0,7% 91.1
Total 100.0% 12,747.6
- 57 - Any redistribution of this information is strictly prohibited.
Copyright © 2014 EMIS, all rights reserved.
Contact:
Corporate Headquarters
Nestor House
Playhouse Yard
London EC4V 5EX
UK
Voice: +44 207 779 8471
Fax: +44 207 779 8224
Americas Headquarters
225 Park Avenue South
New York, New York 10003
US
Voice: +1 212 610 2900
Fax: +1 212 610 2950
Asia Headquarters
Eucharistic Congress Bldg. No.
III
4th Floor, 5 Convent Street
Mumbai 400 001
India
Voice: +91 22 22881123
Fax: +91 22 22881137
Disclaimer:
The material is based on sources which we believe are reliable, but no warranty, either expressed or implied, is provided in relation to the accuracy or completeness
of the information. The views expressed are our best judgment as of the date of issue and are subject to change without notice. EMIS and Euromoney Institutional
Investor PLC take no responsibility for decisions made on the basis of these opinions.
Any redistribution of this information is strictly prohibited. Copyright © 2014 EMIS, all rights reserved. A Euromoney Institutional Investor company.
About EMIS Insight
EMIS Insight is a unit of EMIS that produces proprietary strategic research and analysis. The service features market overviews, industry trend analysis, legislation
and profiles of the leading sector companies provided by locally-based analysts.
About EMIS
Founded in 1994, EMIS (formerly known as ISI Emerging Markets) was acquired by Euromoney Institutional Investor PLC in 1999. EMIS works from over 15 offices
around the world to deliver electronic information products, by subscription, to institutional customers globally. EMIS provides hard-to-get information covering more
than 100 emerging markets. Its flagship products are EMIS Intelligence and EMIS Professional.
EMIS clients include top investment banks, corporations, law firms, consultants, investment and insurance companies, universities and libraries, multilateral
organizations, and others.

- 58 - Any redistribution of this information is strictly prohibited.
Copyright © 2014 EMIS, all rights reserved.
Contact:
Corporate Headquarters
Nestor House
Playhouse Yard
London EC4V 5EX
UK
Voice: +44 207 779 8471
Fax: +44 207 779 8224
Americas Headquarters
225 Park Avenue South
New York, New York 10003
US
Voice: +1 212 610 2900
Fax: +1 212 610 2950
Asia Headquarters
Eucharistic Congress Bldg. No.
III
4th Floor, 5 Convent Street
Mumbai 400 001
India
Voice: +91 22 22881123
Fax: +91 22 22881137
Disclaimer:
The material is based on sources which we believe are reliable, but no warranty, either expressed or implied, is provided in relation to the accuracy or completeness
of the information. The views expressed are our best judgment as of the date of issue and are subject to change without notice. EMIS and Euromoney Institutional
Investor PLC take no responsibility for decisions made on the basis of these opinions.
Any redistribution of this information is strictly prohibited. Copyright © 2014 EMIS, all rights reserved. A Euromoney Institutional Investor company.
About EMIS Insight
EMIS Insight is a unit of EMIS that produces proprietary strategic research and analysis. The service features market overviews, industry trend analysis, legislation
and profiles of the leading sector companies provided by locally-based analysts.
About EMIS
Founded in 1994, EMIS (formerly known as ISI Emerging Markets) was acquired by Euromoney Institutional Investor PLC in 1999. EMIS works from over 15 offices
around the world to deliver electronic information products, by subscription, to institutional customers globally. EMIS provides hard-to-get information covering more
than 100 emerging markets. Its flagship products are EMIS Intelligence and EMIS Professional.
EMIS clients include top investment banks, corporations, law firms, consultants, investment and insurance companies, universities and libraries, multilateral
organizations, and others.