comparing hyperspectral and multispectral imagery for land
TRANSCRIPT

Journal of Geography and Geology; Vol. 5, No. 1; 2013 ISSN 1916-9779 E-ISSN 1916-9787
Published by Canadian Center of Science and Education
92
Comparing Hyperspectral and Multispectral Imagery for Land Classification of the Lower Don River, Toronto
Lisa-Jen Ferrato1 & K. Wayne Forsythe1 1 Department of Geography, Ryerson University, Toronto, Ontario, Canada
Correspondence: Lisa-Jen Ferrato, Department of Geography, Ryerson University, 350 Victoria Street, Toronto, Ontario M5B 2K3, Canada. E-mail: [email protected]
Received: November 24, 2012 Accepted: February 6, 2013 Online Published: February 20, 2013
doi:10.5539/jgg.v5n1p92 URL: http://dx.doi.org/10.5539/jgg.v5n1p92
Abstract
Urban greenspace is important for the health of cities. Up-to-date databases and information are vital to maintain and monitor growth in cities. During the last decade, advances in spaceborne hyperspectral sensors have resulted in some advantages being gained over multispectral sensors for land cover monitoring (due to increased spectral resolution). The objective of this research was to compare Earth Observing-1 (EO-1) Hyperion hyperspectral data to Landsat 5 Thematic Mapper (TM) and Satellite Probatoire d’Observation de la Terre (SPOT) 5 multispectral data for land cover classification in a dense urban landscape. For comparative analysis, orthorectified aerial imagery provided by the Toronto and Region Conservation Authority (TRCA) was used as ground truth data for accuracy assessment. This study utilized conventional and segmented principal components (CPCA and SPCA) for data compression on the Hyperion imagery, and used principal components analysis (PCA) as a visual enhancement technique for multispectral imagery. Image processing including the generation of the normalized difference vegetation index (NDVI), and mean texture was also performed for both Landsat and SPOT sensors. Unsupervised iterative self-organizing data analysis (ISODATA) classification procedures were performed on all images to produce land cover classification maps for a portion of the Lower Don River in Toronto, Ontario, Canada. Experiments conducted in this research demonstrated that hyperspectral imagery produced a higher overall accuracy (5-6% better) than multispectral data with the same resolution for defining vegetation cover. In addition, SPOT generated greater accuracy results than Landsat or Hyperion for vegetation classes. It was found that conventional Hyperion and segmented Hyperion methods outperformed the Landsat 5 TM sensor for vegetation differences (for tree canopy and open green spaces).
Keywords: hyperspectral and multispectral imagery, spectral resolution, PCA, land classification, vegetation
1. Introduction
1.1 The Value of Greenspace
Urban greenspace has been most valued for its positive effect on air and water quality, including the urban heat island effect and ecosystem health. It also allows for rainfall to soak into the ground leading to a decrease in flood events (Arnold & Gibbons, 1996; Banzhaf & Hofer, 2008; Heiden et al., 2012). The spatial distribution of green space within dense cities is important for urban planning andsustainable development, as well as an increase in the quality of urban life for the residents. This is important because urban green space including individual street trees, public parks, road edges, public or private gardens and green infrastructure helps to sustain the quality of urban life and reduces street noise (Ahem, 2007; Davies et al., 2008; Zhou & Rana, 2012). The value of green space is not necessarily expressed in a monetary term, but for establishing urban social-environmental worth (Cairns, 2006; Paquot, 2005; Zhou & Rana, 2012). Ultimately, working towards conservation within densely populated areas is essential and identifying where these areas are located is important, prior to any efforts being made to protect them.
1.2 Differences between Hyperspectral and Multispectral Data
Multispectral satellite technologies have been commonly used for remotely sensed classification of vegetation since the early 1960s (Govender et al., 2008; Jensen, 2007). In a single observation, multispectral sensors generate three to six spectral bands of data that range from the visible to near infrared (NIR) portion of the electromagnetic spectrum (EMS) (Jensen, 2007). This small window of spectral bands is a primary disadvantage

www.ccsenet.org/jgg Journal of Geography and Geology Vol. 5, No. 1; 2013
93
to multispectral sensors. During the last decade, advances in imaging spectrometers have begun to fill the gap in multispectral sensor limitations (Heiden et al., 2012; Pignatti et al., 2009; Purkis & Kemis, 2011). Hyperspectral sensors commonly collect more than 200 spectral bands that range from the visible to short wave infrared (SWIR) section of the EMS; they provide extensive analyses of earth surface features that would be limited with coarser bandwidths collected by multispectral sensors. With the advanced technology of hyperspectral sensors, accuracy results when performed on dense urban imagery may be increased. Thus, these advantages have led to recent scholarly explorations of classification and mapping for land cover and vegetation with the application of hyperspectral imagery (HSI) (Heiden et al., 2012; Jung et al., 2005). A complete list of spaceborne hyperspectral satellites currently in orbit and set to launch is found in Buckingham and Staenz (2008).
1.3 Applications of Hyperspectral Remote Sensing in Land Resources
Within the last decade, hyperspectral remote sensing has gained awareness in research and analysis. Currently, with spaceborne sensors such as the EO-1 Hyperion, hyperspectral data collection is rapidly expanding to applied satellite sensor research studies. Applications including water management, agriculture and ecological monitoring have advanced with the aid of hyperspectral imagery (Govender et al., 2007; Pignatti et al., 2009). The importance of using imaging spectrometry lies in the spectral resolution rather than spatial resolution compared to multispectral imagery.
Hyperspectral remote sensing has become common in monitoring urban environments, which include impervious surfaces (Van der Linden et al., 2009; Weng et al., 2008; Lu & Weng, 2006). At a regional level, Peijun et al. (2010) analyzed Hyperion and Landsat 5 Thematic Mapper (TM) data for urban impervious surface extraction and compared them to Quickbird images for referencing Earth features in Xuzhou City, China. In their study, Heiden et al. (2011) describe an urban structure type (UST) application to assess the state of the ecology and its influence in urban planning for Munich, Germany. Hyperspectral sensors have the ability to derive urban land cover for complex analyses of large dense areas, thus enabling the update of surface material databases for use in urban development. Jung et al. (2005) examined hyperspectral imagery and its detection of vegetation in an urban landscape and found that when discriminating different types of vegetation, the SWIR bands are most reliable. They attempted to detect the effect of vegetation on micro-scale environmental problems among built-up conditions.
1.4 Data Compression Using Principal Components (PC)
Use of hyperspectral imaging potentially gives researchers (Datt et al., 2003; Khurshid et al., 2006; Tsai et al., 2007) the opportunity to accomplish complex analyses that are often difficult with multispectral imaging. One advantage is maintaining a greater amount of spectral bands to define land cover in dense urban regions. Nevertheless, hyperspectral sensors when compared to multispectral sensors may cause new difficulties in data processing and analysis that could hinder the success of certain research endeavours. One of the challenges in hyperspectral data handling and analysis that requires more attention is the amount of data, as well as high data dimensionality (Khurshid et al., 2006; Tsai et al., 2007). These concerns alone may result in low accuracies when classifying land features. Ultimately, hyperspectral analysis involves crucial attention to data compression. By not compressing hyperspectral data and only selecting a few bands for analysis, the continuity of the spectral data and the sensors full capacity would not be considered (Tsai et al., 2007).
An approach to reduce data dimensionality for large datasets is principal component analysis (PCA). Studies often use PCA for visualization and interpretation purposes such as feature extraction and defining classes when performing classification (Kaarna et al., 2006; Liew et al., 2002; Myint et al., 2011; Sanchez-Hernandex et al., 2007). However, greater research and the utility of PCA for data compression is not as common in literature. Nevertheless, Cheriyadat and Bruce (2003) used airborne hyperspectral data and found that data compression is effective except for supervised classification where areas of known features are defined. They argued that PCA does not necessarily retain the important feature characteristics in higher order principal components where crucial information may be present in a lower order component and can therefore be eliminated for analysis.
For more effective extraction of vegetation over complex study areas, segmented principal component analysis (SPCA) has been applied to enhance conventional principal component analysis (CPCA) methods (Datt et al., 2003; Kaarna et al., 2006). Since vegetation contains diverse structure types, the characteristics, including absorption and reflectance across different portions of wavelengths, also differ (Bell & Baranoskie, 2004). If PCA were to be generated for each range of the spectrum- visible and near-infrared (VNIR), shortwave infrared (SW1 and SW2), the significant information is better maintained for each separate portion rather than CPCA which is generated across an entire spectrum (Tsai et al., 2007). Ideally, a SPCA should produce greater accuracy results for classification purposes.

www.ccsenet.org/jgg Journal of Geography and Geology Vol. 5, No. 1; 2013
94
1.5 Research Objectives
The objective of this research is to compare hyperspectral imagery to multispectral imagery for classifying urban green space surrounding Toronto’s Lower Don River. The goal of this study is to make use of Earth Observing-1 (EO-1) Hyperion, Landsat 5 Thematic Mapper (TM), and Satellite Probatoire d’Observation de la Terre (SPOT) 5 for comparing land cover and land use information as well as to examine which sensor is best for defining vegetation specifically for a dense urban area. To achieve these objectives, data analyses will be performed by deriving the normalized difference vegetation index (NDVI) and mean texture from original sensor bands for image classification. NDVI and mean texture as well as principal component analysis will also be used for visual interpretation. Conventional and segmented principal component analysis were generated for the hyperspectral image as a data compression method. Orthorectified aerial imagery was utilized as a ground reference for accuracy assessment while comparing all three sensors.
1.6 Study Area
The study area is the Lower Don River and Toronto’s waterfront (Figure 1). The Don River is the most urbanized watershed in Canada (Toronto and Region Conservation Authority, 2012). Loss of natural areas threatens the Don’s watershed. Significant wetlands are disappearing, and only 7.2% of forested land remains in the Don River watershed (TRCA, 2012). It is affected by its industrial past which makes it a significant area for studying the quality of vegetation cover. Today, the Don River is approximately 38 kilometres long and its watershed is 360 square kilometres. With this large watershed, urbanized development is a major stress factor upon the quality of vegetation. The Don River watershed has nine sub-basins. This research will contribute significantly to the assessment of land cover classification through its use of hyperspectral imagery. Ultimately, this study addresses a gap in literature by incorporating hyperspectral data for assessing land classification in a dense urban watershed.

www.ccsenet.org/jgg Journal of Geography and Geology Vol. 5, No. 1; 2013
95
Figure 1. Lower Don River study area
2. Methods
2.1 Data Collection
The imagery used for this study were obtained from the US Geological Survey’s Earth Explorer (http://earthexplorer.usgs.gov/) server and the GeoBase Canada (http://www.geobase.ca/) server, which were preprocessed at level one radiance, systematic and terrain corrected (See Table 1). All three images were subset to conform to the Hyperion dataset within the boundaries of the Lower Don River watershed as well as the Toronto waterfront.

www.ccsenet.org/jgg Journal of Geography and Geology Vol. 5, No. 1; 2013
96
Table 1. Hyperspectral and multispectral data characteristics
Parameters Multispectral Multispectral Hyperspectral
WRS - 2 Projection SPOT 4 LS5TM EO-1 Hyperion
Spectral Range 500-1750 nm 400-2400 nm 400-2600 nm (10 nm ea.)
Spatial Resolution 20 m 30 m 30 m
Swath Width 60 km 185 km 7.5 km
Acquisition Date August 1st, 2007 July 17th, 2008 August 11th, 2007
Number of Bands 4 6 & Thermal 220
Bands used 1-4 1-5, 7 14-55, 135-163, & 191-212
2.2 Data Analysis
The NDVI, PCA and mean texture image processing techniques were performed on each image scene to evaluate certain spectral characteristics for vegetation foliage in a complex urban landscape as well as to achieve dimensionality reduction. Unsupervised classification procedures using the iterative self-organizing data analysis (ISODATA) method were performed to examine the difference in spectral classes for land cover. Classification was only performed on those bands common to Landsat and SPOT; the effect of the shortwave infrared band on classification results was also examined. The data used for this study were based on their medium resolution and no cost availability.
2.2.1 Hyperion Data Pre-processing
Data preparation for hyperspectral imagery was necessary. Geometric correction was conducted on Hyperion by using PCI Geomatica OrthoEngine’s generic satellite model. Prior to analysis, all three images were projected to the North American Datum 1983 Universal Transverse Mercator (UTM) Zone 17 North projection and visually inspected for alignment. For the reason that multispectral sensors have fewer and wider band widths, the Hyperion band selection involved carefully choosing spectral responses that resemble those of Landsat and SPOT in the visible and near-infrared (VNIR) and SWIR regions.
2.2.2 Good Band Selection
The level one terrain corrected data were converted into PCI Geomatica format files (.pix). ‘Bad’ band selection for the Hyperion image was performed first, non-calibrated bands according to Petropulos et al. (2012), Pu et al. (2008), Wijanarto and Amhar (2010), Carter et al. (2009) and Jarecke et al. (2001) were removed including bands 1-7, 58-78, 225-242; these bands were also visually reviewed. According to the USGS (2011) 198 calibrated bands cover 426 to 2395 nm of the EMS. Second, water absorption bands including 120-132, 165-182, 185-187, 221-224 were eliminated to reduce the influence of atmospheric scatter, and water vapour absorption caused by mixed gasses (Petropoulos et al., 2012). Third, bands visually identified with vertical stripes were eliminated including 8-13, 56-57, 79-83, 97-102, 119, 133-134, 152-153, 164, 183-184, 188-190, 213-220. Images containing vertical stripes are a result of faults with push-broom based sensors and usually removed after visual inspection (Petropoulos et al., 2012; Pu et al., 2008; Wijanarto & Amhar, 2010). Atmospheric correction was not conducted because the images are already terrain corrected and according to Petropoulos et al. (2012) it is not necessary in a single observation. The Hyperion wavelength ranges were then compared to Landsat 5 TM and SPOT 5 and reduced from 122 to 93 Hyperion bands (correlated between each of the sensors wavelength portions) and used for analysis. The Hyperion bands selected to correlate with the two multispectral sensors were chosen based on Carter’s et al. (2009) study and are shown in Table 2.

www.ccsenet.org/jgg Journal of Geography and Geology Vol. 5, No. 1; 2013
97
Table 2. Sensor image data
EMS LS5TM WL(nm) SPOT5 WL (nm) Hyperion WL (nm) Correlated nm)
Visible 1 450-520 n/a n/a 14
488-926
488-520
Visible 2 520-600 1 500-590 21 520-590
Visible 3 630-690 2 610-680 31 630-680
NIR 4 760-900 3 780-890 48 780-890
SWIR 1 5 1550-1750 4 1580-1750 150 1488-1790 1580-1750
SWIR 2 7 2080-2350 n/a n/a 206 1972-2365 2080-2350
2.3 Data Workflow
In this paper, PCA is used in both ways; to compress Hyperion data, and to use it in visual interpretation for multispectral data. A complete methodology work flow for this paper is shown in Figure 2. By using PCA to compress data, Liew et al. (2002) produced a land cover classification map using unsupervised ISODATA from a PCA (on dominant components) for two tropical regions in Southeast Asia. They compared the results of classification to land cover maps during the same time period. The authors state that hyperspectral data contains redundant spectral bands and this issue can be removed using PCA (Liew et al., 2002). Therefore, by using PCA, all original 93 bands (good bands) are able to be processed for analysis.
Figure 2. Methodology workflow
Figure 3 shows the principal components (PCs) generated from conventional Hyperion. There are five PCs generated because of the large amount of spectral bands to be compressed. In addition to the CPCA data compression method, a SPCA was performed which separated the VNIR (PCs 1-3 and 5) and SW1 (PCs 1-2) and SW2 (PC 1) for defining land cover from land use (See Figure 4 and Figure 5). Based on the eigen values and the PCs that visually looked unaffected by stripes, these PCs were combined to generate an additional

www.ccsenet.org/jgg Journal of Geography and Geology Vol. 5, No. 1; 2013
98
classification for Hyperion. The aim of this analysis was to distinguish vegetation from non-vegetation in complex urban environments. To achieve this objective, the algorithm for PCA used as a feature extraction and data compression method (in order to compare both multispectral and hyperspectral data) must be able to define vegetation characteristics and effective variations among trees and open green space for classification.
Figure 3. PCs 1-5 (a–e) for conventional Hyperion
Figure 4. Principal components for segmented Hyperion, VNIR (a–d)

www.ccsenet.org/jgg Journal of Geography and Geology Vol. 5, No. 1; 2013
99
Figure 5. Principal components for segmented Hyperion, SW1 (PCs a-b), SW2 (PC c)
2.3.1 Classification Mapping: Aggregated Classes
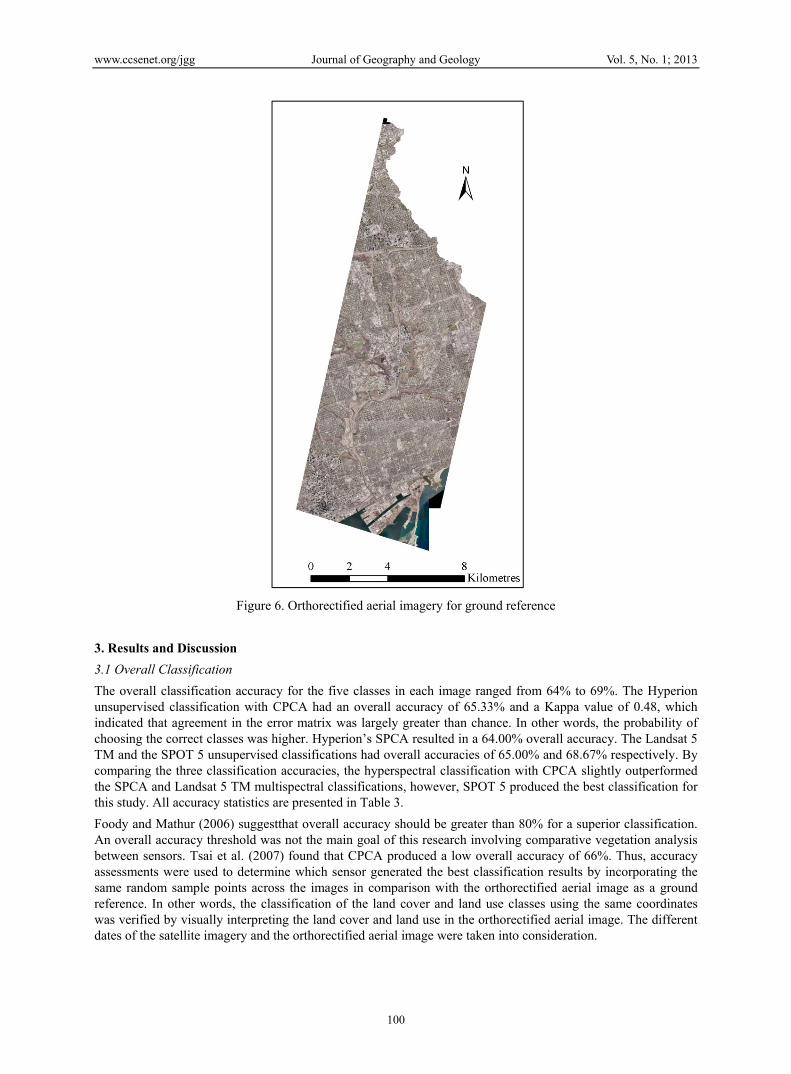
In this research, classification mapping was rationally considered. The classes used are derived from the level one classification system from Anderson et al. (1976). Due to this paper’s study area and the spatial resolutions of 20 to 30 metres, five classes were used including tree canopy, open green, bare earth, water body, and urban surfaces. The urban surfaces include white tops of industrial buildings, parking lots, roads and rows of houses and roof tops of commercial buildings. The open green class includes parks, golf courses, and fields. In addition, there are significant areas of bare earth to be classified separately. The post classification accuracy assessment demonstrates the overall percentage of the correctly classified aggregate classes (tree canopy, open green, bare earth, water body, and urban areas) as compared to the orthorectified aerial imagery (See Figure 6).
www.ccsenet.org/jgg Journal of Geography and Geology Vol. 5, No. 1; 2013
100
Figure 6. Orthorectified aerial imagery for ground reference
3. Results and Discussion
3.1 Overall Classification
The overall classification accuracy for the five classes in each image ranged from 64% to 69%. The Hyperion unsupervised classification with CPCA had an overall accuracy of 65.33% and a Kappa value of 0.48, which indicated that agreement in the error matrix was largely greater than chance. In other words, the probability of choosing the correct classes was higher. Hyperion’s SPCA resulted in a 64.00% overall accuracy. The Landsat 5 TM and the SPOT 5 unsupervised classifications had overall accuracies of 65.00% and 68.67% respectively. By comparing the three classification accuracies, the hyperspectral classification with CPCA slightly outperformed the SPCA and Landsat 5 TM multispectral classifications, however, SPOT 5 produced the best classification for this study. All accuracy statistics are presented in Table 3.
Foody and Mathur (2006) suggestthat overall accuracy should be greater than 80% for a superior classification. An overall accuracy threshold was not the main goal of this research involving comparative vegetation analysis between sensors. Tsai et al. (2007) found that CPCA produced a low overall accuracy of 66%. Thus, accuracy assessments were used to determine which sensor generated the best classification results by incorporating the same random sample points across the images in comparison with the orthorectified aerial image as a ground reference. In other words, the classification of the land cover and land use classes using the same coordinates was verified by visually interpreting the land cover and land use in the orthorectified aerial image. The different dates of the satellite imagery and the orthorectified aerial image were taken into consideration.

www.ccsenet.org/jgg Journal of Geography and Geology Vol. 5, No. 1; 2013
101
Table 3. Confusion matrices of classification results from each sensor
Reference Data Conventional Hyperion
Tree Canopy
Open Green
Water Body
Bare Earth
Urban Areas Totals UA
Tree Canopy 46 15 0 1 19 81 0.57Open Green 15 24 0 0 16 55 0.44
Classification Water Body 1 1 18 0 0 20 0.90data Bare Earth 0 0 0 2 3 5 0.40
Urban Areas 16 13 0 4 106 139 0.76Totals 78 53 18 7 144 300
PA 0.59 0.45 1 0.29 0.74 Overall accuracy = 0.65 Kappa = 0.48
Reference Data Segmented Hyperion
Tree Canopy
Open Green
Water Body
Bare Earth
Urban Areas Totals UA
Tree Canopy 48 16 0 0 16 80 0.60Open Green 12 24 0 1 19 56 0.43
Classification Water Body 1 1 18 0 0 20 0.90data Bare Earth 4 3 0 2 9 18 0.11
Urban Areas 13 9 0 4 100 126 0.79Totals 78 53 18 7 144 300
PA 0.62 0.45 1 0.29 0.69 Overall accuracy = 0.64 Kappa = 0.48
Reference Data
Landsat 5 TM Tree Canopy
Open Green
Water Body
Bare Earth
Urban Areas Totals UA
Tree Canopy 44 13 0 0 16 73 0.60Open Green 13 20 0 0 6 39 0.51
Classification Water Body 0 0 18 0 0 18 1.00data Bare Earth 0 2 0 2 11 15 0.13
Urban Areas 21 18 0 5 111 155 0.72Totals 78 53 18 7 144 300
PA 0.56 0.38 1 0.29 0.77 Overall accuracy = 0.65 Kappa = 0.48
Reference Data
SPOT 5 Tree Canopy
Open Green
Water Body
Bare Earth
Urban Areas Totals UA
Tree Canopy 58 15 0 0 25 98 0.59Open Green 8 26 0 0 12 46 0.57
Classification Water Body 1 0 18 0 0 19 0.95data Bare Earth 0 4 0 2 5 11 0.18
Urban Areas 11 8 0 5 102 126 0.81Totals 78 53 18 7 144 300
PA 0.74 0.49 1 0.29 0.71 Overall accuracy = 0.68 Kappa = 0.54
Results show that among the three sensors, tree canopy was highly misclassified as urban areas. The segmented Hyperion additionally misclassified tree canopy for open green. These results may be produced from

www.ccsenet.org/jgg Journal of Geography and Geology Vol. 5, No. 1; 2013
102
neighbourhoods that are mostly made up of urban surfaces and contain tree cover, the spectral reflectance’s may be mixed when wavelengths penetrate through the tree crown and hit the surface of a road or house that reflects back for that particular area. This can also be explained for the classification of open green which was mixed with urban areas and mostly tree canopy. As previously mentioned, Jung et al. (2005) found that by discriminating different types of vegetation, the SWIR bands are most reliable; in this study, the SWIR bands detected vegetation on a micro-scale environment. In addition, urban areas were predominantly mixed with tree canopy, and with segmented Hyperion urban areas were mixed with open green areas. Bare earth is mostly misclassified as urban areas; this could be from buildings containing white roof tops which have similar reflectance to bare soils. Water bodies were correctly classified, with one or two mixed pixels for tree canopy and open areas possibly due to high moisture content in the peak summer months for Hyperion.
The SPCA (four PCs in the VNIR, two in the SW1, and one in the SW2) had the best results compared to CPCA. Figure 7 displays the two classified images for SPCA and CPCA as well as the multispectral sensors. Moreover, there were more pixels classified as urban areas instead of water bodies and a greater number of tree canopy pixels classified as urban areas with the SPCA methodology. This could be explained by the shadows having similar reflectance characteristics as water in the downtown. By examining CPCA, the highest amount of pixels misclassified were urban areas mixed with tree canopy. Older residential areas (urban areas), as previously mentioned, being misinterpreted as residential tree cover may cause these two classes to be mixed.
Figure 7. Aggregated results for conventional Hyperion (a) segmented Hyperion (b) Landsat 5 TM (c) and SPOT 5 (d)
Further experiments should be conducted to assess the accuracy of more PCA segments for each range of the EMS. Tsai et al. (2007) suggest that the greater number of SPCAs does not increase accuracy, instead, greater segments in each portion of the spectrum increase accuracy. As shown in Figure 3 (e), the fifth PC is a result of

www.ccsenet.org/jgg Journal of Geography and Geology Vol. 5, No. 1; 2013
103
conventional Hyperion’s data spectral ‘smile’ effect which does not represent reflectance anomalies of features (Datt et al., 2003). Tsai et al. (2007) argue that data in the short wave range with longer wavelengths may be noisy and cause poor data results. Taking this into account, the noisy PC bands were eliminated for classification when performing the SPCA to generate higher overall accuracy; however, in this study, this method resulted in a moderate overall accuracy amongst the three satellites.
Although literature suggests that SPCA should produce greater accuracy results over CPCA (Bell & Baranoskie, 2004; Tsai et al., 2007), this study found the opposite (although the difference was marginal). It was found that SPCA did not have the expected results for classification as a whole, however, it is essential to note that conventional Hyperion and segmented Hyperion methods did outperform the Landsat 5 TM sensor for vegetation differences (for tree canopy and open green spaces). The resulting higher accuracy obtained using Hyperion data proves that spectral analysis is a significant component for applying classification to an urban setting (between 5-6% better). Although SPOT 5 mostly outperformed the other two sensors, this can be explained by the difference in spatial resolution, as SPOT 5 image pixels have a higher spatial resolution. By examining urban areas, Hyperion did outperform SPOT 5 for bare earth with a user’s accuracy of 40% and a Kappa of 0.39 and also produced a greater Kappa of 0.46 for tree canopy.
3.2 Image Enhancement Techniques
By applying image enhancement techniques such as the NDVI, principal components and texture, there is a greater possibility for class separability. Amongst the three sensors, mean texture clearly defined urban areas along the Harbourfront from bare earth surfaces that may have similar spectral reflectance. Although texture did not effectively differentiate between urban areas and open green, mean texture was useful for defining tree canopy from water bodies, for example in the Don River Valley. PCA 2 became useful for effectively outlining open green spaces including fields, parks and golf courses. The NDVI effectively defined open green spaces from urban areas and vegetation from water bodies. This enhancement was also useful for greater separability between vegetation and roads. Vegetation is in a lighter and brighter tone therefore, it has the ability to distinguish between urban surfaces with higher reflectance from white roofs (which are displayed dark).
3.3 Aggregated Images
In the aggregated images (Figure 7), it is visually apparent that some of the land classes are misclassified in Downtown Toronto (southwest corner of image). Since there is low reflectance of light caused by building shadow, these pixels are greatly mixed with the water body class (most evident with the Spot and Hyperion sensors). In the conventional and segmented Hyperion tree canopy and open green are misrepresented by water bodies, however, the accuracy results may not include the mixed pixels in the downtown area possibly because an accuracy point does not fall on these pixels. Furthermore, in the northern portion, urban areas are mixed with water bodies. Landsat imagery was able to outline the spectral reflectance in the downtown as urban areas better than the other sensors. Ultimately, the results of the aggregated classes of the Hyperion and Spot sensors embody clear definition of vegetation/urban green space compared to the Landsat sensor of approximately 6-14% better foliage.
The orthorectified aerial imagery was used to assess how well the classification system worked for hyperspectral and multispectral data. Peijun et al. (2010) used Quickbird images as a ground reference in Xuzhou City, China and found that a EO-1 Hyperion hyperspectral image was more efficient than a Landsat TM image for extracting vegetated areas. Thus, by comparing medium spatial resolution data to finer spatial resolution orthorectified aerial imagery, land classification can be accurately measured.
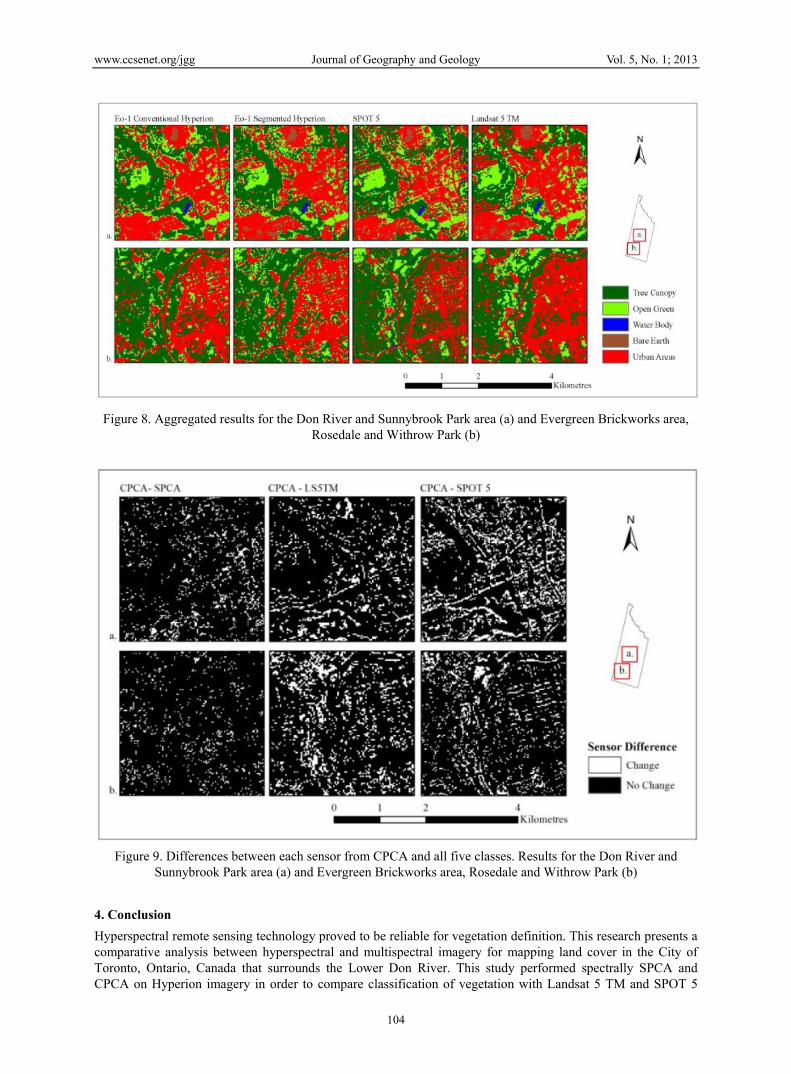
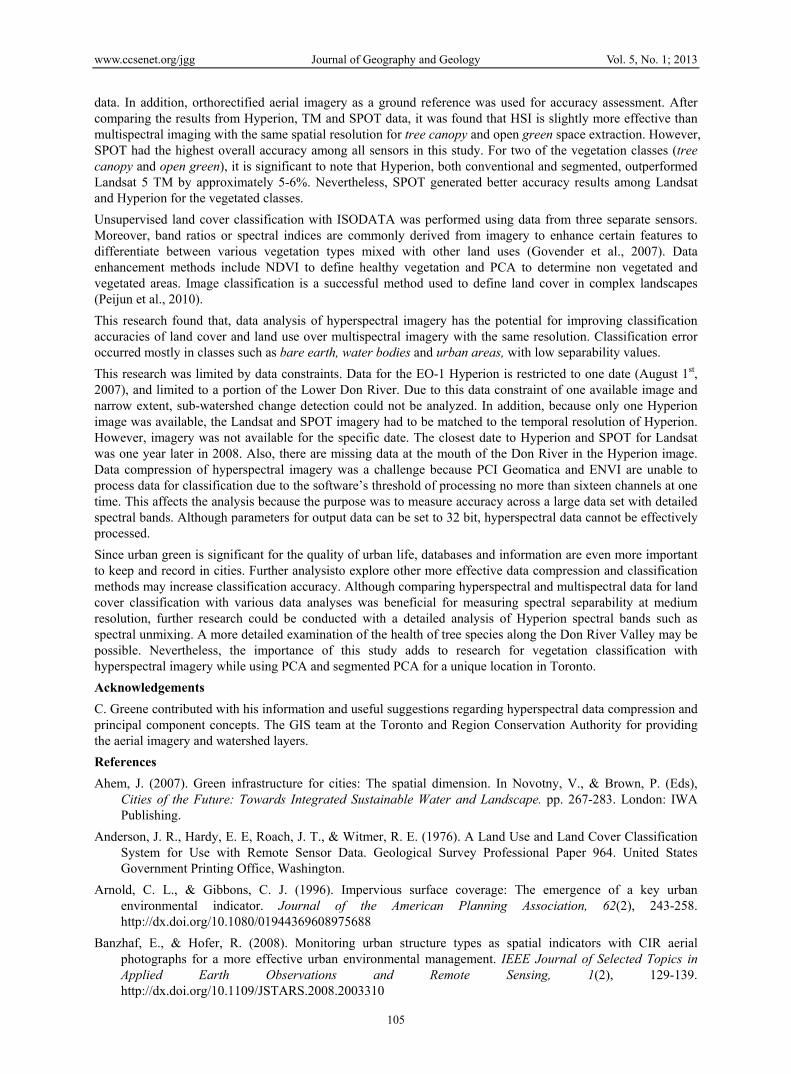
Figures 7 and 8 show the resulting class differences between the four images. It is found that both CPCA and SPCA Hyperion outline vegetation, specifically tree canopies, better than Landsat and are almost as detailed as the Spot classification. This is especially evident for areas in the north. It is evident that there are areas of mixed pixels with the Landsat and Hyperion imagery for the vegetated classes. In addition, in Figure 8 (a), it is evident that Landsat detected bare earth and water bodies better than the other sensors. However, this does not necessarily represent true land cover and could contain mixed pixels. In Figure 8 (b), conventional and segmented Hyperion, and SPOT detect water body pixels in the Don River, where Landsat is unable to determine this area as having water. Figure 9 shows the differences between conventional PCA and the three remaining images (SPCA, Landsat 5 TM, and SPOT 5). These results define the change and non change of all classes (tree canopy, open green, barren ground, water bodies and urban surfaces) between the hyperspectral and multispectral images.
www.ccsenet.org/jgg Journal of Geography and Geology Vol. 5, No. 1; 2013
104
Figure 8. Aggregated results for the Don River and Sunnybrook Park area (a) and Evergreen Brickworks area, Rosedale and Withrow Park (b)
Figure 9. Differences between each sensor from CPCA and all five classes. Results for the Don River and Sunnybrook Park area (a) and Evergreen Brickworks area, Rosedale and Withrow Park (b)
4. Conclusion
Hyperspectral remote sensing technology proved to be reliable for vegetation definition. This research presents a comparative analysis between hyperspectral and multispectral imagery for mapping land cover in the City of Toronto, Ontario, Canada that surrounds the Lower Don River. This study performed spectrally SPCA and CPCA on Hyperion imagery in order to compare classification of vegetation with Landsat 5 TM and SPOT 5
www.ccsenet.org/jgg Journal of Geography and Geology Vol. 5, No. 1; 2013
105
data. In addition, orthorectified aerial imagery as a ground reference was used for accuracy assessment. After comparing the results from Hyperion, TM and SPOT data, it was found that HSI is slightly more effective than multispectral imaging with the same spatial resolution for tree canopy and open green space extraction. However, SPOT had the highest overall accuracy among all sensors in this study. For two of the vegetation classes (tree canopy and open green), it is significant to note that Hyperion, both conventional and segmented, outperformed Landsat 5 TM by approximately 5-6%. Nevertheless, SPOT generated better accuracy results among Landsat and Hyperion for the vegetated classes.
Unsupervised land cover classification with ISODATA was performed using data from three separate sensors. Moreover, band ratios or spectral indices are commonly derived from imagery to enhance certain features to differentiate between various vegetation types mixed with other land uses (Govender et al., 2007). Data enhancement methods include NDVI to define healthy vegetation and PCA to determine non vegetated and vegetated areas. Image classification is a successful method used to define land cover in complex landscapes (Peijun et al., 2010).
This research found that, data analysis of hyperspectral imagery has the potential for improving classification accuracies of land cover and land use over multispectral imagery with the same resolution. Classification error occurred mostly in classes such as bare earth, water bodies and urban areas, with low separability values.
This research was limited by data constraints. Data for the EO-1 Hyperion is restricted to one date (August 1st, 2007), and limited to a portion of the Lower Don River. Due to this data constraint of one available image and narrow extent, sub-watershed change detection could not be analyzed. In addition, because only one Hyperion image was available, the Landsat and SPOT imagery had to be matched to the temporal resolution of Hyperion. However, imagery was not available for the specific date. The closest date to Hyperion and SPOT for Landsat was one year later in 2008. Also, there are missing data at the mouth of the Don River in the Hyperion image. Data compression of hyperspectral imagery was a challenge because PCI Geomatica and ENVI are unable to process data for classification due to the software’s threshold of processing no more than sixteen channels at one time. This affects the analysis because the purpose was to measure accuracy across a large data set with detailed spectral bands. Although parameters for output data can be set to 32 bit, hyperspectral data cannot be effectively processed.
Since urban green is significant for the quality of urban life, databases and information are even more important to keep and record in cities. Further analysisto explore other more effective data compression and classification methods may increase classification accuracy. Although comparing hyperspectral and multispectral data for land cover classification with various data analyses was beneficial for measuring spectral separability at medium resolution, further research could be conducted with a detailed analysis of Hyperion spectral bands such as spectral unmixing. A more detailed examination of the health of tree species along the Don River Valley may be possible. Nevertheless, the importance of this study adds to research for vegetation classification with hyperspectral imagery while using PCA and segmented PCA for a unique location in Toronto.
Acknowledgements
C. Greene contributed with his information and useful suggestions regarding hyperspectral data compression and principal component concepts. The GIS team at the Toronto and Region Conservation Authority for providing the aerial imagery and watershed layers.
References
Ahem, J. (2007). Green infrastructure for cities: The spatial dimension. In Novotny, V., & Brown, P. (Eds), Cities of the Future: Towards Integrated Sustainable Water and Landscape. pp. 267-283. London: IWA Publishing.
Anderson, J. R., Hardy, E. E, Roach, J. T., & Witmer, R. E. (1976). A Land Use and Land Cover Classification System for Use with Remote Sensor Data. Geological Survey Professional Paper 964. United States Government Printing Office, Washington.
Arnold, C. L., & Gibbons, C. J. (1996). Impervious surface coverage: The emergence of a key urban environmental indicator. Journal of the American Planning Association, 62(2), 243-258. http://dx.doi.org/10.1080/01944369608975688
Banzhaf, E., & Hofer, R. (2008). Monitoring urban structure types as spatial indicators with CIR aerial photographs for a more effective urban environmental management. IEEE Journal of Selected Topics in Applied Earth Observations and Remote Sensing, 1(2), 129-139. http://dx.doi.org/10.1109/JSTARS.2008.2003310

www.ccsenet.org/jgg Journal of Geography and Geology Vol. 5, No. 1; 2013
106
Bell, I. E., & Baranoskie, G. V. G. (2004). Reducing the dimensionality of plant spectral database. IEEE Transactions on Geoscience and Remote Sensing, 42, 570-576. http://dx.doi.org/10.1109/TGRS.2003.821697
Buckingham, R., & Staenz, K. (2008). Review of current and planned civilian space hyperspectral sensors for EO. Canadian Journal of Remote Sensing, 34, 187-197. http://dx.doi.org/10.5589/m08-002
Cairns, R. D. (2006). On accounting for sustainable development and accounting for the environment.Resources Policy, 31, 211-216. http://dx.doi.org/10.1016/j.resourpol.2007.02.002
Carter, G. A., Lucas, K. L., Blossom, G. A., Lassitter, C. L., Holiday, D. M., Mooneyhan, D. S., … Griffith, J. A. (2009). Remote sensing and mapping of Tamarisk along the Colorado River, USA: A comparative use of summer-acquired Hyperion, Thematic Mapper and Quickbird data. Remote Sensing, 1, 318-329. http://dx.doi.org/10.3390/rs1030318
Cheriyadat, A., & Bruce, L. M. (2003). Why Principal Component Analysis Is Not an Appropriate Feature Extraction Method for Hyperspectral Data. Proc. 2003 IEEE Geoscience and Remote Sensing Symposium, 3420-3422.
Datt, B., McVicar, T. R., Van Niel, T. G., Jupp, D. L. B., & Pearlman, J. S. (2003). Preprocessing EO-1 Hyperion hyperspectral data to support the application of agricultural indexes. IEEE Transaction on Geoscience and Remote Sensing, 41(6), 1246-1259. http://dx.doi.org/10.1109/TGRS.2003.813206
Davies, R. G., Barbosa, O., Fuller, R. A., Tratalos, J., Burke, N., Lewis, D., … Gaston, K. J. (2008). City-wide relationships between green spaces, urban land use and topography. Urban Ecosystem, 11(3), 269-287. http://dx.doi.org/10.1007/s11252-008-0062-y
European Space Agency. (2012). SPOT. Eduspace. Retrieved August 9, 2012, from http://www.esa.int/esaMI/Eduspace_EN/SEMIW04Z2OF_0.html
Foody, G. M., & Mathur, A. (2006). The use of training sets containing mixed pixels for accurate hard image classification: Training on mixed spectral responses for classification by SVM. Remote Sensing of the Environment, 103, 179-189. http://dx.doi.org/10.1016/j.rse.2006.04.001
Govender, M., Chetty, K., & Bulcock, H. (2007). A Review of Hyperspectral Remote Sensing and its Application in Vegetation and Water Resource Studies. Water SA, 33, 145-151.
Govender, M., Chetty, K., Naiken, V., & Bulcock, H. (2008). A comparison of satellite hyperspectral and muyltispectral remote sensing imagery for improved classification and mapping of vegetation. Water SA, 34(2), 147-154.
Heiden, U., Heldens, W., Roessner, S., Segl, K., Esch, T., & Mueller, A. (2012). Urban structure type characterization using hyperspectral remote sensing and height information. Landscape and Urban Planning, 105, 361-375. http://dx.doi.org/10.1016/j.landurbplan.2012.01.001
Jarecke, P., Barry, P., & Pearlman, J. (2001). Aggregation of Hyperion hyperspectral spectral bands into Landsat-&ETM+ spectral bands. IEEE, 2822-2824.
Jensen, J. R. (2007). Introductory to Digital Image Processing: A Remote Sensing Perspective. Prentice Hall Series in Geographic Information Science.
Jung, A., Kardevan, P., & Tokei, L. (2005). Detection of urban effect on vegetation in a less built-up Hungarian city by hyperspectral remote sensing. Physics and Chemistry of the Earth, 30, 255-259. http://dx.doi.org/10.1016/j.pce.2004.08.041
Kaarna, A., Toivanen, P., & Keranen, P. (2006). Compression and classification methods for hyperspectral images. Pattern Recognition Policy, 31, 211-216.
Khurshid, K. S., Staenz, K., Sun, L., Neville, R., White, H. P., & Bannari, A. (2006). Preprocessing of EO-1 Hyperion data. Canadian Journal of Remote Sensing, 32, 145-163. http://dx.doi.org/10.5589/m06-014
Liew, S. C., Change, C. W., & Lim, K. H. (2002). Hyperspectral Land Cover Classification of EO-1 Hyperion Data by Principal Component Analysis and Pixel Unmixing. Centre for Remote Sensing, Imaging and Processing, National University of Sinagpore, 3111-3113.
Myint, S. W., Gober, P., Braxel, A., Grossman-Clarke, S., & Weng, Q. (2011). Per-pixel vs. object-based classification of urban land cover extraction using high spatial imagery. Remote Sensing of the Environment, 115, 1145-1161. http://dx.doi.org/10.1016/j.rse.2010.12.017

www.ccsenet.org/jgg Journal of Geography and Geology Vol. 5, No. 1; 2013
107
Paquot, T. (2005). City and nature, a missed opportunity? Diogens, Sage Publications, 52(3), 65-74.
PCI Inc. (2010). PCI Help Menu. Ontario, Canada: Richmond Hill.
Peijun, D., Junshi, X., Wen, C., & Xiaoling, W. (2010). Extraction of urban impervious surface from hyperspectral remote sensing image. IEEE, 1-5.
Petropoulos, G. P., Arvanitis, K., & Sigrimis, N. (2012). Hyperion hyperspectral imagery analysis combined with machine learning classifiers for land use/cover mapping. Expert Systems with Applications, 39, 3800-3809. http://dx.doi.org/10.1016/j.eswa.2011.09.083
Pignatti, S., Cavalli, R. M., Cuomo, V., Fusilli, L., Pascucci, S., Poscolieri, M., & Santini, F. (2009). Evaluating Hyperion Capability for Land Cover Mapping in a Fragmented Ecosystem: Pollino National Park, Italy. Remote Sensing of Environment, 113, 622-634. http://dx.doi.org/10.1016/j.rse.2008.11.006
Pu, R., Gong, P., & Yu, Q. (2008). Comparative analysis of EO-1 ALI and Hyperion, and Landsat ETM+ data for mapping forest crown closure and leaf area index. Sensors, 8, 3744-3766. http://dx.doi.org/10.3390/s8063744
Purkis, S. J., & Klemas, V. V. (2011). Remote Sensing and Global Environmental Change. Wiley-Blackwell ltd., 1-367.
Toronto and Region Conservation Authority (TRCA). (2012). Retrieved April 22, 2012, from http://www.trca.on.ca/the-living-city/watersheds/don-river/
Tsai, F., Lin, E. K., & Yoshino, K. (2007). Spectrally segmented principal component analysis of hyperspectral imagery for mapping invasive plant species. International Journal of Remote Sensing, 28(5), 1023-1039. http://dx.doi.org/10.1080/01431160600887706
USGS. (2011). Earth Observing-1 (EO-1). US Geological Survey. Retrieved August 10, 2012, from http://eo1.usgs.gov/
Van der Linden, S., & Hostert, P. (2009). The influence of urban structures on impervious surface maps from airborne hyperspectral data. Remote Sensing of Environment, 11(113), 2298-2305. http://dx.doi.org/10.1016/j.rse.2009.06.004
Weng, Q., Hu, X., & Lu, D. (2008). Extracting impervious surfaces from medium spatial resolution multispectral and hyperspectral imagery: A comparison. International Journal of Remote Sensing, 29(11), 3209-3232. http://dx.doi.org/10.1080/01431160701469024
Wijanarto, A., & Amhar, F. (2010). Tropical biodiversity mapping from hyperion image Bogor Indonesia. Technical Commission VII Symposium 2010.
Zhou, X., & Rana, M. P. (2012). Social benefits of urban green space: A conceptual framework of valuation and accessibility measurements. International Journal of Management of Environmental Quality, 23(2), 173-189. http://dx.doi.org/10.1108/14777831211204921