comparing mouse- and touch-based map interaction for ...the device through which the cartographic...
TRANSCRIPT
MASTERARBEIT
Comparing Mouse- and Touch-based Map Interaction for Target Search Tasks on Large Screens
Ausgeführt am Department für Geodäsie und Geoinformation
der Technischen Universität Wien
unter der Anleitung von
Univ.Prof. Mag.rer.nat. Dr.rer.nat. Georg Gartner, TU Wien und
Dipl.-Ing. Florian Ledermann, TU Wien
durch
Shuoyan Huang
Hartmanngasse 5/2/20, 1050 Wien
30. January 2017 _______________________________
Unterschrift (Student)
Die approbierte Originalversion dieser Diplom-/ Masterarbeit ist in der Hauptbibliothek der Tech-nischen Universität Wien aufgestellt und zugänglich.
http://www.ub.tuwien.ac.at
The approved original version of this diploma or master thesis is available at the main library of the Vienna University of Technology.
http://www.ub.tuwien.ac.at/eng

MASTER’S THESIS
Comparing Mouse- and Touch-based Map Interaction for Target Search Tasks on Large Screens
Conducted at
Department of Geodesy and Geoinformation Technical University Vienna
under the supervision of
Univ.Prof. Mag.rer.nat. Dr.rer.nat. Georg Gartner, TU Wien and
Dipl.-Ing. Florian Ledermann, TU Wien
by
Shuoyan Huang
Hartmanngasse 5/2/20, 1050 Wien
30. January 2017 _______________________________
Signature (Student)


Acknowledgements
First of all, I would like to thank my supervisor Dipl.-Ing. Florian Ledermann for
the continual input, discussion, guidance, encouragement, and support throughout the
process of this thesis. Thanks for putting up with my constant skepticism, procrasti-
nation, and inarticulateness.
I would like to thank Prof. Georg Gartner for the advice and feedback on the thesis
draft. My gratitude also goes to the rest of the members of the cartography research
group, for their participation in the pre-tests, suggestions for improving the research
design, and their help in finding participants for the user study.
Also, I want to thank all the user study participants for taking part in this study and
giving valuable feedback.
Finally, I want to thank all my friends who listened to my complaints about life when
I was frustrated and depressed, and my family who supported me all these years.
v

Abstract
Large multi-touch devices are gaining more attention in various fields of applications.
The device through which the cartographic content is presented plays a role in carto-
graphic interaction. This thesis presents a controlled user study comparing mouse- and
touch-based map interaction on a large screen, in the context of target search tasks.
Participants’ mouse and touch input were logged in the browser. Several measurements
were used to evaluate the difference between the mouse and touch interaction—drag
length, drag direction, drag and zoom frequency, touch/mouse on-screen locations, and
time spent on tasks. The results suggest that when using touch, users pan the map
differently from when they are using mouse, with shorter panning distances and differ-
ent main panning directions. The touch locations concentrate in the lower-middle part
of the screen while mouse covers a larger screen area. Drag and zoom frequencies of
the two input methods are quite similar, as well as the task completion times. In situ
observation of user behavior identified several usage patterns and frequent problems
when using touch. User feedback shows a clear preference of mouse input and gives
reasons for participants’ preference.
Keywords: cartographic interaction, multi-touch, large display, user study
Contents
Acknowledgements v
Abstract vi
List of Figures ix
List of Tables x
Abbreviations xi
1 Introduction 1
1.1 Motivation . . . . . . . . . . . . . . . . . . . . . . . . . . . . . . . . . . 1
1.2 Problem Statement . . . . . . . . . . . . . . . . . . . . . . . . . . . . . . 2
1.3 Aim of the Thesis . . . . . . . . . . . . . . . . . . . . . . . . . . . . . . . 2
1.4 Thesis Structure . . . . . . . . . . . . . . . . . . . . . . . . . . . . . . . 2
2 Literature Review 3
2.1 Large Multi-touch Displays . . . . . . . . . . . . . . . . . . . . . . . . . 3
2.2 Large Multi-touch Map Applications . . . . . . . . . . . . . . . . . . . . 5
2.3 Touch vs. Mouse Input . . . . . . . . . . . . . . . . . . . . . . . . . . . 8
2.4 Interactive Cartography . . . . . . . . . . . . . . . . . . . . . . . . . . . 11
2.4.1 Panning and Zooming . . . . . . . . . . . . . . . . . . . . . . . . 12
2.4.2 Web Mapping . . . . . . . . . . . . . . . . . . . . . . . . . . . . . 13
3 Methodology 17
3.1 Introduction . . . . . . . . . . . . . . . . . . . . . . . . . . . . . . . . . . 17
3.2 Task . . . . . . . . . . . . . . . . . . . . . . . . . . . . . . . . . . . . . . 18
3.3 Participants . . . . . . . . . . . . . . . . . . . . . . . . . . . . . . . . . . 19
3.4 Materials . . . . . . . . . . . . . . . . . . . . . . . . . . . . . . . . . . . 19
3.5 Procedure . . . . . . . . . . . . . . . . . . . . . . . . . . . . . . . . . . . 22
3.6 Data Collection . . . . . . . . . . . . . . . . . . . . . . . . . . . . . . . . 24
3.6.1 Raw Data . . . . . . . . . . . . . . . . . . . . . . . . . . . . . . . 24
3.6.2 Measurements . . . . . . . . . . . . . . . . . . . . . . . . . . . . 25
3.6.2.1 Zooming operation . . . . . . . . . . . . . . . . . . . . . 28
3.6.3 Observation and User Feedback . . . . . . . . . . . . . . . . . . . 28
3.7 List of Hypotheses . . . . . . . . . . . . . . . . . . . . . . . . . . . . . . 28
4 Results and Discussion 31
4.1 Quantitative Results . . . . . . . . . . . . . . . . . . . . . . . . . . . . . 31
vii
Contents viii
4.1.1 Drag Length . . . . . . . . . . . . . . . . . . . . . . . . . . . . . 31
4.1.2 Drag Direction . . . . . . . . . . . . . . . . . . . . . . . . . . . . 34
4.1.3 Drag Frequency . . . . . . . . . . . . . . . . . . . . . . . . . . . . 35
4.1.4 Zoom Frequency . . . . . . . . . . . . . . . . . . . . . . . . . . . 36
4.1.5 Mouse and Touch Location . . . . . . . . . . . . . . . . . . . . . 37
4.1.6 Task Completion Time . . . . . . . . . . . . . . . . . . . . . . . . 39
4.2 Observations of Participant Behavior . . . . . . . . . . . . . . . . . . . . 40
4.3 User Feedback . . . . . . . . . . . . . . . . . . . . . . . . . . . . . . . . 43
4.3.1 User Preference . . . . . . . . . . . . . . . . . . . . . . . . . . . . 43
4.3.2 Other complaints . . . . . . . . . . . . . . . . . . . . . . . . . . . 45
4.4 Discussion . . . . . . . . . . . . . . . . . . . . . . . . . . . . . . . . . . . 45
5 Conclusion and Outlook 49
5.1 Summary . . . . . . . . . . . . . . . . . . . . . . . . . . . . . . . . . . . 49
5.2 Future Work . . . . . . . . . . . . . . . . . . . . . . . . . . . . . . . . . 50
References 53
Appendix 1. Pre-test Instructions 59
Appendix 2. Questionnaire 61

List of Figures
2.1 Popularity of term “multi-touch” . . . . . . . . . . . . . . . . . . . . . . 3
2.2 A multi-touch map application . . . . . . . . . . . . . . . . . . . . . . . 5
2.3 GeoLens multi-touch application . . . . . . . . . . . . . . . . . . . . . . 7
2.4 Visualization of Public Transit . . . . . . . . . . . . . . . . . . . . . . . 7
2.5 Feedback and help functionality . . . . . . . . . . . . . . . . . . . . . . . 8
2.6 Task in the unimanual experiment . . . . . . . . . . . . . . . . . . . . . 9
2.7 Task in the bimanual experiment . . . . . . . . . . . . . . . . . . . . . . 9
2.8 Two conditions in a comparative study . . . . . . . . . . . . . . . . . . . 11
2.9 Components of cartographic interaction . . . . . . . . . . . . . . . . . . 12
2.10 Map tiles at z1 . . . . . . . . . . . . . . . . . . . . . . . . . . . . . . . . 14
2.11 Composition of a typical web map . . . . . . . . . . . . . . . . . . . . . 15
3.1 User study workflow . . . . . . . . . . . . . . . . . . . . . . . . . . . . . 17
3.2 Lab setup . . . . . . . . . . . . . . . . . . . . . . . . . . . . . . . . . . . 20
3.3 Full screenshot of task 1 . . . . . . . . . . . . . . . . . . . . . . . . . . . 21
3.4 Welcome screen . . . . . . . . . . . . . . . . . . . . . . . . . . . . . . . . 22
3.5 Original csv file obtained from browser . . . . . . . . . . . . . . . . . . . 24
3.6 Code snippet for calculating drag length . . . . . . . . . . . . . . . . . . 26
3.7 First several lines of the processed drag length file . . . . . . . . . . . . 26
3.8 Drag direction θ . . . . . . . . . . . . . . . . . . . . . . . . . . . . . . . 27
3.9 Code snippet for calculating drag direction . . . . . . . . . . . . . . . . 27
4.1 Histogram of drag length before filtering . . . . . . . . . . . . . . . . . . 31
4.2 Histogram of drag length after filtering . . . . . . . . . . . . . . . . . . . 32
4.3 Box plot of drag length . . . . . . . . . . . . . . . . . . . . . . . . . . . 32
4.4 Mean drag length of each participant . . . . . . . . . . . . . . . . . . . . 33
4.5 Drag direction of mouse(left) and touch(right) . . . . . . . . . . . . . . . 34
4.6 Hand position when using touch . . . . . . . . . . . . . . . . . . . . . . 35
4.7 Box plot of drag frequency . . . . . . . . . . . . . . . . . . . . . . . . . . 36
4.8 Drag frequency of each participant . . . . . . . . . . . . . . . . . . . . . 36
4.9 Box plot of zoom frequency . . . . . . . . . . . . . . . . . . . . . . . . . 37
4.10 Zoom frequency of each participant . . . . . . . . . . . . . . . . . . . . . 37
4.11 Mouse locations . . . . . . . . . . . . . . . . . . . . . . . . . . . . . . . . 38
4.12 Touch locations . . . . . . . . . . . . . . . . . . . . . . . . . . . . . . . . 38
4.13 Mean completion time for mouse and touch . . . . . . . . . . . . . . . . 39
4.14 Mean time for eight tasks . . . . . . . . . . . . . . . . . . . . . . . . . . 39
4.15 Mean time for impossible tasks . . . . . . . . . . . . . . . . . . . . . . . 40
4.16 Panning patterns . . . . . . . . . . . . . . . . . . . . . . . . . . . . . . . 41
4.17 Zooming patterns . . . . . . . . . . . . . . . . . . . . . . . . . . . . . . . 41
4.18 Participants’ opinion of mouse and touch . . . . . . . . . . . . . . . . . 43
ix

List of Tables
3.1 Captured event types . . . . . . . . . . . . . . . . . . . . . . . . . . . . . 24
x

Abbreviations
HCI Human Computer Interaction
UI User Interface
API Application Programming Interface
HTML HyperText Markup Language
CSS Cascading Style Sheets
SVG Scalable Vector Graphics
XML eXtensible Markup Language
DOM Document Object Model
OSM OpenStreetMap
POI Point Of Interest
xi


Chapter 1
Introduction
1.1 Motivation
Since the release of Apple iPhone and Microsoft Surface in 2007, multi-touch technology
has enjoyed immense popularity over the years. While the small screen smartphones
are easy to carry and hence become an integral part of modern life, large multi-touch
devices are also gaining more attention in various fields of application. They have the
advantage of large screen estate (unlike mobile devices) while offering intuitive user
interaction. These large touch screens are often seen in public or semi-public spaces
such as museums, shopping malls, and tourist information centers, as an interactive
and engaging way to provide information to visitors.
As cartography is all about the visual representation of geographical information, large
touch screens are naturally a suitable choice for cartographic applications. Museums
and exhibitions employ multi-touch map applications to tell stories of historical events
(e.g., Axis Maps, 2015). City plans and campus maps can be shown on the large
multi-touch screen, helping people to find their way (e.g., DOKLAB, 2014). Even
broadcasting companies make use of interactive maps on multi-touch large screens. In
2008, US TV networks started using multi-touch screens to present the election results
(CNN, 2008). The news anchor could easily present the real-time data to the audience
while explaining what is going on. The list of application fields cannot be enumerated.
Therefore, map interaction on large multi-touch devices is worth investigating.
1
Introduction 2
1.2 Problem Statement
Lots of cartographic studies focus on how differences in visual variables, interface
elements, etc. affect user-map interaction. Relatively few work has focused on the
impact of different input methods on map interaction. Despite the growing number
of map applications on large multi-touch devices, it is not clear how large multi-touch
devices affect the way people interact with maps.
1.3 Aim of the Thesis
The aim of this thesis is to provide insights into how people interact with maps on large
multi-touch screens. By designing and conducting a controlled user study to compare
the touch input with mouse, the thesis seeks answers to the following questions: For a
large screen size, is multi-touch input more efficient than mouse? Are there different
patterns in terms of panning/zooming when using mouse and touch? Do map users
prefer using the multi-touch input? The discoveries can be helpful in understanding
cartographic interaction, and can be the basis to establish guidelines for designing
better cartographic applications on large multi-touch devices.
1.4 Thesis Structure
The rest of the thesis organizes as follows:
Chapter 2 discusses related studies in the fields of Human-Computer Interaction and
Cartography.
Chapter 3 describes the design of the empirical study in detail, including tasks, par-
ticipants, materials, procedure and data collection methods.
Chapter 4 presents the results of the empirical study and discusses the findings.
The last chapter summarizes the important findings and makes suggestions for future
work.

Chapter 2
Literature Review
This chapter first discusses recent research on large multi-touch displays in general,
then examines map-related multi-touch applications and comparative studies on touch
versus mouse input. Lastly, some relevant concepts and technologies regarding inter-
active maps are briefly introduced.
2.1 Large Multi-touch Displays
The existence of multi-touch surfaces dates back to at least the 1980s (Buxton, 2016),
when researchers at University of Toronto (Mehta, 1982) and at Bell Labs (e.g., Kasday,
1984) developed multi-touch systems based on various techniques. Since then there has
been a multitude of studies looking into improving multi-touch devices, making them
more affordable and easier to use. Later well-known examples include DiamondTouch
by Mitsubishi Research Labs (Dietz & Leigh, 2001), which is capable of recognizing
multiple users’ hands; and the low-cost multi-touch sensing technique presented by
Han (2005), who then demonstrated his work in a TED conference in 2006, bringing
awareness of multi-touch technology to the general public.
Figure 2.1: The popularity of the search terms “multi-touch” by Google Trends,from Schoning et al. (2008)
3

Literature Review 4
As the expenses of multi-touch devices have decreased rapidly in the last decade, large
multi-touch displays are made accessible to more users. Meanwhile, research about
these displays also flourished. Schoning et al. (2008) gave a summary of the important
technical aspects of multi-touch surfaces, including the different types of (multi-)touch
technologies and the hardware and software required to build a multi-touch surface.
In their recent survey, Ardito, Buono, Costabile, and Desolda (2015) examined studies
in large public displays to analyze how, why and where large displays are used; among
the 206 papers they selected, 57% discuss touch-based systems, and most of them
support multi-touch. Bellucci, Malizia, and Aedo (2014) reviewed the state of the art
of multi-touch tabletops, while Isenberg and Isenberg (2013) gave an overview of data
visualization (map representations included) on interactive surfaces.
In general, studies about large multi-touch displays belong to one of two types: con-
trolled user studies or non-controlled “in the wild” observations. Ryall, Morris, Everitt,
Forlines, and Shen (2006) used non-controlled settings to observe user interactions in
four different real-world contexts, from casual to more focused usage scenarios. They
were able to identify some common usage patterns after two years of observation, such
as “aiming and targeting precision problems for large-fingered individuals”, “accidental
input is common”, and “the design of the tables edge and its height impacted its use”.
Another study investigated long-term usage of a large multi-touch display (Wigdor,
Penn, Ryall, Esenther, & Shen, 2007). In the study, the participant used a multi-touch
table for everyday office tasks over a 13-month period. Case studies in museums and
exhibitions (Hornecker, 2008; Hinrichs & Carpendale, 2011) also belong to the non-
controlled setting, where the visitors’ interactions with the system were unstructured
and free-form.
Controlled user studies often involve clear separation of independent variables, and
their results often include quantitative analysis of task completion time and accuracy.
Comparative studies, such as comparing touch with mouse input (see Section 2.3), or
vertical with horizontal display, fall into this category. A comparison of vertical and
horizontal touch input has been done by Pedersen and Hornbæk (2012), where they
measured participants’ speed, accuracy, and fatigue on both orientations in tapping
and dragging tasks. They found that tapping was performed 5% faster on the vertical
Literature Review 5
surface, whereas dragging was performed 5% faster and with fewer errors on the hori-
zontal surface. Most of their participants preferred the horizontal surface because the
vertical one is more physically demanding to use.
In this thesis, the author used a controlled user study to investigate the difference
between touch and mouse input for map interaction, partly because this kind of study
is still rare in cartographic research on multi-touch, as can be seen in the next section.
2.2 Large Multi-touch Map Applications
Although numerous studies have been conducted in the HCI domain, studies about
large multi-touch displays in the context of map-related interactions are still rare.
Not much research has investigated how people can best use the large multi-touch
display for maps. Most existing works are case studies which focus on the design and
implementation of a visually appealing application with a specific usage scenario, then
test them in a non-controlled setting in order to evaluate the prototype, and provide
guidelines or insights for designing similar applications.
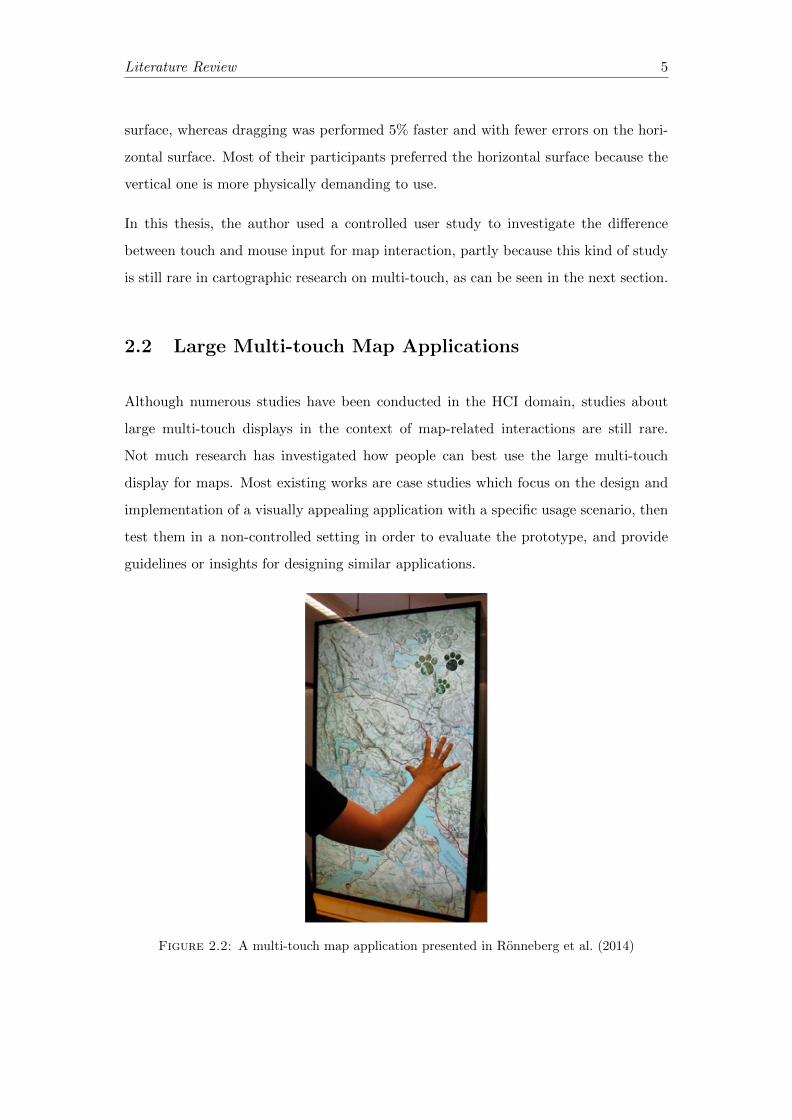
Figure 2.2: A multi-touch map application presented in Ronneberg et al. (2014)

Literature Review 6
Ronneberg et al. (2014) present a multi-touch, multi-user map application in a natural
center (Figure 2.2). The display surface is made up of three separate multi-touch LCD
displays with 1920×1080 pixels in resolution and 101.8×57.3 centimeters in display size.
They concentrated on map interface design issues, and based on some user interface
(UI) design principles and user feedback, they provided a list of considerations for
developing the UI. The authors noted that multi-user map applications in multi-touch
environments are still rare, hence these considerations may be helpful for the future
development of similar applications.
von Zadow et al. (von Zadow, Daiber, Schoning, & Kruger, 2012) developed a multi-
touch, multi-user tabletop application for exploring geographic information for the
general public. Their application uses a focus+context visualization technique to allow
multiple users to inspect details in different info points on the map simultaneously.
All interaction takes place in the so-called “GeoLenses”—the superimposed circles
showing detailed information. They installed the application in an exhibition and
observed about 150 visitors’ interaction with the system. They made some interesting
observations, such as that around one-third of the user used only a single finger, and
that older users were as capable of interacting with the application as younger ones
although old users focused more on the content. They concluded that the GeoLens
approach is viable for data exploration by untrained users in public space, that users
were able to learn about the actual content instead of only interested in the technology.
However, the authors also pointed out that further use cases and usability studies in a
controlled environment would be necessary to verify these findings.
Nagel et al. (2014) used both “in the wild” and lab settings to evaluate an application
they developed for exploring public transit data on a multi-touch tabletop (Figure 2.4).
In their user study, they tested 27 participants from three different user groups—local
citizen, domain expert, and neither local nor expert—and evaluated the different levels
of insights made by the participants, ranging from basic visual properties to complex
tempo-spatial patterns. The researchers asked participants to come up with insights
while using the application, and recorded the audio as well as observed user behavior.
The results suggest that non-experts were able to have a general understanding, cit-
izens were able to gain a deeper sense of their city, and experts could use their prior

Literature Review 7
Figure 2.3: Multi-touch application by von Zadow et al. (2012)
knowledge to gather higher levels of insights. They argued that well-designed interac-
tive tabletop applications visualizing urban data can inform both citizens and experts
and help them deepen their understanding of the city.
Figure 2.4: Visualization of Public Transit application by Nagel et al. (2014)
Artinger et al. (2011) investigated several alternative multi-touch gestures for panning,
zooming, rotating and selecting the map and map objects in an emergency management
scenario. They conducted an exploratory user study with 6 participants to evaluate the
easiness of learning, using and remembering those gestures. Based on their observation
and user feedback, they made some recommendations for the design of future gestural
interfaces.
White (2009) implemented a large format multitouch interface for the purpose of map
navigation. He created some custom gestures for some of the most common map

Literature Review 8
Figure 2.5: Feedback and help functionality in Artinger et al. (2011)
navigation tasks: zooming, panning and accessing menus, and identifies some problems
such as lack of hover state and obstructed views created by the user’s hands. However,
his thesis mainly focused on the hardware construction, which is understandable given
the high cost of large multi-touch devices at that time.
2.3 Touch vs. Mouse Input
Comparison between mouse and touch input has been the focus of many studies in the
human-computer interaction (HCI) field. According to Forlines, Wigdor, Shen, and
Balakrishnan (2007), one of the most often argued benefits is that direct-touch is more
“natural” than indirect input such as a mouse or pen; but since “naturalness” is difficult
to measure, the underlining argument is that the direct-touch input improves efficiency
and accuracy. It is based on measuring efficiency and accuracy that many empirical
studies are carried out. The dependent variables are usually time and accuracy (or
errors). Participants’ preferences are usually also collected.
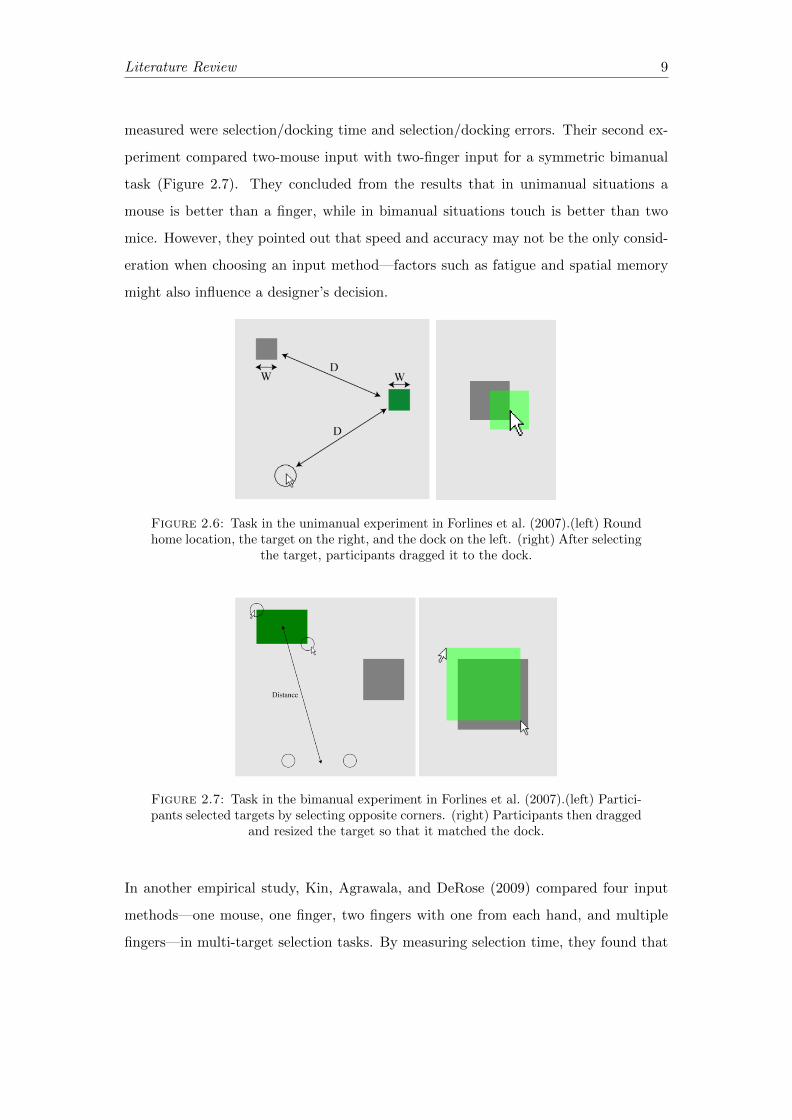
One of the most-cited works comparing direct-touch with mouse input is done by
Forlines et al. (2007). They conducted two experiments: one unimanual (using one
mouse or one finger) and the other bimanual (two mice or two fingers). For the first
experiment, they compared single-finger direct touch input with single-mouse input
for selection and dragging operations on a tabletop. The participants were asked to
perform a 2D target selection and docking task (Figure 2.6). The independent vari-
ables were: input method, target size, and target distance; the dependent variables
Literature Review 9
measured were selection/docking time and selection/docking errors. Their second ex-
periment compared two-mouse input with two-finger input for a symmetric bimanual
task (Figure 2.7). They concluded from the results that in unimanual situations a
mouse is better than a finger, while in bimanual situations touch is better than two
mice. However, they pointed out that speed and accuracy may not be the only consid-
eration when choosing an input method—factors such as fatigue and spatial memory
might also influence a designer’s decision.
Figure 2.6: Task in the unimanual experiment in Forlines et al. (2007).(left) Roundhome location, the target on the right, and the dock on the left. (right) After selecting
the target, participants dragged it to the dock.
Figure 2.7: Task in the bimanual experiment in Forlines et al. (2007).(left) Partici-pants selected targets by selecting opposite corners. (right) Participants then dragged
and resized the target so that it matched the dock.
In another empirical study, Kin, Agrawala, and DeRose (2009) compared four input
methods—one mouse, one finger, two fingers with one from each hand, and multiple
fingers—in multi-target selection tasks. By measuring selection time, they found that

Literature Review 10
one finger direct-touch provides a large performance improvement over one mouse con-
dition, and multi-touch further provides a small improvement over single-touch. They
also measured miss rates but found no significant difference across the four conditions.
Hansen and Hourcade (2010) compared multi-touch tabletop (81cm by 61cm) and
multi-mouse single-display groupware (two mice, 15-inch vertical display) for a collab-
orative visual task, and concluded that, despite users’ preference for the multi-touch
tabletop, the multi-mouse setup is actually more efficient (both in terms of comple-
tion time and number of operation). They use this to argue that users, as well as
researchers, are often biased by “exciting” technologies (in this case, the multi-touch
tabletop), therefore results of this kind of comparative studies should be interpreted
with caution. The limitation of this study is that the two setups differ not only in
input modality (touch vs. mouse), but also in display size and orientation, so it is
unclear which factor made a difference (or to what degree).
It should be noted that the above-mentioned studies, as well as many other empirical
studies in HCI research, mainly focus on simple “selection” and “dragging” tasks.
Therefore, the conclusions cannot be applied directly to cartographic applications.
There are, however, a few studies that focus on map-based tasks.
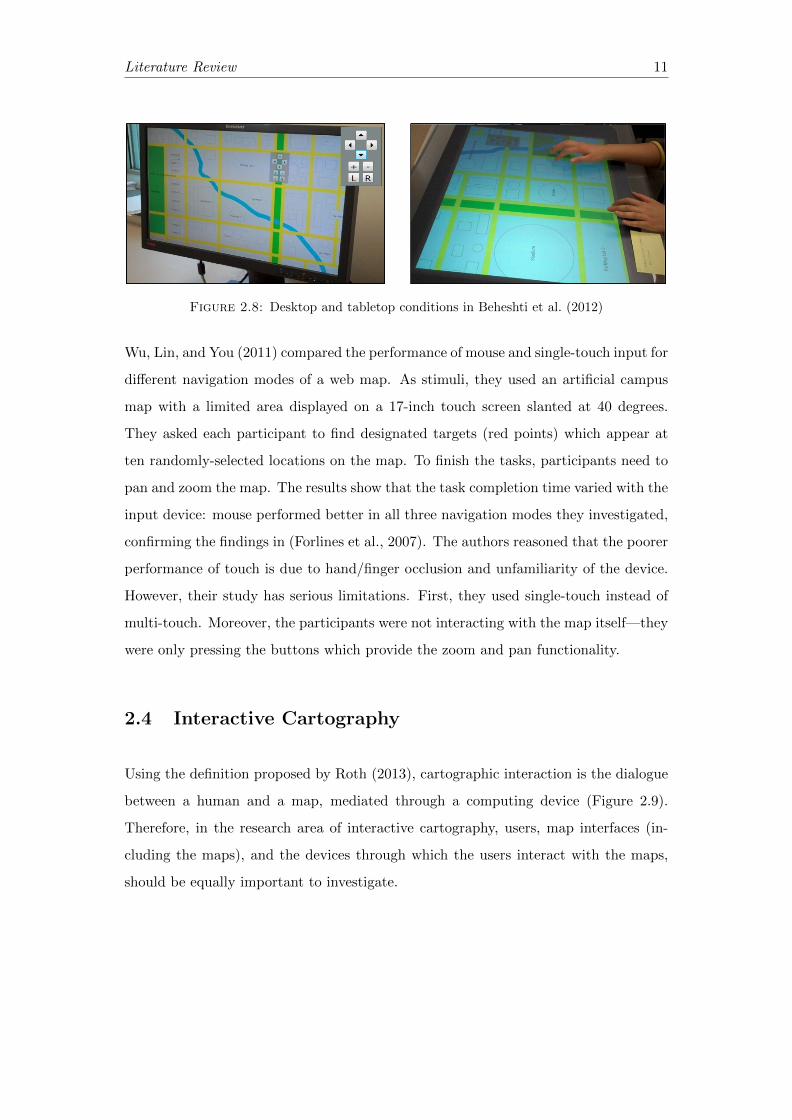
In a study perhaps most relevant to this thesis, Beheshti, Van Devender, and Horn
(2012) compared multi-touch tabletop with the desktop on map navigation perfor-
mance in a single-user situation (Figure 2.8). To determine whether participants who
use the tabletop have a better performance in navigation tasks (in this case finding
their way in a virtual world from a specific start point to a specific end point), the
researchers measured the map interaction time and navigation time, and the result
suggests no significant difference between the two conditions. Additionally, they ob-
served how users drag, zoom and rotate the map on the multi-touch tabletop, and
identified some interesting gestures which seem to be only typical in map navigation
tasks. The problem with their experiment design is that, there are too many indepen-
dent variables—modality, orientation, and screen size, to name a few. Therefore the
influence of each factor cannot be decided.
Literature Review 11
Figure 2.8: Desktop and tabletop conditions in Beheshti et al. (2012)
Wu, Lin, and You (2011) compared the performance of mouse and single-touch input for
different navigation modes of a web map. As stimuli, they used an artificial campus
map with a limited area displayed on a 17-inch touch screen slanted at 40 degrees.
They asked each participant to find designated targets (red points) which appear at
ten randomly-selected locations on the map. To finish the tasks, participants need to
pan and zoom the map. The results show that the task completion time varied with the
input device: mouse performed better in all three navigation modes they investigated,
confirming the findings in (Forlines et al., 2007). The authors reasoned that the poorer
performance of touch is due to hand/finger occlusion and unfamiliarity of the device.
However, their study has serious limitations. First, they used single-touch instead of
multi-touch. Moreover, the participants were not interacting with the map itself—they
were only pressing the buttons which provide the zoom and pan functionality.
2.4 Interactive Cartography
Using the definition proposed by Roth (2013), cartographic interaction is the dialogue
between a human and a map, mediated through a computing device (Figure 2.9).
Therefore, in the research area of interactive cartography, users, map interfaces (in-
cluding the maps), and the devices through which the users interact with the maps,
should be equally important to investigate.

Literature Review 12
Figure 2.9: Components of cartographic interaction, adapted from Roth (2013)
In the literature, a lot of studies have focused on the “map interface” component, for
example different map interface designs (Coltekin, Heil, Garlandini, & Fabrikant, 2009;
Poplin, 2015), various interactive techniques (Andrienko & Andrienko, 1999; Harrower
& Sheesley, 2005). This thesis is focusing on the “device” component, by comparing
mouse and touch input.
Harrower and Sheesley (2005) identified three basic questions for all interactive map-
ping systems: (1) what type of interactivity is needed, (2) how much interactivity
is needed (degree of control), and (3) how should this interactivity be implemented.
In this thesis, the goal is to compare two different input modalities, not to design a
specific map interface for any particular application scenario. Therefore, a general-
purpose map with the most common interactivities—pan and zoom—and very simple
interface is used in this study.
2.4.1 Panning and Zooming
The “Google Maps Effect” Google Maps was introduced in 2005 and has revolu-
tionized online mapping (Peterson, 2008). Since then, slippy maps (i.e., maps that users
can pan around and usually also zoom in/out) have become a new cartographic stan-
dard (Muehlenhaus, 2013). Millions of map users pan and zoom every day (Harrower
& Sheesley, 2005), thus it is necessary to include this functionality when designing
research concerning interactive maps.

Literature Review 13
2.4.2 Web Mapping
Internet mapping, or web mapping, started early after the emergence of the World Wide
Web (Haklay, Singleton, & Parker, 2008), since then the design and use of web maps
has changed dramatically. Client-side web mapping has been transitioning away from
standalone, proprietary technologies (such as Adobe Flash) and towards open tech-
nologies that built on the HTML, CSS, SVG, and XML web standards (the Open Web
Platform) and the JavaScript programming language (Roth, Donohue, Sack, Wallace,
& Buckingham, 2015). With the help of mapping APIs (application programming
interface), even relatively novice map users can include a functioning map in their
websites or apps, with just a few lines of code. The technologies and concepts used in
building the testing web page for this study are introduced briefly here.
HTML HyperText Markup Language (HTML) is the standard markup language for
creating web pages and web applications (W3C, n.d.). Web browsers receive HTML
documents from a web server or from local storage and render them into multimedia
web pages. HTML describes the structure of a web page.
CSS Cascading Style Sheets (CSS) describes how HTML elements are to be displayed
on screen, paper, or in other media, including the color, font, layout, and variations in
display for different devices and screen sizes (W3C, n.d.).
JavaScript Alongside HTML and CSS, JavaScript is one of the three core technolo-
gies of World Wide Web content production. It adds client-side behavior to the web
page. The majority of websites employ it, and all modern Web browsers support it
without the need for plug-ins. Scripts are embedded in or included from HTML pages
and interact with the Document Object Model (DOM) of the page.
Map Tiles Slippy maps are made up of many small, square images called tiles. These
tiles are typically 256 × 256 pixels and placed side by side to form a large seamless
image of the mapped area. The very first tile covers the entire globe, and is called
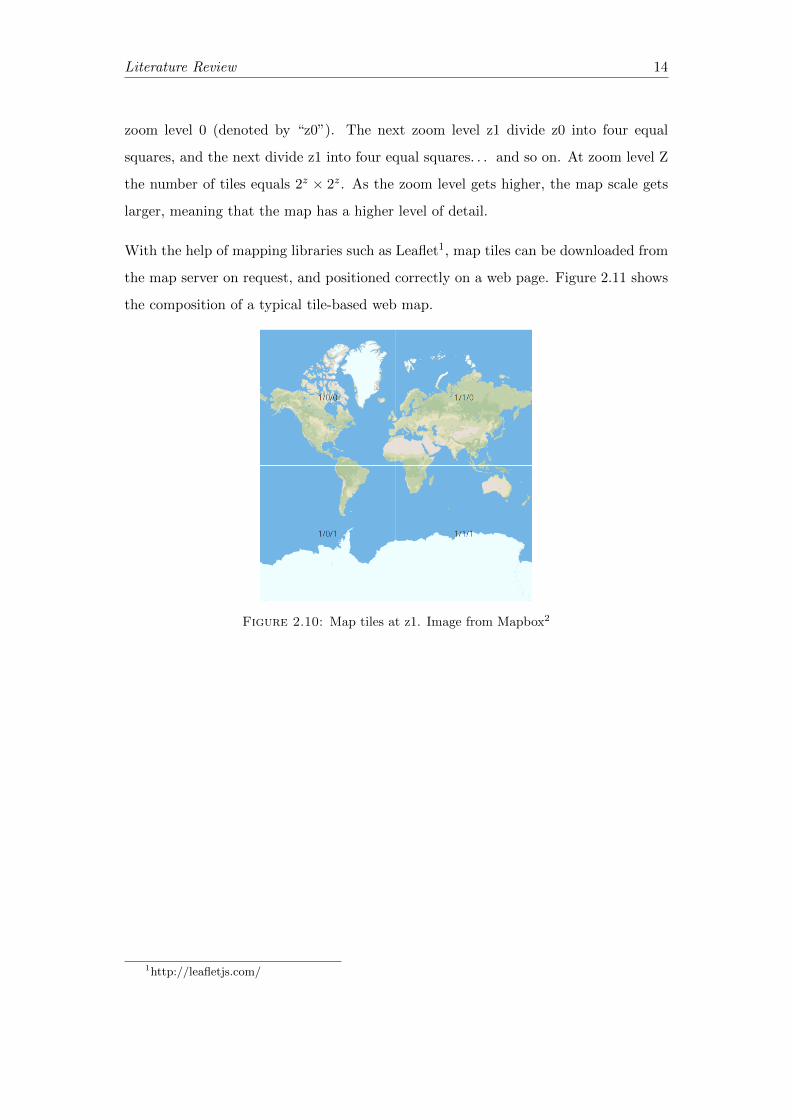
Literature Review 14
zoom level 0 (denoted by “z0”). The next zoom level z1 divide z0 into four equal
squares, and the next divide z1 into four equal squares. . . and so on. At zoom level Z
the number of tiles equals 2z × 2z. As the zoom level gets higher, the map scale gets
larger, meaning that the map has a higher level of detail.
With the help of mapping libraries such as Leaflet1, map tiles can be downloaded from
the map server on request, and positioned correctly on a web page. Figure 2.11 shows
the composition of a typical tile-based web map.
Figure 2.10: Map tiles at z1. Image from Mapbox2
1http://leafletjs.com/

Literature Review 15
Figure 2.11: Composition of a typical web map, from Woodruff and Foster (2014)
Chapter Summary
To summarize, there are few studies that tackle the problem of finding out how users
use interactive maps on large multi-touch devices. As Roth (2013) pointed out in his
review, research is still needed to determine to what degree can the input device, in
this case, the large multi-touch device, impact cartographic interaction. It is the task
of this thesis to make an investigation. Web mapping technologies are used to build
the testing map for the user study. Next chapter will give a detailed description of the
design of the user study.


Chapter 3
Methodology
3.1 Introduction
A controlled user study was conducted to compare how people interact with maps
displayed on a large screen using two different input methods—mouse and touch. In
a lab setting, participants were asked to perform target search tasks, using panning
and zooming operations. During the study, mouse and touch events were logged, user
interaction with the map was observed, and user feedback was collected. The overall
workflow of the user study is shown below.
Figure 3.1: User study workflow
17

Methodology 18
3.2 Task
The participants were asked to find a series of targets (e.g. museum, hotel, . . . ) on
maps of small towns. Every participant needed to use both (touch and mouse) input
methods (i.e. a within-subjects or repeated-measures design). To counterbalance the
order of the two conditions, participants were randomly assigned into two groups: half
of the participants (Group M) performed the tasks first with the mouse, then with
touch; the other half (Group T) first used touch then mouse. The same 10 tasks were
given for all participants (5 for each input method), and the order of the tasks always
remained the same.
Real-world towns instead of fictitious ones were used, to improve ecological validity.
Ten different towns were chosen for ten tasks, so the tasks were independent of each
other. The criteria for choosing the towns were: 1) it should be unfamiliar to the
users; 2) it should be located in an English-speaking country, to ensure all target
names are English, since the whole study is conducted in English; 3) users would
spend a reasonable amount of time searching for a target in the absence of a search
function, meaning that the town is neither too small (to few POIs) nor too big (too
many POIs). The criteria for choosing the targets were: 1) it has a unique label (not,
for example, a supermarket chain); 2) it requires at least zooming the map once from
the map’s default view. In order to examine users’ behavior under the condition where
they face a very difficult task, we included two targets that were not shown on the
map, hence impossible to find.
The difficulties of the tasks vary, meaning that users may take from several seconds to
several minutes to find a target, according to the preliminary tests conducted within
the research group. Because a user’s ability to find a target on a map depends on many
factors, for instance, their map-using experience, their prior knowledge about urban
planning, etc., it is arguably impossible for the researcher to select a set of targets
so that all tasks have the same level of difficulty to all the users, in contrast to the
highly simplified tasks used in HCI studies. However, our main goal here is not to test
which input method performs “better” than the other by measuring how fast the user

Methodology 19
finds the target, but to investigate how the user interacts with the map differently in
different input conditions. Although some kind of evaluation of task difficulty might
be useful, it is beyond the scope of this thesis. Nevertheless, we tried to balance the
task difficulties by choosing targets with varying distances to the original map center
and at different zoom levels.
3.3 Participants
20 participants (14 male, 6 female) voluntarily took part in the study, with ages ranging
from 19 to 38 (mean=26.7, SD=5.88). Most of them were university undergraduates
or graduate students from various disciplines. All participants but one were right-
handed; the one who was left-handed usually used the mouse with his right hand.
All participants could understand English very well (the whole study is conducted in
English). Before the user study, the participants were told that the goal of the study
was to investigate how people use interactive maps, and that it was not a test of their
abilities of any kind, and they should use the map as they would normally do. After
the experiment, each participant was given a map of Vienna as a small gift.
18 out of 20 participants used web maps frequently (e.g. Google Maps, OpenStreetMap,
etc.), while the other 2 used occasionally. They were quite familiar with both mouse and
touch devices; only one participant said she rarely used a mouse but used the track-pad
instead. Most of them did not have experience with large multi-touch screens, others
said they had used such device a few times in museums or at tourist information points.
3.4 Materials
The display device used in this study is iiyama ProLite TF4237MSC-B1AG, a 42-
inch capacitive multi-touch screen with 1920 × 1080 resolution and 522 × 927.9 mm
display area. The touchscreen is placed near-vertically (slanted at 15 degrees) on a
desk. Although horizontally installed displays (i.e. tabletops) are more prevalent in
the literature (see Chapter 2), we used this setup in order to ensure that the only

Methodology 20
changing factor (independent variable) is the input modality. In the mouse input
condition, the same touchscreen is used as a display-only monitor. The lower edge of
the screen is 70cm above the floor. Participants were sitting on an office swivel chair
when using the device. The height of the chair is adjustable and ranges between 40
and 50 centimeters. Figure 3.2 shows the setup of this study. The experiments were
conducted in a controlled laboratory setting, with minimum distraction.
Figure 3.2: Lab setup
The testing web map page is built based on Leaflet (version 1.0.1), an open-source
JavaScript library for interactive maps. Initially, Google Maps JavaScript API1 was
chosen but it had problems for logging touch events, therefore we opted for Leaflet,
which is probably the most widely-used and well-documented open-source mapping
library. The map tiles are provided by Mapbox2. Although the OpenStreetMap3
standard style is more commonly used, the OSM tile servers are often so busy that
sometimes the map tiles need a long time to be loaded in the browser, which would
1https://developers.google.com/maps/2https://www.mapbox.com/maps/3https://www.openstreetmap.org/

Methodology 21
severely hinder the map’s usage. The Mapbox tile server did not have this problem
throughout our testing phase and hence became the choice of this study. The map style
used here is the “Mapbox Streets” style, which is a comprehensive, general-purpose
basemap with high-contrast colors and a broad range of POIs. The style can also be
easily customized in the Mapbox Studio to fit more specific purposes. Here the default
style is used.
The zoom levels of the map were limited within 12 to 19. The lower limit is to prevent
users from zooming out too much and going too far away from the original map center;
the upper limit is to ensure that the number of POIs shown on the map is not too
large, otherwise the user would be overwhelmed by all the icons and labels, and spend
too much time on one task. Zoom in/out buttons and a “reset” button were on the
upper-right corner of the map area, in case the user needs them during the tasks. The
top part of the screen showed the information of current task. The testing page was
displayed in Google Chrome (version 51.0.2704) and in full-screen mode, to maximize
the map area as well as preventing the participants from being distracted by irrelevant
display elements. Figure 3.3 shows the screen content for task no.1.
Figure 3.3: Full screenshot of task 1
User interactions with the map are recorded by using JavaScript to capture the events
(i.e. user inputs) fired in the browser, for example, we can know when a user pressed

Methodology 22
and released the mouse button, or when the user’s finger touched and lifted from the
screen. A complete list of events logged is discussed in the “data collection” section. In
addition to the event log, all the sessions were video recorded to provide help analyzing
user behavior.
3.5 Procedure
The detailed procedure of one user study session is as follows:
1) The participant was first directed to the waiting room (the foyer of the research
group), where they were welcomed and given instructions by the research conductor.
(See Appendix 1 for the instruction script.)
2) After the introduction, the participant was guided to the lab and sat in front of
the screen. The participant could adjust the seat until they feel comfortable. What
the participant saw initially was a welcome screen with brief instructions (Figure 3.4).
To start the trials, the participant needed to press a “start” button, and the first task
would appear.
Figure 3.4: Welcome screen

Methodology 23
At the beginning of each task, the map was set to the default zoom level and starting
position, with a modal dialog showing the name of the target the participant needed
to find. After clicking “OK”, the dialog would disappear, but the name of the target
would be displayed on the top of the screen to remind the participant. If the participant
successfully located the target they could choose “I found it” on the top of the screen,
and then select the corresponding target on the map. To verify that the participant
indeed found the target, we set a bounding box for every target, and if their selection
was within the bounding box, the system would mark the result as “success”, otherwise
it would be marked as “miss”. If they could not find the target after some time (there
was no time limit, they could take as much time as they wanted), they could give up by
choosing “I cant find it” and proceed to the next task. After 5 tasks, the participant
would switch the input method from mouse to touch, or vice versa, and complete the
remaining 5 tasks.
During the experiment, the researcher remained in the room with the participant, to
observe and take notes of their interaction with the map as well as to answer questions
if necessary. The researcher did not provide any help or hint regarding how to find
the targets. The only occasions where the researcher would interrupt the participants
would be when they forget to change input method, or other unforeseeable incidents
happen.
3) After the experiment, participants were asked to fill out a post-experiment question-
naire (see Appendix 2), including their background information and their preference
of the two input methods, with both Likert scale evaluation and open questions.
4) The research conductor thanked the participant and offered to answer any remaining
questions from the participant. Then the research conductor explained to the partici-
pant that there are two “impossible tasks” in which the targets were not on the map,
so they should not feel bad about not being able to find those.
One session (10 tasks + questionnaire) lasted approximately 30 minutes. All the data
collected during the experiment is anonymous.

Methodology 24
3.6 Data Collection
3.6.1 Raw Data
The raw data collected are mouse and touch events captured by the browser and the
Leaflet API, arranged in a tabular format and saved as .csv files. Table 3.1 shows all
the captured event types. Each row of the csv file is an event with attributes such as
event type, time-stamp, X/Y screen coordinates, current zoom level, and number of
touches (if it is a touch event). In addition, specific button clicks were also logged,
which include the task start button, zoom-in/out buttons, “reset map” button, and
“found it” and “can’t find it” buttons. Figure 3.5 shows an example of the raw csv file
(first several rows).
Browser event Map event Other
click, dblclick,mousedown,mouseup,mousemove,touchstart,touchend,touchmove
dragstart,dragend,zoomstart,zoomend
session start,button click,task completed,task intro ok,task foundit,task result success,task result miss,task giveup,button zoomIn,button zoomOut,button resetMap
Table 3.1: Captured event types
Figure 3.5: Original csv file obtained from browser

Methodology 25
3.6.2 Measurements
From the raw data gathered in the browser, useful measurements can be derived.
Python scripts are used to process the raw data. More specifically, the open-source
Python packages pandas4 (version 0.19.0) and Numpy5 (version 1.11.2) are used be-
cause they are well suited for analyzing tabular data and are widely employed in the
scientific community.
Some measurements can be directly filtered from the raw data, for example the X
and Y screen coordinates of touch and mouse locations, and zoom levels. Others need
further calculation, such as drag length, drag direction, drag and zoom frequency, and
task completion time. The rest of this section gives a detailed description of how these
measurements are obtained.
Task completion time
The task completion time is calculated from the moment the user click or tap “OK” on
the task introduction box (corresponding event type “task intro ok”), to the moment
they click or tap “found it” (corresponding event type “task foundit”) or “cannot find
it” (corresponding event type “task giveup”) on the top task bar.
Touch and mouse locations
Most events have the attributes of X and Y screen coordinates. However, events in
the column “map event” in Table 3.1 do not have X and Y information. Therefore,
for mouse zooms, the coordinates of the preceding “mousemove” event are given to
“zoomstart” and “zoomend” (we assume they are at the same position); for pinch-
to-zoom, the value of the center point between the two touch positions before the
zooming starts is assigned to “zoomstart”. For a “dragstart” or “dragend” event, the
coordinates of the previous event are assigned to it.
4http://pandas.pydata.org/5http://www.numpy.org/

Methodology 26
Drag length
Drag means the user moves (or pans) the map for a distance. In the event log this is
identified by a “dragstart” event, followed by a series of “mousemove” or “touchmove”
events and ends with “dragend”. For each drag (i.e. dragstart-dragend pair), the drag
length is calculated by summing up all the increments of neighboring dragmove points
within this drag, that is:
∑i
√(xi − xi−1)2 + (yi − yi−1)2
where i denotes the set of points within this drag. Figure 3.6 shows the relevant code
snippet. Figure 3.7 shows a snippet of the processed drag length file.
Figure 3.6: Code snippet for calculating drag length
Figure 3.7: First several lines of the processed drag length file
In the end, all drag length can be acquired by extracting all the “dragend” events and
the “length” column shows the length of each drag.
Methodology 27
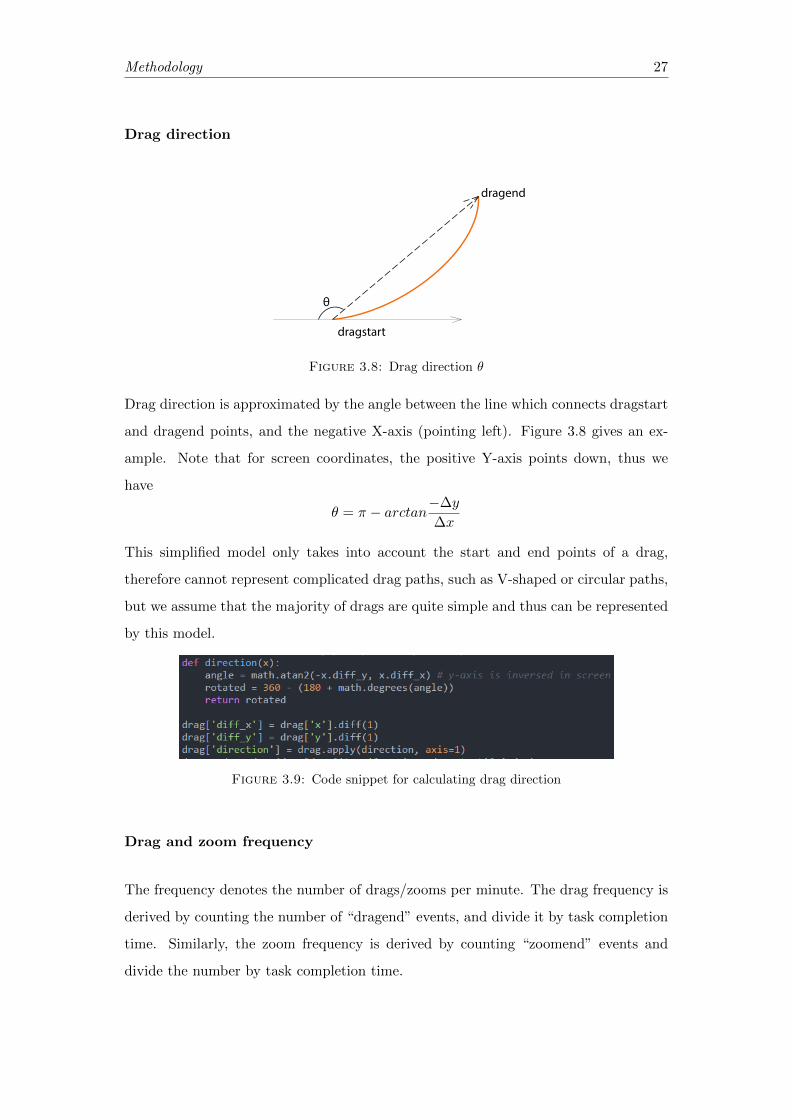
Drag direction
dragstart
dragend
θ
Figure 3.8: Drag direction θ
Drag direction is approximated by the angle between the line which connects dragstart
and dragend points, and the negative X-axis (pointing left). Figure 3.8 gives an ex-
ample. Note that for screen coordinates, the positive Y-axis points down, thus we
have
θ = π − arctan−∆y
∆x
This simplified model only takes into account the start and end points of a drag,
therefore cannot represent complicated drag paths, such as V-shaped or circular paths,
but we assume that the majority of drags are quite simple and thus can be represented
by this model.
Figure 3.9: Code snippet for calculating drag direction
Drag and zoom frequency
The frequency denotes the number of drags/zooms per minute. The drag frequency is
derived by counting the number of “dragend” events, and divide it by task completion
time. Similarly, the zoom frequency is derived by counting “zoomend” events and
divide the number by task completion time.
Methodology 28
3.6.2.1 Zooming operation
In addition, different ways of zooming—pinch-to-zoom, zoom by mouse wheel, double
click/tap, and zoom buttons—are recorded.
3.6.3 Observation and User Feedback
Quantitative measures alone cannot reflect how exactly did users interact with the
map. In addition to the event log, direct observations of how users interact with
the map system were made. During the lab session, the research conductor observed
user interactions with the device and noted down interesting usage patterns as well
as frequent problems. In addition, video recordings also help to analyze the user
interaction, in case that the research conductor missed any important user behaviors.
Subjective feedback was collected in the post-test questionnaire. Participants were
asked to rate how easy it is for them to use mouse and touch respectively, from “very
difficult” to “very easy”, and give reasons for their preference of mouse or touch.
3.7 List of Hypotheses
Based on findings in the existing literature and the author’s experience, the following
hypotheses are made:
(1) The task completion time in mouse- and touch-based interactions would be similar.
However, the “give-up-time” would be shorter in the touch condition due to fatigue.
(2) Mouse and touch locations on the screen will show different patterns. More specif-
ically, the touch locations would be more concentrated in the center of the screen than
mouse locations, because reaching for a position near the far corner of the screen using
the arm requires more physical work than doing it with the mouse.
(3) The drag (pan) length in the touch condition would be shorter than in the mouse
condition.

Methodology 29
(4) The drag (pan) directions in the mouse and touch conditions would have different
patterns.
(5) Mouse and touch input will have different drag/zoom frequencies: a). users
drag(pan) the map more frequently when using touch; b). users zoom the map more
frequently when using touch.
Chapter Summary
This chapter gave a detailed description of the research design of this thesis, including
the participants, hardware and software used in the experiment, the tasks, procedure,
and data collection methods. Next chapter will present and discuss the results of the
user study.

Chapter 4
Results and Discussion
The user study sessions were conducted between October and December of 2016.
Twenty participants each performed 10 target search tasks (5 for each input method)
using the same large screen. Usage data was collected and processed as described in
the previous chapter. The results are presented and discussed here.
4.1 Quantitative Results
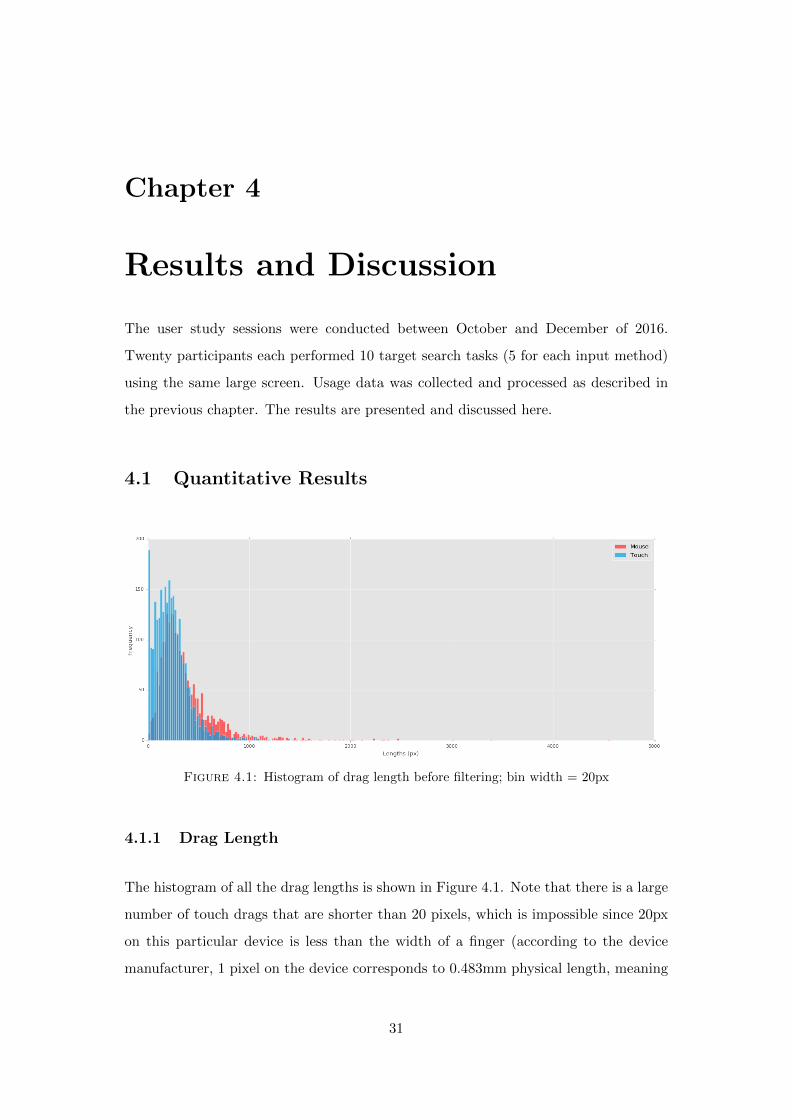
Figure 4.1: Histogram of drag length before filtering; bin width = 20px
4.1.1 Drag Length
The histogram of all the drag lengths is shown in Figure 4.1. Note that there is a large
number of touch drags that are shorter than 20 pixels, which is impossible since 20px
on this particular device is less than the width of a finger (according to the device
manufacturer, 1 pixel on the device corresponds to 0.483mm physical length, meaning
31

Results and Discussion 32
20px is less than a centimeter). The author argues that “drags” less than 20px (
20×0.483 = 9.66mm ≈ the width of a finger) should not counted as “drag” but rather
logging errors, and should be filtered out. Figure 4.2 shows the filtered version of the
histogram. Also note that the histogram only shows drag lengths of up to 1600px, due
to page width limitation.
Figure 4.2: Histogram of drag length after filtering; bin width = 20px
At first glance we can see that the drag lengths of touch and mouse input overlap a
lot, and both have the most frequent length of around 200px. However, more touch
drags are shorter than 200px while more mouse drags are longer than 400px.
Figure 4.3: Box plot of drag length

Results and Discussion 33
Another way to show the drag length distribution is through the box plot (Figure
4.3). The whiskers in the box plot represent the 2nd and 98th percentile; means are
represented by blue stars; medians are purple lines. All the data points that are outside
the 2nd and 98th percentile are considered to be outliners and are not shown on the
plot.
The result suggests that when using touch, the drag lengths tend to be shorter than
using mouse. In other words, the users tend to pan the map for a shorter distance in
the touch condition.
The overall trend could be caused by individual participants who like to use short drag
lengths. Therefore, to further examine the relation between mouse and touch drag
length, the mean touch drag length was plotted against the mean mouse drag length
for each participant. It can be seen that all the dots are below the x=y line, meaning
that for all participants, their mean touch drag length is shorter than their mouse drag
length, which is consistent with the overall pattern.
Figure 4.4: Mean drag length of each participant

Results and Discussion 34
4.1.2 Drag Direction
Figure 4.5: Drag direction of mouse(left) and touch(right)
Based on the calculation described in section 3.5, the drag directions are grouped into
10-degree intervals, i.e. 36 direction groups, and are plotted as polar bar charts (Figure
4.5).
From the charts, it can be seen that there are different patterns for mouse and touch
drag directions, which confirms the author’s hypothesis. In the mouse condition, users
are most likely to drag the map vertically or near-vertically, and least likely to drag
the map horizontally. The axis of symmetry is (nearly) the vertical and horizontal line.
In the touch condition, users are most likely to drag the map somewhat diagonally,
i.e. in the near-“north-east” and “south-west” directions, with about 10 to 40 degrees’
deviation from the vertical direction. The axis of symmetry is approximately the 30 –
210 degree line. Moreover, comparing to the mouse condition, users are more likely to
drag the map horizontally.
The reasons for the different patterns can be summarized as follows:
- Minimizing movement: when using touch, the user’s right hand is usually at a position
shown in Figure 4.6. At this position, to keep the finger’s contact with the screen, it
is more natural to move the hand (or fingers) in the “north-east” and “south-west”
directions, because the user only needs to slightly rotate the hand. To drag the map
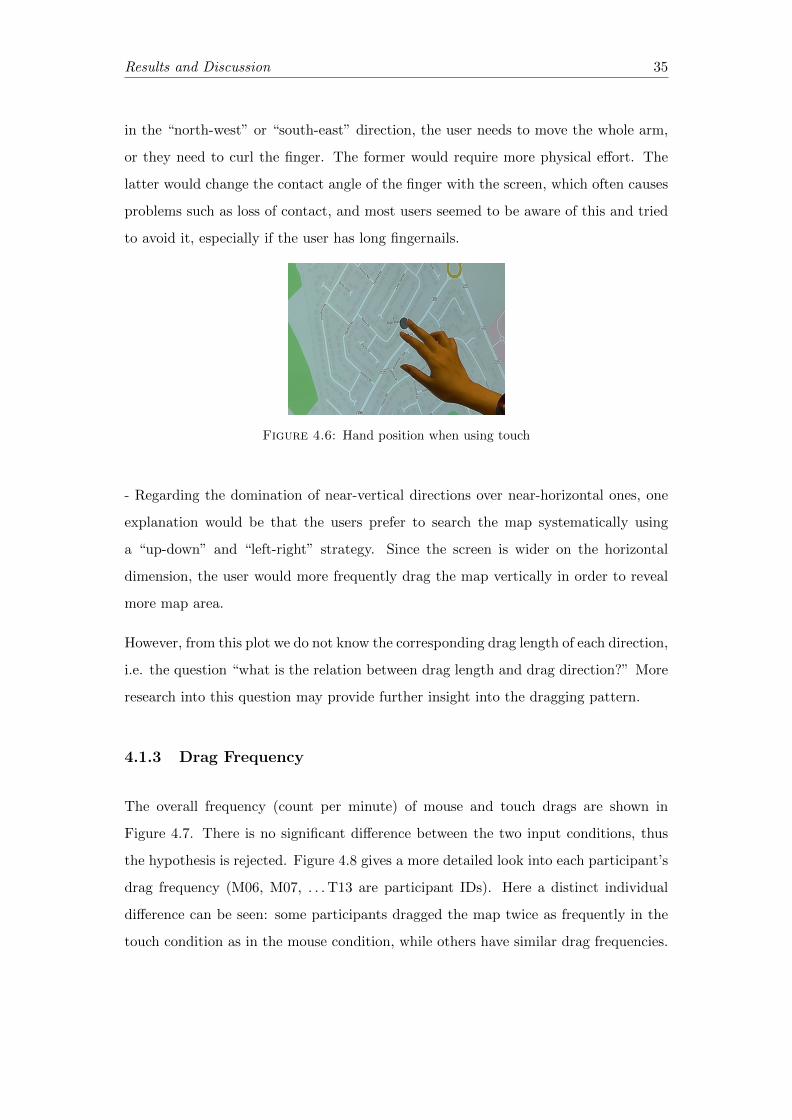
Results and Discussion 35
in the “north-west” or “south-east” direction, the user needs to move the whole arm,
or they need to curl the finger. The former would require more physical effort. The
latter would change the contact angle of the finger with the screen, which often causes
problems such as loss of contact, and most users seemed to be aware of this and tried
to avoid it, especially if the user has long fingernails.
Figure 4.6: Hand position when using touch
- Regarding the domination of near-vertical directions over near-horizontal ones, one
explanation would be that the users prefer to search the map systematically using
a “up-down” and “left-right” strategy. Since the screen is wider on the horizontal
dimension, the user would more frequently drag the map vertically in order to reveal
more map area.
However, from this plot we do not know the corresponding drag length of each direction,
i.e. the question “what is the relation between drag length and drag direction?” More
research into this question may provide further insight into the dragging pattern.
4.1.3 Drag Frequency
The overall frequency (count per minute) of mouse and touch drags are shown in
Figure 4.7. There is no significant difference between the two input conditions, thus
the hypothesis is rejected. Figure 4.8 gives a more detailed look into each participant’s
drag frequency (M06, M07, . . . T13 are participant IDs). Here a distinct individual
difference can be seen: some participants dragged the map twice as frequently in the
touch condition as in the mouse condition, while others have similar drag frequencies.

Results and Discussion 36
Therefore it cannot be concluded that user drags more frequently using one of the
input methods than the other.
Figure 4.7: Box plot of drag frequency
Figure 4.8: Drag frequency of each participant
4.1.4 Zoom Frequency
The overall frequency of mouse and touch zooms are shown in Figure 4.9. The result
shows no significant difference between the two input conditions, thus the original hy-
pothesis is again rejected. However, touch-based zooming has a much higher variation.

Results and Discussion 37
This might be caused by the accidental zooming (discussed in section 4.2), which hap-
pened more frequently to some participants than the others. Figure 4.10 gives a more
detailed look into each participant’s zoom frequency.
Figure 4.9: Box plot of zoom frequency
Figure 4.10: Zoom frequency of each participant
The lack of significant difference in drag/zoom frequencies indicates that touch input
does not necessarily lead to a more frequent interaction between the user and the map.
4.1.5 Mouse and Touch Location
Figure 4.11 and 4.12 show the “heatmap” of mouse and touch points of all the par-
ticipants. The hypothesis that touch and mouse locations on the screen have different

Results and Discussion 38
patterns, and that touch would be more concentrated on the center of the screen is
confirmed. We can see that the touch input covers a smaller area on the screen and
mainly concentrates in the lower-middle part. A large portion of the screen is left
untouched.
Figure 4.11: Mouse locations
Figure 4.12: Touch locations

Results and Discussion 39
4.1.6 Task Completion Time
Since there were two “impossible tasks” (task no.5 and no.10), the time of these two are
evaluated separately from the other eight tasks. Also, sometimes the participant could
not find the target even if it is not task no.5 or no.10, these data points (14 in total)
were omitted from the analysis because they cannot be considered as “completed”.
Figure 4.13 shows the mean completion time of the two input methods. Figure 4.14
shows the mean completion time of each task. From the plot we cannot conclude that
input modality has any effect on the speed of which a user completes the tasks. The
long error bars indicate big individual differences.
Figure 4.13: Mean completion time for mouse and touch
Figure 4.14: Mean time for eight tasks

Results and Discussion 40
For the “impossible tasks”, we examined how long they spent on these tasks before
giving up. The result is shown in Figure 4.15. Again there is no significant difference
between the two conditions.
Figure 4.15: Mean time for impossible tasks
4.2 Observations of Participant Behavior
Both in situ observation and video recordings were used to identify noteworthy par-
ticipant behavior. This section summarizes the observed usage patterns and problems
occurred during the interaction.
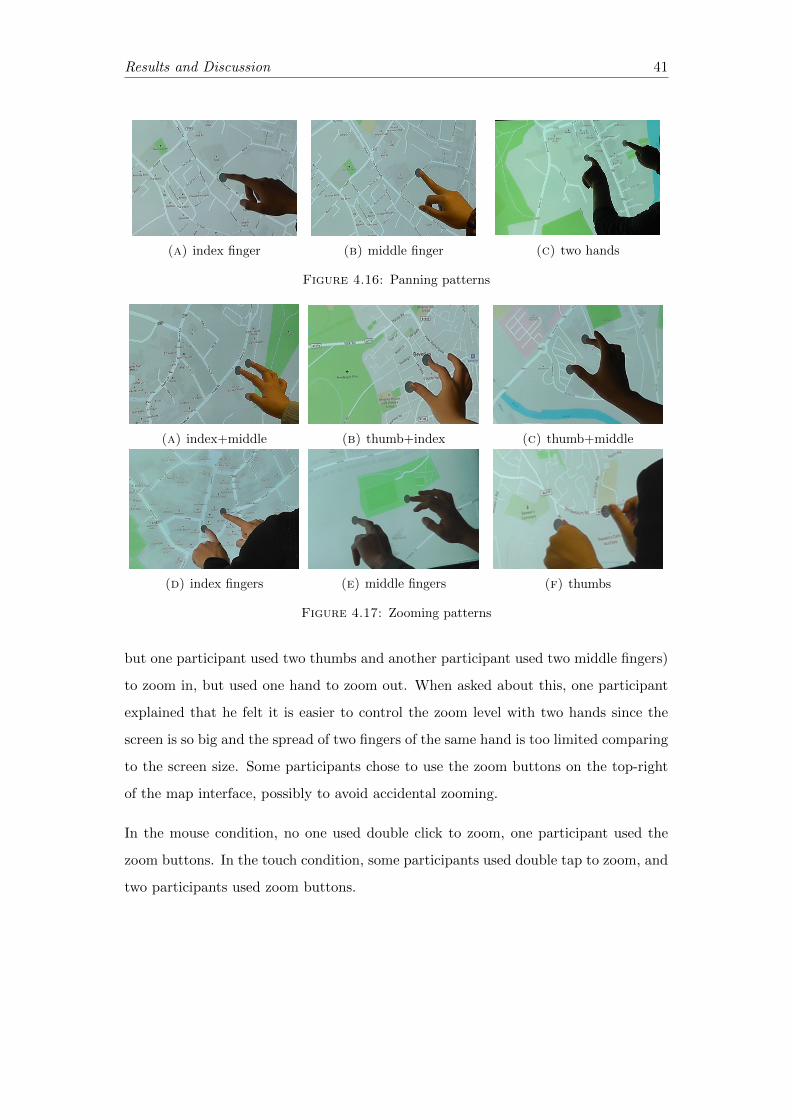
Panning patterns
Most participants used one finger (index or middle finger) to pan. A few used two
fingers (index+middle) or even two hands (one finger of each hand).
Zooming patterns
Most participants used pinch to zoom in and out, as they would do on their mobile
phones, using thumb + index finger or thumb + middle finger. Some used index +
middle fingers. Some used two hands (one finger of each hand, mostly index fingers
Results and Discussion 41
(a) index finger (b) middle finger (c) two hands
Figure 4.16: Panning patterns
(a) index+middle (b) thumb+index (c) thumb+middle
(d) index fingers (e) middle fingers (f) thumbs
Figure 4.17: Zooming patterns
but one participant used two thumbs and another participant used two middle fingers)
to zoom in, but used one hand to zoom out. When asked about this, one participant
explained that he felt it is easier to control the zoom level with two hands since the
screen is so big and the spread of two fingers of the same hand is too limited comparing
to the screen size. Some participants chose to use the zoom buttons on the top-right
of the map interface, possibly to avoid accidental zooming.
In the mouse condition, no one used double click to zoom, one participant used the
zoom buttons. In the touch condition, some participants used double tap to zoom, and
two participants used zoom buttons.

Results and Discussion 42
Problems regarding using the device
Zooming Sometimes the pinch-to-zoom gesture led to unexpected outcomes. When
the user wanted to zoom in but did not stretch their fingers wide enough, the map
would bounce back to the lower zoom level. Or they wanted to zoom in/out one level
but the map jumps several levels instead.
The zoom levels of the map are only integers, for instance it changes from 15 to 16
without any intermediate states. However, many users seemed to expect the map to
zoom continuously with their fingers pinching and stretching and stay precisely at their
desired scale. This leads to the map ”bouncing” back to its zoom level before the pinch
gesture.
Panning Sometimes when the user wanted to pan the map, it zoomed instead, or it
did not move at all.
These false responses seem to be more likely to occur when the screen is not clean,
i.e. when previously used by others. However, even if the screen was cleaned by the
researcher before the lab session, problems still existed. Another cause can be that the
users’ fingers were not dry and clean.
Strategies when encountering problems
When the participants encountered problems, for example when they wanted to pan
the map but it did not respond or zoomed instead, or they tried to zoom but the
map did not respond or zoomed in the wrong direction, they used different strategies.
Some participants just kept repeating the gesture until the map zooms or pans as they
intended; some added the other hand to help to zoom, while others chose to use the
zoom buttons and/or double tap to zoom in instead.
Some participants (7 out of 20) noticed the ”Reset Map” button and used it when they
were disoriented, for example when they pan the map too far away from the original
center, or the map zoomed in too many levels accidentally.

Results and Discussion 43
Change of hands
Some participants switched to their left hand after spending some time touching the
screen with their usual right hand. The change of hands can be very brief, i.e. only
several seconds, but can also last for a few minutes. A few participants used both
hands alternately. This is supposedly due to fatigue after lifting one arm for too long
(one session normally lasts more than 10 minutes), and the user feedback shows it is
indeed the reason (see next section).
4.3 User Feedback
4.3.1 User Preference
User feedback was collected using post-test questionnaires. Figure 4.18 shows the
participants’ opinions of mouse and touch, respectively. The overall result suggests a
clear preference towards mouse input. 17 participants rated mouse input as “easy” or
“very easy” to use, while only 10 participants rated so for touch input. 6 participants
thought that the touch input is “slightly difficult” and 1 participant even rated the
touch as “very difficult” to use.
Figure 4.18: Participants’ opinion of mouse and touch

Results and Discussion 44
Reasons for preferring mouse
15 out of 20 participants (75%) preferred mouse over touch. Their reasons for preferring
mouse can be summarized as follows:
Familiarity The participants were more familiar, or had more experience with the
mouse, therefore they felt more confident while using it.
Physical comfort Those participants felt more “comfortable” using the mouse, be-
cause it requires less movement of hands and arms. The touch input, on the contrary,
makes them feel tired easily after a short while, especially for a device this big.
Easiness/precision of control As can be confirmed by in situ observation, most
participants reported problems when using touch to zoom and pan, saying that the
touch input did not always work as they intended. For example, sometimes they
wanted to pan the map by sliding the finger, but the map zoomed instead, or they
tried pinch-to-zoom but the map failed to do so. These behaviors made them feel
“frustrated” and “insecure” when using the touch input, while mouse input did not
have such problems and always worked precisely as the users intended.
Better overview A few participants expressed that they could get a better overview
of the whole area when using mouse, because they could sit further away from the screen
and not only focus on the area around their hand. They felt that this can make their
search of the targets easier.
Reasons for preferring touch
The other 5 participants (25%) preferred the touch input. Their reasons include:

Results and Discussion 45
Easiness of control Exactly opposite to what others have said, they felt that the
touch input is easier to zoom in/out and drag the map around. Although they also
had problems when using touch, they were not particularly frustrated by that.
More intuitive Some participants felt it is more intuitive and natural to use the
hand as the pointing device, because they could directly move the map instead of using
a mouse as a mediator.
Better immersion One participant felt that she was more “involved” with the map
when using touch, possibly because the user was sitting closer to the large screen, hence
she felt that she was “surrounded” by the map.
4.3.2 Other complaints
Some participants mentioned that for a screen this big (42 inches), the information
shown is too sparse. This concerns the design of the map, and is out of the scope of
this thesis. However, it suggests that a separate study about large screen size and its
influence on map design would be of value.
Some also said that a physical setup like this is somewhat “strange” because it is
too large and too close to the user, making them uncomfortable. Admittedly, the
setup (vertical installation and sitting position) used in this thesis is unusual in the
real world, it is only used here to limit the number of independent variables in the
experiment. More research is needed to investigate different setups, for example when
users are standing instead of sitting, and when the device is horizontally installed.
4.4 Discussion
From the results concerning dragging (panning), we can see that longer panning dis-
tance comes more natural in mouse-based map interaction, while users tend to have
shorter panning distances in touch-based interaction. The different panning distances

Results and Discussion 46
may be caused by the fact that users were sitting more closely to the screen when using
touch, thus looked at the map more in detail. However, it should be noted that al-
though participants used shorter panning distance in the touch condition, they did not
use the panning operation significantly more frequently. The longer panning distance
in mouse-based interaction may also be related to the mouse speed (a higher mouse
speed means the mouse pointer moves faster and requires less effort to get across the
screen). A small movement of the mouse can result in a long panning distance, while
the ratio for touch is 1:1 (in terms of distance on screen, not considering map scale).
For inexperienced mouse users, the variation in mouse speed may take time to get used
to, while touch-based interaction seems to offer more direct control (the map moves
directly with the fingers sliding across the surface).
Users mainly pan the map in the north-south direction when they are scanning for
targets under the mouse condition, while under the touch condition, there are more
diagonal panning directions. This difference in panning direction patterns is supposedly
due to the hand position (as discussed in 4.1.2), but does this affect the map user’s
actual map reading process? To answer this question, combining eye movement data
might be a necessary next step.
The difference in mouse and touch locations shows that the area covered by touch
is more limited, although they both concentrate in the center of the screen. This
indicates that map users are unlikely to extend their arms to reach towards the edge
of the screen. Of course this result can be caused by the physical setup, where users
were sitting in front of the vertical display.
The completion time shows that the task performances under the two conditions are
not significantly different. This means neither input method is “superior” than the
other, at least in target search tasks. However, when choosing the computing device
for cartographic products, “efficiency” should not be the only criterion, other factors
such as fatigue and spatial memory also worth taking into account (Forlines et al.,
2007).
The results from user behavior observation suggest that when designing a cartographic
product on large multi-touch screen, UI elements such as “reset to default view” and

Results and Discussion 47
zoom in/out buttons should be displayed on the screen as a fallback when the gestures
fail to work properly. Moreover, false responses are frustrating and should be avoided.
For touch-based interaction, the discrete zoom levels often confuse the users, thus
continuous zooming is required.


Chapter 5
Conclusion and Outlook
5.1 Summary
The study presented in this thesis compared the use of the relatively new multi-touch
input with traditional mouse input, in the context of map interaction on a large screen.
A controlled user study was conducted to collect users’ mouse and touch behavior in
target search tasks. Several measurements were used to evaluate the difference (or
similarity) between the two input methods—drag length, drag direction, drag and
zoom frequency, touch/mouse on-screen locations, and time spent on tasks.
The results suggest that there are indeed differences between the two input methods:
when using touch, users pan the map differently from when they are using the mouse,
with shorter panning distances and different main panning directions. The touch lo-
cations are also different from mouse locations, concentrating in the lower-middle part
of the screen. Contrary to the hypotheses, the drag and zoom frequencies of the two
input methods are quite similar. The task completion times also show no significant
difference. This indicates that the multi-touch input does not make the users interact
with the map more frequently, nor does it prove to be more efficient in the target
searching tasks.
User feedback shows a clear preference of mouse input. Their reasons for preferring
the mouse include familiarity, physical comfort, easiness and precision of control, and
a better overview of the map. Too many false responses and fatigue are the main
complaints towards the touch input. In addition, direct observations identified a list
of panning and zooming patterns, and frequent problems occurred during the touch
interaction.
49
Conclusion and Outlook 50
5.2 Future Work
Due to time constraints, only 20 participants were recruited in this study. This could
be the reason for the lack of statistically significant results, thus more participants
should be recruited in future studies.
To make a cartographic application available to as many people as possible, it is also
necessary to consider different user groups. The participants in this study were all
between 19 and 38 years old and all quite familiar with touch technology and web
maps. It would be interesting to include people from different age groups, educational
backgrounds, and with varying degrees of expertise concerning the device or maps. For
example, we could include older users who are not familiar with new technologies, or
a group of young children who have never used web maps, etc.
More research can be done to further investigate dragging (panning) patterns. As
described in 3.6.2, the calculation of the drag direction is highly simplified, thus a
more accurate representation of drag directions should be created. Also, the relation
between drag length and direction needs to be further explored.
One challenge during the experiment design was choosing the proper tasks. A more
rigorous process of task selection should be established for future studies. What are
the criteria for evaluating task difficulties? Moreover, it would be worthwhile to test
if and how different input devices affect user’s performance on various types of car-
tographic tasks. Kiefer, Giannopoulos, and Raubal (2013) used the characteristics of
eye movements to identify tasks such as free exploration, target search, route plan-
ning, etc. Similarly, we can study how users perform these tasks differently in touch-
and mouse-based interaction, and whether certain input modality is better suited for
certain types of task.
Different physical setups, for example sitting versus standing, different angles of the
device installation (horizontal or vertical or oblique), and varying head-to-screen dis-
tances, are also worth more research. Admittedly the setup used in this thesis is not
very common in real-world situations, where the users are usually standing when in-
teracting with the map. Those different setups may yield different usage patterns.

Conclusion and Outlook 51
However, if it turns out that there are common patterns in all these different setups,
they would be the basis to develop guidelines for multi-touch cartographic applications
in general.
A single-user setting was used in this study. It would be worthwhile to explore the
potential of the large multi-touch screen for multi-user collaborative cartographic ap-
plications, because such a large screen is unlikely to be owned by a single user but
more often used by a group of people.
A few users pointed out that when they are using touch, their views tend to focus on
the map area around their hands. Eye tracking can be used to verify this statement,
perhaps similar to the eye-hand coordination research by Coltekin, Demsar, Brychtova,
and Vandrol (2014). In this study, only screen coordinates were logged and analyzed.
To further understand the map using process under different input conditions, the
actual geographic coordinates should also be recorded.
This thesis used a general purpose slippy map as the stimuli. More specific applications
can be developed, for example, an interactive thematic map, or a map for navigation
in a museum or university campus.
To conclude, this thesis is an initial investigation into the comparison of mouse- and
touch-based map interaction on large screens. Based on the study presented here,
more research can be designed to further explore cartographic interaction on large
multi-touch devices.

References
Andrienko, G. L., & Andrienko, N. V. (1999). Interactive maps for visual data ex-
ploration. International Journal of Geographical Information Science, 13 (4),
355–374. doi: 10.1080/136588199241247
Ardito, C., Buono, P., Costabile, M. F., & Desolda, G. (2015). Interaction with
Large Displays: A Survey. ACM Computing Surveys, 47 (3), 1–38. doi: 10.1145/
2682623
Artinger, E., Coskun, T., Schanzen-Bach, M., Echtler, F., Nestler, S., & Klinker, G.
(2011). Exploring Multi-touch Gestures for Map Interaction in Mass Casualty
Incidents..
Axis Maps. (2015). Zooming In On History. Retrieved 2016-12-01, from http://
www.axismaps.com/projects/bpl/
Beheshti, E., Van Devender, A., & Horn, M. (2012). Touch, click, navigate. In
Proceedings of the 2012 acm international conference on interactive tabletops
and surfaces - its ’12 (p. 205). New York, New York, USA: ACM Press. doi:
10.1145/2396636.2396669
Bellucci, A., Malizia, A., & Aedo, I. (2014). Light on horizontal interactive surfaces.
ACM Computing Surveys, 46 (3), 1–42. doi: 10.1145/2500467
Buxton, B. (2016). Multi-Touch Systems that I Have Known and Loved. Retrieved
2016-12-01, from http://www.billbuxton.com/multitouchOverview.html
CNN. (2008). The inventor behind CNN’s election ’Magic Wall’ - CNN.com. Re-
trieved 2016-12-01, from http://edition.cnn.com/2008/TECH/11/04/magic
.wall/index.html
53
References 54
Coltekin, A., Demsar, U., Brychtova, A., & Vandrol, J. (2014). Eye-hand coordination
during visual search on geographic displays. In Proceedings of the 2nd interna-
tional workshop on eye tracking for spatial research (et4s 2014) (pp. 12–16).
Coltekin, A., Heil, B., Garlandini, S., & Fabrikant, S. I. (2009). Evaluating the
Effectiveness of Interactive Map Interface Designs: A Case Study Integrating
Usability Metrics with Eye-Movement Analysis. Cartography and Geographic
Information Science, 36 (1), 5–17. doi: 10.1559/152304009787340197
Dietz, P., & Leigh, D. (2001). DiamondTouch. In Proceedings of the 14th annual acm
symposium on user interface software and technology - uist ’01 (p. 219). New
York, New York, USA: ACM Press. doi: 10.1145/502348.502389
DOKLAB. (2014). Interactive Map. Retrieved 2017-01-09, from http://www.doklab
.nl/en/project/interactive-map/
Forlines, C., Wigdor, D., Shen, C., & Balakrishnan, R. (2007). Direct-touch vs. Mouse
Input for Tabletop Displays. In (pp. 647–656). New York, NY, USA: ACM. doi:
10.1145/1240624.1240726
Haklay, M., Singleton, A., & Parker, C. (2008). Web Mapping 2.0: The Neogeography
of the GeoWeb. Geography Compass, 26 (10). doi: 10.1111/j.1749-8198.2008
.00167.x
Han, J. Y. (2005). Low-cost multi-touch sensing through frustrated total internal
reflection. In Proceedings of the 18th annual acm symposium on user interface
software and technology - uist ’05 (p. 115). New York, New York, USA: ACM
Press. doi: 10.1145/1095034.1095054
Hansen, T. E., & Hourcade, J. P. (2010). Comparing Multi-touch Tabletops and
Multi-mouse Single-display Groupware Setups. In (pp. 36–43). San Luis Potosı,
S.L.P. Mexico, Mexico: Universidad Politecnica de San Luis Potosı.
Harrower, M., & Sheesley, B. (2005). Designing Better Map Interfaces: A Framework
for Panning and Zooming. Transactions in GIS , 9 (2), 77–89. doi: 10.1111/

References 55
j.1467-9671.2005.00207.x
Hinrichs, U., & Carpendale, S. (2011). Gestures in the wild: : Studying Multi-Touch
Gesture Sequences on Interactive Tabletop Exhibits. In Proceedings of the 2011
annual conference on human factors in computing systems - chi ’11 (p. 3023).
New York, New York, USA: ACM Press. doi: 10.1145/1978942.1979391
Hornecker, E. (2008). ”I don’t understand it either, but it is cool” - Visitor interactions
with a multi-touch table in a museum. In 2008 ieee international workshop
on horizontal interactive human computer system, tabletop 2008 (pp. 113–120).
IEEE. doi: 10.1109/TABLETOP.2008.4660193
Isenberg, P., & Isenberg, T. (2013). Visualization on Interactive Surfaces: A Research
Overview. I-Com, 12 (3), 10–17. doi: 10.1515/icom.2013.0020
Kasday, L. R. (1984). Touch position sensitive surface. Google Patents. (US Patent
4,484,179)
Kiefer, P., Giannopoulos, I., & Raubal, M. (2013). Using Eye Movements to Recognize
Activities on Cartographic Maps. In (pp. 488–491). New York, NY, USA: ACM.
doi: 10.1145/2525314.2525467
Kin, K., Agrawala, M., & DeRose, T. (2009). Determining the Benefits of Direct-touch,
Bimanual, and Multifinger Input on a Multitouch Workstation. In (pp. 119–124).
Toronto, Ont., Canada, Canada: Canadian Information Processing Society.
Mehta, N. (1982). A Flexible Machine Interface (Master’s thesis). University of
Toronto, Toronto, Canada.
Muehlenhaus, I. (2013). Web Cartography: Map Design for Interactive and Mobile
Devices. Boca Raton: CRC Press. doi: 10.1080/14498596.2015.1006113
Nagel, T., Maitan, M., Duval, E., Moere, A. V., Klerkx, J., Kloeckl, K., & Ratti, C.
(2014). Touching Transport - a Case Study on Visualizing Metropolitan Public
Transit on Interactive Tabletops. In (pp. 281–288). New York, NY, USA: ACM.
References 56
doi: 10.1145/2598153.2598180
Pedersen, E. W., & Hornbæk, K. (2012). An experimental comparison of touch interac-
tion on vertical and horizontal surfaces. In Proceedings of the 7th nordic confer-
ence on human-computer interaction making sense through design - nordichi ’12
(p. 370). New York, New York, USA: ACM Press. doi: 10.1145/2399016.2399074
Peterson, M. (2008). Maps and the Internet: What a Mess It Is and How To Fix It.
Cartographic Perspectives, 0 (59), 4–11. doi: 10.14714/CP59.244
Poplin, A. (2015, aug). How user-friendly are online interactive maps? Survey based on
experiments with heterogeneous users. Cartography and Geographic Information
Science, 42 (4), 358–376. doi: 10.1080/15230406.2014.991427
Ronneberg, M., Sarjakoski, T., & Sarjakoski, L. T. (2014). Developing a Multi-
Touch Map Application for a Large Screen in a Nature Centre. Nordic journal
of surveying and real estate research, 10 (1).
Roth, R. E. (2013). Interactive maps: What we know and what we need to know.
Journal of Spatial Information Science, 2013 (6), 59–115. doi: 10.5311/JOSIS
.2013.6.105
Roth, R. E., Donohue, R. G., Sack, C. M., Wallace, T. R., & Buckingham, T. M. A.
(2015). A Process for Keeping Pace with Evolving Web Mapping Technologies.
Cartographic Perspectives(78), 25–52. doi: 10.14714/CP78.1273
Ryall, K., Morris, M. R., Everitt, K., Forlines, C., & Shen, C. (2006). Experiences
with and observations of direct-touch tabletops. In Proceedings of the first ieee
international workshop on horizontal interactive human-computer systems, table-
top’06 (pp. 8 pp.–).
Schoning, J., Brandl, P., Daiber, F., Echtler, F., Hilliges, O., Hook, J., . . . Zadow,
U. V. (2008). Multi-Touch Surfaces : A Technical Guide. Technical Report
TUM-I0833 (Tech. Rep.). Technical University of Munich.
References 57
von Zadow, U., Daiber, F., Schoning, J., & Kruger, A. (2012). GeoLens: Multi-User
Interaction with Rich Geographic Information. Proc. DEXIS 2011 , 16–19.
W3C. (n.d.). HTML & CSS - W3C. Retrieved 2017-01-23, from https://www.w3.org/
standards/webdesign/htmlcss
White, J. (2009). Multi-touch Interfaces and Map Navigation (Master’s thesis, Univer-
sity of Wisconsin–Madison). Retrieved from https://minds.wisconsin.edu/
handle/1793/47065
Wigdor, D., Penn, G., Ryall, K., Esenther, A., & Shen, C. (2007). Living with a
Tabletop: Analysis and Observations of Long Term Office Use of a Multi-Touch
Table. In Second annual ieee international workshop on horizontal interactive
human-computer systems (tabletop’07) (pp. 60–67). IEEE.
Woodruff, A., & Foster, M. (2014). Web maps 101 [Online Tutorial]. Retrieved from
http://maptimeboston.github.io/web-maps-101
Wu, F.-G., Lin, H., & You, M. (2011). The enhanced navigator for the touch screen:
A comparative study on navigational techniques of web maps. Displays, 32 (5),
284–295. doi: 10.1016/j.displa.2011.05.007

Appendix 1. Pre-test Instructions
Hello! Thank you for coming to the study. Please have a seat. This study is about how
people use interactive maps. There will be a lab session where you need to finish some
tasks using the device we provide you, then you need to fill in a questionnaire about
some background information and your experience during the lab session. To help us
better analyze the data afterwards, the lab session will be video recorded, but your
face will not be in the video, and all the data we collect during the study is anonymous.
Do you have any questions so far?
You will use 2 input methods: mouse and touch. There will be instructions on the
screen to inform you when you need to change the method. There is no time limit for
the tasks, and its not a test of your ability of any kind, so dont feel like you need to
rush, just perform as you would normally do, and read the instructions on the screen
carefully. During the session I wont give you any instructions or help, unless there is
a technical problem.
OK. If you don’t have any questions, please follow me to the lab.
59

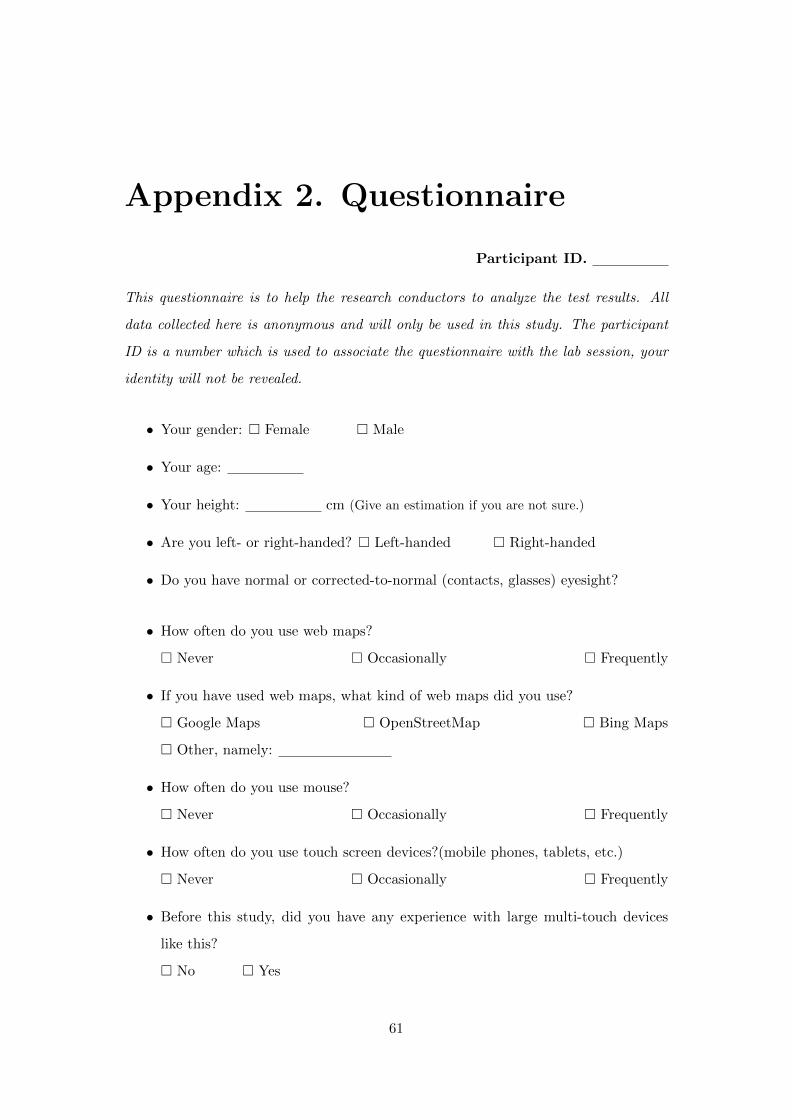
Appendix 2. Questionnaire
Participant ID.
This questionnaire is to help the research conductors to analyze the test results. All
data collected here is anonymous and will only be used in this study. The participant
ID is a number which is used to associate the questionnaire with the lab session, your
identity will not be revealed.
• Your gender: � Female � Male
• Your age:
• Your height: cm (Give an estimation if you are not sure.)
• Are you left- or right-handed? � Left-handed � Right-handed
• Do you have normal or corrected-to-normal (contacts, glasses) eyesight?
• How often do you use web maps?
� Never � Occasionally � Frequently
• If you have used web maps, what kind of web maps did you use?
� Google Maps � OpenStreetMap � Bing Maps
� Other, namely:
• How often do you use mouse?
� Never � Occasionally � Frequently
• How often do you use touch screen devices?(mobile phones, tablets, etc.)
� Never � Occasionally � Frequently
• Before this study, did you have any experience with large multi-touch devices
like this?
� No � Yes
61

• Do you have any previous knowledge about the towns shown in the study?
� No � Yes, I know about:
• Overall, the touch input was to use.
�very difficult �difficult �slightly difficult �slightly easy �easy �very easy
• Overall, the mouse input was to use.
�very difficult �difficult �slightly difficult �slightly easy �easy �very easy
• In this study, which input method do you prefer, touch or mouse? Why? (Give
at least one reason)
• Did you have any particular difficulty using the device or the map?
• Did you use any particular strategy for finding the places?
• Any other comments (complaints, suggestions, etc.)?
62