competing on creativity - urban.org
TRANSCRIPT
Competing on Creativity: Placing Ontario’s Cities in North American Context
A report prepared for the Ontario Ministry of Enterprise, Opportunity and Innovation
and the Institute for Competitiveness and Prosperity
Meric S. Gertler Richard Florida
Gary Gates Tara Vinodrai
November 2002

Executive Summary
Creativity has replaced raw materials or natural harbours as the crucial wellspring of economic growth. To be successful in this emerging creative age, regions must develop, attract and retain talented and creative people who generate innovations, develop technology-intensive industries and power economic growth. Such talented people are not spread equally across nations or places, but tend to concentrate within particular city-regions. The most successful city-regions are the ones that have a social environment that is open to creativity and diversity of all sorts. The ability to attract creative people in arts and culture fields and to be open to diverse groups of people of different ethnic, racial and lifestyle groups provides distinct advantages to regions in generating innovations, growing and attracting high-technology industries, and spurring economic growth.
This report examines the relationship between talent, technology, creativity and diversity in city-regions in Ontario – and Canada more generally – and compares these to the relationships found to exist in American metropolitan regions.
Our findings strongly indicate that the relationships first captured for US city-regions in the work of Florida and colleagues are also evident in Canadian city-regions. If anything, the relationships in Canada are stronger than those found in the United States. In particular, we find that a vibrant local creative class and openness to diversity attract knowledge workers in Ontario and Canada. We also find that, in general, Ontario city-regions have a solid foundation in these areas to compete against US city-regions. In summary, there appears to be a strong set of linkages between creativity, diversity, talent and technology-intensive activity that are driving the economies of Ontario’s – and Canada’s – city-regions.
For policy makers, this work confirms the importance of urban centres in the knowledge economy and the need to investigate further the importance of higher education in this knowledge economy. At the municipal level, this work points to the importance of collaborative efforts between local governments, firms, and individuals to reinforce and strengthen the unique urban character of their city-regions. For all Ontarians, this work underscores the importance of immigration and settlement, as well as the nurturing of arts and creativity.
ii

Table of Contents
Executive Summary .................................................................................................................. ii
Table of Contents..................................................................................................................... iii
List of Tables ............................................................................................................................ v
List of Figures ........................................................................................................................... v
1 Technology, Talent, Creativity and Diversity Create Advantages for City-Regions ........ 1
2 Data and Methods .............................................................................................................. 3 2.1 Key Variables........................................................................................................ 3
3 How do City-Regions in Ontario and Canada Perform? ................................................... 5 3.1 City-Regions in Ontario and Canada .................................................................... 5
3.2 Talent .................................................................................................................... 6
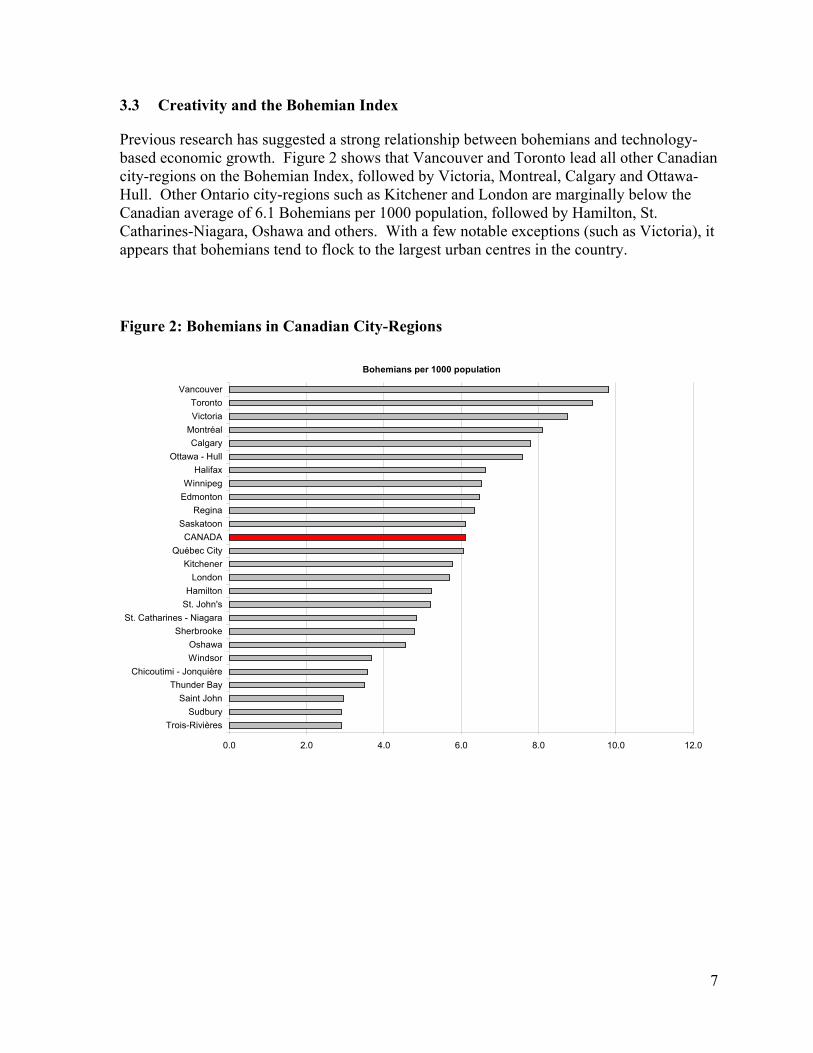
3.3 Creativity and the Bohemian Index ...................................................................... 7
3.4 Diversity and the Mosaic Index ............................................................................ 8
3.5 Technology ........................................................................................................... 9
4 Technology, Talent, Creativity and Diversity in Canadian City-Regions....................... 10 4.1 Talent and Creativity........................................................................................... 10
4.2 Talent and Diversity............................................................................................ 11
4.3 Talent and Technology ....................................................................................... 12
4.4 Technology, Creativity and Diversity................................................................. 14
5 Technology, Talent, Creativity and Diversity: Comparing Canadian and US City-Regions ................................................................................................................................... 16
5.1 Canada and the United States: National Differences.......................................... 16
5.2 Comparing Canadian and US City-Regions: Key Findings ............................... 16
5.3 Canadian and US City-Regions: A Multivariate Analysis ................................. 22
6 Conclusions and Implications for Ontario....................................................................... 24
7 Bibliography .................................................................................................................... 26
About the Researchers ............................................................................................................ 27
Acknowledgements................................................................................................................. 28
iii

Appendix A: Defining Bohemian Occupations in Canada and the United States.................. 29
Appendix B: Defining High-technology Industries in Canada and the United States............ 30
Appendix C: Ranks of Key Variables by Size of Metropolitan Region ................................. 31
iv
List of Tables
Table 1: Census Metropolitan Areas in Canada by Size........................................................... 5
Table 2: Canada and the United States: Comparing key indicators........................................ 16
Table 3: Ontario’s City-Regions – North American Ranks by Population Size..................... 21
Table 4: Multivariate Regression Results – Canadian and US City-Regions......................... 23
List of Figures
Figure 1: Talent in Canadian City-Regions .............................................................................. 6
Figure 2: Bohemians in Canadian City-Regions ...................................................................... 7
Figure 3: Mosaic Index for Canadian City-Regions ................................................................. 8
Figure 4: Tech-Pole Index for Canadian City-Regions ............................................................ 9
Figure 5: Talent by Bohemian Index for Canadian City-Regions .......................................... 11
Figure 6: Talent by Mosaic Index for Canadian City-Regions............................................... 12
Figure 7: Tech-Pole Index by Talent for Canadian City-Regions .......................................... 13
Figure 8: Tech-Pole Index by Bohemian Index for Canadian City-Regions.......................... 14
Figure 9: Tech-Pole Index by Mosaic Index for Canadian City-Regions .............................. 15
Figure 10: Talent by Bohemian Index for North American City-Regions ............................. 18
Figure 11: Talent by Mosaic/Melting Pot Index for North American City-Regions.............. 18
Figure 12: Tech-Pole Index by Talent for North American City-Regions ............................. 19
Figure 13: Tech-Pole Index by Bohemian Index for North American City-Regions............. 19
Figure 14: Tech-Pole Index by Mosaic Index for North American City-Regions ................. 20
v

1 Technology, Talent, Creativity and Diversity Create Advantages for City-Regions
A distinct advantage of city-regions is their ability to produce, attract and retain those workers who play the lead role in knowledge-intensive production and innovation – those who provide the ideas, know-how, creativity and imagination so crucial to economic success. Because value creation in many sectors of the economy rests increasingly on intangible assets, the locational constraints of earlier eras – for example, access to natural harbours or proximity to raw materials and cheap energy sources – no longer exert the same pull they once did. Instead, what matters most now are those attributes and characteristics of particular places that make them attractive to potentially mobile, much sought-after talent.
Traditional theories of economic growth and development emphasized the role of natural resources and physical assets. Such theories were used to inform strategies typically based on various incentives to try to alter the location decisions of firms. In recent years, several more robust theories have emerged. The first, associated with the work of Michael Porter (2000) and others, emphasizes the role of clusters of related and supporting industries. According to this work, clusters operate as geographically concentrated collections of interrelated firms in which local sophisticated and demanding customers and strong competition with other firms in the same industry drive the innovation process. A second view associated with Robert Lucas (1988) and Edward Glaeser (1998) focuses on the role of human capital – that is, highly educated people. It argues that places with higher levels of human capital are more innovative and grow more rapidly and robustly over time. A third view, associated with Richard Florida (2002), emphasizes the role of creative capital, arguing that certain underlying conditions of places, such as their ability to attract creative people and be open to diversity, inform innovation and growth. Further independent research by Robert Cushing (2001) of the University of Texas at Austin provides a good deal of support for the creative capital view.
In the current creative age, the ability to attract and retain highly skilled labour is therefore crucial to the current and future prosperity of city-regions, provinces and states, and entire nations. The most recent research on this question indicates strongly that talent is attracted to and retained by city-regions, but not just any city-regions. In their analysis of American metropolitan areas, Richard Florida and Gary Gates have shed new light on those characteristics of urban regions that seem to be most important in this process (Florida 2001, 2002a, 2002b; Florida and Gates 2001). The central finding of this work is that the social character of city-regions has a very large influence over their economic success and competitiveness. In particular, Florida and colleagues have found that those places that offer a high quality of life and best accommodate diversity enjoy the greatest success in talent attraction/retention and in the growth of their technology-intensive economic activities.
This research demonstrates that ‘quality of place’ must be understood in broader terms than we have traditionally been accustomed to: while the attractiveness and condition of the natural environment and built form are certainly important, so too is the presence of a rich cultural scene and a high concentration of people working in cultural and creative occupations (‘bohemians’ or the ‘creative class’).
1
Diversity is another key aspect of successful places. There are several dimensions to this.
The first dimension concerns entry barriers facing newcomers: city-regions with great diversity are understood as places “where people from different backgrounds can easily fit in ... reflecting a high degree of openness” (Florida 2001: 20). Several quantitative indicators used by Florida and colleagues capture this. The most influential variable was found to be a city’s ‘gay index’, measuring the prevalence of gay males in the local population (Florida and Gates 2001). This index has been shown to reflect openness to newcomers of diverse backgrounds: “Places that are open to and supportive of a gay population are likely to be open and supportive of other groups. ... Simply put, the gay index reflects an environment that is open to diversity, high in urban oriented amenities, and characterized by low entry barriers” (Florida 2001: 20). Another indicator of diversity is the ‘Melting Pot Index’, reflecting the proportion of a city-region’s population that is foreign-born.
The objective of the current study is to conduct a similar analysis of quality of place for a group of city-regions in Ontario and the rest of Canada, in order to see how well they perform relative to other city-regions in North America. To get at these issues, this report looks at the role of human capital, creative capital, and diversity in technology-based economic development in Ontario’s and Canada’s city-regions. It compares Ontario’s city-regions to others in Canada and the US. It uses two novel new measures, the Bohemian Index to reflect creative capital, and the Mosaic Index to reflect openness and diversity. It suggests that there will be a relationship between openness to creativity and diversity and the ability to support high-tech industries and economic development based on talented workers.
This kind of analysis has not yet been performed for Canadian city-regions, and has the potential to shed important new light on the role of quality of place in shaping the competitiveness of city-regions in Ontario.
2

2 Data and Methods
The data for this analysis are derived from a variety of sources. Most of the Canadian data are taken from the 1996 Census of Canada.1 The 1990 Census of Population and Housing for the United States is used to create comparable measures for American city-regions.2 In Canada, employment in high-technology industry (for 1999) is derived from special tabulations from the Small Area File (SAF) of the Longitudinal Employment Analysis Program (LEAP) provided by Statistics Canada (see McVey et al. 2002). Comparable data for the United States (also for 1999) are drawn from County Business Patterns.
2.1 Key Variables
The key variables for this analysis are the Talent Index, the Bohemian Index, the Mosaic Index, and the Tech-Pole Index. These mirror variables employed in previous research by Florida (2001, 2002a, 2002b) on the geography of talent and the rise of the creative class. The variables used in this analysis have been designed to maximize consistency between the United States and Canada, important for comparative analysis and benchmarking. The variable definitions for the Canadian data are described in detail below.
Talent Index – Talent is defined as the proportion of the population over 18 years of age with a bachelor’s degree or higher. Canadian data are taken from the 1996 Census of Population. US data are taken from the 1990 US Census of Population and Housing.
Bohemian Index – The Bohemian Index is defined using employment in artistic and creative occupations. It is a location quotient that compares the region’s share of the nation’s bohemians to the region’s share of the nation’s population. Canadian data are taken from the 1996 Census of Population. US data are taken from the 1990 US Census of Population and Housing (see Florida 2002a; Appendix A).
Mosaic Index – The Mosaic Index is the Canadian counterpart of Florida’s ‘Melting Pot Index’. Both are calculated as the proportion of the total population that is foreign-born. Canadian data are taken from the 1996 Census of Population. US data are taken from the 1990 US Census of Population and Housing.
1 At the time of writing, key data from Canada’s 2001 Census of Population are not yet available. Because information on same-sex couples was only collected in Canada for the first time in the 2001 Census, direct comparability with US data from the 2000 Census may be compromised. Hence, this variable is excluded from the current analysis.
2 The 1990 data were used for two reasons. First, the original work by Florida and Gates was performed using these numbers, and second, 2000 US Census data are still not fully available.
3
Tech-Pole Index – This measure is based on an index created by the Milken Institute (DeVol, 1999). The Milken Institute’s Tech-Pole Index is based on a city-region’s high-technology industrial output. However, due to differences in data collection and availability, we have recalculated this measure for both Canadian and American city-regions using high-technology employment data. The index compares a region’s share of national employment in high-technology industries to the region’s overall share of national employment; this is then adjusted for city-size by multiplying by a region’s share of national high-technology employment. Therefore, it reflects both the region’s degree of specialization in technology-intensive activity as well as its sheer scale of employment in these sectors. Canadian data are derived from the Small Area File (SAF) of the Longitudinal Employment Analysis Program (LEAP) maintained by Statistics Canada. For Canada, high-technology industries are defined using the 1980 Standard Industrial Classification (SIC) at the 3-digit level. In the United States, data are taken from County Business Patterns for a similar set of industries. The index includes technology-intensive sectors in both manufacturing and services (see Appendix B).
4

3 How do City-Regions in Ontario and Canada Perform?
3.1 City-Regions in Ontario and Canada
Statistics Canada defines urban regions as Census Metropolitan Areas (CMA). These regions have a core urban population of 100,000 or more persons. The geographic extent of the area is defined on the basis of commuting flows between municipalities around the core urban area. Of the 25 CMAs in Canada in 1996, 10 are located in Ontario: Hamilton, Kitchener, London, Ottawa-Hull, St. Catharines-Niagara, Oshawa, Sudbury, Thunder Bay, Toronto, and Windsor (Table 1).
Table 1: Census Metropolitan Areas in Canada by Size
Census Metropolitan Area 1996 2001 % Growth Toronto 4,263,757 4,682,897 9.8 Montréal 3,326,510 3,426,350 3.0 Vancouver 1,831,665 1,986,965 8.5 Ottawa – Hull 1,010,498 1,063,664 5.3 Calgary 821,628 951,395 15.8 Edmonton 862,597 937,845 8.7 Québec City 671,889 682,757 1.6 Winnipeg 667,209 671,274 0.6 Hamilton 624,360 662,401 6.1 London 398,616 432,451 8.5 Kitchener 382,940 414,284 8.2 St. Catharines – Niagara 372,406 377,009 1.2 Halifax 332,518 359,183 8.0 Victoria 304,287 311,902 2.5 Windsor 278,685 307,877 10.5 Oshawa 268,773 296,298 10.2 Saskatoon 219,056 225,927 3.1 Regina 193,652 192,800 -0.4 St. John's 174,051 172,918 -0.7 Sudbury 160,488 155,601 -3.0 Chicoutimi – Jonquière 160,454 154,938 -3.4 Sherbrooke 147,384 153,811 4.4 Trois-Rivières 139,956 137,507 -1.7 Saint John 125,705 122,678 -2.4 Thunder Bay 125,562 121,986 -2.8
Canada 28,846,760 30,007,094 4.0 Source: Statistics Canada, 1996 and 2001 Census of Population
5

3.2 Talent
The distribution of talent across Canada’s 25 largest metropolitan regions is shown in Figure 1. Notably, two Ontario city-regions are among those with the highest levels of talent: Ottawa-Hull has the highest level of talent, with roughly 23 percent of the adult population having a university degree, and Toronto ranks third, with just under 20 percent of the population having at least a university degree. However, some Ontario city-regions – Oshawa, Sudbury, and St. Catharines-Niagara – also figure prominently at the other end of the spectrum.3
Figure 1: Talent in Canadian City-Regions
0.0 5.0 10.0 15.0 20.0 25.0
OshawaSt. Catharines - Niagara
Chicoutimi - JonquièreSudbury
Saint JohnTrois-RivièresThunder Bay
WindsorHamiltonCANADAKitchener
SherbrookeSt. John's
ReginaEdmontonWinnipegMontréalLondon
SaskatoonQuébec City
VancouverVictoriaCalgaryTorontoHalifax
Ottawa - Hull
Talent (% pop. 18 or older with BA or higher)
3 Because Florida (2001) defines the Talent Index to include only bachelor’s degrees or higher, it does not reflect other forms of post-secondary educational attainment such as community college certificates and diplomas. We acknowledge the important contribution of community colleges and other education and training institutions to the production of a talented and highly skilled labour force in Ontario.
6
3.3 Creativity and the Bohemian Index
Previous research has suggested a strong relationship between bohemians and technology-based economic growth. Figure 2 shows that Vancouver and Toronto lead all other Canadian city-regions on the Bohemian Index, followed by Victoria, Montreal, Calgary and Ottawa-Hull. Other Ontario city-regions such as Kitchener and London are marginally below the Canadian average of 6.1 Bohemians per 1000 population, followed by Hamilton, St. Catharines-Niagara, Oshawa and others. With a few notable exceptions (such as Victoria), it appears that bohemians tend to flock to the largest urban centres in the country.
Figure 2: Bohemians in Canadian City-Regions
0.0 2.0 4.0 6.0 8.0 10.0 12.0
Trois-RivièresSudbury
Saint JohnThunder Bay
Chicoutimi - JonquièreWindsorOshawa
SherbrookeSt. Catharines - Niagara
St. John'sHamilton
LondonKitchener
Québec CityCANADA
SaskatoonRegina
EdmontonWinnipeg
HalifaxOttawa - Hull
CalgaryMontréalVictoriaToronto
Vancouver
Bohemians per 1000 population
7

3.4 Diversity and the Mosaic Index
As shown in Figure 3, Toronto and Vancouver also dominate the Mosaic index ranking, leading the next group of city-regions by a large margin. But within this next group of city-regions, Hamilton, Kitchener, Windsor, London, and St. Catharines-Niagara all exceed the national average. Oshawa and Ottawa-Hull are not far below this level, while Thunder Bay and Sudbury are somewhat further back.
Figure 3: Mosaic Index for Canadian City-Regions
0.0 5.0 10.0 15.0 20.0 25.0 30.0 35.0 40.0 45.0
Chicoutimi - JonquièreTrois-Rivières
Québec CitySt. John's
Saint JohnSherbrooke
HalifaxSudbury
SaskatoonRegina
Thunder BayOttawa - Hull
OshawaWinnipegCANADAMontréal
St. Catharines - NiagaraEdmonton
VictoriaLondon
WindsorCalgary
KitchenerHamilton
VancouverToronto
Melting Pot / Mosaic Index
8

3.5 Technology
The distribution of the Tech-Pole Index (Figure 4) is strikingly different from the first three indices. Because of the size component within this indicator, Montreal and Toronto (with the two largest concentrations of technology-intensive employment in the country) dominate all other city-regions. Ottawa-Hull is a strong third, while Kitchener, London and Hamilton are well back in eighth, twelfth and thirteenth ranks respectively.
Figure 4: Tech-Pole Index for Canadian City-Regions
0 5 10 15 20 25 30 35 40
SudburyTrois-Rivières
WindsorChicoutimi - Jonquière
SherbrookeThunder Bay
St. Catharines - NiagaraOshawa
Saint JohnSaskatoonSt. John's
VictoriaHamilton
LondonReginaHalifax
WinnipegKitchener
Québec CityEdmonton
CalgaryVancouver
Ottawa - HullToronto
Montréal
Tech Pole Index (1999)
9

4 Technology, Talent, Creativity and Diversity in Canadian City-Regions
What are the relationships between technology, talent, creativity and diversity for Canada’s metropolitan regions? We now extend the analysis used by Florida and his collaborators for US metropolitan regions to the Canadian context. The basic question here is: how closely are indicators such as creativity (the Bohemian Index) and diversity (the Mosaic Index) related to a city-region’s ability to attract highly skilled labour (the Talent Index) or technology-intensive employment (the Tech-Pole Index)?
4.1 Talent and Creativity
We begin with the relationship between Talent and the Bohemian Index (Figure 5). The relationship is strong, statistically significant, and positive (i.e. the higher a city’s Bohemian Index, the higher its Talent Index)4. In other words, it would appear that city-regions that attract creative and artistic people also attract talented workers. At the same time, Figure 5 highlights a number of Ontario city-regions that depart from this general relationship somewhat. Particularly noteworthy here is the position of Ottawa-Hull, whose score on the Talent Index is far higher than expected, given its score on the Bohemian Index.5 Conversely, the communities of Oshawa and St. Catharines-Niagara have lower Talent Index scores than would be expected on the basis of their Bohemian Index scores. Interestingly, they share this characteristic with some much larger Canadian city-regions, most notably Vancouver and Montreal.
4 The statistical measure of goodness of fit (R2) for the relationship between the Talent and Bohemian indices is 0.65 and is highly statistically significant (p=0.000).
5 This is strikingly similar to its US counterpart, Washington, DC.
10

Figure 5: Talent by Bohemian Index for Canadian City-Regions
R2 = 0.65
0.00
5.00
10.00
15.00
20.00
25.00
0.40 0.60 0.80 1.00 1.20 1.40 1.60 1.80
Bohemian Index (LQ)
Tale
nt (%
)
Ottawa-Hull
Toronto
Halifax
Vancouver
Oshawa
Hamilton
St. Catharines-Niagara
Kitchener
London
Windsor
Sudbury
Thunder Bay
Montreal
Victoria
Calgary
4.2 Talent and Diversity
The relationship between Talent and the Mosaic Index, is also generally positive (Figure 6).6 That is, places in which foreign-born individuals constitute a large share of the population are attractive to talented workers. However, this relationship does not appear to be as strong as the one between talent and creativity.7 Many city-regions are scattered both above and below the line of best fit. Notable cases include Ottawa-Hull and Halifax, whose talent levels are far higher than what would be expected on the basis of their Mosaic Index scores. Conversely, Ontario centres such as Hamilton, Kitchener, Windsor, St. Catharines-Niagara, Oshawa, Thunder Bay and Sudbury all fall well below this line, indicating talent levels below those that would be expected on the basis of their percentages of foreign-born population. Furthermore, while the first four of these city-regions all have a Mosaic Index score above
6 The R2 for the relationship between the Talent and Mosaic indices is 0.14 and is less significant (p=0.067).
7 The statistical measure of goodness of fit, R2, is considerably lower than in the previous case (0.14 compared to 0.65).
11

the national average, their ability to attract, retain or generate talented labour is lower than levels expected according to the generally observed relationship.
Figure 6: Talent by Mosaic Index for Canadian City-Regions
R2 = 0.14
0.00
5.00
10.00
15.00
20.00
25.00
0.00 5.00 10.00 15.00 20.00 25.00 30.00 35.00 40.00 45.00
Mosaic Index (%)
Tale
nt (%
)
Ottawa-Hull
Toronto
Vancouver
Halifax
Oshawa
Hamilton
St. Catharines-Niagara
Kitchener
London
WIndsor
Sudbury
Thunder Bay
CalgaryMontreal
4.3 Talent and Technology
Shifting our focus to the Tech-Pole Index, we can see that this is strongly correlated with the Talent Index (Figure 7).8 In short, city-regions with large concentrations of technology-intensive employment are places that generate, attract and/or retain talent effectively. It is important to note that the Tech-Pole Index score is shown here on a logarithmic scale. The results therefore indicate that the relationship between talent and technology-intensive employment is especially strong for those city-regions found in the upper-right hand corner of this graph. These include most of Canada’s largest metropolitan regions: Toronto, Vancouver, Ottawa-Hull and Calgary. Interestingly, Montreal’s position in this graph indicates that its Tech-Pole Index score is much higher than would be expected based on its 8 The R2 for the relationship between the Tech-pole and Talent indices is 0.59 (p=0.000). A logarithmic scale is used to illustrate the relationship between the Tech-pole index and talent, diversity, and creativity. It best represents the large gains in technology-intensive activity which are associated with relatively small increases in the other variables.
12

Talent Index score.9 The Ontario city-region of Kitchener emerges as a place that has more technology-intensive employment than its Talent Index score would suggest, while for London and Windsor, the reverse is true: lower Tech-Pole Index scores than expected, based on their Talent Index scores.
Figure 7: Tech-Pole Index by Talent for Canadian City-Regions
R2 = 0.59
0.01
0.10
1.00
10.00
100.00
9.00 11.00 13.00 15.00 17.00 19.00 21.00 23.00 25.00
Talent (%)
Tech
Pol
e In
dex
1999
(log
arith
mic
sca
le)
Montreal Toronto
Ottawa
St. Catharines-NiagaraSudburyOshawa
Vancouver Calgary
Halifax
Thunder Bay
Windsor
Hamilton
Kitchener
London
9 This can be explained by the presence of a large aerospace industry in Montreal, led by firms such as Bombardier. While all aerospace workers would be included in the Tech-Pole Index, many of the shop-floor workers in this industry would not have a university degree: hence, high Tech-Pole Index scores and relatively low Talent Index scores.
13
4.4 Technology, Creativity and Diversity
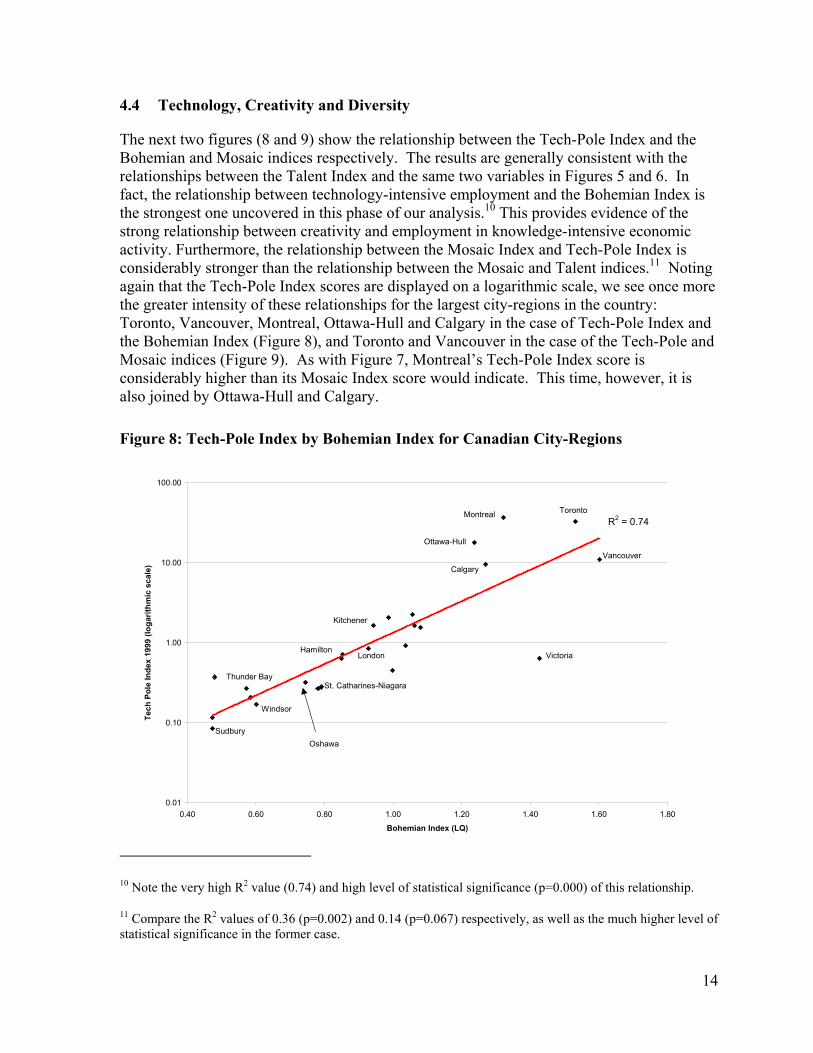
The next two figures (8 and 9) show the relationship between the Tech-Pole Index and the Bohemian and Mosaic indices respectively. The results are generally consistent with the relationships between the Talent Index and the same two variables in Figures 5 and 6. In fact, the relationship between technology-intensive employment and the Bohemian Index is the strongest one uncovered in this phase of our analysis.10 This provides evidence of the strong relationship between creativity and employment in knowledge-intensive economic activity. Furthermore, the relationship between the Mosaic Index and Tech-Pole Index is considerably stronger than the relationship between the Mosaic and Talent indices.11 Noting again that the Tech-Pole Index scores are displayed on a logarithmic scale, we see once more the greater intensity of these relationships for the largest city-regions in the country: Toronto, Vancouver, Montreal, Ottawa-Hull and Calgary in the case of Tech-Pole Index and the Bohemian Index (Figure 8), and Toronto and Vancouver in the case of the Tech-Pole and Mosaic indices (Figure 9). As with Figure 7, Montreal’s Tech-Pole Index score is considerably higher than its Mosaic Index score would indicate. This time, however, it is also joined by Ottawa-Hull and Calgary.
Figure 8: Tech-Pole Index by Bohemian Index for Canadian City-Regions
R2 = 0.74
0.01
0.10
1.00
10.00
100.00
0.40 0.60 0.80 1.00 1.20 1.40 1.60 1.80
Bohemian Index (LQ)
Tech
Pol
e In
dex
1999
(log
arith
mic
sca
le)
Sudbury
Windsor
Thunder Bay
Oshawa
St. Catharines-Niagara
HamiltonLondon
Kitchener
Victoria
TorontoMontreal
Vancouver
Ottawa-Hull
Calgary
10 Note the very high R2 value (0.74) and high level of statistical significance (p=0.000) of this relationship.
11 Compare the R2 values of 0.36 (p=0.002) and 0.14 (p=0.067) respectively, as well as the much higher level of statistical significance in the former case.
14

Figure 9: Tech-Pole Index by Mosaic Index for Canadian City-Regions
R2 = 0.36
0.01
0.10
1.00
10.00
100.00
0.00 5.00 10.00 15.00 20.00 25.00 30.00 35.00 40.00 45.00
Mosaic Index (%)
Tech
Pol
e In
dex
1999
(log
arith
mic
sca
le)
Thunder Bay
Oshawa
Sudbury
London
St. Catharines-Niagara
Windsor
Hamilton
Kitchener
TorontoMontreal
Vancouver
Calgary
Ottawa-Hull
15
5 Technology, Talent, Creativity and Diversity: Comparing Canadian and US City-Regions
5.1 Canada and the United States: National Differences
We now turn our attention to the major differences between Canadian and US metropolitan regions. Clearly, metropolitan regions in these two nations differ in size. The largest US city-regions are considerably larger than those in Canada. But there are other significant differences as well.
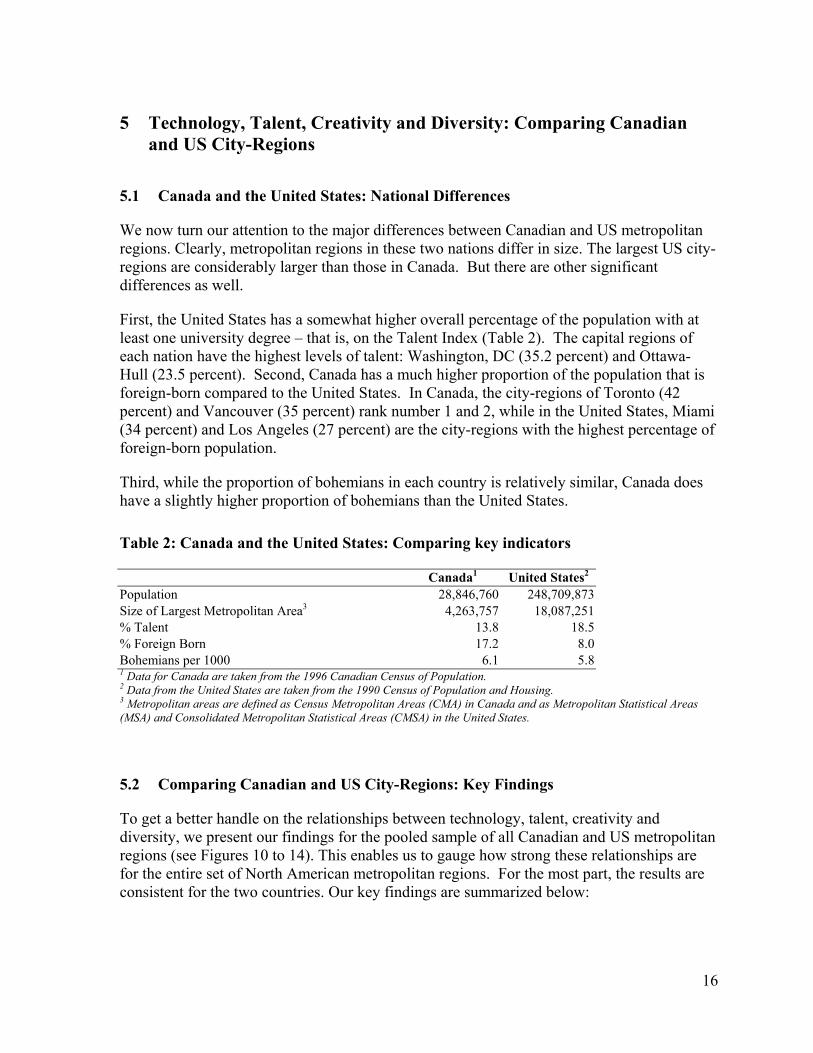
First, the United States has a somewhat higher overall percentage of the population with at least one university degree – that is, on the Talent Index (Table 2). The capital regions of each nation have the highest levels of talent: Washington, DC (35.2 percent) and Ottawa-Hull (23.5 percent). Second, Canada has a much higher proportion of the population that is foreign-born compared to the United States. In Canada, the city-regions of Toronto (42 percent) and Vancouver (35 percent) rank number 1 and 2, while in the United States, Miami (34 percent) and Los Angeles (27 percent) are the city-regions with the highest percentage of foreign-born population.
Third, while the proportion of bohemians in each country is relatively similar, Canada does have a slightly higher proportion of bohemians than the United States.
Table 2: Canada and the United States: Comparing key indicators
Canada1 United States2 Population 28,846,760 248,709,873 Size of Largest Metropolitan Area3 4,263,757 18,087,251 % Talent 13.8 18.5 % Foreign Born 17.2 8.0 Bohemians per 1000 6.1 5.8 1 Data for Canada are taken from the 1996 Canadian Census of Population. 2 Data from the United States are taken from the 1990 Census of Population and Housing. 3 Metropolitan areas are defined as Census Metropolitan Areas (CMA) in Canada and as Metropolitan Statistical Areas (MSA) and Consolidated Metropolitan Statistical Areas (CMSA) in the United States.
5.2 Comparing Canadian and US City-Regions: Key Findings
To get a better handle on the relationships between technology, talent, creativity and diversity, we present our findings for the pooled sample of all Canadian and US metropolitan regions (see Figures 10 to 14). This enables us to gauge how strong these relationships are for the entire set of North American metropolitan regions. For the most part, the results are consistent for the two countries. Our key findings are summarized below:
16

• There is a strong positive relationship between talent and creativity (Bohemian index) in both countries (Figure 10).12
• The relationship between talent and the Mosaic/Melting Pot Index is considerably weaker and less significant, for both countries (Figure 11)13. In the case of the United States, this is largely explained by what appears to be two rather different relationships. First, there is a large group of city-regions with lower Melting Pot Index scores, a ‘middle-America’ with generally low levels of diversity, but a wide range of Talent Index scores. Second, there is a smaller group of city-regions, mostly in states like California, Texas and Florida (including Miami, Los Angeles, San Diego and Houston), that show a much wider range of Melting Pot scores (see Appendix C).
• The relationship between the Tech-Pole and Talent indices is strong and positive for both Canada and the United States (Figure 12), indicating that in both countries there is a close connection between the prevalence of well-educated labour and technology-intensive employment. Once again, the strength of this relationship appears to be stronger in Canada than it is in the United States.14
• The relationship between the Tech-pole Index and the Bohemian Index (Figure 13) is perhaps one of the strongest and most consistent relationships in our analysis. The lines of best fit for Canadian and American city-regions are remarkably similar in slope and location, even though the strength of the relationship is stronger again for Canada than the United States15. The prominence of creative types seems to strongly mirror the geography of knowledge-intensive employment. This appears to be consistently true both north and south of the Canada-US border.
• The relationship between the Tech-Pole and Melting Pot/Mosaic indices16 is considerably greater than that for the Talent and Melting Pot/Mosaic indices. The relationship in Figure 14 looks quite similar to that in Figure 11, likely for the same reasons (see above).
12 The R2 values for the relationship between the Talent and Bohemian indices are 0.65 (p=0.000) and 0.61 (p=0.000) for Canada and the US respectively. The slopes are significantly different (p=0.015).
13 The R2 values for the relationship between the Talent and Mosaic / Melting Pot indices are 0.14 (p=0.067) and 0.01 (p=0.074) for Canada and the US respectively. The slopes are not significantly different.
14 The R2 values for the relationship between the Tech-Pole and Talent indices are 0.59 (p=0.000) for Canada and 0.37 (p=0.000) for the US. The slopes are not significantly different.
15 The R2 values for the relationship between the Tech-Pole and Bohemian indices are 0.74 (p=0.000) and 0.39 (p=0.000) for Canada and the US respectively. The slopes are not significantly different.
16 The R2 values for the relationship between the Tech-Pole and Mosaic / Melting Pot indices are 0.36 (p=0.002) and 0.06 (p=0.000) for Canada and the US respectively. The slopes are not significantly different.
17

Figure 10: Talent by Bohemian Index for North American City-Regions
United StatesR2 = 0.61
CanadaR2 = 0.65
0.00
0.50
1.00
1.50
2.00
2.50
0.00 0.50 1.00 1.50 2.00 2.50 3.00
Bohemian Index (North American LQ)
Tale
nt (N
orth
Am
eric
an L
Q)
Canada United States Linear (United States) Linear (Canada)
Figure 11: Talent by Mosaic/Melting Pot Index for North American City-Regions
CanadaR2 = 0.14
United StatesR2 = 0.01
0.00
0.50
1.00
1.50
2.00
2.50
0.00 0.50 1.00 1.50 2.00 2.50 3.00 3.50 4.00 4.50 5.00
Melting Pot / Mosaic Index (North American LQ)
Tale
nt (N
orth
Am
eric
an L
Q)
Canada United States Linear (Canada) Linear (United States)
18

Figure 12: Tech-Pole Index by Talent for North American City-Regions
United StatesR2 = 0.37
CanadaR2 = 0.59
0.000
0.001
0.010
0.100
1.000
10.000
100.000
0.40 0.60 0.80 1.00 1.20 1.40 1.60 1.80 2.00 2.20
Talent (North American LQ)
Nor
th A
mer
ican
Tec
h Po
le (l
ogar
ithm
ic s
cale
)
Canada United States Expon. (United States) Expon. (Canada)
Figure 13: Tech-Pole Index by Bohemian Index for North American City-Regions
CanadaR2 = 0.74
United StatesR2 = 0.39
0.000
0.001
0.010
0.100
1.000
10.000
100.000
0.00 0.50 1.00 1.50 2.00 2.50 3.00
Bohemian Index (North American LQ)
Nor
th A
mer
ican
Tec
h Po
le (l
ogar
ithm
ic s
cale
)
Canada United States Expon. (Canada) Expon. (United States)19

Figure 14: Tech-Pole Index by Mosaic Index for North American City-Regions
CanadaR2 = 0.36
United StatesR2 = 0.06
0.000
0.001
0.010
0.100
1.000
10.000
100.000
0.00 0.50 1.00 1.50 2.00 2.50 3.00 3.50 4.00 4.50 5.00
Melting Pot / Mosaic Index (North American LQ)
Nor
th A
mer
ican
Tec
h Po
le (l
ogar
ithm
ic s
cale
)
Canada United States Expon. (Canada) Expon. (United States)
20
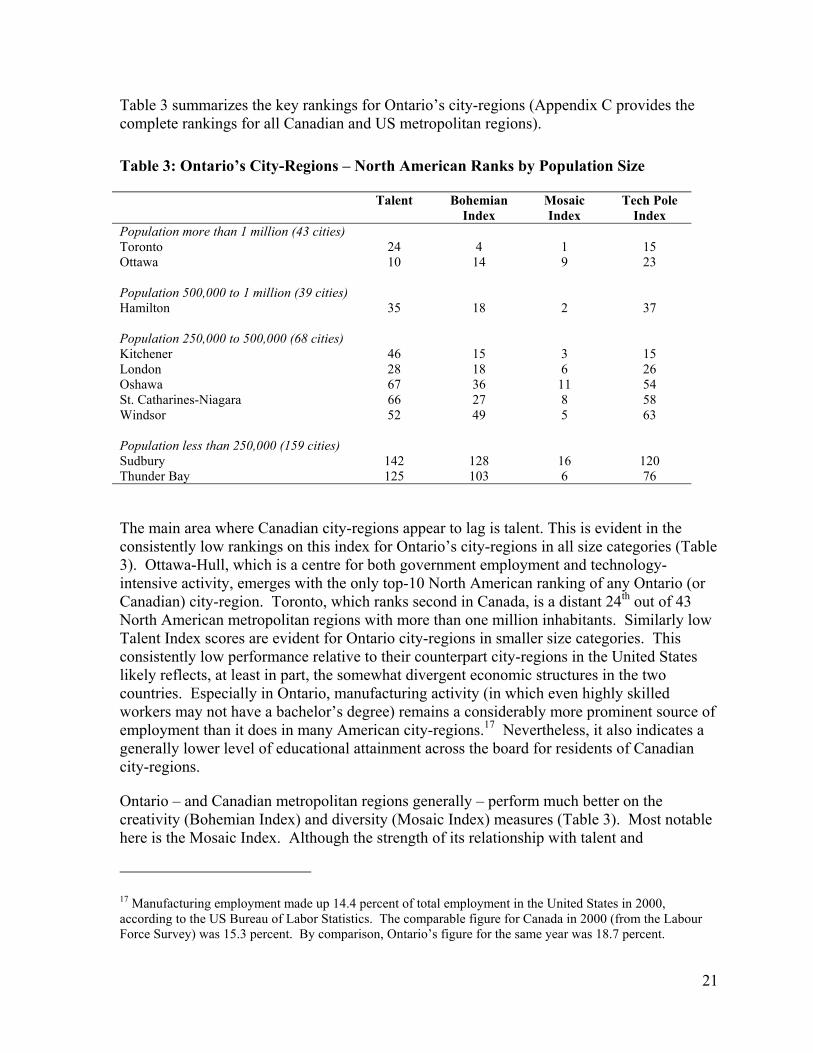
Table 3 summarizes the key rankings for Ontario’s city-regions (Appendix C provides the complete rankings for all Canadian and US metropolitan regions).
Table 3: Ontario’s City-Regions – North American Ranks by Population Size
Talent Bohemian Index
Mosaic Index
Tech Pole Index
Population more than 1 million (43 cities) Toronto 24 4 1 15 Ottawa 10 14 9 23 Population 500,000 to 1 million (39 cities) Hamilton 35 18 2 37 Population 250,000 to 500,000 (68 cities) Kitchener 46 15 3 15 London 28 18 6 26 Oshawa 67 36 11 54 St. Catharines-Niagara 66 27 8 58 Windsor 52 49 5 63 Population less than 250,000 (159 cities) Sudbury 142 128 16 120 Thunder Bay 125 103 6 76
The main area where Canadian city-regions appear to lag is talent. This is evident in the consistently low rankings on this index for Ontario’s city-regions in all size categories (Table 3). Ottawa-Hull, which is a centre for both government employment and technology-intensive activity, emerges with the only top-10 North American ranking of any Ontario (or Canadian) city-region. Toronto, which ranks second in Canada, is a distant 24th out of 43 North American metropolitan regions with more than one million inhabitants. Similarly low Talent Index scores are evident for Ontario city-regions in smaller size categories. This consistently low performance relative to their counterpart city-regions in the United States likely reflects, at least in part, the somewhat divergent economic structures in the two countries. Especially in Ontario, manufacturing activity (in which even highly skilled workers may not have a bachelor’s degree) remains a considerably more prominent source of employment than it does in many American city-regions.17 Nevertheless, it also indicates a generally lower level of educational attainment across the board for residents of Canadian city-regions.
Ontario – and Canadian metropolitan regions generally – perform much better on the creativity (Bohemian Index) and diversity (Mosaic Index) measures (Table 3). Most notable here is the Mosaic Index. Although the strength of its relationship with talent and
17 Manufacturing employment made up 14.4 percent of total employment in the United States in 2000, according to the US Bureau of Labor Statistics. The comparable figure for Canada in 2000 (from the Labour Force Survey) was 15.3 percent. By comparison, Ontario’s figure for the same year was 18.7 percent.
21

technology-intensive employment is not as strong as other variables used in this analysis, nevertheless this indicates the high degree of openness to newcomers found in smaller and mid-sized Ontario communities. Our findings for Ontario’s city-regions can be summarized as follows:
• Toronto emerges as a city-region with an excellent overall ranking of scores on at least three of these four indices, including two top-four ranks.
• Ottawa-Hull performs very well, with three top-half rankings (including two top-quartile rankings).
• London is the only city in Ontario that scores in the top half of the rankings for its size-group for all four indices.
• Kitchener has top-quartile scores in three out of four indices.
• Hamilton and St. Catharines-Niagara each have two scores in the top half of the rankings for its size group.
One thing is very clear from this analysis. The superb performance of city-regions in Ontario and Canada on the Mosaic and Bohemian indices suggests that these regions possess the underlying social and cultural assets on which to build successful local economies.
5.3 Canadian and US City-Regions: A Multivariate Analysis
We conclude our analysis by exploring the relationships between the study variables in a multivariate regression model. In this analysis, we examine the success with which a city’s performance in generating/attracting technology-intensive employment (the Tech-Pole Index) can be successfully predicted by its score on the three other variables included in this investigation. We perform this analysis four different ways: once for all 25 Canadian CMAs alone, once with all 309 metropolitan areas in Canada and the United States combined, again for the 43 North American city-regions with populations above one million, and finally for the 266 North American city-regions below one million population.18 We have also introduced a fourth explanatory variable into the statistical model: a Canada vs. United States ‘dummy variable’ to capture any systematic differences between the two countries’ Tech-Pole scores not otherwise reflected in the first three explanatory variables.
The results of this analysis (Table 4) further confirm the general patterns and relationships already uncovered in the two-variable analyses above. We can interpret the coefficients in this table as showing the strength of the relationship between a particular explanatory
18 Because of the small sample size (n=25) it was not possible to subdivide the Canadian analysis into smaller groups, whether defined by city size or provincial (e.g. Ontario) boundaries.
22
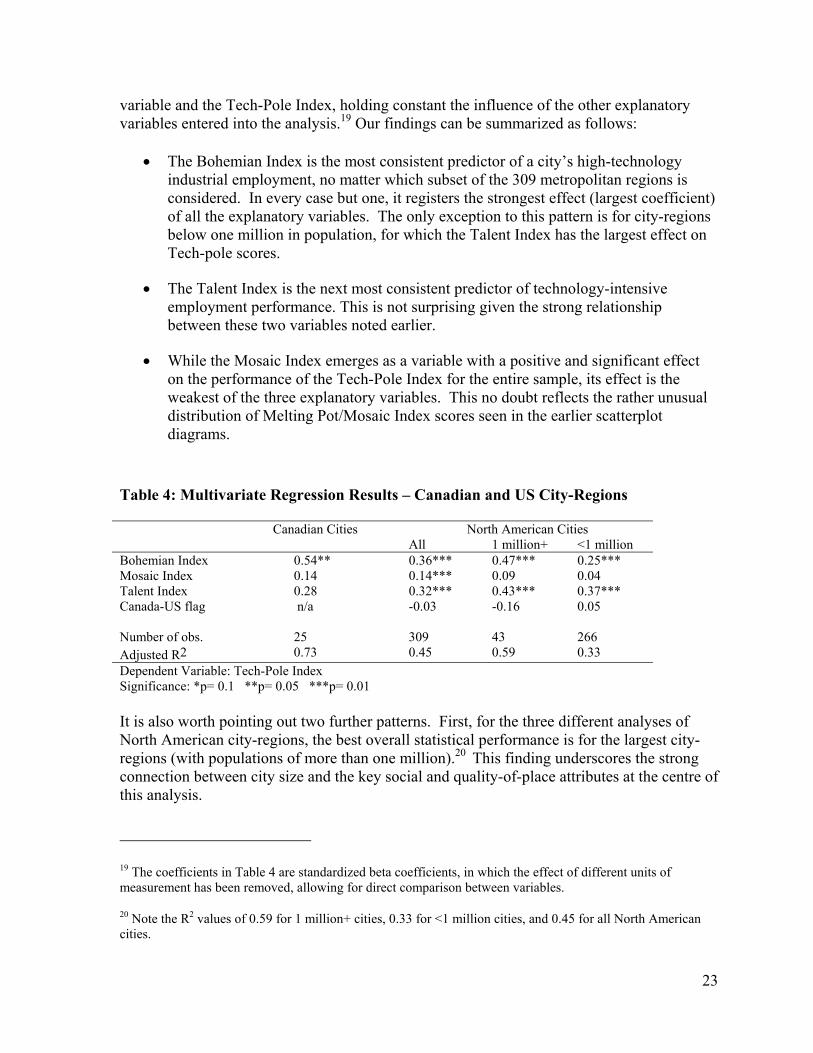
variable and the Tech-Pole Index, holding constant the influence of the other explanatory variables entered into the analysis.19 Our findings can be summarized as follows:
• The Bohemian Index is the most consistent predictor of a city’s high-technology industrial employment, no matter which subset of the 309 metropolitan regions is considered. In every case but one, it registers the strongest effect (largest coefficient) of all the explanatory variables. The only exception to this pattern is for city-regions below one million in population, for which the Talent Index has the largest effect on Tech-pole scores.
• The Talent Index is the next most consistent predictor of technology-intensive employment performance. This is not surprising given the strong relationship between these two variables noted earlier.
• While the Mosaic Index emerges as a variable with a positive and significant effect on the performance of the Tech-Pole Index for the entire sample, its effect is the weakest of the three explanatory variables. This no doubt reflects the rather unusual distribution of Melting Pot/Mosaic Index scores seen in the earlier scatterplot diagrams.
Table 4: Multivariate Regression Results – Canadian and US City-Regions
Canadian Cities North American Cities All 1 million+ <1 million Bohemian Index 0.54** 0.36*** 0.47*** 0.25*** Mosaic Index 0.14 0.14*** 0.09 0.04 Talent Index 0.28 0.32*** 0.43*** 0.37*** Canada-US flag n/a -0.03 -0.16 0.05 Number of obs. 25 309 43 266 Adjusted R2 0.73 0.45 0.59 0.33 Dependent Variable: Tech-Pole Index Significance: *p= 0.1 **p= 0.05 ***p= 0.01 It is also worth pointing out two further patterns. First, for the three different analyses of North American city-regions, the best overall statistical performance is for the largest city-regions (with populations of more than one million).20 This finding underscores the strong connection between city size and the key social and quality-of-place attributes at the centre of this analysis.
19 The coefficients in Table 4 are standardized beta coefficients, in which the effect of different units of measurement has been removed, allowing for direct comparison between variables.
20 Note the R2 values of 0.59 for 1 million+ cities, 0.33 for <1 million cities, and 0.45 for all North American cities.
23

Second, it should be emphasized that this group of variables works best overall for the Canadian city-regions analysis, even though only one variable – the Bohemian Index – emerges as statistically significant.21
Finally, when one controls for the influence of all other explanatory variables, there is no significant difference between the Tech-Pole Index scores of Canadian and American city-regions.22
6 Conclusions and Implications for Ontario
The findings in this report strongly indicate that the relationships first captured for US city-regions in the work of Florida and colleagues are also evident in Ontario’s and Canada’s city-regions. Indeed, if anything, the relationships in Canada are stronger than those found in the United States. This is especially the case in the relationships between the Bohemian Index and both the Talent and Tech-Pole indices, as well as between the Mosaic Index and the other two indices. In other words, there appears to be a strong set of linkages between creativity, diversity, talent and technology-intensive activity that are driving the economic growth of Canada’s – and Ontario’s – city-regions.
In direct, head-to-head comparisons with their American counterparts in the same size groupings, Ontario’s city-regions perform respectably, particularly on the Mosaic and Bohemian indices. This suggests that Ontario’s metropolitan regions have a creative and diverse habitat on which to build and strengthen their knowledge-intensive economies and spur overall growth. The one consistently less impressive finding concerns educational attainment levels, where Ontario’s and Canada’s city-regions perform less well than their US counterparts on the Talent Index. While partial explanations for this gap may rest on suspected differences in definitions or the composition of employment, the apparently consistent spread between Canadian and US city-regions on the Talent Index merits further detailed investigation in the future.23
The strength of Ontario’s urban economies on indicators such as cultural diversity and creativity suggest a powerful base on which to build. This also suggests that public policies at all three levels of government that support immigration and settlement, as well as
21 The R2 of 0.73 is considerably higher than those associated with the other three models.
22 This is evident in the fact that none of the Canada-US flag coefficients were statistically significant, and the size of these coefficients is quite small.
23 For a more detailed discussion of the national differences in educational attainment between the United States and Canada, see Bowlby (2002). Since the late 1990s, Canada has led the United States in post-secondary educational attainment. However, the United States has a higher proportion of university graduates, although this gap is narrowing. Differences between the two countries are smaller amongst younger age cohorts suggesting that the gap between Canada and the United States may continue to narrow over time.
24

nurturing the arts and creativity, have played a critical role in creating the conditions for successful urban economic development today and into the future.24
These results also have wider implications for public policies related to urban development and growth management. They suggest that Ontario’s and Canada’s city-regions ought to reinforce and strengthen their urban character by using planning tools that encourage higher-density growth, diverse, mixed-use urban redevelopment, and the preservation and accentuation of authentic, distinctive neighbourhood character.
Finally, the findings from our investigation underscore one further key point. Our analysis has shown that the relationships between creativity, diversity, talent and technology-intensive employment are especially strong in Ontario’s and Canada’s largest city-regions. For this reason, it is vital that we regard such urban regions as the prime assets responsible for our provincial and national economic competitiveness, and treat them accordingly.
24 For a more detailed discussion of these policy issues in the context of Canada’s cities, see Gertler (2001). Public policies for integrating new immigrants into local social and economic systems include not only the traditional settlement programs addressing shelter, language, education and recognition of qualifications, but also include programs that ensure the delivery of high-quality public education to new Canadians, and that promote the continuing stability of neighbourhoods in Canada’s largest cities.
25

7 Bibliography
Bowlby, J.W. (2002) Post-Secondary Educational Attainment in Canada and the United States in the 1990s. Applied Research Branch Strategic Policy Technical Paper Series T-02-2E. Ottawa: Human Resource Development Canada.
Cushing, R. (2001) “Creative capital, diversity and urban growth”, Working Paper, University of Texas at Austin.
DeVol, R. (1999) America’s High-Tech Economy: Growth, Development and Risks for Metropolitan Economies. Santa Monica, CA: Milken Institute.
Florida, R. (2001) “The economic geography of talent”, Working Paper, Heinz School of Public Policy and Management, Carnegie Mellon University, Pittsburgh, PA (http://www.heinz.cmu.edu/~florida/)
Florida, R. (2002a) “Bohemia and economic geography”, Journal of Economic Geography, 2:1, 55-71.
Florida, R. (2002b) The Rise of the Creative Class. New York: Basic Books.
Florida, R. and Gates, G. (2001) Technology and Tolerance: The Importance of Diversity to High-Technology Growth. Washington, DC: Centre on Urban & Metropolitan Policy, The Brookings Institution.
Gertler, M.S. (2001) “Urban economy and society in Canada: flows of people, capital and ideas”, Isuma: Canadian Journal of Policy Research, 2:3, 119-130. (http://www.isuma.net/v02n03/index_e.shtml)
Glaeser, E. (1998) “Are cities dying?”, Journal of Economic Perspectives, 12, 139-160.
Lucas, R. (1988) “On the mechanics of economic development”, Journal of Monetary Economics, 22, 1-42.
McVey, J., Bordt, M. and Short, A. (2002). Sub-Provincial Data on High-Growth Firms. Science, Innovation and Electronic Information Division Working Paper. Ottawa: Statistics Canada.
Porter, M.E. (2000) “Location, clusters and company strategy”, in G.L. Clark, M.A. Feldman and M.S. Gertler (eds) The Oxford Handbook of Economic Geography. Oxford: Oxford University Press, pp. 253-74.
26

About the Researchers
Meric Gertler, PhD is Professor of Geography and Planning, and the Goldring Chair in Canadian Studies at the University of Toronto. He is also Co-Director of the Program on Globalization and Regional Innovation Systems (PROGRIS) at University of Toronto’s Munk Centre for International Studies. Together with David Wolfe, he co-directs the Innovation Systems Research Network (ISRN) and its provincial sub-network, the Ontario Network on the Regional Innovation System (ONRIS).
Richard Florida, PhD is H. John Heinz III Professor of Regional Economic Development in the Heinz School of Public Policy and Management at Carnegie Mellon University (CMU). He is founder and co-director of the Software Industry Center at CMU – a multimillion-dollar research institute that involves leading computer scientists, software engineers, economists and social scientists across the university. He is also a member of the international Research Advisory Committee of the ISRN.
Gary Gates, PhD is a Research Associate in the Population Studies Centre at The Urban Institute, a nonpartisan economic and social policy research organization in Washington, DC. A graduate of CMU’s doctoral program in Public Policy and Management, he has collaborated with Professor Florida on the analysis of talent, quality of place and diversity in US metropolitan areas.
Tara Vinodrai, MA is a doctoral student in economic geography at the University of Toronto and is a Research Associate with PROGRIS. Previously, she has worked as a research economist in the Microeconomic Analysis Division of Statistics Canada in Ottawa on issues related to the knowledge-based economy.
27

Acknowledgements
The authors wish to thank the Ontario Ministry of Enterprise, Opportunity, and Innovation and the Institute for Competitiveness and Prosperity for funding this study. The authors thank Fred Gault and Michael Bordt of the Science, Innovation, and Electronic Information Division, Statistics Canada for kindly providing customized data tables. Nimira Dharamshi, formerly of the Institute for Competitiveness and Prosperity, provided data for some of the preliminary analysis.
28

Appendix A: Defining Bohemian Occupations in Canada and the United States
United States
SOC (3 digit) Occupation Description 182 Authors 185 Designers 186 Musicians and composers 187 Actors and directors 188 Craft-Artists, painters, sculptors and artist printmakers 189 Photographers 193 Dancers 194 Artists, performers, and related workers
Source: Florida 2002.
Canada
SOC (4-digit) Occupation Description F021 Writers F031 Producers, directors, choreographers, and related occupations F032 Conductors, composers and arrangers F033 Musicians and singers F034 Dancers F035 Actors F036 Painters, sculptors and other visual artists F121 Photographers F141 Graphic designers and illustrating artists F142 Interior designers F143 Theatre, fashion, exhibit and other creative designers F144 Artisans and craftspersons F145 Patternmakers
29

Appendix B: Defining High-technology Industries in Canada and the United States
United States
SIC (3 digit) Industry Description 283 Drugs 357 Computer and Office Equipment 366 Communications Equipment 367 Electronic Components and Accessories 372 Aircraft and Parts 376 Guided Missiles, Space Vehicles and Parts 381 Search, Detection, Navigation, Guidance, Aeronautical Nautical Systems,
Instruments and Equipment 382 Laboratory Apparatus and Analytical, Optical, Measuring and Controlling
Instruments 384 Surgical, Medical, and Dental Instruments and Supplies 481 Telephone Communications Services 737 Computer Programming, Data Processing, and Other Computer-related Services 781 Motion Picture Production and Allied Services 871 Engineering, Architectural, and Surveying Services 873 Research, Development, and Testing Services
Source: DeVol 1999, p. 34.
Canada
SIC (3-digit) Industry Description 321 Aircraft and aircraft parts industry 335 Electronic equipment industries 374 Pharmaceutical and medicine industry 391 Scientific and professional equipment 482 Telecommunication carriers industry 483 Other telecommunication industries 772 Computer and related services 775 Architectural, Engineering and other scientific and technical services 868 Medical and other health laboratories 961 Motion picture audio and video production and distribution
30

Appendix C: Ranks of Key Variables by Size of Metropolitan Region
Ranks of Key Variables for Metropolitan Regions with Population > 1 million (n=43)
CMSA / CMA Population Talent Melting Pot / Mosaic Index
Bohemian Index
Tech Pole Index
New York NY CMSA 18,087,251 9 6 2 5 Los Angeles--Anaheim--Riverside, CA CMSA 14,531,529 27 4 1 3 Chicago--Gary--Lake County, IL--IN--WI CMSA 8,065,633 13 12 19 8 San Francisco--Oakland--San Jose, CA CMSA 6,253,311 3 5 6 1 Philadelphia PA CMSA 5,899,345 19 25 24 10 Detroit--Ann Arbor, MI CMSA 4,665,236 38 24 20 20 Toronto, ON CMA 4,263,757 24 1 4 15 Boston--Lawrence--Salem, MA--NH CMSA 4,171,643 2 13 12 4 Washington, DC--MD--VA MSA 3,923,574 1 11 5 2 Dallas--Fort Worth, TX CMSA 3,885,415 11 17 17 7 Houston--Galveston--Brazoria, TX CMSA 3,711,043 14 10 33 18 Montréal, QU CMA 3,326,510 43 7 10 13 Miami--Fort Lauderdale, FL CMSA 3,192,582 40 3 18 33 Atlanta, GA MSA 2,833,511 7 31 15 12 Cleveland--Akron--Lorain, OH CMSA 2,759,823 37 29 39 31 Seattle--Tacoma, WA CMSA 2,559,164 6 19 11 6 San Diego, CA MSA 2,498,016 12 8 16 11 Minneapolis--St. Paul, MN--WI MSA 2,464,124 5 35 9 16 St. Louis, MO--IL MSA 2,444,099 28 41 37 17 Baltimore, MD MSA 2,382,172 18 34 34 22 Pittsburgh--Beaver Valley, PA CMSA 2,242,798 32 38 40 28 Phoenix, AZ MSA 2,122,101 23 20 21 14 Tampa--St. Petersburg--Clearwater, FL MSA 2,067,959 42 22 27 24 Denver--Boulder, CO CMSA 1,848,319 4 27 8 9 Vancouver, BC CMA 1,831,665 31 2 3 29
31

Ranks of Key Variables for Metropolitan Regions with Population > 1 million (n=43)
CMSA / CMA Population Talent Melting Pot / Mosaic Index
Bohemian Index
Tech Pole Index
Cincinnati--Hamilton, OH--KY--IN CMSA 1,744,124 30 42 28 30 Milwaukee--Racine, WI CMSA 1,607,183 29 33 25 40 Kansas City, MO--KS MSA 1,566,280 15 39 23 19 Sacramento, CA MSA 1,481,102 20 15 26 27 Portland--Vancouver, OR--WA CMSA 1,477,895 16 23 13 21 Norfolk--Virginia Beach--Newport News, VA MSA 1,396,107 39 36 38 37 Columbus, OH MSA 1,377,419 21 37 35 34 San Antonio, TX MSA 1,302,099 41 18 42 36 Indianapolis, IN MSA 1,249,822 25 43 31 35 New Orleans, LA MSA 1,238,816 35 30 41 43 Buffalo--Niagara Falls, NY CMSA 1,189,288 36 28 43 41 Charlotte--Gastonia--Rock Hill, NC--SC MSA 1,162,093 34 40 30 39 Providence--Pawtucket--Fall River, RI--MA CMSA 1,141,510 33 14 29 42 Hartford--New Britain--Middletown, CT CMSA 1,085,837 8 16 32 25 Orlando, FL MSA 1,072,748 26 21 7 32 Salt Lake City--Ogden, UT MSA 1,072,227 22 32 36 26 Ottawa – Hull, ON CMA 1,010,498 10 9 14 23 Rochester, NY MSA 1,002,410 17 26 22 38 Note: In some cases, CMSA and CMA names have been shortened to reflect their core city.
32

Ranks of Key Variables for Metropolitan Regions with Population between 500,000 and 1 million (n=39)
CMSA / CMA Population Talent Melting Pot / Mosaic Index
Bohemian Index
Tech Pole Index
Nashville, TN MSA 985,026 12 31 1 20 Memphis, TN--AR--MS MSA 981,747 23 36 25 29 Oklahoma City, OK MSA 958,839 13 21 24 16 Louisville, KY--IN MSA 952,662 30 38 20 30 Dayton--Springfield, OH MSA 951,270 19 32 22 12 Greensboro--Winston-Salem--High Point, NC MSA 942,091 18 34 12 21 Birmingham, AL MSA 907,810 21 39 23 13 Jacksonville, FL MSA 906,727 26 19 34 17 Albany--Schenectady--Troy, NY MSA 874,304 5 15 19 15 Richmond--Petersburg, VA MSA 865,640 4 22 16 14 West Palm Beach, FL MSA 863,518 7 8 11 11 Edmonton, AB CMA 862,597 33 4 9 23 Honolulu, HI MSA 836,231 6 7 5 33 Calgary, AB CMA 821,628 14 3 4 3 Austin, TX MSA 781,572 2 12 2 1 Las Vegas, NV MSA 741,459 38 10 3 26 Raleigh--Durham, NC MSA 735,480 1 18 6 2 Scranton--Wilkes-Barre, PA MSA 734,175 36 29 36 19 Tulsa, OK MSA 708,954 15 28 29 6 Grand Rapids, MI MSA 688,399 17 20 15 22 Allentown--Bethlehem--Easton, PA--NJ MSA 686,688 28 17 27 28 Québec, QU CMA 671,889 27 23 13 25 Fresno, CA MSA 667,490 34 5 37 39 Winnipeg, MB CMA 667,209 32 6 8 27 Tucson, AZ MSA 666,880 9 11 10 5 Syracuse, NY MSA 659,864 10 16 21 10 Greenville--Spartanburg, SC MSA 640,861 29 33 14 9 Hamilton, ON CMA 624,360 35 2 18 37 Omaha, NE--IA MSA 618,262 8 25 28 7
33

Ranks of Key Variables for Metropolitan Regions with Population between 500,000 and 1 million (n=39)
CMSA / CMA Population Talent Melting Pot / Mosaic Index
Bohemian Index
Tech Pole Index
Toledo, OH MSA 614,128 31 24 30 32 Knoxville, TN MSA 604,816 20 37 17 8 El Paso, TX MSA 591,610 37 1 35 36 Harrisburg--Lebanon--Carlisle, PA MSA 587,986 24 27 33 24 Bakersfield, CA MSA 543,477 39 9 39 35 New Haven--Meriden, CT MSA 530,180 3 13 7 4 Springfield, MA MSA 529,519 22 14 26 38 Baton Rouge, LA MSA 528,264 11 30 31 31 Little Rock--North Little Rock, AR MSA 513,117 16 35 32 18 Charleston, SC MSA 506,875 25 26 38 34 Note: In some cases, CMSA and CMA names have been shortened to reflect their core city.
34
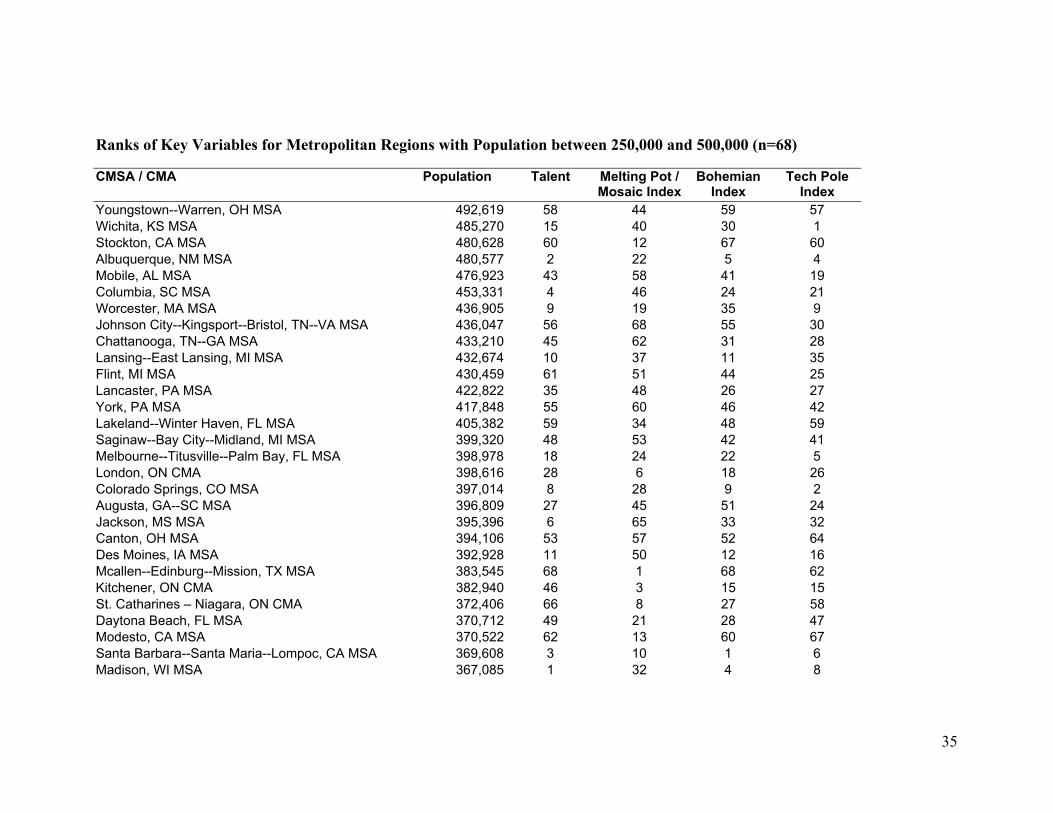
Ranks of Key Variables for Metropolitan Regions with Population between 250,000 and 500,000 (n=68)
CMSA / CMA Population Talent Melting Pot / Mosaic Index
Bohemian Index
Tech Pole Index
Youngstown--Warren, OH MSA 492,619 58 44 59 57 Wichita, KS MSA 485,270 15 40 30 1 Stockton, CA MSA 480,628 60 12 67 60 Albuquerque, NM MSA 480,577 2 22 5 4 Mobile, AL MSA 476,923 43 58 41 19 Columbia, SC MSA 453,331 4 46 24 21 Worcester, MA MSA 436,905 9 19 35 9 Johnson City--Kingsport--Bristol, TN--VA MSA 436,047 56 68 55 30 Chattanooga, TN--GA MSA 433,210 45 62 31 28 Lansing--East Lansing, MI MSA 432,674 10 37 11 35 Flint, MI MSA 430,459 61 51 44 25 Lancaster, PA MSA 422,822 35 48 26 27 York, PA MSA 417,848 55 60 46 42 Lakeland--Winter Haven, FL MSA 405,382 59 34 48 59 Saginaw--Bay City--Midland, MI MSA 399,320 48 53 42 41 Melbourne--Titusville--Palm Bay, FL MSA 398,978 18 24 22 5 London, ON CMA 398,616 28 6 18 26 Colorado Springs, CO MSA 397,014 8 28 9 2 Augusta, GA--SC MSA 396,809 27 45 51 24 Jackson, MS MSA 395,396 6 65 33 32 Canton, OH MSA 394,106 53 57 52 64 Des Moines, IA MSA 392,928 11 50 12 16 Mcallen--Edinburg--Mission, TX MSA 383,545 68 1 68 62 Kitchener, ON CMA 382,940 46 3 15 15 St. Catharines – Niagara, ON CMA 372,406 66 8 27 58 Daytona Beach, FL MSA 370,712 49 21 28 47 Modesto, CA MSA 370,522 62 13 60 67 Santa Barbara--Santa Maria--Lompoc, CA MSA 369,608 3 10 1 6 Madison, WI MSA 367,085 1 32 4 8
35

Ranks of Key Variables for Metropolitan Regions with Population between 250,000 and 500,000 (n=68)
CMSA / CMA Population Talent Melting Pot / Mosaic Index
Bohemian Index
Tech Pole Index
Fort Wayne, IN MSA 363,811 31 55 21 17 Spokane, WA MSA 361,364 21 38 19 18 Beaumont--Port Arthur, TX MSA 361,226 57 41 50 49 Salinas--Seaside--Monterey, CA MSA 355,660 23 4 17 48 Davenport--Rock Island--Moline, IA--IL MSA 350,861 29 47 39 44 Corpus Christi, TX MSA 349,894 44 27 56 53 Lexington-Fayette, KY MSA 348,428 5 49 13 10 Pensacola, FL MSA 344,406 25 43 32 56 Peoria, IL MSA 339,172 33 56 25 52 Reading, PA MSA 336,523 47 42 40 14 Fort Myers--Cape Coral, Fl MSA 335,113 36 25 38 50 Shreveport, LA MSA 334,341 30 63 47 39 Halifax, NS CMA 332,518 14 15 7 20 Atlantic City, NJ MSA 319,416 37 26 29 55 Utica--Rome, NY MSA 316,633 42 36 61 22 Appleton--Oshkosh--Neenah, WI MSA 315,121 34 54 20 31 Huntington--Ashland, WV--KY--OH MSA 312,529 63 67 64 51 Visalia--Tulare--Porterville, CA MSA 311,921 64 9 63 66 Victoria, BC CMA 304,287 24 7 3 38 Montgomery, AL MSA 292,517 19 61 45 34 Rockford, IL MSA 283,719 39 33 37 13 Eugene--Springfield, OR MSA 282,912 16 35 16 23 Macon--Warner Robins, GA MSA 281,103 41 59 53 29 Evansville, IN--KY MSA 278,990 50 66 34 46 Windsor, ON CMA 278,685 52 5 49 63 Salem, OR MSA 278,024 26 20 54 37 Sarasota, FL MSA 277,776 12 18 2 36 Erie, PA MSA 275,572 40 52 43 33 Fayetteville, NC MSA 274,566 51 30 62 65 Oshawa, ON CMA 268,773 67 11 36 54
36

Ranks of Key Variables for Metropolitan Regions with Population between 250,000 and 500,000 (n=68)
CMSA / CMA Population Talent Melting Pot / Mosaic Index
Bohemian Index
Tech Pole Index
New London--Norwich, CT--RI MSA 266,819 17 29 10 12 Binghamton, NY MSA 264,497 20 31 23 3 Provo--Orem, UT MSA 263,590 13 39 14 11 Brownsville--Harlingen, TX MSA 260,120 65 2 65 68 Poughkeepsie, NY MSA 259,462 7 16 8 7 Killeen--Temple, TX MSA 255,301 54 23 66 61 Reno, NV MSA 254,667 22 14 6 45 Fort Pierce, FL MSA 251,071 38 17 57 43 Charleston, WV MSA 250,454 32 64 58 40 Note: In some cases, CMSA and CMA names have been shortened to reflect their core city.
37

Ranks of Key Variables for Metropolitan Regions with Population less than 250,000 (n=159)
CMSA / CMA Population Talent Melting Pot / Mosaic
Bohemian Index
Tech Pole Index
South Bend--Mishawaka, IN MSA 247,052 50 65 89 28 Columbus, GA--AL MSA 243,072 100 60 109 15 Savannah, GA MSA 242,622 70 90 88 26 Johnstown, PA MSA 241,247 153 142 142 50 Springfield, MO MSA 240,593 58 127 33 33 Duluth, MN--WI MSA 239,971 73 92 91 73 Huntsville, AL MSA 238,912 11 59 32 1 Tallahassee, FL MSA 233,598 10 58 18 24 Anchorage, AK MSA 226,338 20 22 22 31 Roanoke, VA MSA 224,477 59 104 31 44 Portsmouth--Dover--Rochester, NH--ME MSA 223,578 23 66 24 12 Kalamazoo, MI MSA 223,411 22 55 26 14 Lubbock, TX MSA 222,636 32 61 71 70 Hickory--Morganton, NC MSA 221,700 137 134 102 105 Waterbury, CT MSA 221,629 52 13 84 11 Saskatoon, SK CMA 219,056 66 14 21 51 Portland, ME MSA 215,281 15 57 7 21 Lincoln, NE MSA 213,641 18 76 10 6 Bradenton, FL MSA 211,707 86 24 45 71 Lafayette, LA MSA 208,740 60 99 101 48 Boise City, ID MSA 205,775 24 85 16 5 Gainesville, FL MSA 204,111 12 26 27 36 Biloxi--Gulfport, MS MSA 197,125 92 73 95 91 Ocala, FL MSA 194,833 143 49 118 121 Green Bay, WI MSA 194,594 69 107 29 57 Regina, SK CMA 193,652 76 11 17 30 St. Cloud, MN MSA 190,921 85 147 73 75 Bremerton, WA MSA 189,731 54 39 39 68 Springfield, IL MSA 189,550 31 112 64 39
38

Ranks of Key Variables for Metropolitan Regions with Population less than 250,000 (n=159)
CMSA / CMA Population Talent Melting Pot / Mosaic
Bohemian Index
Tech Pole Index
Waco, TX MSA 189,123 82 51 49 49 Yakima, WA MSA 188,823 124 8 114 140 Amarillo, TX MSA 187,547 62 44 42 103 Fort Collins--Loveland, CO MSA 186,136 8 63 2 8 Houma--Thibodaux, LA MSA 182,842 159 143 159 125 Chico, CA MSA 182,120 57 21 35 58 Merced, CA MSA 178,403 145 2 131 110 Fort Smith, AR--OK MSA 175,911 140 84 133 117 New Bedford, MA MSA 175,641 106 5 56 37 Asheville, NC MSA 174,821 51 109 28 43 St. John's, NF CMA 174,051 79 68 43 40 Champaign--Urbana--Rantoul, IL MSA 173,025 7 20 4 59 Clarksville--Hopkinsville, TN--KY MSA 169,439 130 72 139 144 Cedar Rapids, IA MSA 168,767 37 100 20 2 Lake Charles, LA MSA 168,134 99 152 154 41 Longview--Marshall, TX MSA 162,431 91 94 122 65 Benton Harbor, MI MSA 161,378 74 56 81 88 Olympia, WA MSA 161,238 25 31 41 54 Topeka, KS MSA 160,976 30 118 72 94 Sudbury, ON CMA 160,488 142 16 128 120 Chicoutimi – Jonquière, QU CMA 160,454 149 150 100 85 Wheeling, WV--OH MSA 159,301 134 126 145 129 Muskegon, MI MSA 158,983 148 122 116 83 Athens, GA MSA 156,267 27 71 44 69 Elkhart--Goshen, IN MSA 156,198 107 86 90 63 Lima, OH MSA 154,340 151 148 130 123 Fargo--Moorhead, ND--MN MSA 153,296 28 97 9 47 Naples, FL MSA 152,099 29 9 23 95 Tyler, TX MSA 151,309 53 47 68 89 Tuscaloosa, AL MSA 150,522 56 116 83 106
39

Ranks of Key Variables for Metropolitan Regions with Population less than 250,000 (n=159)
CMSA / CMA Population Talent Melting Pot / Mosaic
Bohemian Index
Tech Pole Index
Richland--Kennewick--Pasco, WA MSA 150,033 42 10 62 9 Jacksonville, NC MSA 149,838 154 52 153 132 Jackson, MI MSA 149,756 129 119 60 131 Parkersburg--Marietta, WV--OH MSA 149,169 119 149 98 90 Manchester, NH MSA 147,809 36 23 36 7 Sherbrooke, QU CMA 147,384 80 36 54 77 Redding, CA MSA 147,036 118 70 97 99 Waterloo--Cedar Falls, IA MSA 146,611 77 120 59 127 Medford, OR MSA 146,389 68 50 38 86 Anderson, SC MSA 145,196 127 153 119 151 Fort Walton Beach, FL MSA 143,776 45 35 51 19 Steubenville--Weirton, OH--WV MSA 142,523 158 96 151 159 Lynchburg, VA MSA 142,199 75 124 76 27 Monroe, LA MSA 142,191 65 141 99 46 Jamestown--Dunkirk, NY 141,895 104 80 149 108 Trois-Rivières, QU CMA 139,956 126 106 129 111 Janesville--Beloit, WI MSA 139,510 122 102 58 136 Eau Claire, WI MSA 137,543 87 93 75 10 Battle Creek, MI MSA 135,982 115 98 77 155 Las Cruces, NM MSA 135,510 46 4 92 52 Joplin, MO MSA 134,910 128 138 111 134 Laredo, TX MSA 133,239 155 1 148 135 Greeley, CO MSA 131,821 67 32 96 82 Decatur, AL MSA 131,556 103 156 104 116 Alexandria, LA MSA 131,556 123 125 143 130 Burlington, VT MSA 131,439 6 43 5 3 Florence, AL MSA 131,327 102 159 110 150 Charlottesville, VA MSA 131,107 3 53 12 23 Dothan, AL MSA 130,964 101 103 106 93 Terre Haute, IN MSA 130,812 84 91 74 72
40

Ranks of Key Variables for Metropolitan Regions with Population less than 250,000 (n=159)
CMSA / CMA Population Talent Melting Pot / Mosaic
Bohemian Index
Tech Pole Index
Anderson, IN MSA 130,669 141 151 108 152 Lafayette--West Lafayette, IN MSA 130,598 17 27 79 29 Altoona, PA MSA 130,542 152 136 146 61 Bloomington--Normal, IL MSA 129,180 21 89 19 133 Bellingham, WA MSA 127,780 40 12 47 67 Panama City, FL MSA 126,994 90 54 66 74 Mansfield, OH MSA 126,137 144 88 134 17 Saint John, NB CMA 125,705 132 41 126 60 Thunder Bay, ON CMA 125,562 125 6 103 76 Sioux Falls, SD MSA 123,809 38 113 40 16 State College, PA MSA 123,786 16 33 11 13 Pueblo, CO MSA 123,051 108 83 152 98 Yuba City, CA MSA 122,643 136 7 121 143 Wichita Falls, TX MSA 122,378 88 48 93 139 Bryan--College Station, TX MSA 121,862 14 17 69 34 Hagerstown, MD MSA 121,393 147 123 78 124 Sharon, PA MSA 121,003 120 110 115 119 Wilmington, NC MSA 120,284 41 108 25 22 Texarkana, TX--Texarkana, AR MSA 120,132 131 133 150 141 Muncie, IN MSA 119,659 94 128 37 137 Abilene, TX MSA 119,655 48 46 70 114 Odessa, TX MSA 118,934 150 15 135 146 Williamsport, PA MSA 118,710 133 135 120 56 Glens Falls, NY MSA 118,539 93 77 85 38 Decatur, IL MSA 117,206 96 144 136 118 Santa Fe, NM MSA 117,043 2 37 1 64 Anniston, AL MSA 116,034 113 121 147 112 Wausau, WI MSA 115,400 121 81 107 128 Pascagoula, MS MSA 115,243 105 114 57 104 Sioux City, IA--NE MSA 115,018 83 62 137 78
41

Ranks of Key Variables for Metropolitan Regions with Population less than 250,000 (n=159)
CMSA / CMA Population Talent Melting Pot / Mosaic
Bohemian Index
Tech Pole Index
Florence, SC MSA 114,344 97 137 124 107 Billings, MT MSA 113,419 39 111 63 81 Fayetteville--Springdale, AR MSA 113,409 55 101 61 87 Albany, GA MSA 112,561 89 139 117 62 Columbia, MO MSA 112,379 4 38 13 42 Lawton, OK MSA 111,486 72 28 127 115 Bloomington, IN MSA 108,978 13 34 3 35 Danville, VA MSA 108,711 157 157 156 156 Burlington, NC MSA 108,213 98 131 94 80 Yuma, AZ MSA 106,895 139 3 158 149 Midland, TX MSA 106,611 19 19 82 96 Rochester, MN MSA 106,470 9 40 52 4 Sheboygan, WI MSA 103,877 114 69 50 92 Fitchburg--Leominster, MA MSA 102,797 64 18 55 32 Cumberland, MD--WV MSA 101,643 146 140 138 79 Gadsden, AL MSA 99,840 156 145 144 153 San Angelo, TX MSA 98,458 81 29 65 18 La Crosse, WI MSA 97,904 49 75 14 101 Kokomo, IN MSA 96,946 116 132 113 100 Kankakee, IL MSA 96,255 138 105 132 122 Iowa City, IA MSA 96,119 1 25 8 55 Elmira, NY MSA 95,195 95 78 86 20 Sherman--Denison, TX MSA 95,021 110 95 123 25 Bangor, ME MSA 88,745 35 64 46 126 Lewiston--Auburn, ME MSA 88,141 135 42 67 138 Owensboro, KY MSA 87,189 112 158 140 109 Dubuque, IA MSA 86,403 71 129 34 97 Pine Bluff, AR MSA 85,487 109 155 157 158 Bismarck, ND MSA 83,831 33 130 87 84 St. Joseph, MO MSA 83,083 117 146 141 113
42

Ranks of Key Variables for Metropolitan Regions with Population less than 250,000 (n=159)
CMSA / CMA Population Talent Melting Pot / Mosaic
Bohemian Index
Tech Pole Index
Lawrence, KS MSA 81,798 5 30 6 66 Rapid City, SD MSA 81,343 43 87 48 45 Pittsfield, MA MSA 79,250 34 45 15 53 Jackson, TN MSA 77,982 78 154 105 154 Great Falls, MT MSA 77,691 61 74 30 147 Victoria, TX MSA 74,361 111 67 125 145 Cheyenne, WY MSA 73,142 47 79 53 102 Grand Forks, ND MSA 70,683 26 82 80 148 Casper, WY MSA 61,226 44 115 112 142 Enid, OK MSA 56,735 63 117 155 157 Note: In some cases, CMSA and CMA names have been shortened to reflect their core city.
43