computa(onal challenges in construcng the tree of lifeipdps.org/ipdps2017/warnow-ipdps2017.pdf ·...
TRANSCRIPT

Computa(onalChallengesinConstruc(ngtheTreeofLife
TandyWarnowFounderProfessorofEngineering
TheUniversityofIllinoisatUrbana-Champaignh?p://tandy.cs.illinois.edu

Orangutan Gorilla Chimpanzee Human
From the Tree of the Life Website, University of Arizona
Phylogeny(evoluEonarytree)

The “Tree of Life”

“ArchaeaTree”
courtesyofEMSL@PNNL

Phylogenies and Applications
BasicBiology:Howdidlifeevolve?
ApplicaEonsofphylogeniesto:proteinstructureandfuncEonpopulaEongeneEcshumanmigraEonsmetagenomics
“NothinginbiologymakessenseexceptinthelightofevoluEon”--Dobhzansky(1973)


Phylogenomics = Species trees from whole genomes


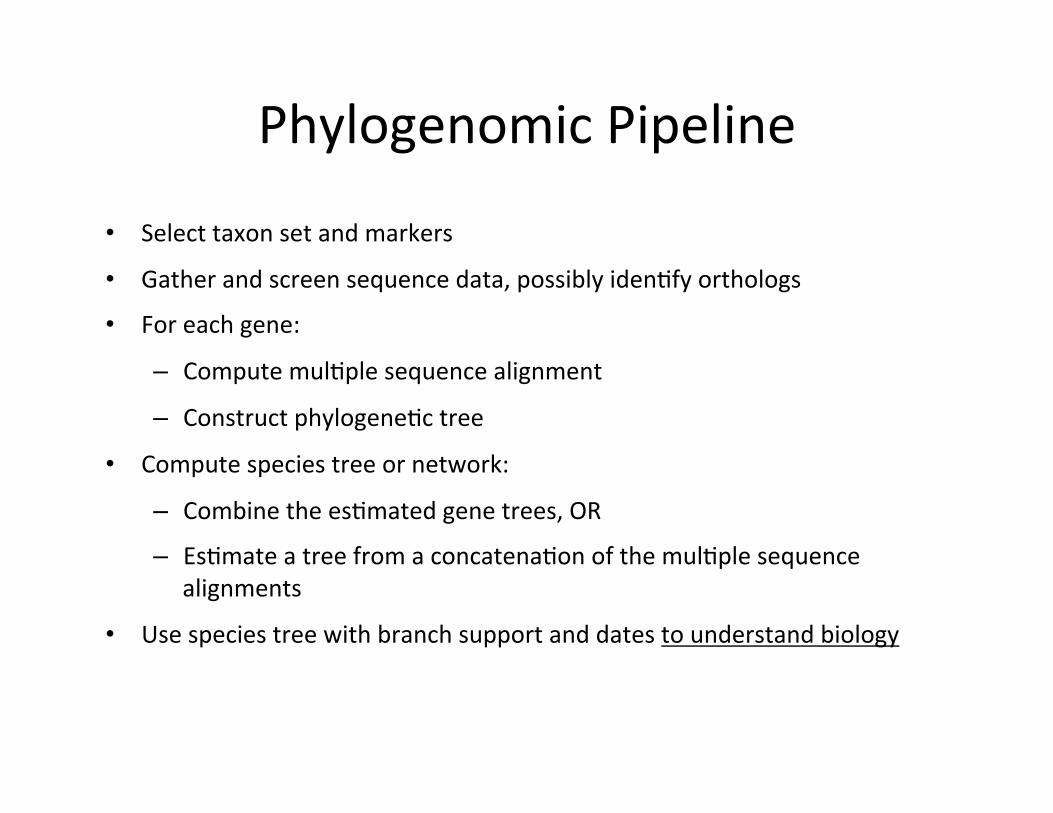
Phylogenomicpipeline
• Selecttaxonsetandmarkers
• Gatherandscreensequencedata,possiblyidenEfyorthologs
• Foreachgene:
– ComputemulEplesequencealignment
– ConstructphylogeneEctree• Computespeciestreeornetwork:
– CombinetheesEmatedgenetrees,OR
– EsEmateatreefromaconcatenaEonofthemulEplesequencealignments
• Usespeciestreewithbranchsupportanddatestounderstandbiology

ButeverythingisNP-hard!
• Selecttaxonsetandmarkers
• Gatherandscreensequencedata,possiblyidenEfyorthologs
• Foreachgene:
– ComputemulEplesequencealignment
– ConstructphylogeneEctree• Computespeciestreeornetwork:
– CombinetheesEmatedgenetrees,OR
– EsEmateatreefromaconcatenaEonofthemulEplesequencealignments
• Usespeciestreewithbranchsupportanddatestounderstandbiology

Avian Phylogenomics Project Erich Jarvis, HHMI
Guojie Zhang, BGI
• Approx. 50 species, whole genomes • 14,000 loci • Multi-national team (100+ investigators) • 8 papers published in special issue of Science 2014
Biggest computational challenges: 1. Multi-million site maximum likelihood analysis (~300 CPU years, and 1Tb of distributed memory, at supercomputers around world) 2. Constructing “coalescent-based” species tree from 14,000 different gene trees
MTP Gilbert, Copenhagen
Siavash Mirarab, Tandy Warnow, Texas Texas and UIUC

90. J. F. Storz, J. C. Opazo, F. G. Hoffmann, Mol. Phylogenet. Evol.66, 469–478 (2013).
91. F. G. Hoffmann, J. F. Storz, T. A. Gorr, J. C. Opazo, Mol. Biol.Evol. 27, 1126–1138 (2010).
ACKNOWLEDGMENTS
Genome assemblies and annotations of avian genomes in thisstudy are available on the avian phylogenomics website(http://phybirds.genomics.org.cn), GigaDB (http://dx.doi.org/10.5524/101000), National Center for Biotechnology Information(NCBI), and ENSEMBL (NCBI and Ensembl accession numbersare provided in table S2). The majority of this study wassupported by an internal funding from BGI. In addition, G.Z. wassupported by a Marie Curie International Incoming Fellowshipgrant (300837); M.T.P.G. was supported by a Danish NationalResearch Foundation grant (DNRF94) and a Lundbeck Foundationgrant (R52-A5062); C.L. and Q.L. were partially supported by aDanish Council for Independent Research Grant (10-081390);and E.D.J. was supported by the Howard Hughes Medical Instituteand NIH Directors Pioneer Award DP1OD000448.
The Avian Genome ConsortiumChen Ye,1 Shaoguang Liang,1 Zengli Yan,1 M. Lisandra Zepeda,2
Paula F. Campos,2 Amhed Missael Vargas Velazquez,2
José Alfredo Samaniego,2 María Avila-Arcos,2 Michael D. Martin,2
Ross Barnett,2 Angela M. Ribeiro,3 Claudio V. Mello,4 Peter V. Lovell,4
Daniela Almeida,3,5 Emanuel Maldonado,3 Joana Pereira,3
Kartik Sunagar,3,5 Siby Philip,3,5 Maria Gloria Dominguez-Bello,6
Michael Bunce,7 David Lambert,8 Robb T. Brumfield,9
Frederick H. Sheldon,9 Edward C. Holmes,10 Paul P. Gardner,11
Tammy E. Steeves,11 Peter F. Stadler,12 Sarah W. Burge,13
Eric Lyons,14 Jacqueline Smith,15 Fiona McCarthy,16
Frederique Pitel,17 Douglas Rhoads,18 David P. Froman19
1China National GeneBank, BGI-Shenzhen, Shenzhen 518083,China. 2Centre for GeoGenetics, Natural History Museum ofDenmark, University of Copenhagen, Øster Voldgade 5-7, 1350Copenhagen, Denmark. 3CIMAR/CIIMAR, Centro Interdisciplinar deInvestigação Marinha e Ambiental, Universidade do Porto, Ruados Bragas, 177, 4050-123 Porto, Portugal. 4Department ofBehavioral Neuroscience Oregon Health & Science UniversityPortland, OR 97239, USA. 5Departamento de Biologia, Faculdadede Ciências, Universidade do Porto, Rua do Campo Alegre, 4169-007 Porto, Portugal. 6Department of Biology, University of PuertoRico, Av Ponce de Leon, Rio Piedras Campus, JGD 224, San Juan,PR 009431-3360, USA. 7Trace and Environmental DNA laboratory,Department of Environment and Agriculture, Curtin University, Perth,Western Australia 6102, Australia. 8Environmental Futures ResearchInstitute, Griffith University, Nathan, Queensland 4121, Australia.9Museum of Natural Science, Louisiana State University, BatonRouge, LA 70803, USA. 10Marie Bashir Institute for InfectiousDiseases and Biosecurity, Charles Perkins Centre, School ofBiological Sciences and Sydney Medical School, The University ofSydney, Sydney NSW 2006, Australia. 11School of BiologicalSciences, University of Canterbury, Christchurch 8140, New Zealand.12Bioinformatics Group, Department of Computer Science, andInterdisciplinary Center for Bioinformatics, University of Leipzig,Hrtelstrasse 16-18, D-04107 Leipzig, Germany. 13European MolecularBiology Laboratory, European Bioinformatics Institute, Hinxton,Cambridge CB10 1SD, UK. 14School of Plant Sciences, BIO5 Institute,University of Arizona, Tucson, AZ 85721, USA. 15Division of Geneticsand Genomics, The Roslin Institute and Royal (Dick) School ofVeterinary Studies, The Roslin Institute Building, University ofEdinburgh, Easter Bush Campus, Midlothian EH25 9RG, UK.16Department of Veterinary Science and Microbiology, University ofArizona, 1117 E Lowell Street, Post Office Box 210090-0090, Tucson,AZ 85721, USA. 17Laboratoire de Génétique Cellulaire, INRA Cheminde Borde-Rouge, Auzeville, BP 52627 , 31326 CASTANET-TOLOSANCEDEX, France. 18Department of Biological Sciences, Science andEngineering 601, University of Arkansas, Fayetteville, AR 72701, USA.19Department of Animal Sciences, Oregon State University, Corvallis,OR 97331, USA.
SUPPLEMENTARY MATERIALS
www.sciencemag.org/content/346/6215/1311/suppl/DC1Supplementary TextFigs. S1 to S42Tables S1 to S51References (92–192)
27 January 2014; accepted 6 November 201410.1126/science.1251385
RESEARCH ARTICLE
Whole-genome analyses resolveearly branches in the tree of lifeof modern birdsErich D. Jarvis,1*† Siavash Mirarab,2* Andre J. Aberer,3 Bo Li,4,5,6 Peter Houde,7
Cai Li,4,6 Simon Y. W. Ho,8 Brant C. Faircloth,9,10 Benoit Nabholz,11
Jason T. Howard,1 Alexander Suh,12 Claudia C. Weber,12 Rute R. da Fonseca,6
Jianwen Li,4 Fang Zhang,4 Hui Li,4 Long Zhou,4 Nitish Narula,7,13 Liang Liu,14
Ganesh Ganapathy,1 Bastien Boussau,15 Md. Shamsuzzoha Bayzid,2
Volodymyr Zavidovych,1 Sankar Subramanian,16 Toni Gabaldón,17,18,19
Salvador Capella-Gutiérrez,17,18 Jaime Huerta-Cepas,17,18 Bhanu Rekepalli,20
Kasper Munch,21 Mikkel Schierup,21 Bent Lindow,6 Wesley C. Warren,22
David Ray,23,24,25 Richard E. Green,26 Michael W. Bruford,27 Xiangjiang Zhan,27,28
Andrew Dixon,29 Shengbin Li,30 Ning Li,31 Yinhua Huang,31
Elizabeth P. Derryberry,32,33 Mads Frost Bertelsen,34 Frederick H. Sheldon,33
Robb T. Brumfield,33 Claudio V. Mello,35,36 Peter V. Lovell,35 Morgan Wirthlin,35
Maria Paula Cruz Schneider,36,37 Francisco Prosdocimi,36,38 José Alfredo Samaniego,6
Amhed Missael Vargas Velazquez,6 Alonzo Alfaro-Núñez,6 Paula F. Campos,6
Bent Petersen,39 Thomas Sicheritz-Ponten,39 An Pas,40 Tom Bailey,41 Paul Scofield,42
Michael Bunce,43 David M. Lambert,16 Qi Zhou,44 Polina Perelman,45,46
Amy C. Driskell,47 Beth Shapiro,26 Zijun Xiong,4 Yongli Zeng,4 Shiping Liu,4
Zhenyu Li,4 Binghang Liu,4 Kui Wu,4 Jin Xiao,4 Xiong Yinqi,4 Qiuemei Zheng,4
Yong Zhang,4 Huanming Yang,48 Jian Wang,48 Linnea Smeds,12 Frank E. Rheindt,49
Michael Braun,50 Jon Fjeldsa,51 Ludovic Orlando,6 F. Keith Barker,52
Knud Andreas Jønsson,51,53,54 Warren Johnson,55 Klaus-Peter Koepfli,56
Stephen O’Brien,57,58 David Haussler,59 Oliver A. Ryder,60 Carsten Rahbek,51,54
Eske Willerslev,6 Gary R. Graves,51,61 Travis C. Glenn,62 John McCormack,63
Dave Burt,64 Hans Ellegren,12 Per Alström,65,66 Scott V. Edwards,67
Alexandros Stamatakis,3,68 David P. Mindell,69 Joel Cracraft,70 Edward L. Braun,71
Tandy Warnow,2,72† Wang Jun,48,73,74,75,76† M. Thomas P. Gilbert,6,43† Guojie Zhang4,77†
To better determine the history of modern birds, we performed a genome-scale phylogeneticanalysis of 48 species representing all orders of Neoaves using phylogenomic methodscreated to handle genome-scale data. We recovered a highly resolved tree that confirmspreviously controversial sister or close relationships. We identified the first divergence inNeoaves, two groups we named Passerea and Columbea, representing independent lineagesof diverse and convergently evolved land and water bird species. Among Passerea, we inferthe common ancestor of core landbirds to have been an apex predator and confirm independentgains of vocal learning. Among Columbea, we identify pigeons and flamingoes as belonging tosister clades. Even with whole genomes, some of the earliest branches in Neoaves provedchallenging to resolve, which was best explained by massive protein-coding sequenceconvergence and high levels of incomplete lineage sorting that occurred during a rapidradiation after the Cretaceous-Paleogene mass extinction event about 66 million years ago.
The diversification of species is not alwaysgradual but can occur in rapid radiations,especially aftermajor environmental changes(1, 2). Paleobiological (3–7) and molecular (8)evidence suggests that such “big bang” radia-
tions occurred for neoavian birds (e.g., songbirds,parrots, pigeons, and others) and placental mam-mals, representing 95% of extant avian and mam-malian species, after the Cretaceous to Paleogene(K-Pg)mass extinction event about 66million yearsago (Ma). However, other nuclear (9–12) and mito-chondrial (13, 14) DNA studies propose an earlier,more gradual diversification, beginning withinthe Cretaceous 80 to 125 Ma. This debate is con-founded by findings that different data sets (15–19)and analytical methods (20, 21) often yield con-
trasting species trees. Resolving such timing andphylogenetic relationships is important for com-parative genomics,which can informabout humantraits and diseases (22).Recent avian studies based on fragments of 5
[~5000 base pairs (bp) (8)] and 19 [31,000 bp (17)]genes recovered some relationships inferred frommorphological data (15, 23) and DNA-DNA hy-bridization (24), postulated new relationships,and contradicted many others. Consistent withmost previous molecular and contemporary mor-phological studies (15), they divided modernbirds (Neornithes) into Palaeognathae (tinamousand flightless ratites), Galloanseres [Galliformes(landfowl) and Anseriformes (waterfowl)], andNeoaves (all other extant birds). Within Neoaves,
1320 12 DECEMBER 2014 • VOL 346 ISSUE 6215 sciencemag.org SCIENCE
A FLOCK OF GENOMES
Jarvis,$Mirarab,$et$al.,$examined$48$
bird$species$using$14,000$loci$from$
whole$genomes.$Two$trees$were$
presented.$
$
1.$A$single$dataset$maximum$
likelihood$concatena,on$analysis$
used$~300$CPU$years$and$1Tb$of$
distributed$memory,$using$TACC$and$
other$supercomputers$around$the$
world.$$
$
2.$However,$every%locus%had%a%different%%tree$–$sugges,ve$of$“incomplete$lineage$sor,ng”$–$and$
the$noisy$genomeHscale$data$required$
the$development$of$a$new$method,$
“sta,s,cal$binning”.$
$
$
$
$
Only48species,buttreeesEmaEontook~300CPUyearsonmulEplesupercomputersandused1Tbofmemory

90. J. F. Storz, J. C. Opazo, F. G. Hoffmann, Mol. Phylogenet. Evol.66, 469–478 (2013).
91. F. G. Hoffmann, J. F. Storz, T. A. Gorr, J. C. Opazo, Mol. Biol.Evol. 27, 1126–1138 (2010).
ACKNOWLEDGMENTS
Genome assemblies and annotations of avian genomes in thisstudy are available on the avian phylogenomics website(http://phybirds.genomics.org.cn), GigaDB (http://dx.doi.org/10.5524/101000), National Center for Biotechnology Information(NCBI), and ENSEMBL (NCBI and Ensembl accession numbersare provided in table S2). The majority of this study wassupported by an internal funding from BGI. In addition, G.Z. wassupported by a Marie Curie International Incoming Fellowshipgrant (300837); M.T.P.G. was supported by a Danish NationalResearch Foundation grant (DNRF94) and a Lundbeck Foundationgrant (R52-A5062); C.L. and Q.L. were partially supported by aDanish Council for Independent Research Grant (10-081390);and E.D.J. was supported by the Howard Hughes Medical Instituteand NIH Directors Pioneer Award DP1OD000448.
The Avian Genome ConsortiumChen Ye,1 Shaoguang Liang,1 Zengli Yan,1 M. Lisandra Zepeda,2
Paula F. Campos,2 Amhed Missael Vargas Velazquez,2
José Alfredo Samaniego,2 María Avila-Arcos,2 Michael D. Martin,2
Ross Barnett,2 Angela M. Ribeiro,3 Claudio V. Mello,4 Peter V. Lovell,4
Daniela Almeida,3,5 Emanuel Maldonado,3 Joana Pereira,3
Kartik Sunagar,3,5 Siby Philip,3,5 Maria Gloria Dominguez-Bello,6
Michael Bunce,7 David Lambert,8 Robb T. Brumfield,9
Frederick H. Sheldon,9 Edward C. Holmes,10 Paul P. Gardner,11
Tammy E. Steeves,11 Peter F. Stadler,12 Sarah W. Burge,13
Eric Lyons,14 Jacqueline Smith,15 Fiona McCarthy,16
Frederique Pitel,17 Douglas Rhoads,18 David P. Froman19
1China National GeneBank, BGI-Shenzhen, Shenzhen 518083,China. 2Centre for GeoGenetics, Natural History Museum ofDenmark, University of Copenhagen, Øster Voldgade 5-7, 1350Copenhagen, Denmark. 3CIMAR/CIIMAR, Centro Interdisciplinar deInvestigação Marinha e Ambiental, Universidade do Porto, Ruados Bragas, 177, 4050-123 Porto, Portugal. 4Department ofBehavioral Neuroscience Oregon Health & Science UniversityPortland, OR 97239, USA. 5Departamento de Biologia, Faculdadede Ciências, Universidade do Porto, Rua do Campo Alegre, 4169-007 Porto, Portugal. 6Department of Biology, University of PuertoRico, Av Ponce de Leon, Rio Piedras Campus, JGD 224, San Juan,PR 009431-3360, USA. 7Trace and Environmental DNA laboratory,Department of Environment and Agriculture, Curtin University, Perth,Western Australia 6102, Australia. 8Environmental Futures ResearchInstitute, Griffith University, Nathan, Queensland 4121, Australia.9Museum of Natural Science, Louisiana State University, BatonRouge, LA 70803, USA. 10Marie Bashir Institute for InfectiousDiseases and Biosecurity, Charles Perkins Centre, School ofBiological Sciences and Sydney Medical School, The University ofSydney, Sydney NSW 2006, Australia. 11School of BiologicalSciences, University of Canterbury, Christchurch 8140, New Zealand.12Bioinformatics Group, Department of Computer Science, andInterdisciplinary Center for Bioinformatics, University of Leipzig,Hrtelstrasse 16-18, D-04107 Leipzig, Germany. 13European MolecularBiology Laboratory, European Bioinformatics Institute, Hinxton,Cambridge CB10 1SD, UK. 14School of Plant Sciences, BIO5 Institute,University of Arizona, Tucson, AZ 85721, USA. 15Division of Geneticsand Genomics, The Roslin Institute and Royal (Dick) School ofVeterinary Studies, The Roslin Institute Building, University ofEdinburgh, Easter Bush Campus, Midlothian EH25 9RG, UK.16Department of Veterinary Science and Microbiology, University ofArizona, 1117 E Lowell Street, Post Office Box 210090-0090, Tucson,AZ 85721, USA. 17Laboratoire de Génétique Cellulaire, INRA Cheminde Borde-Rouge, Auzeville, BP 52627 , 31326 CASTANET-TOLOSANCEDEX, France. 18Department of Biological Sciences, Science andEngineering 601, University of Arkansas, Fayetteville, AR 72701, USA.19Department of Animal Sciences, Oregon State University, Corvallis,OR 97331, USA.
SUPPLEMENTARY MATERIALS
www.sciencemag.org/content/346/6215/1311/suppl/DC1Supplementary TextFigs. S1 to S42Tables S1 to S51References (92–192)
27 January 2014; accepted 6 November 201410.1126/science.1251385
RESEARCH ARTICLE
Whole-genome analyses resolveearly branches in the tree of lifeof modern birdsErich D. Jarvis,1*† Siavash Mirarab,2* Andre J. Aberer,3 Bo Li,4,5,6 Peter Houde,7
Cai Li,4,6 Simon Y. W. Ho,8 Brant C. Faircloth,9,10 Benoit Nabholz,11
Jason T. Howard,1 Alexander Suh,12 Claudia C. Weber,12 Rute R. da Fonseca,6
Jianwen Li,4 Fang Zhang,4 Hui Li,4 Long Zhou,4 Nitish Narula,7,13 Liang Liu,14
Ganesh Ganapathy,1 Bastien Boussau,15 Md. Shamsuzzoha Bayzid,2
Volodymyr Zavidovych,1 Sankar Subramanian,16 Toni Gabaldón,17,18,19
Salvador Capella-Gutiérrez,17,18 Jaime Huerta-Cepas,17,18 Bhanu Rekepalli,20
Kasper Munch,21 Mikkel Schierup,21 Bent Lindow,6 Wesley C. Warren,22
David Ray,23,24,25 Richard E. Green,26 Michael W. Bruford,27 Xiangjiang Zhan,27,28
Andrew Dixon,29 Shengbin Li,30 Ning Li,31 Yinhua Huang,31
Elizabeth P. Derryberry,32,33 Mads Frost Bertelsen,34 Frederick H. Sheldon,33
Robb T. Brumfield,33 Claudio V. Mello,35,36 Peter V. Lovell,35 Morgan Wirthlin,35
Maria Paula Cruz Schneider,36,37 Francisco Prosdocimi,36,38 José Alfredo Samaniego,6
Amhed Missael Vargas Velazquez,6 Alonzo Alfaro-Núñez,6 Paula F. Campos,6
Bent Petersen,39 Thomas Sicheritz-Ponten,39 An Pas,40 Tom Bailey,41 Paul Scofield,42
Michael Bunce,43 David M. Lambert,16 Qi Zhou,44 Polina Perelman,45,46
Amy C. Driskell,47 Beth Shapiro,26 Zijun Xiong,4 Yongli Zeng,4 Shiping Liu,4
Zhenyu Li,4 Binghang Liu,4 Kui Wu,4 Jin Xiao,4 Xiong Yinqi,4 Qiuemei Zheng,4
Yong Zhang,4 Huanming Yang,48 Jian Wang,48 Linnea Smeds,12 Frank E. Rheindt,49
Michael Braun,50 Jon Fjeldsa,51 Ludovic Orlando,6 F. Keith Barker,52
Knud Andreas Jønsson,51,53,54 Warren Johnson,55 Klaus-Peter Koepfli,56
Stephen O’Brien,57,58 David Haussler,59 Oliver A. Ryder,60 Carsten Rahbek,51,54
Eske Willerslev,6 Gary R. Graves,51,61 Travis C. Glenn,62 John McCormack,63
Dave Burt,64 Hans Ellegren,12 Per Alström,65,66 Scott V. Edwards,67
Alexandros Stamatakis,3,68 David P. Mindell,69 Joel Cracraft,70 Edward L. Braun,71
Tandy Warnow,2,72† Wang Jun,48,73,74,75,76† M. Thomas P. Gilbert,6,43† Guojie Zhang4,77†
To better determine the history of modern birds, we performed a genome-scale phylogeneticanalysis of 48 species representing all orders of Neoaves using phylogenomic methodscreated to handle genome-scale data. We recovered a highly resolved tree that confirmspreviously controversial sister or close relationships. We identified the first divergence inNeoaves, two groups we named Passerea and Columbea, representing independent lineagesof diverse and convergently evolved land and water bird species. Among Passerea, we inferthe common ancestor of core landbirds to have been an apex predator and confirm independentgains of vocal learning. Among Columbea, we identify pigeons and flamingoes as belonging tosister clades. Even with whole genomes, some of the earliest branches in Neoaves provedchallenging to resolve, which was best explained by massive protein-coding sequenceconvergence and high levels of incomplete lineage sorting that occurred during a rapidradiation after the Cretaceous-Paleogene mass extinction event about 66 million years ago.
The diversification of species is not alwaysgradual but can occur in rapid radiations,especially aftermajor environmental changes(1, 2). Paleobiological (3–7) and molecular (8)evidence suggests that such “big bang” radia-
tions occurred for neoavian birds (e.g., songbirds,parrots, pigeons, and others) and placental mam-mals, representing 95% of extant avian and mam-malian species, after the Cretaceous to Paleogene(K-Pg)mass extinction event about 66million yearsago (Ma). However, other nuclear (9–12) and mito-chondrial (13, 14) DNA studies propose an earlier,more gradual diversification, beginning withinthe Cretaceous 80 to 125 Ma. This debate is con-founded by findings that different data sets (15–19)and analytical methods (20, 21) often yield con-
trasting species trees. Resolving such timing andphylogenetic relationships is important for com-parative genomics,which can informabout humantraits and diseases (22).Recent avian studies based on fragments of 5
[~5000 base pairs (bp) (8)] and 19 [31,000 bp (17)]genes recovered some relationships inferred frommorphological data (15, 23) and DNA-DNA hy-bridization (24), postulated new relationships,and contradicted many others. Consistent withmost previous molecular and contemporary mor-phological studies (15), they divided modernbirds (Neornithes) into Palaeognathae (tinamousand flightless ratites), Galloanseres [Galliformes(landfowl) and Anseriformes (waterfowl)], andNeoaves (all other extant birds). Within Neoaves,
1320 12 DECEMBER 2014 • VOL 346 ISSUE 6215 sciencemag.org SCIENCE
A FLOCK OF GENOMES
Jarvis,$Mirarab,$et$al.,$examined$48$
bird$species$using$14,000$loci$from$
whole$genomes.$Two$trees$were$
presented.$
$
1.$A$single$dataset$maximum$
likelihood$concatena,on$analysis$
used$~300$CPU$years$and$1Tb$of$
distributed$memory,$using$TACC$and$
other$supercomputers$around$the$
world.$$
$
2.$However,$every%locus%had%a%different%%tree$–$sugges,ve$of$“incomplete$lineage$sor,ng”$–$and$
the$noisy$genomeHscale$data$required$
the$development$of$a$new$method,$
“sta,s,cal$binning”.$
$
$
$
$
ThesecondtreewascomputedbycombiningesEmatedgenetrees,andusedonly5CPUyears(serialEme),andwasembarrassinglyparallel.

12 DECEMBER 2014 • VOL 346 ISSUE 6215 1337SCIENCE sciencemag.org
INTRODUCTION: Reconstructing species
trees for rapid radiations, as in the early
diversification of birds, is complicated by
biological processes such as incomplete
lineage sorting (ILS)
that can cause differ-
ent parts of the ge-
nome to have different
evolutionary histories.
Statistical methods,
based on the multispe-
cies coalescent model and that combine
gene trees, can be highly accurate even
in the presence of massive ILS; however,
these methods can produce species trees
that are topologically far from the species
tree when estimated gene trees have error.
We have developed a statistical binning
technique to address gene tree estimation
error and have explored its use in genome-
scale species tree estimation with MP-EST,
a popular coalescent-based species tree
estimation method.
Statistical binning enables an
accurate coalescent-based estimation
of the avian tree
AVIAN GENOMICS
Siavash Mirarab, Md. Shamsuzzoha Bayzid, Bastien Boussau, Tandy Warnow*
RESEARCH ARTICLE SUMMARY
The statistical binning pipeline for estimating species trees from gene trees. Loci are grouped into bins based on a statistical test for
combinabilty, before estimating gene trees.
Statistical binning technique
Statistical binning pipeline
Traditional pipeline (unbinned)
Sequence data
Incompatibility graph
Gene alignments
Binned supergene alignments
Estimated gene trees
Supergene trees
Species tree
Species tree
RATIONALE: In statistical binning, phy-
logenetic trees on different genes are es-
timated and then placed into bins, so that
the differences between trees in the same
bin can be explained by estimation error
(see the figure). A new tree is then esti-
mated for each bin by applying maximum
likelihood to a concatenated alignment of
the multiple sequence alignments of its
genes, and a species tree is estimated us-
ing a coalescent-based species tree method
from these supergene trees.
RESULTS: Under realistic conditions in
our simulation study, statistical binning
reduced the topological error of species
trees estimated using MP-EST and enabled
a coalescent-based analysis that was more
accurate than concatenation even when
gene tree estimation error was relatively
high. Statistical binning also reduced the
error in gene tree topology and species
tree branch length estimation, especially
when the phylogenetic signal in gene se-
quence alignments was low. Species trees
estimated using MP-EST with statisti-
cal binning on four biological data sets
showed increased concordance with the
biological literature. When MP-EST was
used to analyze 14,446 gene trees in the
avian phylogenomics project, it produced
a species tree that was discordant with the
concatenation analysis and conflicted with
prior literature. However, the statistical
binning analysis produced a tree that was
highly congruent with the concatenation
analysis and was consistent with the prior
scientific literature.
CONCLUSIONS: Statistical binning re-
duces the error in species tree topology
and branch length estimation because
it reduces gene tree estimation error.
These improvements are greatest when
gene trees have reduced bootstrap sup-
port, which was the case for the avian
phylogenomics project. Because using
unbinned gene trees can result in over-
estimation of ILS, statistical binning may
be helpful in providing more accurate
estimations of ILS levels in biological
data sets. Thus, statistical binning enables
highly accurate species tree estimations,
even on genome-scale data sets. �
The list of author affiliations is available in the full article online.
*Corresponding author. E-mail: [email protected] this article as S. Mirarab et al., Science 346, 1250463 (2014). DOI: 10.1126/science.1250463
Read the full article
at http://dx.doi
.org/10.1126/
science.1250463
ON OUR WEB SITE
Published by AAAS
on
Janu
ary
7, 2
015
ww
w.s
cien
cem
ag.o
rgD
ownl
oade
d fro
m
on
Janu
ary
7, 2
015
ww
w.s
cien
cem
ag.o
rgD
ownl
oade
d fro
m
on
Janu
ary
7, 2
015
ww
w.s
cien
cem
ag.o
rgD
ownl
oade
d fro
m
on
Janu
ary
7, 2
015
ww
w.s
cien
cem
ag.o
rgD
ownl
oade
d fro
m
on
Janu
ary
7, 2
015
ww
w.s
cien
cem
ag.o
rgD
ownl
oade
d fro
m
on
Janu
ary
7, 2
015
ww
w.s
cien
cem
ag.o
rgD
ownl
oade
d fro
m
on
Janu
ary
7, 2
015
ww
w.s
cien
cem
ag.o
rgD
ownl
oade
d fro
m
on
Janu
ary
7, 2
015
ww
w.s
cien
cem
ag.o
rgD
ownl
oade
d fro
m
on
Janu
ary
7, 2
015
ww
w.s
cien
cem
ag.o
rgD
ownl
oade
d fro
m
on
Janu
ary
7, 2
015
ww
w.s
cien
cem
ag.o
rgD
ownl
oade
d fro
m
We$used$100$CPU$$
years$(mostly$on$$
TACC)$to$develop$$
and$test$this$$
method.$

1kp:ThousandTranscriptomeProject
l Firststudy(Wicke?,Mirarab,etal.,PNAS2014)had~100speciesand~800genes,genetreesandalignmentsesEmatedusingSATé,andacoalescent-basedspeciestreeesEmatedusingASTRAL
l Secondstudy:PlantTreeofLifebasedontranscriptomesof~1200species,andmorethan13,000genefamilies(mostnotsinglecopy)
GeneTreeIncongruence
G. Ka-Shu Wong U Alberta
N. Wickett Northwestern
J. Leebens-Mack U Georgia
N. Matasci iPlant
T. Warnow, S. Mirarab, N. Nguyen, UIUC UT-Austin UT-Austin
Challenges: Species tree estimation from conflicting gene trees Gene tree estimation of datasets with > 100,000 sequences
Plus many many other people…

Hard Computational Problems
NP-hardproblemsLargedatasets
100,000+sequencesthousandsofgenes
“Bigdata”complexity:
heterogeneitymodelmisspecificaEonfragmentarysequenceserrorsininputdatastreamingdata

Twodimensions
• Numberofgenes(ortotalnumberofsites)– ThousandsofgenesformulE-geneanalyses– Thousandsofsitesforsinglegenes,millionsformulE-geneanalyses
– Sometypesofanalysescanbeparallelized• Numberofspecies
– Manydatasetshavethousandsofspecies– TheTreeofLifewillhavemillions– Numberoftreesonnleavesis(2n-5)!!– Parallelismismuchmorecomplicated

Divide-and-conquer
• Million-sequencemulEplesequencealignments• Genome-scalephylogenyesEmaEonwithupto1,000speciesand1,000genes
• DACTAL(almostalignment-freetreeesEmaEon)• DCM-NJ(boosEngdistance-basedmethods)
Divide-and-conquerkeytotheimprovementsinscalabilityandaccuracy,andproducesembarrassinglyparallelalgorithms.

Today’sTalk
• Briefoverviewofphylogenomicpipeline.• ParallelalgorithmsinphylogeneEcs:
– Ultra-largeMulEpleSequenceAlignment
• Themes• Outstandingproblems
PhylogenomicPipeline
• Selecttaxonsetandmarkers
• Gatherandscreensequencedata,possiblyidenEfyorthologs
• Foreachgene:
– ComputemulEplesequencealignment
– ConstructphylogeneEctree• Computespeciestreeornetwork:
– CombinetheesEmatedgenetrees,OR
– EsEmateatreefromaconcatenaEonofthemulEplesequencealignments
• Usespeciestreewithbranchsupportanddatestounderstandbiology

DNA Sequence Evolution
AAGACTT
TGGACTT AAGGCCT
-3 mil yrs
-2 mil yrs
-1 mil yrs
today
AGGGCAT TAGCCCT AGCACTT
AAGGCCT TGGACTT
TAGCCCA TAGACTT AGCGCTT AGCACAA AGGGCAT
AGGGCAT TAGCCCT AGCACTT
AAGACTT
TGGACTT AAGGCCT
AGGGCAT TAGCCCT AGCACTT
AAGGCCT TGGACTT
AGCGCTT AGCACAA TAGACTT TAGCCCA AGGGCAT

The Classical Phylogeny Problem
TAGCCCA TAGACTT TGCACAA TGCGCTT AGGGCAT
U V W X Y
U
V W
X
Y
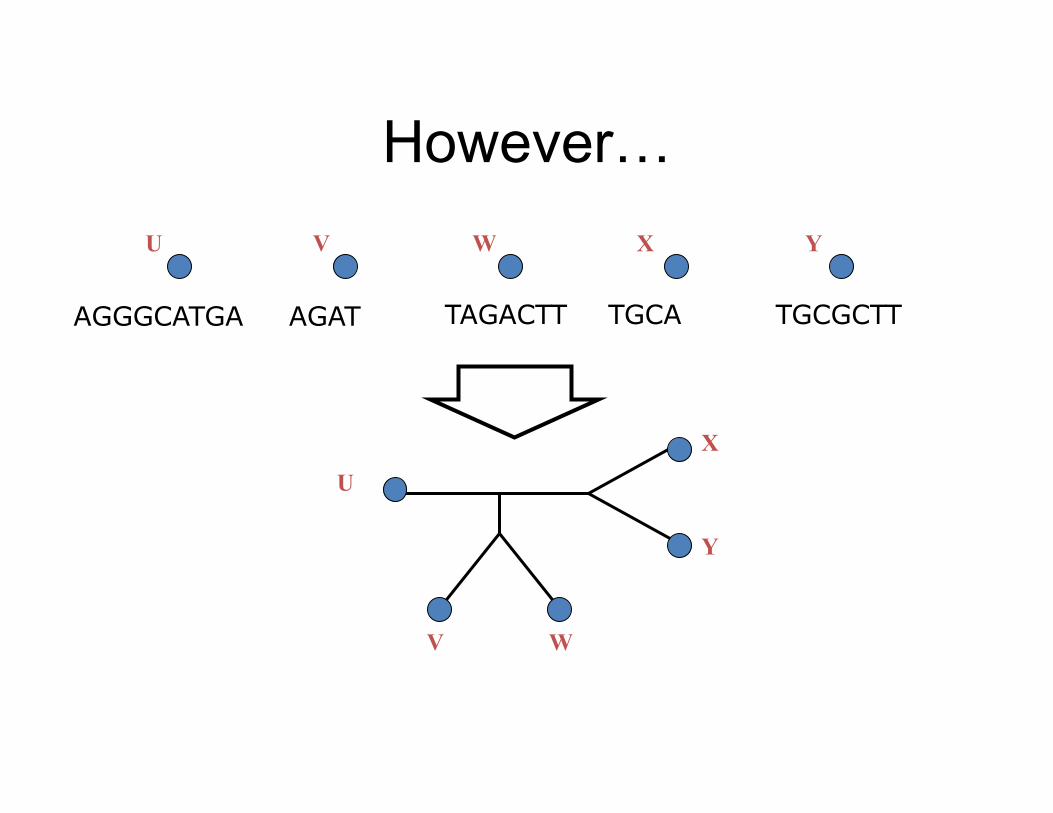
AGAT TAGACTT TGCA TGCGCTT AGGGCATGA
U V W X Y
U
V W
X
Y
However…

…ACGGTGCAGTTACCA…
Mutation Deletion
…ACCAGTCACCA…
Indels (insertions and deletions)

…ACGGTGCAGTTACC-A…
…AC----CAGTCACCTA…
Thetruemul0plealignment– Reflects historical substitution, insertion, and deletion
events – Defined using transitive closure of pairwise alignments
computed on edges of the true tree
…ACGGTGCAGTTACCA…
Substitution Deletion
…ACCAGTCACCTA…
Insertion

Input: unaligned sequences
S1 = AGGCTATCACCTGACCTCCA S2 = TAGCTATCACGACCGC S3 = TAGCTGACCGC S4 = TCACGACCGACA

Phase 1: Alignment
S1 = -AGGCTATCACCTGACCTCCA S2 = TAG-CTATCAC--GACCGC-- S3 = TAG-CT-------GACCGC-- S4 = -------TCAC--GACCGACA
S1 = AGGCTATCACCTGACCTCCA S2 = TAGCTATCACGACCGC S3 = TAGCTGACCGC S4 = TCACGACCGACA

Phase 2: Construct tree
S1 = -AGGCTATCACCTGACCTCCA S2 = TAG-CTATCAC--GACCGC-- S3 = TAG-CT-------GACCGC-- S4 = -------TCAC--GACCGACA
S1 = AGGCTATCACCTGACCTCCA S2 = TAGCTATCACGACCGC S3 = TAGCTGACCGC S4 = TCACGACCGACA
S1
S4
S2
S3

Phylogenomicpipeline
• Selecttaxonsetandmarkers
• Gatherandscreensequencedata,possiblyidenEfyorthologs
• Foreachgene:
– ComputemulEplesequencealignment
– ConstructphylogeneEctree• Computespeciestreeornetwork:
– CombinetheesEmatedgenetrees,OR
– EsEmateatreefromaconcatenaEonofthemulEplesequencealignments
• Usespeciestreewithbranchsupportanddatestounderstandbiology

First Align, then Compute the Tree
S1 = -AGGCTATCACCTGACCTCCA S2 = TAG-CTATCAC--GACCGC-- S3 = TAG-CT-------GACCGC-- S4 = -------TCAC--GACCGACA
S1 = AGGCTATCACCTGACCTCCA S2 = TAGCTATCACGACCGC S3 = TAGCTGACCGC S4 = TCACGACCGACA
S1
S4
S2
S3

Simulation Studies
S1 S2
S3 S4
S1 = -AGGCTATCACCTGACCTCCA S2 = TAG-CTATCAC--GACCGC-- S3 = TAG-CT-------GACCGC-- S4 = -------TCAC--GACCGACA
S1 = AGGCTATCACCTGACCTCCA S2 = TAGCTATCACGACCGC S3 = TAGCTGACCGC S4 = TCACGACCGACA
S1 = -AGGCTATCACCTGACCTCCA S2 = TAG-CTATCAC--GACCGC-- S3 = TAG-C--T-----GACCGC-- S4 = T---C-A-CGACCGA----CA
Compare
True tree and alignment
S1 S4
S3 S2
Estimated tree and alignment
Unaligned Sequences

Quantifying Error
FN: false negative (missing edge) FP: false positive (incorrect edge) 50% error rate
FN
FP

Two-phaseesEmaEonAlignmentmethods• Clustal• POY(andPOY*)• Probcons(andProbtree)• Probalign• MAFFT• Muscle• Di-align• T-Coffee• Prank(PNAS2005,Science2008)• Opal(ISMBandBioinf.2007)• FSA(PLoSComp.Bio.2009)• Infernal(Bioinf.2009)• Etc.
Phylogenymethods• BayesianMCMC• Maximumparsimony• Maximumlikelihood• Neighborjoining• FastME• UPGMA• Quartetpuzzling• Etc.
RAxML:heuris(cforlarge-scaleMLop(miza(on

1000-taxonmodels,orderedbydifficulty(Liuetal.,2009)

Large-scale Alignment Estimation
• ManygenesareconsideredunalignableduetohighratesofevoluEon
• Onlyafewmethodscananalyzelargedatasets
• AlignmenterrorincreaseswithrateofevoluEon,andresultsintreeesEmaEonerror

Multiple Sequence Alignment (MSA): a scientific grand challenge1
S1 = -AGGCTATCACCTGACCTCCA S2 = TAG-CTATCAC--GACCGC-- S3 = TAG-CT-------GACCGC-- … Sn = -------TCAC--GACCGACA
S1 = AGGCTATCACCTGACCTCCA S2 = TAGCTATCACGACCGC S3 = TAGCTGACCGC … Sn = TCACGACCGACA
Novel techniques needed for scalability and accuracy NP-hard problems and large datasets Current methods do not provide good accuracy Few methods can analyze even moderately large datasets Many important applications besides phylogenetic estimation
1 Frontiers in Massive Data Analysis, National Academies Press, 2013

Large-scale Alignment Estimation
• ManygenesareconsideredunalignableduetohighratesofevoluEon
• Onlyafewmethodscananalyzelargedatasets
• AlignmenterrorincreaseswithrateofevoluEon,andresultsintreeesEmaEonerror

1000-taxonmodels,orderedbydifficulty(Liuetal.,2009)

Re-aligning on a tree A
B D
C
Merge sub-alignments
Estimate ML tree on merged
alignment
Decompose dataset
A B
C D
Align subsets
A B
C D
ABCD
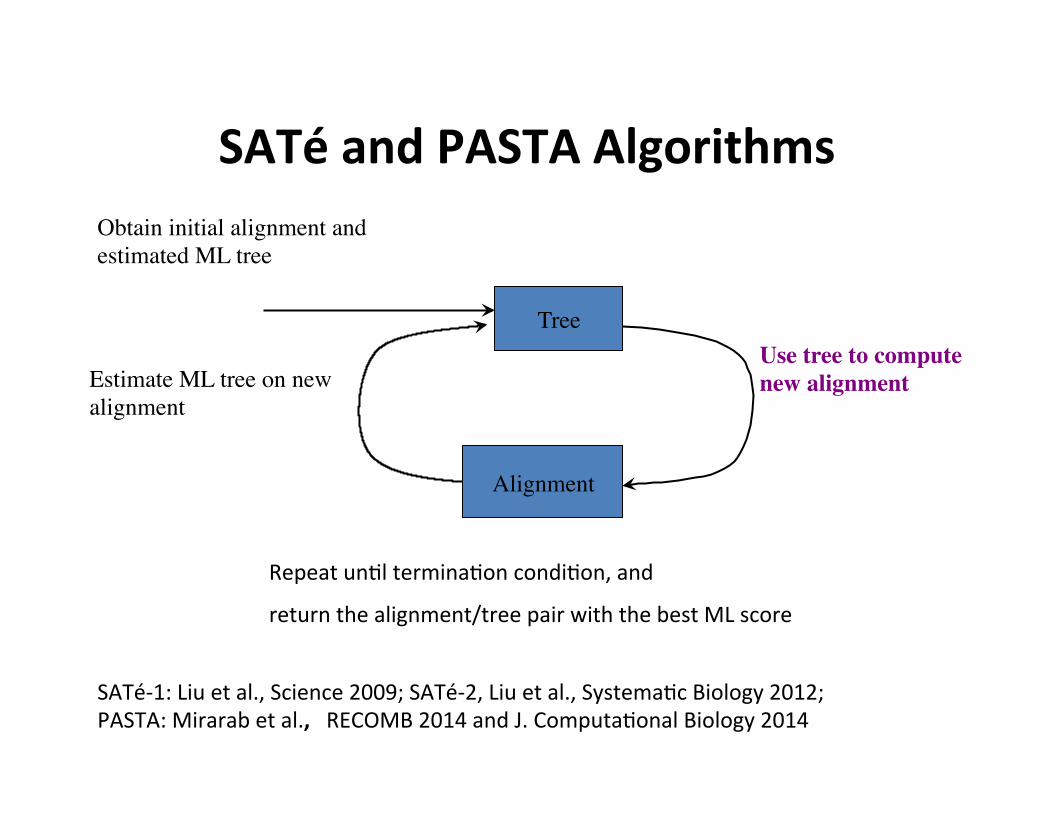
SATéandPASTAAlgorithms
Estimate ML tree on new alignment
Tree
Obtain initial alignment and estimated ML tree
Use tree to compute new alignment
Alignment
RepeatunElterminaEoncondiEon,and
returnthealignment/treepairwiththebestMLscore
SATé-1:Liuetal.,Science2009;SATé-2,Liuetal.,SystemaEcBiology2012;PASTA:Mirarabetal.,RECOMB2014andJ.ComputaEonalBiology2014
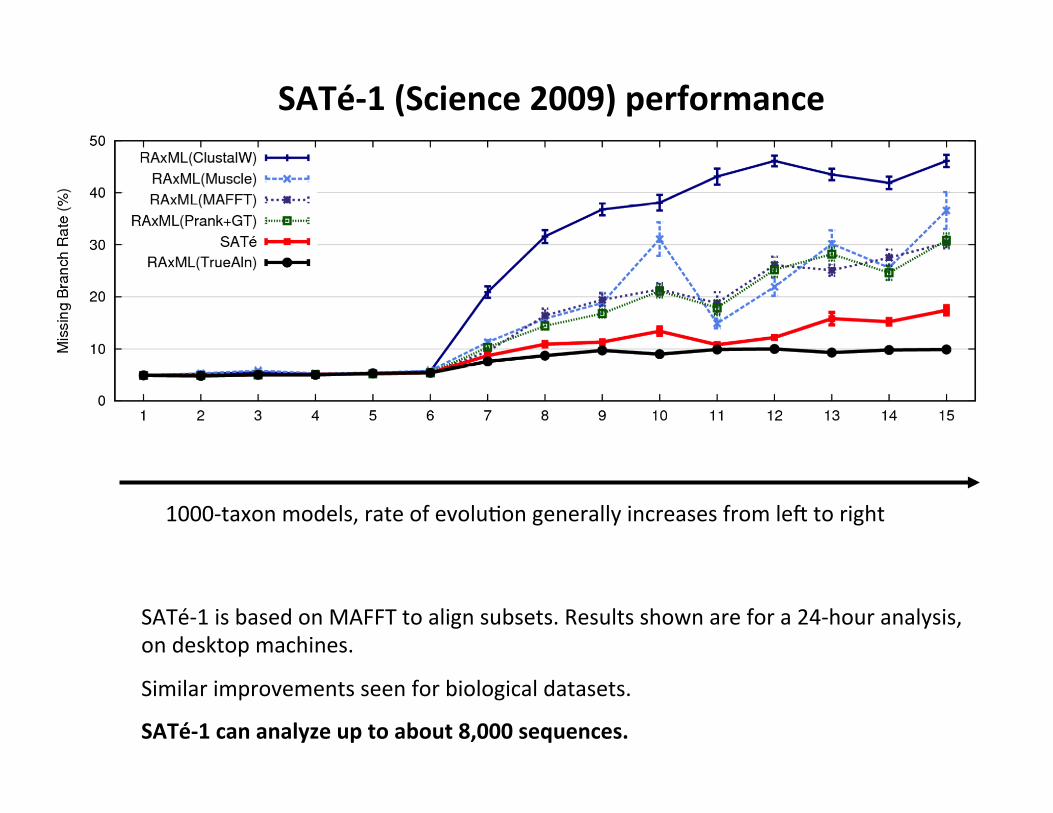
1000-taxonmodels,rateofevoluEongenerallyincreasesfromlertoright
SATé-1isbasedonMAFFTtoalignsubsets.Resultsshownarefora24-houranalysis,ondesktopmachines.
Similarimprovementsseenforbiologicaldatasets.
SATé-1cananalyzeuptoabout8,000sequences.
SATé-1(Science2009)performance

SATé-I decomposition (clades) A
B D
C
Merge sub-alignments
Estimate ML tree on merged
alignment
Decompose dataset
A B
C D
Align subsets
A B
C D
ABCD

SATé-II:centroidedgedecomposiEon
A
B
C
D
E
ABCDE
ABC
AB
A B
C
DE
D E
SATé-IImakesallsubsetssmall(userparameter),andcananalyze50Ksequences.
(RecallthattheSATé-IdecomposiEonproducedcladesand
hadbiggersubsets;limitedto8Ksequences.)

1000-taxonmodelsrankedbydifficulty
SATé-1andSATé-2(Systema0cBiology,2012)
SATé-1:upto8KSATé-2:upto~50K

SATé-II running time profiling ����� �����
�
��
���
�
����
����
����
�����
�� ����� ��
� � ���� ����� �� ��
��� ������ ���

SATé-II running time profiling
�
�
�
�
�
� � � � � �� ������ � �������
�������
�����
����� �����
�
��
���
�
����
����
����
�����
�� ����� ��
� � ���� ����� �� ��
��� ������ ���

PASTA: SATé-II with a new merger technique
A
B D
C
Merge sub-alignments
Estimate ML tree on merged
alignment
Decompose dataset
A B
C D
Align subsets
A B
C D
ABCD

SATé:mergerstrategy
A
B
C
D
E
ABCDE
ABC
AB
A B
C
DE
D E
BothSATé’susethesamehierarchicalmergerstrategy.Onlarge(50K)datasets,thelastpairwisemergercanuse
morethan70%oftherunningEme

A
B
C
D
E
PASTAmerging:Step1
D
C
EBA
ComputeaspanningtreeconnecEngalignmentsubsets

A
B
C
D
E
PASTAmerging:Step2
D
C
EBA
AB
BD
CD
DE
ABBD
CD
DE
UseOpal(orMuscle)tomergeadjacentsubsetalignmentsinthespanningtree

PASTAmerging:Step3
D
C
EBA
UsetransiEvitytomergeallpairwise-mergedalignmentsfromStep2intofinalanalignmentonenEredataset
AB+BD=ABDABD+CD=ABCDABCD+DE=ABCDE
ABBD
CD
DE

SATé-II running time profiling
�
�
�
�
�
� � � � � �� ������ � �������
�������
�����
����� �����
�
��
���
�
����
����
����
�����
�� ����� ��
� � ���� ����� �� ��
��� ������ ���

1
2
4
6
8
1 2 4 6 8 10 12Number of Threads
Speedup
SATe2
PASTAvs.SATé-IIprofilingandscaling10 PASTA: ultra-large multiple sequence alignment
(a)
●
●
●
●
●
●
●
●
0
250
500
750
1000
1250
10,000 50,000 100,000 200,000Number of Sequences
Run
ning
tim
e (m
inut
es)
(b)
●●
●●
●
●
●
●
●
●
●
●
●
●
1
2
4
6
8
1 2 4 6 8 10 12Number of Threads
Spee
dup
●
●
PASTASATe2
(c)
Fig. 5. Running time comparison of PASTA and SATe. (a) Running time pro-filing on one iteration for RNASim datasets with 10K and 50K sequences (the dottedregion indicates the last pairwise merge). (b) Running time for one iteration of PASTAwith 12 CPUs as a function of the number of sequences (the solid line is fitted to firsttwo points). (c) Scalability for PASTA and SATe with increased number of CPUs.
reason SATe uses so much time is that all mergers are done hierarchically usingeither Opal (for small datasets) or Muscle (on larger datasets), and both arecomputationally expensive with increased number of sequences. For example,the last pairwise merge within SATe, shown by the dotted area in Figure 5a,is entirely serial and takes up a large chunk of the total time. PASTA solvesthis problem by using transitivity for all but the initial pairwise mergers, andtherefore scales well with increased dataset size, as shown in Figure 5b (thesub-linear scaling is due to a better use of parallelism with increased number ofsequences). Finally, Figure 5c shows that PASTA is highly parallelizable, andhas a much better speed-up with increasing number of threads than SATe does.While PASTA has a much improved parallelization, it does not quite scale uplinearly, because FastTree-2 does not scale up well with increased thread count.
Divide-and-Conquer strategy: impact of guide tree. We also investigated theimpact of the use of the guide tree for computing the subset decomposition,and hence defining the Type 1 sub-alignments. We compared results obtainedusing three di↵erent decompositions: the decomposition computed by PASTAon the HMM-based starting tree, the decomposition computed by PASTA onthe true (model) tree, and a random decomposition into subsets of size 200,all on the RNASim 10k dataset. PASTA alignments and trees had roughly thesame accuracy when the guide tree was either the true tree or the HMM-basedstarting tree (Table 3). However, when based on a random decomposition, treeerror increased dramatically from 10.5% to 52.3%, and alignment scores alsodropped substantially. Thus, the guide-tree based dataset decomposition usedby PASTA provides substantial improvements over random decompositions, andthe default technique for getting the starting tree works quite well.
10000 50000
0
50
100
0
1000
2000
3000
Running
Time(minutes)
MergeSubsetAlignment Tree
PASTA SATe-IIPASTA SATe-II

PASTA Running Time and Scalability
10 PASTA: ultra-large multiple sequence alignment
(a)
●
●
●
●
●
●
●
●
0
250
500
750
1000
1250
10,000 50,000 100,000 200,000Number of Sequences
Run
ning
tim
e (m
inut
es)
(b)
●●
●●
●
●
●
●
●
●
●
●
●
●
1
2
4
6
8
1 2 4 6 8 10 12Number of Threads
Spee
dup
●
●
PASTASATe2
(c)
Fig. 5. Running time comparison of PASTA and SATe. (a) Running time pro-filing on one iteration for RNASim datasets with 10K and 50K sequences (the dottedregion indicates the last pairwise merge). (b) Running time for one iteration of PASTAwith 12 CPUs as a function of the number of sequences (the solid line is fitted to firsttwo points). (c) Scalability for PASTA and SATe with increased number of CPUs.
reason SATe uses so much time is that all mergers are done hierarchically usingeither Opal (for small datasets) or Muscle (on larger datasets), and both arecomputationally expensive with increased number of sequences. For example,the last pairwise merge within SATe, shown by the dotted area in Figure 5a,is entirely serial and takes up a large chunk of the total time. PASTA solvesthis problem by using transitivity for all but the initial pairwise mergers, andtherefore scales well with increased dataset size, as shown in Figure 5b (thesub-linear scaling is due to a better use of parallelism with increased number ofsequences). Finally, Figure 5c shows that PASTA is highly parallelizable, andhas a much better speed-up with increasing number of threads than SATe does.While PASTA has a much improved parallelization, it does not quite scale uplinearly, because FastTree-2 does not scale up well with increased thread count.
Divide-and-Conquer strategy: impact of guide tree. We also investigated theimpact of the use of the guide tree for computing the subset decomposition,and hence defining the Type 1 sub-alignments. We compared results obtainedusing three di↵erent decompositions: the decomposition computed by PASTAon the HMM-based starting tree, the decomposition computed by PASTA onthe true (model) tree, and a random decomposition into subsets of size 200,all on the RNASim 10k dataset. PASTA alignments and trees had roughly thesame accuracy when the guide tree was either the true tree or the HMM-basedstarting tree (Table 3). However, when based on a random decomposition, treeerror increased dramatically from 10.5% to 52.3%, and alignment scores alsodropped substantially. Thus, the guide-tree based dataset decomposition usedby PASTA provides substantial improvements over random decompositions, andthe default technique for getting the starting tree works quite well.
• One iteration
• Using • 12 cpus • 1 node on Lonestar TACC • Maximum 24 GB memory
• Showing wall clock running time • ~ 1 hour for 10k taxa • ~ 17 hours for 200k taxa

MassiveParallelisminPASTA• Divisionstep:veryfast(notworsethanO(n2))• So1,000,000-sequencedatasetbecomes:
– ~5000subsetsof200sequenceseach– Eachanalyzedindependently– Cantailorsubsetanalysistofeaturesofthedata
• Mergingstep:veryfastandalsomassivelyparallel(independentpairwisemergers,thentransiEvity)
TheonlypartofPASTAthatisn’twellparallelizedisthetreeesEmaEonstepineachiteraEon!

RNASim
0.00
0.05
0.10
0.15
0.20
10000 50000 100000 200000
Tree
Erro
r (FN
Rat
e) Clustal−OmegaMuscleMafftStarting TreeSATe2PASTAReference Alignment
PASTA:Mirarab,Nguyen,andWarnow,JComp.Biol.2015– SimulatedRNASimdatasetsfrom10Kto200Ktaxa– Limitedto24hoursusing12CPUs– Notallmethodscouldrun(missingbarscouldnotfinish)
PASTA:evenbe?erthanSATé-2

RNASimMillionSequences:treeerror
Using 12 TACC processors: • UPP(Fast,NoDecomp)
took 2.2 days,
• UPP(Fast) took 11.9 days, and
• PASTA took 10.3 days
UPP:Nguyenetal.RECOMB2015andGenomeBiology2015(alsousesdivide-and-conquerandishighlyparallelizable.)

PASTAandSATé-II:MSA“boosters”
• PASTAandSATé-IIaretechniquesforimprovingthescalabilityofMSAmethodstolargedatasets.
• WeshowedresultshereusingMAFFT-l-ins-itoalignsmallsubsetswith200sequences.

GoldStandard:StaEsEcalco-esEmaEon
• Improvedaccuracycanbeobtainedthroughco-esEmaEonofalignmentsandtrees.
• BAli-Phy(RedelingsandSuchard,2005),aBayesianmethod,istheleadingco-esEmaEonmethod.
• However,BAli-Phyislimitedtosmalldatasets(atmost100sequences),andeventheseanalysescantakeweeks(duetoconvergenceissues).
• WeintegratedBAli-PhyintoPASTA(replacingMAFFT),withdecomposiEonstoatmost100sequences.
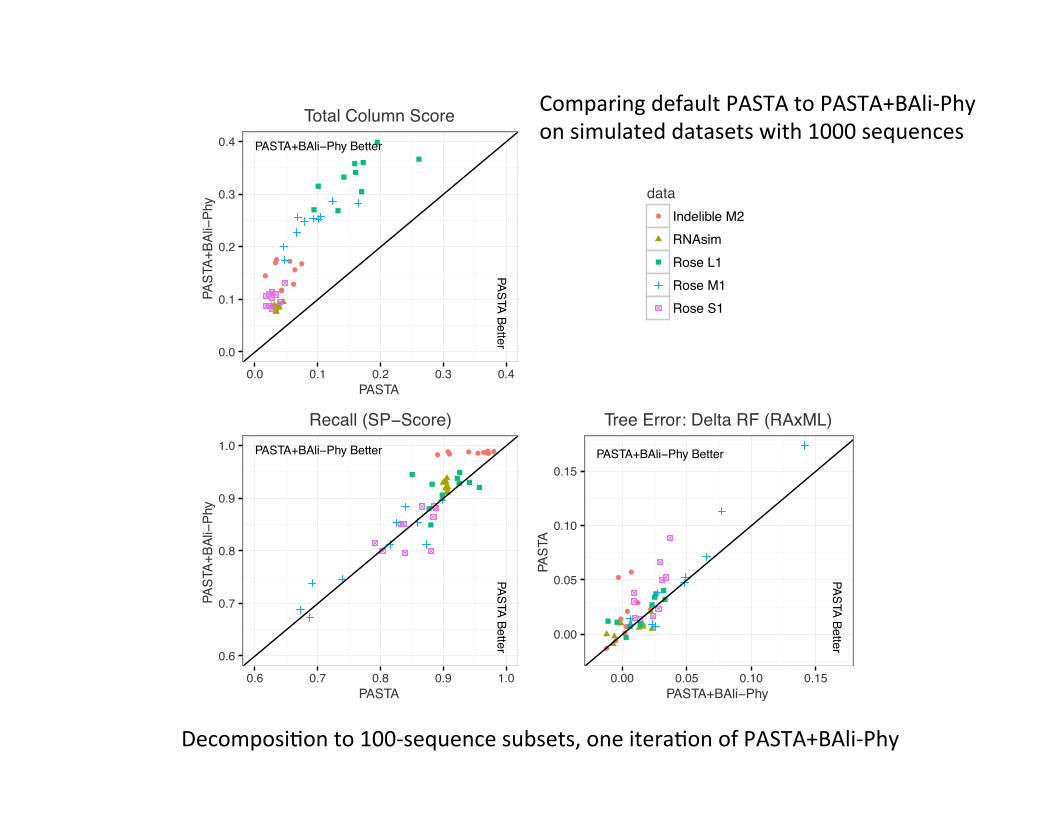
DecomposiEonto100-sequencesubsets,oneiteraEonofPASTA+BAli-Phy
ComparingdefaultPASTAtoPASTA+BAli-Phyonsimulateddatasetswith1000sequences
PASTA+BAli−Phy Better
PASTA Better
0.0
0.1
0.2
0.3
0.4
0.0 0.1 0.2 0.3 0.4PASTA
PAST
A+BA
li−Ph
y
Total Column Score
dataIndelible M2RNAsimRose L1Rose M1Rose S1
PASTA+BAli−Phy Better
PASTA Better
0.6
0.7
0.8
0.9
1.0
0.6 0.7 0.8 0.9 1.0PASTA
PAST
A+BA
li−Ph
y
Recall (SP−Score)
PASTA+BAli−Phy Better
PASTA Better
0.00
0.05
0.10
0.15
0.00 0.05 0.10 0.15PASTA+BAli−Phy
PAST
A
Tree Error: Delta RF (RAxML)

SATéandPASTAAlgorithms
Estimate ML tree on new alignment
Tree
Obtain initial alignment and estimated ML tree
Use tree to compute new alignment
Alignment
RepeatunElterminaEoncondiEon,and
returnthealignment/treepairwiththebestMLscore

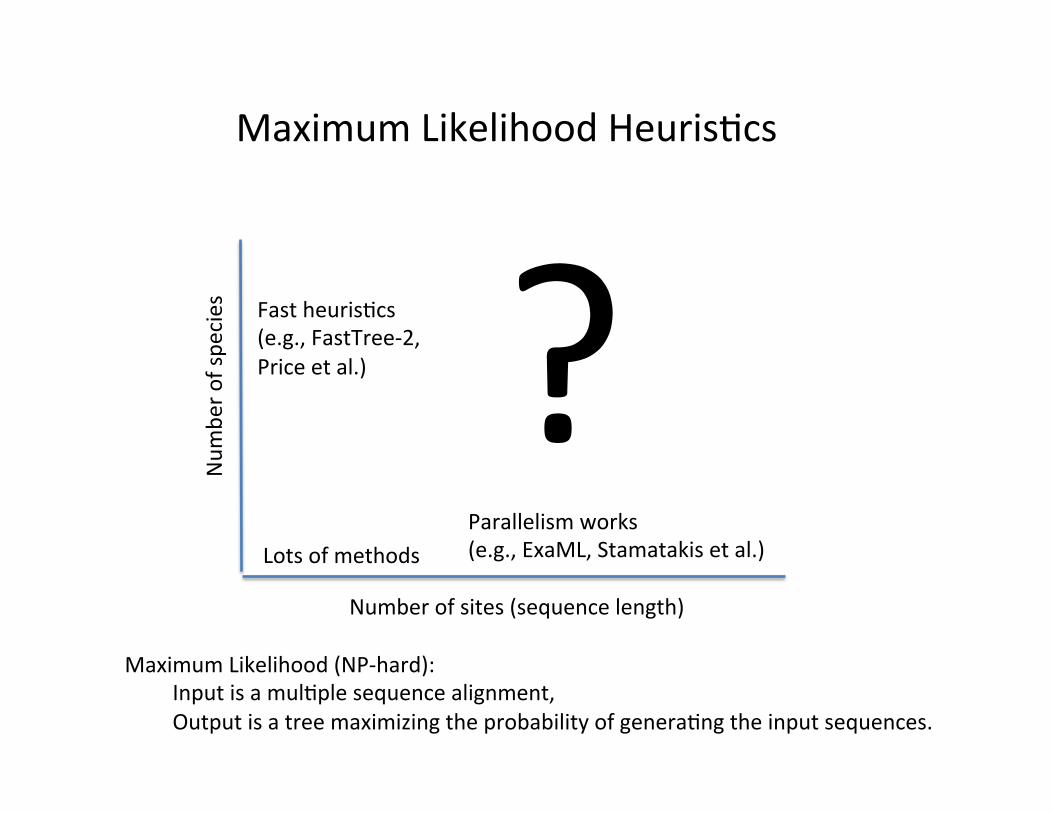
MajorOpenProblem
• ScalablemaximumlikelihoodtreeesEmaEon– Input:MulEplesequencealignment(andspecifiedmodel)
– Output:Treeandnumericparameterstomaximizeprobabilityofthesequencesunderthemodel

Numberofsites(sequencelength)
Num
bero
fspe
cies
MaximumLikelihoodHeurisEcs
MaximumLikelihood(NP-hard):InputisamulEplesequencealignment,OutputisatreemaximizingtheprobabilityofgeneraEngtheinputsequences.

Numberofsites(sequencelength)
Num
bero
fspe
cies
Lotsofmethods
MaximumLikelihoodHeurisEcs
MaximumLikelihood(NP-hard):InputisamulEplesequencealignment,OutputisatreemaximizingtheprobabilityofgeneraEngtheinputsequences.

Numberofsites(sequencelength)
Num
bero
fspe
cies
LotsofmethodsParallelismworks(e.g.,ExaML,Stamatakisetal.)
MaximumLikelihoodHeurisEcs
MaximumLikelihood(NP-hard):InputisamulEplesequencealignment,OutputisatreemaximizingtheprobabilityofgeneraEngtheinputsequences.

Numberofsites(sequencelength)
Num
bero
fspe
cies
LotsofmethodsParallelismworks(e.g.,ExaML,Stamatakisetal.)
FastheurisEcs(e.g.,FastTree-2,Priceetal.)
MaximumLikelihoodHeurisEcs
MaximumLikelihood(NP-hard):InputisamulEplesequencealignment,OutputisatreemaximizingtheprobabilityofgeneraEngtheinputsequences.
Numberofsites(sequencelength)
Num
bero
fspe
cies
LotsofmethodsParallelismworks(e.g.,ExaML,Stamatakisetal.)
FastheurisEcs(e.g.,FastTree-2,Priceetal.)
MaximumLikelihoodHeurisEcs
?MaximumLikelihood(NP-hard):
InputisamulEplesequencealignment,OutputisatreemaximizingtheprobabilityofgeneraEngtheinputsequences.

MajorOpenProblems
• ScalablemaximumlikelihoodtreeesEmaEon– Input:MulEplesequencealignment(andspecifiedmodel)
– Output:Treeandnumericparameterstomaximizeprobabilityofthesequencesunderthemodel
– Comments:RAxMLcannotanalyzelargenumbersofsequencesefficiently;FastTreecannotanalyzelongalignments(andhaspoorparallelism)

SecondMajorOpenProblemSupertreeesEmaEon• Input:SetTofunrootedtreesonsubsetsofS• Output:TreeTthatminimizestotaldistancetotreesinTComments:• BasicprobleminphylogeneEcs.• Keyalgorithmicstepindivide-and-conquertreeesEmaEon
methods.• ThebestcurrentmethodsrelyonheurisEcsforNP-hard
opEmizaEonproblems,andsocannotscaletolargedatasets(foreitherdimensionoflarge!).

DACTAL
Supertree Estimation
Compute trees on each subset
Decompose
BLAST-based
Overlapping subsets
A tree for each subset
Unaligned Sequences
A tree for the entire dataset

DACTALcomparedtoSATéandstandardmethods
16S.Tdataset7350sequencesfromtheCRW(ComparaEveRibosomalDatabase)

ObservaEons• HighlyaccuratestaEsEcalmethods(especiallymaximumlikelihoodandBayesianmethods)havebeendevelopedformanyproblems.
• However,thesemethodsweretypicallydesignedforsmalldatasets,andeitherdonotrunonlargedatasets,taketoolong,orhavepooraccuracy.
• RelaEveperformanceofmethodscanchangewithdatasetsizeandheterogeneity!
• Butappropriatedivide-and-conquerstrategiescanmakethemscaletolargedatasets,andbemassivelyparallel.

Summary
• Divide-and-conquerinphylogeneEcsandmulEplesequencealignmentisverypowerful,andcanleadtoimprovedaccuracyandscalability.
• Theingredientsofthesestrategiesare:– ExisEngtree-basedapproachesforthedecomposiEonstep– ExisEngstaEsEcalmethodsforanalyzingsubsets(orencomputaEonallyintensive)
– CombiningsoluEonsfromsubsetsiswheretheresearchisneeded!
• DistributedcompuEngisnecessaryforsomedatasets

Scientific challenges: • Ultra-large multiple-sequence alignment • Gene tree estimation • Metagenomic classification • Alignment-free phylogeny estimation • Supertree estimation • Estimating species trees from many gene trees • Genome rearrangement phylogeny • Reticulate evolution • Visualization of large trees and alignments • Data mining techniques to explore multiple optima • Theoretical guarantees under Markov models of evolution
Techniques: applied probability theory, graph theory, supercomputing, and heuristics Testing: simulations and real data
The Tree of Life: Multiple Challenges

Acknowledgments
PASTA:NamNguyen(nowpostdocatUIUC)andSiavashMirarab(nowfacultyatUCSD),undergrad:KeerthanaKumar(atUT-AusEn)PASTA+BAli-Phy:MikeNute(PhDstudentatUIUC)DACTAL:SeritaNelesen(nowprofessoratCalvinCollege)CurrentNSFgrants:ABI-1458652(mulEplesequencealignment)GraingerFounda0on(atUIUC),andUIUCTACC,UTCS,BlueWaters,andUIUCcampusclusterPASTAisavailableongithubath?ps://github.com/smirarab/pasta;seealsoPASTA+BAli-Phyath?p://github.com/MGNute/pasta