condensed interim consolidated financial statements...the company is registered and domiciled in...
TRANSCRIPT
Condensed Interim Consolidated Financial Statements
First Quarter- March 31, 2020 (unaudited)
(In U.S. dollars, tabular amounts in millions, except where indicated)

First Quantum Minerals Ltd. Interim Consolidated Statements of Earnings (Loss) (unaudited)
(expressed in millions of U.S. dollars, except where indicated and share and per share amounts)
The accompanying notes are an integral part of these unaudited interim consolidated financial statements.
1
Three months ended March 31
Note 2020 2019
Sales revenues 13 1,182 857
Cost of sales 14 (1,035) (672)
Gross profit 147 185
Exploration (3) (4)
General and administrative (22) (18)
Other expense 17 (118) (10)
Operating profit 4 153
Finance income 17 5
Finance costs 15 (201) (6)
Movement in Zambian VAT discount 3c 37 -
Loss on redemption of senior notes 8 (2) (25)
Earnings (loss) before income taxes (145) 127
Income tax credit (expense) 16 50 (62)
Net earnings (loss) (95) 65
Net earnings (loss) attributable to:
Non-controlling interests (33) 12
Shareholders of the Company 12 (62) 53
Earnings (loss) per common share attributable to
the shareholders of the Company
Net earnings (loss) ($ per share)
Basic 12 (0.09) 0.08
Diluted 12 (0.09) 0.08
Weighted average shares outstanding (000’s)
Basic 12 688,093 687,100
Diluted 12 688,093 689,391
Total shares issued and outstanding (000’s) 11a 689,401 689,391
First Quantum Minerals Ltd. Interim Consolidated Statements of Comprehensive Income (Loss) (unaudited)
(expressed in millions of U.S. dollars)
The accompanying notes are an integral part of these unaudited interim consolidated financial statements.
2
Three months ended March 31
Note 2020 2019
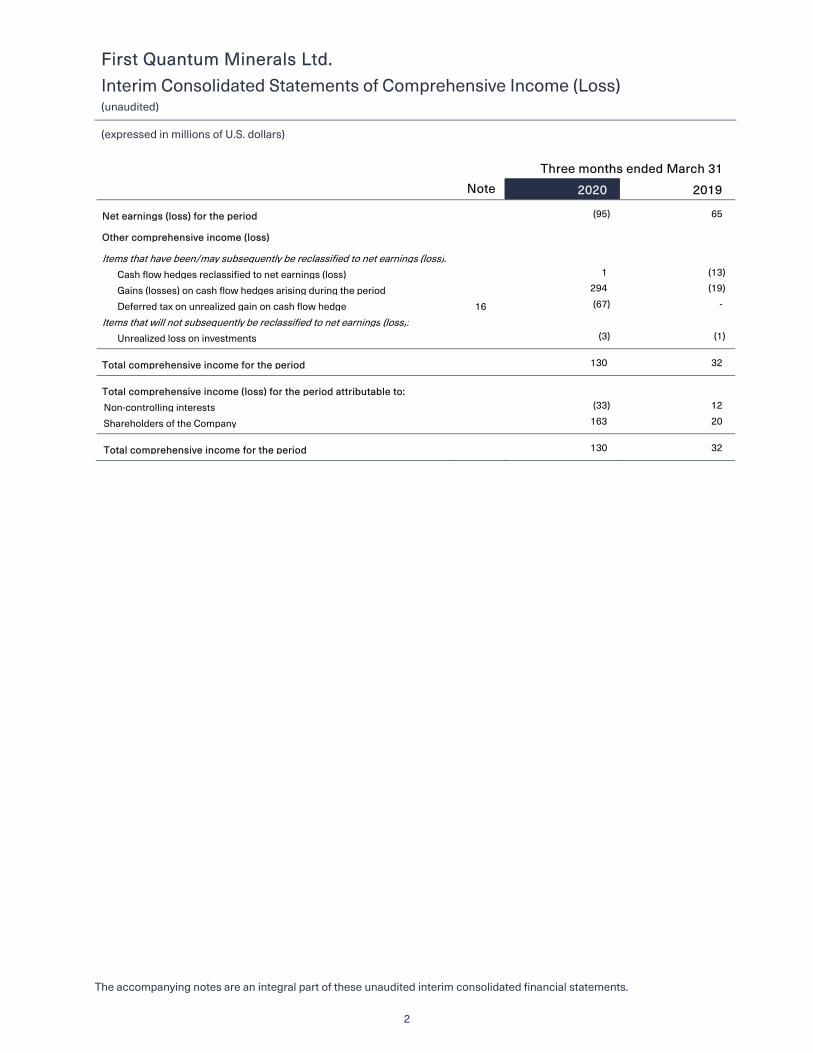
Net earnings (loss) for the period (95) 65
Other comprehensive income (loss)
Items that have been/may subsequently be reclassified to net earnings (loss):
Cash flow hedges reclassified to net earnings (loss) 1 (13)
Gains (losses) on cash flow hedges arising during the period 294 (19)
Deferred tax on unrealized gain on cash flow hedge 16 (67) -
Items that will not subsequently be reclassified to net earnings (loss):
Unrealized loss on investments (3) (1)
Total comprehensive income for the period 130 32
Total comprehensive income (loss) for the period attributable to:
Non-controlling interests (33) 12
Shareholders of the Company 163 20
Total comprehensive income for the period 130 32

First Quantum Minerals Ltd. Condensed Interim Consolidated Statements of Cash Flows (unaudited)
(expressed in millions of U.S. dollars)
The accompanying notes are an integral part of these unaudited interim consolidated financial statements.
3
Three months ended March 31
Note 2020 2019
Cash flows from operating activities Net earnings (loss) (95) 65 Adjustments for
Depreciation 14 311 194 Income tax (credit) expense 16 (50) 62 Net finance expense 184 1 Movement in Zambian VAT discount 3c (37) - Unrealized foreign exchange loss 127 10 Loss on redemption of senior notes 8 2 25 Other (12) 15
430 372
Taxes paid (61) (57) Movements in non-cash operating working capital 104 (156)
Net cash from operating activities 473 159
Cash flows used by investing activities
Purchase and deposits on property, plant and equipment 5 (170) (447) Interest paid and capitalized to property, plant and equipment 5 - (216) Other 2 5
Net cash used by investing activities (168) (658)
Cash flows from financing activities
Net movement in trading facility (143) 33 Movement in restricted cash (6) (2) Proceeds from debt 8 1,813 2,296 Repayments of debt 8 (1,111) (1,774) Early redemption costs on senior notes 8 - (14) Net proceeds from joint venture (KPMC) 7,9b - 35 Interest paid (226) (2) Other (5) (4)
Net cash from financing activities 322 568
Increase in cash and cash equivalents and bank overdrafts 627 69
Cash and cash equivalents and bank overdrafts – beginning of period 523 788
Exchange losses on cash and cash equivalents (5) (7)
Cash and cash equivalents and bank overdrafts – end of period 1,145 850
Cash and cash equivalents and bank overdrafts comprising: Cash and cash equivalents 1,515 1,345
Bank overdrafts (370) (495)

First Quantum Minerals Ltd. Interim Consolidated Balance Sheets (unaudited)
(expressed in millions of U.S. dollars)
The accompanying notes are an integral part of these consolidated financial statements.
4
Note
March 31, 2020
December 31, 2019
Assets (audited) Current assets Cash and cash equivalents 1,515 1,138 Trade and other receivables 3 291 512 Inventories 4 1,410 1,367 Current portion of other assets 6 502 135
3,718 3,152
Non-current assets Cash and cash equivalents - restricted cash 33 27 Non-current VAT receivable 3b 326 396
Property, plant and equipment 5 19,786 19,972
Goodwill 237 237
Investment in joint venture 7 573 589
Other assets 6 391 374
Total assets 25,064 24,747
Liabilities
Current liabilities Bank overdrafts 370 615 Trade and other payables 682 737 Current taxes payable 135 141 Current debt 8 910 838 Current portion of provisions and other liabilities 9 170 192
2,267 2,523
Non-current liabilities Debt 8 7,850 7,360
Provisions and other liabilities 9 2,156 2,172
Deferred revenue 10 1,418 1,421
Deferred income tax liabilities 578 609
Total liabilities 14,269 14,085
Equity
Share capital 11 5,622 5,615
Retained earnings 3,815 3,880
Accumulated other comprehensive income (loss) 180 (45)
Total equity attributable to shareholders of the Company 9,617 9,450 Non-controlling interests 1,178 1,212
Total equity 10,795 10,662
Total liabilities and equity 25,064 24,747
Commitments & contingencies 20
First Quantum Minerals Ltd. Interim Consolidated Statements of Changes in Equity (unaudited)
(expressed in millions of U.S. dollars)
The accompanying notes are an integral part of these consolidated financial statements.
5
Share capital Retained earnings
Accumulated other
comprehensive income (loss)
Total equity attributable to shareholders
of the Company
Non-controlling
interests Total Equity
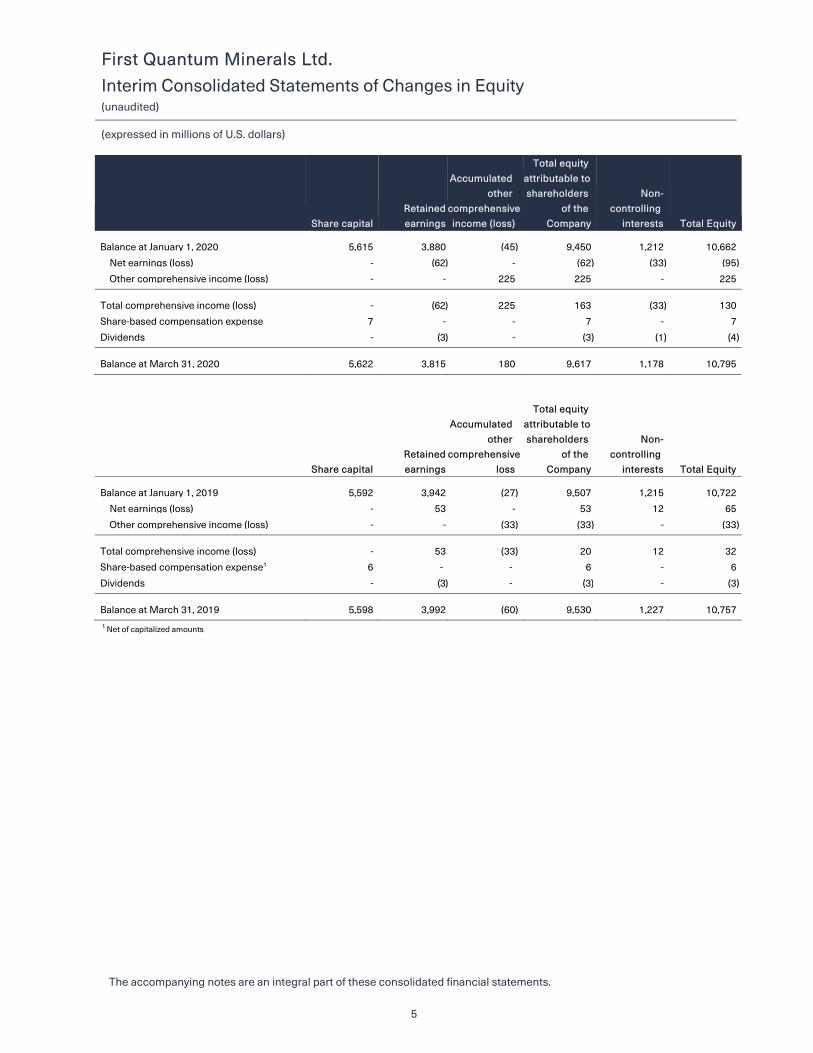
Balance at January 1, 2020 5,615 3,880 (45) 9,450 1,212 10,662
Net earnings (loss) - (62) - (62) (33) (95)
Other comprehensive income (loss) - - 225 225 - 225
Total comprehensive income (loss) - (62) 225 163 (33) 130
Share-based compensation expense 7 - - 7 - 7
Dividends - (3) - (3) (1) (4)
Balance at March 31, 2020 5,622 3,815 180 9,617 1,178 10,795
Share capital Retained earnings
Accumulated other
comprehensive loss
Total equity attributable to shareholders
of the Company
Non-controlling
interests Total Equity
Balance at January 1, 2019 5,592 3,942 (27) 9,507 1,215 10,722
Net earnings (loss) - 53 - 53 12 65
Other comprehensive income (loss) - - (33) (33) - (33)
Total comprehensive income (loss) - 53 (33) 20 12) 32
Share-based compensation expense1 6 -) -) 6) - 6
Dividends - (3) -) (3)) - (3)
Balance at March 31, 2019 5,598 3,992 (60) 9,530 1,227 10,757 1 Net of capitalized amounts

First Quantum Minerals Ltd. Notes to the Condensed Interim Consolidated Financial Statements
(expressed in millions of U.S. dollars, except where indicated and share and per share amounts)
6
1 Nature of operations First Quantum Minerals Ltd. (“First Quantum” or “the Company”) is engaged in the production of copper, nickel, gold, silver, zinc and acid, and related activities including exploration and development. The Company has operating mines located in Zambia, Panama, Finland, Turkey, Spain and Mauritania. The Company’s Ravensthorpe mine in Australia was placed under care and maintenance in October 2017 and recommenced production in April 2020. The Company is exploring the Haquira copper deposit in Peru and the Taca Taca copper-gold-molybdenum deposit in Argentina.
The Company’s shares are publicly listed for trading on the Toronto Stock Exchange and has Depository Receipts listed on the Lusaka Stock Exchange.
The Company is registered and domiciled in Canada, and its registered office is the 14th Floor – 543 Granville Street, Vancouver, BC, Canada, V6C 1X8.
2 Basis of presentation These condensed interim consolidated financial statements have been prepared in accordance with International Accounting Standard 34 Interim Financial Reporting (“IAS 34”). Accordingly, certain disclosures included in the annual financial statements prepared in accordance with International Financial Reporting Standards ("IFRSs") as issued by the International Accounting Standards Board have been condensed or omitted. The accounting policies applied in these condensed interim consolidated financial statements are consistent with those applied in the preparation of, and disclosed in, the consolidated annual financial statements for the year ended December 31, 2019. These consolidated interim financial statements have been prepared on a going concern basis. In making the assessment that the Company is a going concern, management have taken into account all available information about the future, which is at least, but is not limited to, twelve months from March 31, 2020. Following the declaration on March 11, 2020 of a pandemic by the World Health Organisation, the restrictions imposed by governments around the world has had a significant impact on the global economy and commodity prices which have impacted the Company. Expected credit losses on financial assets remain immaterial at March 31, 2020. Commodity price risk continues to be managed through the Company’s hedging program (see note 19).
On April 6, 2020, the Ministry of Health of the Republic of Panama (“MINSA”) ordered the temporary suspension of labour activities at the Cobre Panama operation, as a sanitary control measure due to COVID-19. The Company has decided to place the Cobre Panama operation onto preservation and safe maintenance until MINSA are satisfied that the quarantine conditions are appropriate. Mining operations at Las Cruces were shut down on March 30, 2020 following an order by the Spanish government, which designated mining as a non-essential operation. The plant continued to process the surface ore stockpile, sufficient for an expected two months of production. Mining operations resumed on April 13, 2020. All of the Company’s other mines continue to operate. The Company has not experienced any significant disruption to supply chains and product shipments since the onset of the COVID-19 pandemic. The Company is working to manage the logistical challenges presented by the closure of trade borders, using alternative routes where feasible. Border restrictions, if ongoing, could result in supply chain delays. The Company continues to actively manage all site operating costs while focusing on productivity and cost efficiency and is preparing for an extended period of health protocols and travel restrictions, and commodity prices that could remain depressed into 2021. Capital spending has been and is being reviewed companywide, including deferring some capital spending originally planned for this year. Operating costs at all sites are being reviewed to identify opportunities to further reduce costs. On April 22, 2020, the Company announced the amendment of financial covenants under the senior Term Loan and RCF in response to uncertainty related to COVID-19. The Net Debt to EBITDA ratio has been increased and the Debt Service Cover Ratio has been decreased, for the remainder of 2020 and 2021. The Company was in compliance with all existing facility covenants as at March 31, 2020.

First Quantum Minerals Ltd. Notes to the Condensed Interim Consolidated Financial Statements
(expressed in millions of U.S. dollars)
7
At March 31, 2020, the Company had $1,145 million of net unrestricted cash (inclusive of overdrafts), as well as future cash flows in order to meet all current obligations as they become due. The committed senior debt facilities are fully drawn as at March 31,2020.
3 Trade receivables a) Trade and other receivables
March 31, 2020
December 31, 2019
Trade receivables 194 369
VAT receivable (current) 16 20
Other receivables 81 123
291 512
b) VAT receivable
March 31, 2020
December 31, 2019
Kansanshi Mining PLC 181 233
Kalumbila Minerals Limited 125 141
First Quantum Mining and Operations Limited (Zambia) 20 24
VAT receivable from the Company’s Zambian operations 326 398
Other 16 18
Total VAT receivable 342 416
Less: current portion, included within trade and other receivables (16) (20)
Non-current VAT receivable 326 396

First Quantum Minerals Ltd. Notes to the Condensed Interim Consolidated Financial Statements
(expressed in millions of U.S. dollars)
8
c) VAT receivable by the Company’s Zambian operations
March 31, 2020
December 31, 2019
Receivable at date of claim 863 847
Impact of depreciation of Zambian kwacha against U.S. dollar1 (367) (242)
496 605
Impact of discounting non-current portion2 (170) (207)
Total receivable 326 398
Consisting:
Current portion, included within trade and other receivables - 2
Non-current VAT receivable 326 396 1 The impact of depreciation of the Zambian kwacha against the U.S. dollar in the three-month period ended March 31, 2020 on the Company’s Zambian operations VAT receivable is included within other expense in the Statement of Earnings. 2 The movement in VAT discount of $37 million has been recognized in the Statement of Earnings in the three-month period ended March 31, 2020, (March 31, 2019: nil), representing the movement in discounting over the expected timeframe to repayment. Discussions with the relevant government authorities are ongoing and management continues to consider that the outstanding VAT claims are fully recoverable.
4 Inventories
March 31, 2020
December 31, 2019
Ore in stockpiles 275 267
Work-in-progress 28 27
Finished product 295 284
Total product inventory 598 578
Consumable stores 812 789
1,410 1,367

First Quantum Minerals Ltd. Notes to the Condensed Interim Consolidated Financial Statements
(expressed in millions of U.S. dollars)
9
5 Property, plant and equipment
Mineral properties and mine
development costs
Plant and equipment
Capital work-in-progress
Operating mines
Development projects Total
Net book value, as at January 1, 2020 10,802 851 7,182 1,137 19,972
Additions - 156 - - 156
Disposals (1) - - - (1)
Transfers between categories 140 (207) 64 3 -
Restoration provision - - (22) - (22)
Depreciation charge (234) - (85) - (319)
Net book value, as at March 31, 2020 10,707 800 7,139 1,140 19,786
Cost 15,515 800 9,103 1,140 26,558
Accumulated depreciation (4,808) - (1,964) - (6,772)
Mineral properties and mine
development costs
Plant and equipment
Capital work-in-progress
Operating mines
Development projects Total
Net book value, as at January 1, 2019 4,634 10,125 2,097 2,242 19,098
Change in accounting policy – IFRS 16 20 - - - 20
Additions - 1,274 - - 1,274
Disposals (32) - - - (32)
Impairments (76) - (25) - (101)
Transfers between categories 6,897 (11,097) 5,305 (1,105) -
Restoration provision - - 96 - 96
Capitalized interest - 549 - - 549
Depreciation charge (641) - (291) - (932)
Net book value, as at December 31, 2019 10,802 851 7,182 1,137 19,972
Cost 15,371 851 9,061 1,137 26,420
Accumulated depreciation (4,569) - (1,879) - (6,448)
Following declaration of commercial production at Cobre Panama on September 1, 2019, capitalization of qualifying finance costs ceased.
Included within capital work-in-progress and mineral properties – operating mines at March 31, 2020, is an amount of $703 million related to capitalized deferred stripping costs (December 31, 2019: $682 million).

First Quantum Minerals Ltd. Notes to the Condensed Interim Consolidated Financial Statements
(expressed in millions of U.S. dollars)
10
6 Other assets
March 31, 2020
December 31, 2019
Prepaid expenses 133 142
KPMC shareholder loan 261 246
Other investments 16 19 Deferred income tax assets 99 93
Derivative instruments (note 19) 384 9
Total other assets 893 509
Less: current portion of other assets (502) (135)
391 374
Included within prepaid expenses is $28 million (December 31, 2019: $28 million) in relation to Sentinel which will be recovered through deductions on electricity invoices from ZESCO under the terms of the agreement to transfer powerline ownership.
7 Joint venture On November 8, 2017, the Company completed the purchase of a 50% interest in KPMC from LS-Nikko Copper Inc. KPMC is jointly owned and jointly controlled with Korea Resources Corporation (“KORES”) and holds a 20% interest in Cobre Panama. The purchase consideration of $664 million comprised the acquisition consideration of $635 million and the reimbursement of cash advances of $29 million with $179 million paid on closing. In the three months ended March 31, 2020 no consideration was paid, with the consideration paid to date being $464 million. The remaining consideration is payable in two instalments in November 2020 and November 2021. These are presented within trade and other payables and other non-current liabilities respectively (note 9).
A $573 million investment in the joint venture representing the discounted consideration value and the Company’s proportionate share of the loss in KPMC to date is recognized. For the three-month period ended March 31, 2020 the loss attributable to KPMC was $32m (March 31, 2019: nil). The earnings in KPMC relate to the 20% equity accounted share of loss reported by MPSA, a subsidiary of the Company. The material assets and liabilities of KPMC are an investment in MPSA of $359 million, shareholder loans receivable from the Company (note 9b) and shareholder loans payable of $1,265 million due to the Company and its joint venture partner KORES.

First Quantum Minerals Ltd. Notes to the Condensed Interim Consolidated Financial Statements
(expressed in millions of U.S. dollars)
11
8 Debt
March 31, 2020
December 31, 2019
Drawn debt Senior notes:
First Quantum Minerals Ltd. 7.00% due February 2021 - 298 First Quantum Minerals Ltd. 7.25% due May 2022 846 846 First Quantum Minerals Ltd. 7.25% due April 2023 1,599 1,093 First Quantum Minerals Ltd. 6.50% due March 2024 844 843 First Quantum Minerals Ltd. 7.50% due April 2025 1,346 1,091 First Quantum Minerals Ltd. 6.875% due March 2026 992 991
First Quantum Minerals Ltd. senior debt facility 2,673 2,422 Kalumbila term loan 341 341 Trading facilities 119 262 Equipment financing - 11
Total debt 8,760 8,198 Less: current maturities and short term debt (910) (838)
7,850 7,360
Undrawn debt First Quantum Minerals Ltd. senior debt facility - 250 Trading facilities 281 138
a) First Quantum Minerals Ltd. 7.00% due February 2021
On January 16, 2020, the Company issued a notice of redemption of the remaining 2021 Notes. The 2021 Notes were redeemed at 100% of the principal amount, plus accrued and unpaid interest to the redemption date on January 31, 2020.
b) First Quantum Minerals Ltd. 7.25% due April 2023
On January 13, 2020, the Company issued an additional $500 million of 2023 Notes.
c) First Quantum Minerals Ltd. 7.50% due April 2025
On January 13, 2020, the Company issued an additional $250 million of 2025 Notes. d) First Quantum Minerals Ltd. senior debt facility
On February 6, 2019, the Company signed a Term Loan and Revolving Credit Facility (“RCF”, together “The 2019 Facility”) replacing the previous $1.5 billion RCF, which was extinguished with no extinguishment gain or loss. The 2019 Facility comprises a $1.5 billion Term Loan Facility and a $1.2 billion RCF (which can be upsized to $1.5 billion if the accordion feature is activated before the end June 2020) maturing on December 31, 2022. Interest is charged at LIBOR plus a margin. This margin can change relative to certain financial ratios of the Company.
Transaction costs for the new facilities have been deducted from the principal drawn on initial recognition.
At March 31, 2020, the RCF had been fully utilised.
e) Equipment financing
In March 2020, the financing arrangement with Caterpillar Financial Services Corporation was fully repaid and cancelled.

First Quantum Minerals Ltd. Notes to the Condensed Interim Consolidated Financial Statements
(expressed in millions of U.S. dollars)
12
9 Provisions and other liabilities a) Provisions and other liabilities
March 31,
2020 December 31,
2019
Amount owed to joint venture (note 9b) 1,265 1,238
Restoration provisions 673 699
Derivative instruments (note 19) 2 31
Non-current consideration for acquisition of joint venture1 85 82 Leases 32 36 Retirement provisions 40 40 Deferred revenue (note 10) 97 95 Other deferred revenue 32 31 Other 100 112
Total other liabilities 2,326 2,364
Less: current portion (170) (192)
2,156 2,172
1 The current portion of the consideration for acquisition of joint venture of $100 million (December 31, 2019: $100 million) has been included in trade and other payables.
b) Amount owed to joint venture
March 31,
2020 December 31,
2019
Balance at the beginning of the year 1,238 946
Funding provided to MPSA for the development of Cobre Panama - 190 Interest accrued 27 102
Balance at end of period due to KPMC 1,265 1,238
In September 2013, the Company and KPMC entered into a shareholder loan agreement with Minera Panama S.A (“MPSA”) for development of the Cobre Panama project, in which KPMC is a 20% shareholder. Interest is calculated semi-annually at an annual rate of 9%. In November 2017, the Company acquired a 50% interest in KPMC from LS-Nikko Copper Inc. inclusive of the above shareholder loans. The assets and liabilities of KPMC are an investment in MPSA, a subsidiary of the Company, a loan receivable from MPSA, and loans due to shareholders. Interest income and expense earned on these loans are on the same terms.
Following completion of the additional precious metal streaming agreement with Franco Nevada on March 16, 2018, the receipt of $356 million proceeds by MPSA was used entirely to repay shareholder loans by MPSA to KPMC. Of this $356 million shareholder loan repayment, $178 million was received by the Company.
As at March 31, 2020, the accrual for interest payable is $353 million (December 31, 2019: $326 million) and is included in the carrying value of the amount owed to the joint venture, as this has been deferred under the loan agreement. Amounts due to KPMC are specifically excluded from the calculation of net debt as defined under the Company’s banking covenant ratios.

First Quantum Minerals Ltd. Notes to the Condensed Interim Consolidated Financial Statements
(expressed in millions of U.S. dollars)
13
10 Deferred revenue
March 31,
2020 December 31,
2019
Balance at the beginning of the year 1,516 1,490
Accretion of finance costs 16 64 Amortization of gold and silver revenue (17) (38)
Balance at the end of the period 1,515 1,516
Less: current portion (included within provisions and other liabilities) (97) (95)
Non-current deferred revenue 1,418 1,421
Precious metal stream arrangement
The Company, through its subsidiary, MPSA, has a precious metal streaming arrangement with Franco-Nevada. The arrangement comprises two tranches, the first of which (“Tranche 1”) was finalized on October 5, 2015. Under the terms of Tranche 1, Franco-Nevada, through a wholly owned subsidiary, agreed to provide a $1 billion deposit to be funded on a pro-rata basis of 1:3 with the Company’s 80% share of the capital costs of Cobre Panama in excess of $1 billion. The full Tranche 1 deposit amount has been fully funded to MPSA. The second tranche (“Tranche 2”) was finalized on March 16, 2018, and $356 million was received on completion. Proceeds received from Franco-Nevada under the terms of the precious metals streaming agreement are accounted for as deferred revenue.
The amount of precious metals deliverable under both tranches is indexed to total copper-in-concentrate sold by Cobre Panama. Under the terms of Tranche 1 the ongoing payment of the Fixed Payment Stream is fixed per ounce payments of $430.91/oz gold and $6.46/oz silver subject to an annual inflation adjustment for the first 1,341,000 ounces of gold and 21,510,000 ounces of silver (approximately the first 20 years of expected deliveries). Thereafter the greater of $430.91oz for gold and $6.46/oz for silver, subject to an adjustment for inflation, and one half of the then prevailing market price. Under Tranche 2 the ongoing price per ounce for deliveries is 20% of the spot price for the first 604,000 ounces of gold and 9,618,000 ounces of silver (approximately the first 25 years of production), and thereafter the price per ounce rises to 50% of the spot price of gold and silver.
In all cases, the amount paid is not to exceed the prevailing market price per ounce of gold and silver.
The Company commenced the recognition of delivery obligations to Franco-Nevada under the terms of the arrangement in June 2019 following the first sale of copper concentrate. Deferred revenue will continue to be recognized as revenue over the life of the mine, which is expected to be 35 years. The amortization of the deferred revenue balance and the ongoing payments due from Franco-Nevada are included within gold and silver revenues. The Company uses refinery backed credits as the mechanism for satisfying its delivery obligations under the arrangement. In the three month period ended March 31, 2020, $37 million was recognized in cost of sales, in the year ended December 31, 2019, nil.
First Quantum Minerals Ltd. Notes to the Condensed Interim Consolidated Financial Statements
(expressed in millions of U.S. dollars)
14
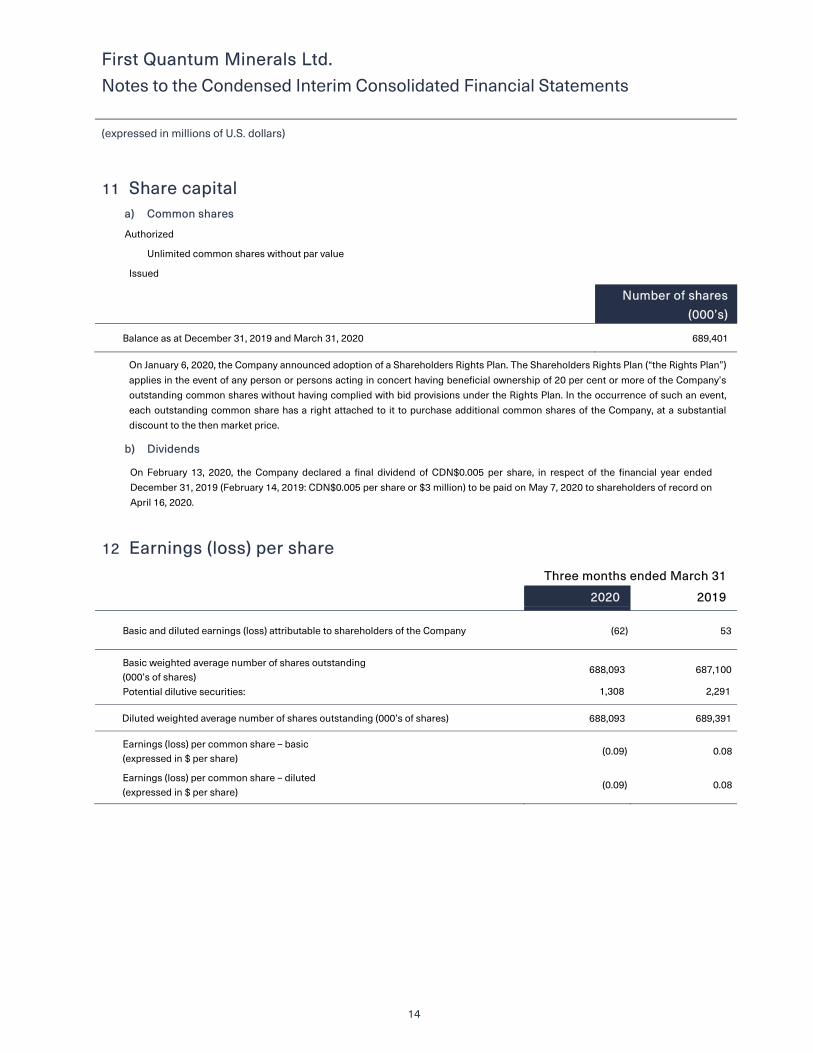
11 Share capital a) Common shares
Authorized
Unlimited common shares without par value
Issued
Number of shares (000’s)
Balance as at December 31, 2019 and March 31, 2020 689,401
On January 6, 2020, the Company announced adoption of a Shareholders Rights Plan. The Shareholders Rights Plan (“the Rights Plan”) applies in the event of any person or persons acting in concert having beneficial ownership of 20 per cent or more of the Company’s outstanding common shares without having complied with bid provisions under the Rights Plan. In the occurrence of such an event, each outstanding common share has a right attached to it to purchase additional common shares of the Company, at a substantial discount to the then market price.
b) Dividends
On February 13, 2020, the Company declared a final dividend of CDN$0.005 per share, in respect of the financial year ended December 31, 2019 (February 14, 2019: CDN$0.005 per share or $3 million) to be paid on May 7, 2020 to shareholders of record on April 16, 2020.
12 Earnings (loss) per share
Three months ended March 31
2020 2019
Basic and diluted earnings (loss) attributable to shareholders of the Company (62) 53
Basic weighted average number of shares outstanding (000’s of shares)
688,093 687,100
Potential dilutive securities: 1,308 2,291
Diluted weighted average number of shares outstanding (000’s of shares) 688,093 689,391
Earnings (loss) per common share – basic (expressed in $ per share)
(0.09) 0.08
Earnings (loss) per common share – diluted (expressed in $ per share)
(0.09) 0.08

First Quantum Minerals Ltd. Notes to the Condensed Interim Consolidated Financial Statements
(expressed in millions of U.S. dollars)
15
13 Sales revenues Three months ended March 31
2020 2019
Copper 1,015 770
Gold 134 57
Other 33 30
1,182 857
14 Cost of sales Three months ended March 31
2020 2019
Costs of production (733) (502)
Depreciation (319) (189)
Movement in inventory 9 24
Movement in depreciation in inventory 8 (5)
(1,035) (672)
15 Finance costs
Three months ended March 31
2020 2019
Interest expense on financial liabilities measured at amortized cost (199) (201)
Accretion on restoration provision (2) (3)
Total finance costs (201) (204)
Less: interest capitalized (note 5) - 198
(201) (6)
16 Income tax A tax credit of $50 million was recorded for the three months ended March 31, 2020, (three months ended March 31, 2019: $62 million
tax expense) reflecting statutory tax rates. The statutory tax rates for the Company’s operations range from 20% to 35%. No tax expenses
or credits have been recognized with respect to losses incurred for the early repayment of borrowings. A deferred tax charge has been
recognized in other comprehensive income with a corresponding tax credit recognized in the statement of earnings with regard to the
fair value gain recognized on derivatives designated as hedged instruments through accumulated other comprehensive income.

First Quantum Minerals Ltd. Notes to the Condensed Interim Consolidated Financial Statements
(expressed in millions of U.S. dollars)
16
17 Other income (expense)
Three months ended March 31
2020 2019
Foreign exchange losses1 (123) (5)
Change in restoration provision for closed properties 6 (1)
Share of loss in joint venture (note 7) (16) -
Other income 15 (4)
(118) (10)
1 The majority of foreign exchange losses are unrealized and arise on translating Zambian Kwacha monetary assets, in particular VAT receivable (see note 3c), at the period end exchange rate.
18 Segmented information The Company’s reportable operating segments are individual mine development projects or mine operations. Each of the mines and development projects report information separately to the CEO, the chief operating decision maker.
The Corporate & other segment is responsible for the evaluation and acquisition of new mineral properties, regulatory reporting, treasury and finance and corporate administration. Included in the Corporate & other segment is the Company’s metal marketing division which purchases and sells third party material, and the exploration projects.
The Company’s operations are subject to seasonal aspects, in particular the rain season in Zambia. The rain season in Zambia generally starts in November and continues through April, with the heaviest rainfall normally experienced in the months of January, February and March. As a result of the rain season, mine pit access and the ability to mine ore is lower in the first quarter of the year than other quarters and the cost of mining is higher.
Earnings by segment
For the three-month period ended March 31, 2020, segmented information for the statement of earnings (loss) is presented as follows:
Revenue Cost of sales
(excluding depreciation)
Depreciation Other Operating profit (loss)1
Income tax (expense) credit
Cobre Panama 398 (240) (125) (2) 31 -
Kansanshi2 349 (209) (61) (67) 12 (16)
Sentinel 235 (158) (56) (43) (22) 7
Las Cruces 83 (29) (49) (1) 4 3
Guelb Moghrein 67 (36) (10) (2) 19 (4)
Çayeli 9 (7) (6) (1) (5) (5)
Pyhäsalmi 13 (9) (1) - 3 (1)
Ravensthorpe - (36) (2) 2 (36) 12
Corporate & other3 28 - (1) (29) (2) 54
Total 1,182 (724) (311) (143) 4 50
1 Operating profit (loss) less net finance costs and taxes equals net earnings (loss) for the period on the consolidated statement of earnings. 2 Kansanshi Mining Plc, the most significant contributor to the Kansanshi segment, is 20% owned by ZCCM, a Zambian government owned entity. 3 Revenue includes hedge gains recognized on forward copper sales and zero cost collar options.
First Quantum Minerals Ltd. Notes to the Condensed Interim Consolidated Financial Statements
(expressed in millions of U.S. dollars)
17
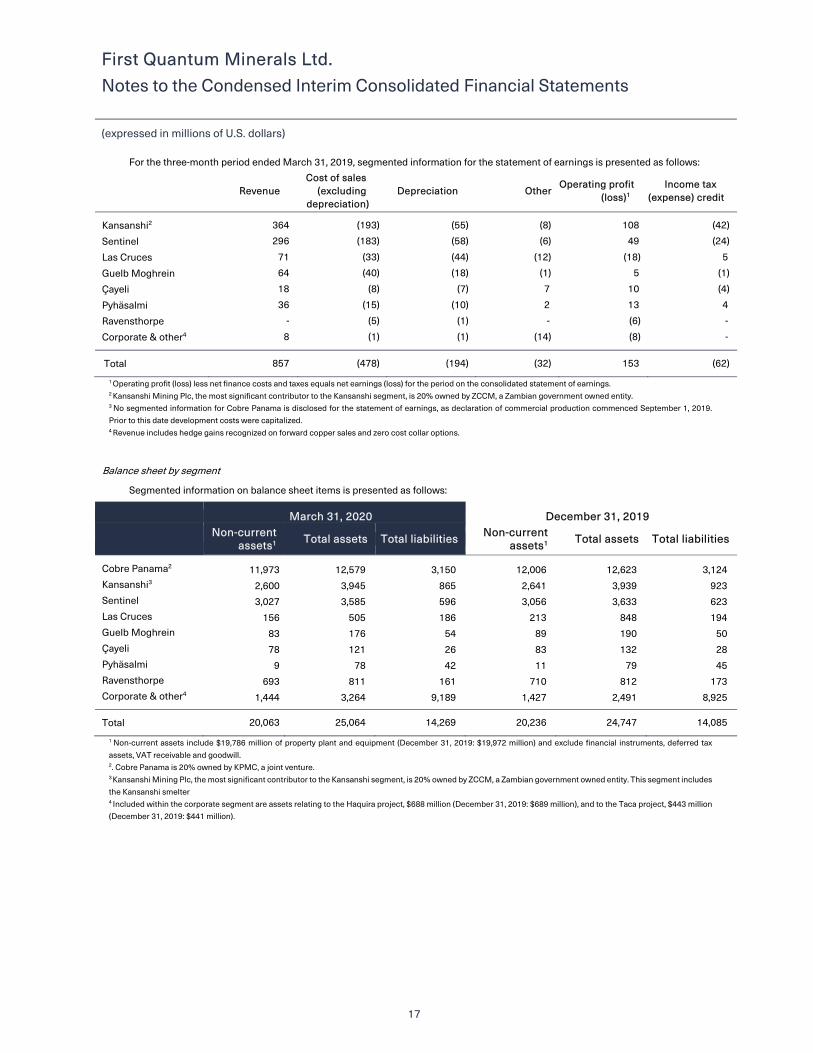
For the three-month period ended March 31, 2019, segmented information for the statement of earnings is presented as follows:
Revenue
Cost of sales (excluding
depreciation) Depreciation Other
Operating profit (loss)1
Income tax (expense) credit
Kansanshi2 364 (193) (55) (8) 108 (42)
Sentinel 296 (183) (58) (6) 49 (24)
Las Cruces 71 (33) (44) (12) (18) 5
Guelb Moghrein 64 (40) (18) (1) 5 (1)
Çayeli 18 (8) (7) 7 10 (4)
Pyhäsalmi 36 (15) (10) 2 13 4
Ravensthorpe - (5) (1) - (6) -
Corporate & other4 8 (1) (1) (14) (8) -
Total 857 (478) (194) (32) 153 (62)
1 Operating profit (loss) less net finance costs and taxes equals net earnings (loss) for the period on the consolidated statement of earnings. 2 Kansanshi Mining Plc, the most significant contributor to the Kansanshi segment, is 20% owned by ZCCM, a Zambian government owned entity. 3 No segmented information for Cobre Panama is disclosed for the statement of earnings, as declaration of commercial production commenced September 1, 2019. Prior to this date development costs were capitalized. 4 Revenue includes hedge gains recognized on forward copper sales and zero cost collar options.
Balance sheet by segment
Segmented information on balance sheet items is presented as follows:
March 31, 2020 December 31, 2019
Non-current
assets1 Total assets Total liabilities Non-current assets1 Total assets Total liabilities
Cobre Panama2 11,973 12,579 3,150 12,006 12,623 3,124 Kansanshi3 2,600 3,945 865 2,641 3,939 923 Sentinel 3,027 3,585 596 3,056 3,633 623 Las Cruces 156 505 186 213 848 194 Guelb Moghrein 83 176 54 89 190 50 Çayeli 78 121 26 83 132 28 Pyhäsalmi 9 78 42 11 79 45 Ravensthorpe 693 811 161 710 812 173 Corporate & other4 1,444 3,264 9,189 1,427 2,491 8,925
20 236 2 08Total 20,063 25,064 14,269 20,236 24,747 14,085
1 Non-current assets include $19,786 million of property plant and equipment (December 31, 2019: $19,972 million) and exclude financial instruments, deferred tax assets, VAT receivable and goodwill. 2. Cobre Panama is 20% owned by KPMC, a joint venture. 3 Kansanshi Mining Plc, the most significant contributor to the Kansanshi segment, is 20% owned by ZCCM, a Zambian government owned entity. This segment includes the Kansanshi smelter 4 Included within the corporate segment are assets relating to the Haquira project, $688 million (December 31, 2019: $689 million), and to the Taca project, $443 million (December 31, 2019: $441 million).

First Quantum Minerals Ltd. Notes to the Condensed Interim Consolidated Financial Statements
(expressed in millions of U.S. dollars)
18
Capital expenditure by segment
Additions to non-current assets other than financial instruments, deferred tax assets and goodwill represent additions to property, plant and equipment, for which capital expenditure is presented as follows:
Three months ended March 31
2020 2019
Cobre Panama 106 366
Kansanshi 22 34
Sentinel 29 36
Las Cruces 1 4
Guelb Moghrein 4 1
Çayeli 1 1
Ravensthorpe 3 2
Corporate & other 4 3
Total 170 447
19 Financial instruments The Company classifies its financial assets as amortized cost, FVOCI or FVTPL. Financial liabilities are measured at amortized cost or FVTPL.
The following provides a comparison of carrying and fair values of each classification of financial instrument at March 31, 2020:
Amortized cost Fair value
through profit or loss
Fair value through OCI Total
Financial assets
Trade and other receivables1 81 194 - 275 Due from KPMC (note 6) 261 - - 261 Derivative instruments in designated hedge relationships
- - 303 303
Other derivative instruments2 - 81 - 81 Investments - - 16 16
Financial liabilities Trade and other payables 682 - - 682 Other derivative instruments2 - 2 - 2 Leases 32 - - 32 Liability to joint venture 1,265 - - 1,265 Debt 8,760 - - 8,760
1 Commodity products are sold under pricing arrangements where final prices are set at a specified future date based on market commodity prices. Changes between the prices recorded upon recognition of revenue and the final price due to fluctuations in commodity market prices give rise to an embedded derivative in the accounts receivable related to the provisionally priced sales contracts.
2 Other derivative instruments related to provisionally priced sales contracts are classified as fair value through profit or loss and recorded at fair value, with changes in fair value recognized as a component of cost of sales.
3 Investments held by the Company are held at fair value through other comprehensive income.

First Quantum Minerals Ltd. Notes to the Condensed Interim Consolidated Financial Statements
(expressed in millions of U.S. dollars)
19
The following provides a comparison of carrying and fair values of each classification of financial instruments at December 31, 2019, on the same classification basis as above:
Amortized cost Fair value
through profit or loss
Fair value through OCI Total
Financial assets
Trade and other receivables1 123 369 - 492 Due from KPMC (note 8) 246 - - 246 Derivative instruments in designated hedge relationships
- - 8 8
Other derivative instruments2 - 1 - 1 Investments3 - - 19 19
Financial liabilities Trade and other payables 737 - - 737 Other derivative instruments2 - 31 - 31 Leases 36 - - 36 Liability to joint venture 1,238 - - 1,238 Debt 8,198 - - 8,198
1 Commodity products are sold under pricing arrangements where final prices are set at a specified future date based on market commodity prices. Changes between the prices recorded upon recognition of revenue and the final price due to fluctuations in commodity market prices give rise to an embedded derivative in the accounts receivable related to the provisionally priced sales contracts.
2 Other derivative instruments related to provisionally priced sales contracts are classified as fair value through profit or loss and recorded at fair value, with changes in fair value recognized as a component of cost of sales.
3 Investments held by the Company are held at fair value through other comprehensive income .
Fair Values
The fair value hierarchy prioritizes the inputs to valuation techniques used to measure fair value. The hierarchy gives the highest priority to unadjusted quoted prices in active markets for identical assets or liabilities (Level 1 measurements) and the lowest priority to unobservable inputs (Level 3 measurements). The three levels of the fair value hierarchy are described below:
Level 1 Quoted prices (unadjusted) in active markets for identical assets or liabilities.
Level 2 Inputs other than quoted prices included in Level 1 that are observable for the asset or liability, either directly or indirectly.
Level 3 Inputs for the asset or liability that are not based on observable market data.

First Quantum Minerals Ltd. Notes to the Condensed Interim Consolidated Financial Statements
(expressed in millions of U.S. dollars)
20
The following table sets forth the Company’s assets and liabilities measured at fair value on the balance sheet at March 31, 2020:
Level 1 Level 2 Level 3 Total fair value
Financial assets
Derivative instruments – LME contracts1 59 - - 59
Derivative instruments – OTC contracts2 - 325 - 325
Investments3 16 - - 16
Financial liabilities
Derivative instruments – LME contracts1 2 - - 2
Derivative instruments – OTC contracts2 - - - -
1 Futures for copper, gold and zinc were purchased on the London Metal Exchange (“LME”) and London Bullion Market and have direct quoted prices, therefore these contracts are classified within Level 1 of the fair value hierarchy. 2 The Company’s derivative instruments are valued by the Company’s brokers using pricing models based on active market prices. All forward swap contracts held by the Company are OTC and therefore the valuation models require the use of assumptions concerning the amount and timing of estimated future cash flows and discount rates using inputs which can generally be verified and do not involve significant management judgment. Such instruments are classified within Level 2 of the fair value hierarchy. Derivative assets are included within other assets on the balance sheet and derivative liabilities are included within provisions and other liabilities on the balance sheet. 3 The Company’s investments in marketable equity securities are valued using quoted market prices in active markets and as such are classified within Level 1 of the fair value hierarchy. The fair value of the marketable equity securities is calculated as the quoted market price of the marketable security multiplied by the quantity of shares held by the Company.
The following table sets forth the Company’s assets and liabilities measured at fair value on the balance sheet at December 31, 2019, in the fair value hierarchy:
Level 1 Level 2 Level 3 Total fair value
Financial assets
Derivative instruments – LME contracts1 1 - - 1
Derivative instruments – OTC contracts2 - 8 - 8
Investments3 19 - - 19
Financial liabilities
Derivative instruments – LME contracts1 17 - - 17
Derivative instruments – OTC contracts2 - 14 - 14
1 Futures for copper, nickel, gold and zinc were purchased on the London Metal Exchange (“LME”) and London Bullion Market and have direct quoted prices, therefore these contracts are classified within Level 1 of the fair value hierarchy. 2 The Company’s derivative instruments are valued by the Company’s brokers using pricing models based on active market prices. All forward swap contracts held by the Company are OTC and therefore the valuation models require the use of assumptions concerning the amount and timing of estimated future cash flows and discount rates using inputs which can generally be verified and do not involve significant management judgment. Such instruments are classified within Level 2 of the fair value hierarchy. Derivative assets are included within other assets on the balance sheet and derivative liabilities are included within provisions and other liabilities on the balance sheet. 3 The Company’s investments in marketable equity securities are valued using quoted market prices in active markets and as such are classified within Level 1 of the fair value hierarchy. The fair value of the marketable equity securities is calculated as the quoted market price of the marketable security multiplied by the quantity of shares held by the Company.
Derivatives designated as hedged instruments
The Company has elected to apply hedge accounting with the following contracts expected to be highly effective in offsetting changes in the cash flows of designated future sales. Commodity contracts outstanding as at March 31, 2020, were as follows:
Open
Positions (tonnes/ozs)
Average Contract
price
Closing Market price
Maturities Through
Commodity contracts: Copper forward 193,025 $2.60/lb $2.18/lb January 2021
Copper zero cost collar 127,500 $2.66 - $2.92/lb $2.18/lb January 2021
Nickel forward 11,000 $6.76/lb $5.10/lb February 2021

First Quantum Minerals Ltd. Notes to the Condensed Interim Consolidated Financial Statements
(expressed in millions of U.S. dollars)
21
Other derivatives
As at March 31, 2020, the Company had entered into the following derivative contracts for copper, gold and zinc in order to reduce the effects of fluctuations in metal prices between the time of the shipment of metal from the mine site when the sale is provisionally priced and the date agreed for pricing the final settlement.
Excluding the copper contracts noted above, as at March 31, 2020, the following derivative positions were outstanding:
Open
Positions (tonnes/ozs)
Average Contract
price
Closing Market price
Maturities Through
Embedded derivatives in provisionally priced sales contracts:
Copper 105,136 $2.50/lb $2.18/lb July 2020
Gold 28,410 $1,604/oz $1,609/oz July 2020
Zinc 1,675 $0.94/lb $0.85/lb May 2020
Commodity contracts:
Copper 105,125 $2.50/lb $2.18/lb July 2020
Gold 28,409 $1,604/oz $1,609/oz July 2020
Zinc 1,675 $0.94/lb $0.85/lb May 2020
As at December 31, 2019, the following derivative positions were outstanding:
Open
Positions (tonnes/ozs)
Average Contract
price
Closing Market price
Maturities Through
Embedded derivatives in provisionally priced sales contracts:
Copper 119,336 $2.71/lb $2.79/lb April 2020
Gold 28,333 $1,502/oz $1,523/oz April 2020
Commodity contracts:
Copper 119,550 $2.71/lb $2.79/lb April 2020
Gold 28,336 $1,502/oz $1,523/oz April 2020
A summary of the fair values of unsettled derivative financial instruments for commodity contracts recorded on the consolidated balance sheet.
March 31, 2020
December 31, 2019
Commodity contracts:
Asset position 384 9
Liability position (2) (31)
First Quantum Minerals Ltd. Notes to the Condensed Interim Consolidated Financial Statements
(expressed in millions of U.S. dollars)
22
20 Commitments & contingencies Capital commitments
The Company has committed to $67 million (December 31, 2019: $137 million) in capital expenditures.
Other commitments & contingencies
Due to the size, complexity and nature of the Company’s operations, various legal and tax matters are outstanding from time to time. The Company is routinely subject to audit by tax authorities in the countries in which it operates and has received a number of tax assessments in various locations, including Zambia, which are currently at various stages of progress with the relevant authorities. The outcome of these audits and assessments are uncertain however the Company is confident of its position on the various matters under review.
In December 2018, Cobre Panama reached a full and final settlement for an outstanding claim from a third-party which included closure of the counterclaim made by the Company.
In October 2016, the Company, through its subsidiary Kansanshi Holdings Limited, received a Notice of Arbitration from ZCCM International Holdings PLC (“ZCCM”) under the Kansanshi Mining PLC (“KMP”) Shareholders Agreement. ZCCM is a 20% shareholder in KMP and filed the Notice of Arbitration against Kansanshi Holdings Limited (“KHL”), the 80% shareholder, and against KMP. The Company also received a Statement of Claim filed in the Lusaka High Court naming additional defendants, including the Company, and certain directors and an executive of the named corporate defendants. Aside from the parties, the allegations made in the Notice of Arbitration and the High Court for Zambia were the same. The Company is firmly of the view that the allegations are in their nature inflammatory, vexatious and untrue.
The dispute was stated as a request for a derivative action, requiring ZCCM to obtain permission to proceed in each forum of the Arbitration and the Lusaka High Court. The dispute arose from facts originating in 2007, and concerned the rate of interest paid on select deposits by KMP with the Company. The deposits were primarily retained for planned investment by KMP in Zambia. In particular, KMP deposits were used to fund a major investment program at Kansanshi, including the successful construction and commissioning of the Kansanshi smelter and expansion of the processing plant and mining operations. The entirety of the deposit sums has been paid down from the Company to KMP, with interest. The interest was based on an assessment of an arm’s length fair market rate, which is supported by independent third-party analysis. ZCCM disputed that interest rate paid to KMP on the deposits was sufficient.
In July 2019, the Arbitral Tribunal issued a final award in favour of KMP. The parties have reached an agreement on costs, in total exceeding $1 million payable by ZCCM, bringing this particular matter to an end.
In parallel, several preliminary procedural applications to dismiss the High Court Action were lodged on behalf of the Company, and other defendants, in the Lusaka High Court. By a decision dated January 25, 2018, the Lusaka High Court used its discretion to rectify ZCCM’s procedural errors. The Court granted leave to the Company, FQM Finance, a wholly-owned subsidiary of the Company, and the individual defendants to appeal against this decision and the litigants have agreed to a stay pending the appeal. The appeal hearing took place on November 21, 2018, with submissions made by all parties. The Court of Appeal delivered judgment on January 11, 2019, dismissing the appeal. An appeal to the Supreme Court of Zambia was heard on April 24, 2019, and has been dismissed. The High Court was scheduled to resume hearing two further procedural applications, including whether ZCCM is allowed to maintain the derivative action. However, before these hearings could take place the defendants brought an application requesting dismissal of the case on grounds of abuse of process/ res judicata, on the basis that the action cannot be allowed to continue for risk of producing conflicting judgment from the London arbitration, which has already adjudicated the facts of this particular complaint. ZCCM objected to the defendants’ application. ZCCM also tried to bring an application to set aside the registration of the Arbitral award in Zambia. The defendants’ have resisted this application. Both applications have now had an oral hearing in October 2019, and the parties are awaiting a decision of the High Court.
However, after the October 2019 hearing, ZCCM pursued a challenge to the registration of the Arbitral Award on grounds that it was not enforceable because it had complied with the costs payment order of the Arbitral Award. KMP opposed ZCCM’s challenge and made submissions to the Registrar that an Arbitration Award is eligible for registration despite compliance with costs orders. On February 13, 2020, the Registrar accepted KMP’s position and dismissed ZCCM’s challenge to the registration of the Arbitration Award. Accordingly, the Lusaka High Court proceeded to rule on the abuse of process application. By way of a Ruling dated March 23, 2020, the Lusaka High Court agreed with KMP’s application that the process, if it were to be allowed to continue before it, would risk conflicting judgements and would be res judicata. Accordingly, ZCCM’s derivative action case was dismissed, with costs to KMP against ZCCM.

First Quantum Minerals Ltd. Notes to the Condensed Interim Consolidated Financial Statements
(expressed in millions of U.S. dollars)
23
21 Post balance sheet events Cobre Panama
On April 6, 2020, the Ministry of Health of the Republic of Panama (“MINSA”) ordered the temporary suspension of labour activities at the Cobre Panama operation, as a sanitary control measure due to COVID-19. The Company has decided to place the Cobre Panama operation onto preservation and safe maintenance from April 7, 2020, until MINSA are satisfied that the quarantine conditions are appropriate. The heightened quarantine conditions require that mining and processing operations be halted. The port and power plant has continued operations in order to supply essential electrical power into the Panama national grid, and to sustain the preservation and safe maintenance activities. Preservation and safe maintenance is expected to cost approximately $4 – 6 million per week assuming suspension of labour contracts and other variable and fixed costs.
Fuel hedges
Following the balance sheet date, the Company undertook a forward position on fuel of approximately 180 million litres over the next 12 months, at an average price of $0.32 per litre, which corresponds to approximately 50% of the Company’s expected usage.