confidential - the mccallan group1 impact of global commodities on utility market pricing a study of...
TRANSCRIPT

Confidential - The McCallan Group 1
Impact of Global Commodities on Utility Market Pricing
A Study of Cause and Effects
By
The McCallan Group

Confidential - The McCallan Group 2
Utilities Are In A Seller’s Market
Prices have been moving up
Constant requests for price increases
“Allocation” is being heard
Lead times are moving out

Confidential - The McCallan Group 3
Basic Tenets of Pricing Buyers’ cannot control pricing, they can only influence and
manage it.
There is no distinct relationship between price and cost.
Supply/demand market forces are the primary determinant of price trends. Competition is the “wild card”.
Even the largest Buyer rarely has the influence on pricing that they believe.
All it takes are a few bad actors to ruin a market.

Confidential - The McCallan Group 4
Typical Business Cycle
90
100
110
1980 1982 1984 1986 1988 1990 1992 1994 1996 1998 2000 2002 2004 2005
Buyers’ Market
Sellers’ Market
Prices

Confidential - The McCallan Group 5
What Causes A Seller’s Market? Increased Demand
Shortage of Supply
Major Cost Increases
All of the Above
Confidential - The McCallan Group 6
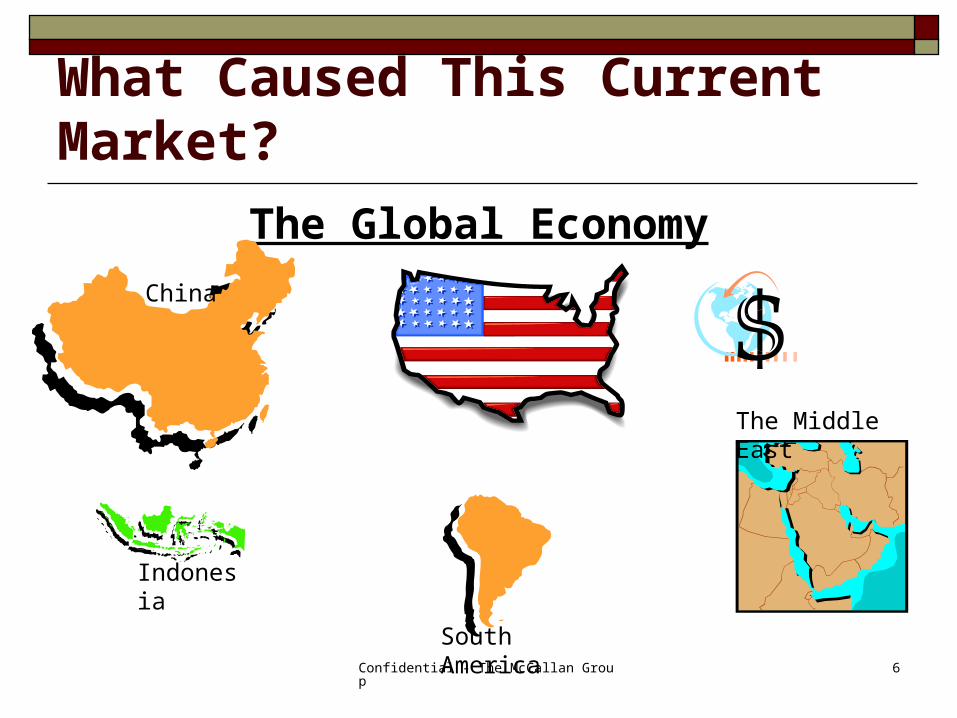
What Caused This Current Market?
The Global Economy
China
Indonesia
The Middle East
South America

Confidential - The McCallan Group 7
What Caused This Current Market?
0
100
200
300
400
500
600
700
800
Hot Rolled Coil
Hot Rolled Plate
Cold Rolled Coil
HD Galv. Coil
Copper (Up 50%)
Cable Insulations (Up 10%) Steel Prices (Doubled)
Hurricanes (4 Majors)
Oil (>$50)

Confidential - The McCallan Group 8
Cable Insulations
2001 – Dow acquires Union Carbide. Holds an estimated 80% market share of the raw material market.
2001 Annual ReportEBIT down 50% over 2000.
October 2002 Financial Report – Dow announces 20% decrease in capital spending, intensified efforts to improve cash flow, cuts in costs and expenses.
January 2003 - CEO announces plans to improve business, to include taking swift action to raise prices to restore margins.
April 2003 – Suppliers begin asking utilities for price increases based on the increases they have received from Dow.

Confidential - The McCallan Group 9
Steel Prices China's consumption up 30% in 2003 to one-third of the world output for rolled steel
Building infrastructure for the 2008 Olympics plus its own internal consumption.
Shortages and price increases in raw materials to make steel include: Steel scrap, Iron ore, Pig iron, Coking coal)
RM Shortage preventing mills from scaling up- demand staying ahead of supply
Chinese producers scouring the world for scrap steel scrap prices in the United States, the world's largest supplier, rise by as much as 80 percent.
Some big customers are challenging higher spot prices and surcharges. General Motors is rejecting invoices from steel suppliers that include such “non-negotiated extra charges”.
The trickle down of higher prices to manufacturers who use steel has varied in time and acceptance, resulting in mixed signals for consumers.

Confidential - The McCallan Group 10
Copper Prices

Confidential - The McCallan Group 11
Chile, United States, Indonesia, and Australia account for almost 60% of the world’s copper production.
Inventories are down dramatically since 2003, raising prices to 16 year high. Supply disruptions in Indonesia, Mexico, Peru Upturn in demand in early 2003 was not met by increased production Strong increased demand in China
Unusually high number of smelter maintenance shutdowns scheduled in 1H2005.
Major metals producers are just starting to increase capital spending.
Some analysts predict a surplus in 2006, prices “projected” to fall moderately.
Copper Prices

Confidential - The McCallan Group 12
Aluminum Prices2004 World demand up 10%. China’s scrap imports
rose 84%, reducing availability in the West, pushing up prices.
Production increased by about 7%. The largest increase came from China, which was up 20%.
North American capacity reduced. Inventories were at nine weeks supply at the end of 2003.
Apparent demand levels in 2004 were inflated somewhat by inventory restocking.
15 to 25 smelters have closed worldwide.
OUTLOOK - 2005 Slight increase in demand expected. Shipments
to rise about 1% in the West and about 4% globally, double-digit growth in China.
On the supply side, there are three major smelter projects starting operations in 2005.

Confidential - The McCallan Group 13
Raw Material ImpactSteel Oil Copper Aluminum
Transformers
Line hardware
Guy Wire
Structures
Towers
Poles
Bare Conductor
Conduit
OilTransformers
Fuel CostsFleetVegetation Mgmt.
ChemicalsCable insulationPackagingSolventsRubber ProductsPVC PipeWood Poles
Electrical Cables
Bus Bar
Grounding Rods
Transformers
Connectors
Electrical Cables
Structures
Towers
Poles
Connectors

Confidential - The McCallan Group 14
What Caused This Current Market?
Up in Price (As of February 2005)Aluminum (16h month) LDPE
Caustic Soda (10th month) Packaging Materials (4th month)
Chemicals (13th month) Paper (12th month)
Copper (5th month) Plastic Products (13th month)
Corrugated Containers (13th month) Plastics (7th month)
Diesel Fuel (6th month) Plastic Resin
Ethylene Polyethylene
Freight (12th Month) Propylene (4th month)
Fuel Oil (9th month) Resins
Gasoline (9th month) Stainless Steel (6th month)
Industrial Gases Steel (17th month)
Confidential - The McCallan Group 15
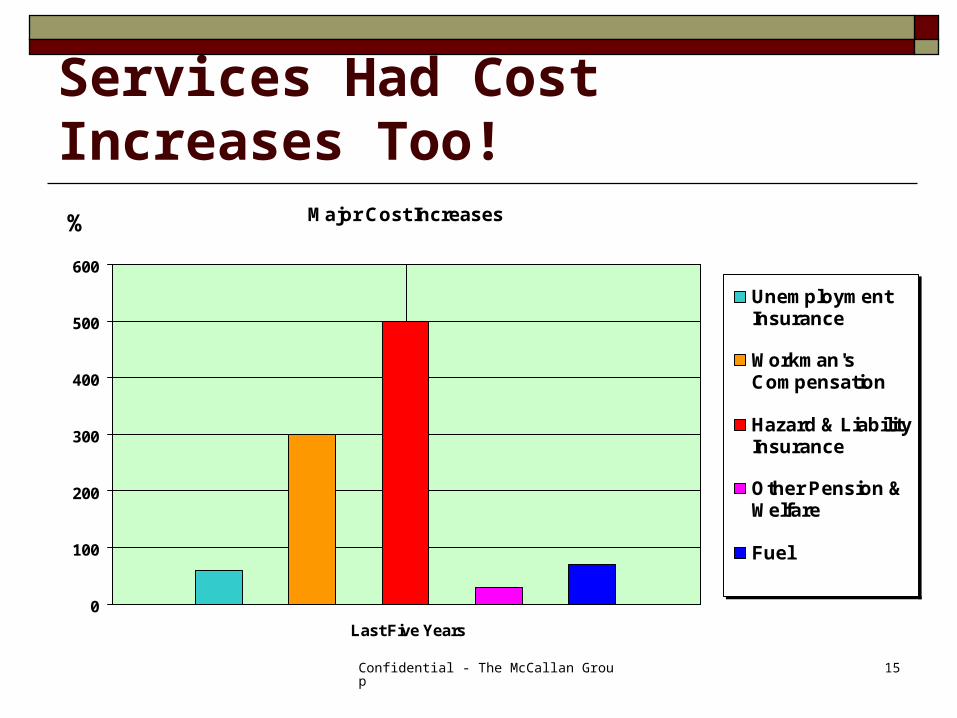
Services Had Cost Increases Too!Major Cost Increases
0
100
200
300
400
500
600
Last Five Years
%
UnemploymentInsurance
Workman'sCompensation
Hazard & LiabilityInsurance
Other Pension &Welfare
Fuel
Confidential - The McCallan Group 16
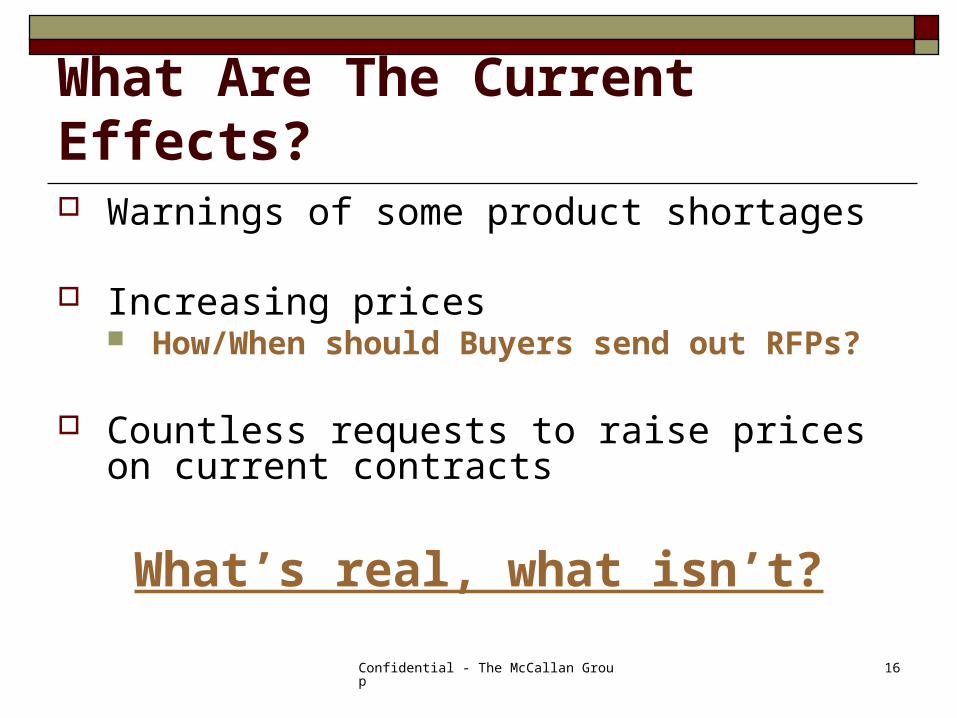
What Are The Current Effects? Warnings of some product shortages
Increasing prices How/When should Buyers send out RFPs?
Countless requests to raise prices on current contracts
What’s real, what isn’t?

Confidential - The McCallan Group 17
A Question Often Asked
Could Suppliers Be Taking Advantage of the Current Market To Raise
Prices?

Confidential - The McCallan Group 18
The Goals of PricingSuppliers
1. Raise Prices
2. Make Money
3. Get the Business
4. Stability
Customers
1. Lower Prices
2. Save Money
3. High Reliability at Lowest Cost
4. Stability

Confidential - The McCallan Group 19
Market Pricing - Overall InfluencesSupply Pricing Trend
Demand
Industry Capacity - < 80% Utilization
▼ ▼ Demand Drivers - Low
Many Suppliers ▼ ▼ Demand Forecasts - Low
Raw Material Supply - Good ▼ ▼ Industry Usage - Low
Short Lead Times ▼
Industry Capacity - > 80% Utilization ▲ ▲ Industry Usage - High
Long Lead Times ▲ ▲ Demand Forecasts - High
Raw Material or Labor Supply Shortages ▲ ▲ Demand Drivers - High
Few Suppliers ▲
The Wild Card Competition

Confidential - The McCallan Group 20
What REALLY Preceded the Current Sellers’ Market?
1995 - 1999 2000 - 2003 2003 - Present
The Alliance Love -Fest
Buyers’ Market
Sellers’ Market

Confidential - The McCallan Group 21
What Caused The Buyers’ Market?
Major Cost Pressures Reduced Demand Net Marketplaces Reverse Auctions Contracts Cancelled &
Re-Bid Alliances Floundered
2001
2001 – 2003 Industry Financials
9-11

Confidential - The McCallan Group 22
Repercussions of the Buyers’ Market Major price erosion
Abandonment of supply chain initiatives
Failed or damaged relationships
Loss of trust by suppliers

Confidential - The McCallan Group 23
A Question Often Asked
Could Suppliers Be Taking Advantage of the Current Market To Raise
Prices?
What Do YOU Think?

Confidential - The McCallan Group 24
Who’s Fault?
Alliances produced solid, but diminishing results; both parties allowed a comfort level to set in.
Utilities failed to take the Total Supply Chain Concept to the Operations level.
Suppliers allowed contracts to get “out of touch” with the market.
Neither partner positioned themselves to better understand Price/Cost relationships
Utilities SuppliersBoth!Both!

Confidential - The McCallan Group 25
The Impact on APPA
Majority of municipal bids are public.
Public Power market is 10-30% of total utility market spend.
Shorter-term contracts
Suppliers use public bids to monitor/signal pricing moves
IOU market drives most pricing.
Less susceptible to price change requests, more likely to see price increases on next contracts

Confidential - The McCallan Group 26
The Near Future?Raw Materials & Other Costs Oil will continue to be high, may stabilize a bit Steel and other metals – more of the same, perhaps some stability Chemicals – more of the same Insurance & Health Costs – continued increases
Supply Chain Issues Increased pressure from Operations (performance and costs) Dwindling supply of talent and experience Consideration of “Outsourcing” options Supplier consolidations Product and “Skilled” Labor Shortages
The Challenge: achieving lower costs in a rising price market

Confidential - The McCallan Group 27
Seven Keys to Price Management1. Understand Pricing Principles
2. Be adept at Tracking the Market Maintain an awareness of market pricing
3. Use the 80/20 Rule
4. Understand key Cost Drivers
5. Closely Monitor the dynamics of the Cost Drivers Stay with or ahead of your suppliers
6. Focus on Stability, not just “low price” Multi-year agreements Adjustments based on cost drivers
7. Develop and Maintain Supplier Relationships
Confidential - The McCallan Group 28
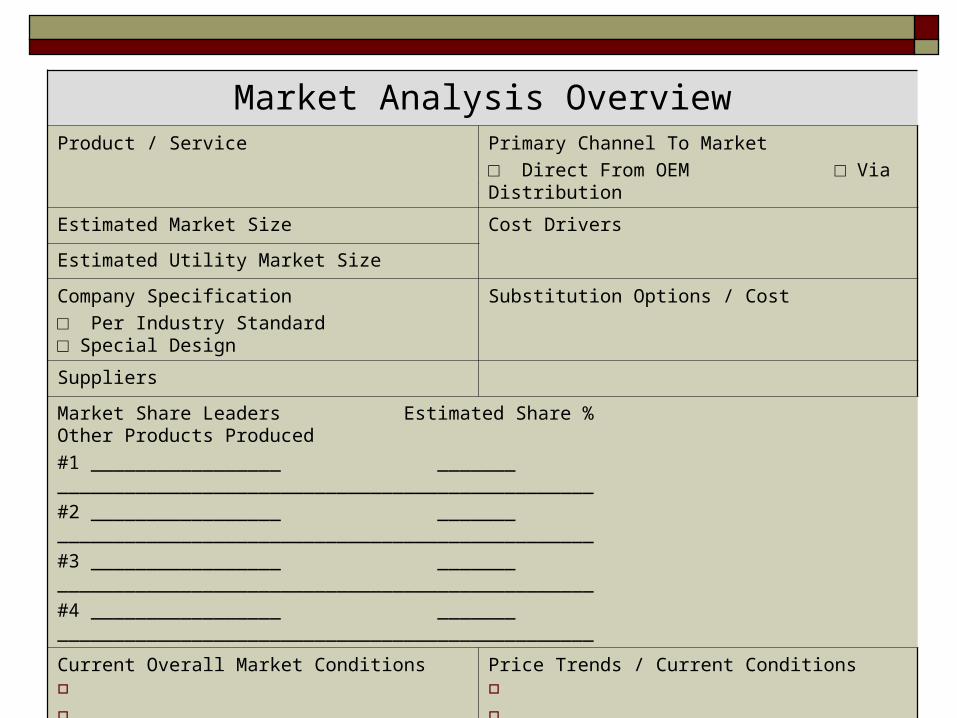
Market Analysis OverviewProduct / Service Primary Channel To Market
□ Direct From OEM □ Via Distribution
Estimated Market Size Cost Drivers
Estimated Utility Market Size
Company Specification
□ Per Industry Standard □ Special Design
Substitution Options / Cost
Suppliers
Market Share Leaders Estimated Share % Other Products Produced
#1 _________________ _______ ________________________________________________
#2 _________________ _______ ________________________________________________
#3 _________________ _______ ________________________________________________
#4 _________________ _______ ________________________________________________
Current Overall Market Conditions
Price Trends / Current Conditions
Confidential - The McCallan Group 29
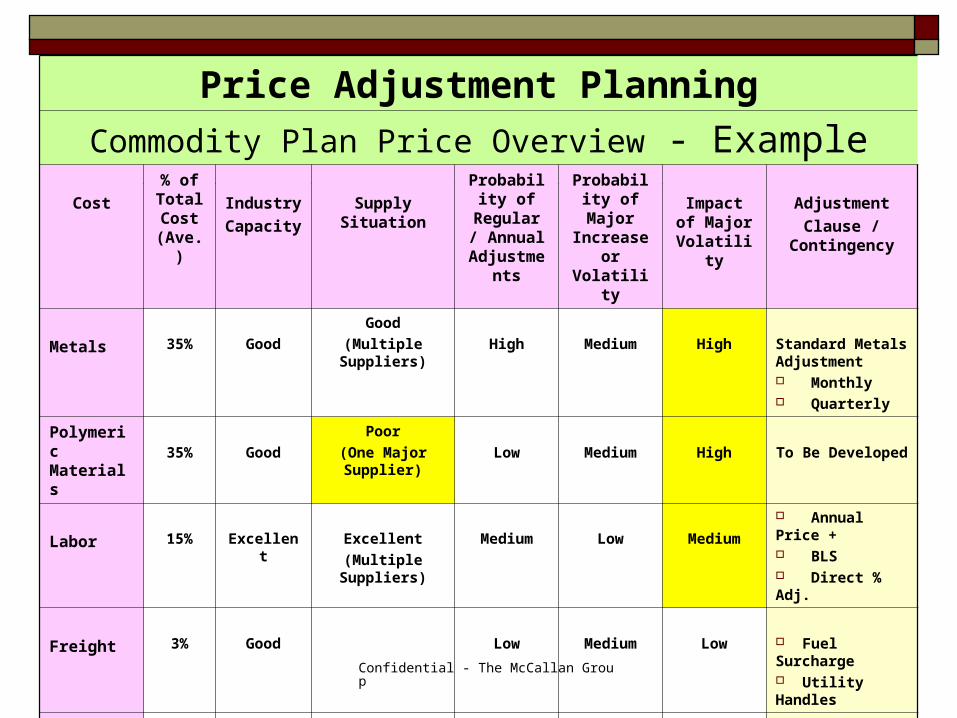
Price Adjustment Planning
Commodity Plan Price Overview - Example
Cost
% of Total Cost
(Ave.)
Industry
Capacity
Supply Situation
Probability of Regular /
Annual Adjustment
s
Probability of Major
Increase or Volatility
Impact of Major
Volatility
Adjustment
Clause / Contingency
Metals 35% Good
Good
(Multiple Suppliers)
High Medium High Standard Metals Adjustment Monthly Quarterly
Polymeric Materials 35% Good
Poor
(One Major Supplier)
Low Medium High To Be Developed
Labor 15% Excellent Excellent
(Multiple Suppliers)
Medium Low Medium
Annual Price + BLS Direct % Adj.
Freight 3% Good Low Medium Low Fuel Surcharge Utility Handles
Packaging 3% Excellent Low Low Low Firm Per Supplier

Confidential - The McCallan Group 30
0
0.2
0.4
0.6
0.8
1
1.2
Transformers Cable Poles Line Hardware Veg. Mgmt.
Wood
Labor
Copper/Aluminum
Steel
Fuel
Oil/Chemicals
Cost Driver Overview (Example)

Confidential - The McCallan Group 31
Requests For Price Increases
What are the consequences if the answer is “No”?
Was it anticipated in any way? Was it within or beyond their control?
Is it allowed in the contract?
Never react immediately; remain calm, questioning, doubtful
Can the supplier justify and document the increase?
Are other suppliers asking for / experiencing the same situation?
Will there be a decrease if/when the reason for the increase disappears?

Confidential - The McCallan Group 32
The Next Step - - - ? Elevate Supply Chain with CEOs and CFOs
Develop a REAL Supply Chain Strategy, not just a “Sourcing Plan”
Re-evaluate your “Total Supply Chain Cost”
Focus on Price Management vs. Low Price
Develop new models for Supplier Relationships The Next Generation Alliance (?)