construct validity of the wisc-iii for white and black...
TRANSCRIPT

School Psychology Review, 2001, Volume 30, No.1
Construct Validity of the WISC-III for White and Black Students from the WISC-III Standardization Sample and for Black Students Referred for Psychological Evaluation
Joseph c. Kush Duquesne University
Marley W. Watkins Pennsylvania State University
Thomas J. Ward and Sandra B. Ward The College of William and Mary
Gary L. Canivez Eastern Illinois University
Frank C. Worrell Pennsylvania State University
Abstract. This study used both exploratory (EFA) and confirmatory factor analyses (CFA) to examine the factor structure of the WISC-III among White and Black students from the WISC-III standardization sample and a sample of 348 Black students referred for psychological evaluation. Results of the EFA provided evidence of a large first principal factor as well as the expected Verbal and Performance components across all three groups. Empirical support for the Freedom from Distractibility dimension was provided only from the confirmatory factor analyses. Although the four factor confirmatory model exhIbited the best overall statistical fit, inspection of specific factor loadings revealed anomalies with the third and fourth factors, especially for the Referred Black sample. Implications for school psychologists are presented and recommendations for future research are provided.
The issue of nondiscriminatory assessment is a concept of considerable legal and ethical importance to all psychologists (CNPAAEMI, 2000). The selection of test instruments that are free of test bias is paramount for school psychologists who work with ethnically diverse populations. Construct valid-
ity is perhaps the most fundamental of all types of measurement validity (Messick, 1989), and often derives from correlational studies and factor analytic research. Empirical support for comparable factor structures across ethnic groups suggests that similar constructs or latent traits are being assessed and provides pre-
The authors are grateful to the Psychological Corporation, and in particular, Dr. Larry Price and Dr. Chuck Wilkins for their access to, and assistance with the analyses of, the WISC-Ill standardization data.
Address all correspondence to Joseph C. Kush, Ph.D., 103B Canevin Hall, Duquesne University, Pittsburgh, PA 15282-0502. E-mail: [email protected].
Copyright 2001 by the National Association of School Psychologists, ISSN 0279-6015
70
liminary support for the use of a test with those populations. Rogers (1998) emphasized the importance of establishing cross-cultural factorial similarity:
The construct validity of a test may also be a concern when the test evidences factorial invariance across racial/ethnic minority groups. Test developers and publishers need to report empirical evidence in the test manual that attests to the stabllity of the factor structure of a test for various majority and minority groups. When such information is not reported either in the manual or in the extant literature, the instrument IS considered to be of limited practical utLiity because it is impossible to independently judge the factorial stability of the measure. (p. 361)
WISC·R Construct Evidence
HistOIically, the Wechsler Intelligence Scale for Children-Revised (WISC-R; 1974) has been the most commonly used test of intelligence for children referred for psycho-educational evaluation (Hutton, Dubes, & Muir, 1992; Lutey & Copeland, 1982). Despite their popularity, Wechsler tests have been criticized for their lack of a strong theoretical foundation (Macmann & Barnett, 1992, 1994; Witt & Gresham, 1985). Although Wechsler (1939) viewed intelligence as a global capacity, he also believed that two dimensions underlie intelligence; all subsequent tests in the Wechsler family have been constructed to assess Verbal and Performance IQs. Despite a lack of change in the underlying theory this evolution continued such that factor analytic studies of the WISC-R found three factors to be present and the recently introduced Wechsler Intelligence Scale for Children-Third Edition (WISC-III; Wechsler, 1991) measures four IQ factor scores. Further, in using a Gf-Gc framework, McGrew (1997) suggests that the Wechsler tests may actually be measuring as many as 13 broad and narrow cognitive abilities. Because it rem.lins unclear how many "types" of intelligence are being measured by the Wechsler scales there currently exists considerable disagreement among school psychologists regarding their level of diagno~tic interpretability (Kush, 1996).
Constmct validity for Verbal and Performance IQs a5. well as for the Verbal Compre-
WISC-III Construct Validity
hension and Perceptual Organization dimensions of the WISC-R has been well established and shown to be invariant across age (Conger, Conger, Farrell, & Ward, 1979), gender (Reynolds & Gutkin, 1980), and ethnicity (Gutkin & Reynolds, 1981; Reschly, 1978; Taylor. Ziegler, & Partenio, 1984). Considerable empirical support has also been provided for a third WISC-R factor, Freedom from Distractibility. Kaufman (1975) found this third factor to be present in each of the age groups of the WISC-R standardization sample, and the presence of the Freedom from Distractibility factor has been established in independent regular and special education populations (Juliano, Haddad. & Carroll, 1988; Reynolds & Kaufman, 1990; Sattler, 1974), and across diverse ethnic groups (Dean, 1980; Kaufman, 1975).
Development and Construct Evidence of the WISC·IlI
With the publication of the Wechsler Intelligence Scale for Children-Third Edition (WISC-Ill; Wechsler, 1991). a new sub test (Symbol Search) was created to strengthen the third Freedom from Distractibility (FD) factor. However, this new subtestcaused the Freedom from Distractibility factor to splinter into two smaller factors each consisting of only two subtests. Freedom from Distractibility remained with loadings from two auditory subtests (i.e., Arithmetic and Digit Span), and the newly created factor, Processing Speed, was formed by loadings from Coding and Symbol Search. This structure was replicated in the WISC-III Canadian normative sample (Roid & Worrall, 1997). Keith and Witta (1997) also provided qualified support for a similar four-factor structure. They performed a hierarchical confirmatory factor analysis of the WISC-Ill standardization data and endorsed a hierarchical solution with four firstorder factors and one second-order factor reflecting (g) general intellectual ability. Other analyses of the WISC-III standardization data (Allen & Thorndike, 1995; Sattler, 1992; Thorndike, 1992) have concluded that a threefactor solution best describes the data. Similarly, Reynolds and Ford (1994) found stabil-
71

72
School Psychology Review, 2001, Volume 30, No.1
ity of three WISC-III factors in the standardization sample across ages and across several factor analytic techniques when Symbol Search was excluded from the analyses. Compounding the problems associated with the instability of the third and fourth WISC-III factors is a lack of clear empirical evidence that either of these factors is clinically interpretable (Anastopoulos, Spisto, & Maher, 1994; Kamphaus, 1993; Riccio, Cohen, Hall, & Ross, 1997).
WISC·III construct evidence in independent samples. Research examining the factor structure of the WISC-III in independent populations has also produced contradictory conclusions. Support for a four-factor solution has been provided for regular education (Roid, Prifitera, & Weiss, 1993), and special education (Konold, Kush, & Canivez, 1997) students. However, Logerquist-Hansen and Barona (1994) reported a three-factor solution in a sample of Hispanic students with learning disabilities. Further, both Kush (1996) and Scardapane (1996) found support for only the Verbal and Performance factors in samples of students with learning disabilities.
Factorial Comparisons Across Ethnic Groups on the Wechsler Scales
Historically, factorial similarity has been shown between Black and White children on Wechsler scales, including the original WISC (Lindsey, 1967), the WISC-R (Taylor & Ziegler, 1987), and the Wechsler Preschool and Primary Scale of Intelligence (WPPSI; Kaufman & Hollenback, 1974). Additional research examining the construct validity of the WISC-R for Black students also found support for Verbal and Performance factors but questioned the validity of the third factor (Greenberg, Stewart, & Hansche, 1986; Gutkin & Reynolds, 1981). Valencia, Rankin, and Oakland (1997) also found WISC-R factorial similarity between White and Black students although the order of the second and third factors was reversed for the Black sample.
Research examining the construct validity of the WISC-III for Black students is sparse. Using a very small sample of Black students
(N = 58), Slate and Jones (1995) attempted to factor analyze the 10 required subtests plus the optional Digit Span subtest and found support for only the Verbal and Performance factors. In a somewhat larger sample of Black students (N = 161), Kush and Watkins (1997) analyzed the 10 mandatory WISC-III subtests and also found support for the Verbal and Performance factors. These results were robust across several extraction and rotation techniques. However, support for the full, four-factor model could not be confirmed, as participants in these studies were not administered all 12 mandatory and supplemental subtests.
Much of the published factorial validity research with the WISC series is difficult to integrate because disparate factoring methods were applied (e.g., exploratory and confirmatory analyses; maximum likelihood. principal factors, and alpha extraction techniques; orthogonal and oblique rotations) to diverse populations. The current study was designed to extend previous WISC-III validity research by utilizing the factor analytic techniques originally applied to the combined WISC-III normati ve sample (Wechsler, 1991) with the separate White and Black WISC-III standardization samples and with an independent sample of Black students referred for psychological evaluation.
Specifically, the purposes of this study were twofold. Our first goal was to replicate. exactly, the exploratory factor analytic methodology used with the total WISC-III standardization sample, with separate analyses of the White and Black students included in the WISC-III standardization sample, and with an independent sample of Black students completing the WISC-III. Because Black students represent a small percentage of the WISC-III standardization sample (15.4%) additional research examining this population is particularly warranted.
Our second goal was to examine alternative factor analytic models of the WISC-III for possible improvement in fit, within both Black and White samples. Selection of models was derived from previous empirical analyses of the WISC-III and included models with between one and five factors. The selection of
models was not exhaustive and other theories of intelligence (e.g., PASS, Ca'-Gcl were intentionally not included. Multifactorial theories of intelligence have gained recent popularity; however, there is currently no consensus regarding which theory hl'st de~cribes the structure of human intelligence. Given that these debates have yet to be re~olved (e.g., it is not yet clear how the Gf factor i" substantially unique from the higher-order R factor), our goal was to focus on extending previous WISC-III findings:
Regardless of whether the factor~ dis,'overed from factor analyzmg the scale~ are true representations of underlying dimensions of intelligence, the psychometric utility of the instruments is derived directly from their ability to r:leasure the compo~itlOn of these factors across age groups and instruments reliably. (Allen & Thorndike, 1995, p. 648)
Method
Participants
Three samples of students were involved in the present study. The Standardization White sample included all the White students (N = 1,543) and tte Standardization Black sample contained all the Black students (N = 338) in the WISC-III standardization ~ample
(Wechsler, 1991). White students comprise 86% of the standardization sample and Black students comprise 14% of the standardization sample. Demographic data were not :t"ailable for these students, but they should be adequately described in the test manual (Wechsler, 1991).
The Referred Black sample was composed of 348 Black students who received comprehensive psychological evaluations across 10 states (from three of the four geographic regions reported in the WISC-III standardization sample): AZ, CT, DE, GA. NC, NJ, NY, OR, PA, and VA. These students were selected from archival records contributed from recent psychological evaluations and re-evaluations. One hundred-ninety of these evaluations were pall of an initial evaluation process, and 138 occurred at the time of a regularly scheduled, triennial re-evaluation. The remaining 20 cases were conducted lI1termittently
WISC-1I1 Constroct Validity
between initial evaluation~ and re-evaluations. The sample included 254 males and 94 females in Grades kindergarten through 12 (Mdn age = 11; Mdn grade = 5) with a relatively equal distribution acros~ Grades 2 through 8. Subsequent to these evaluatlOn~. special education status was determmed to include 206 students with Learning DisahiIJtie~, 23 students with Emotional DIsabilitle~. 25 students with Mild Mental Retardation, 2 students with SpeechLanguage DisahilIties. and II students categorized a'; Other Health Impaired. Eighty-one of the ~tudenh were determined to be ineligible for special educatIOn serVlCes.
Measures
The WISC-lII is an individually administered test of intellectual .Ibility for children aged 6-0 to 16-11 years (Wechsler. 1991). It was standardized on a natIOnally representative sample of 2.200 children. with 100 boys and 100 girls included at each of 11 age levels. The wIse -[l[ con~ists of I , subtests (M = 10; Sf) = 3), which combine to yield Verbal, Perfonnance, and Full Scale IQs (M = 100; Sf) = 15). Becau'>e Mazes is not included in the calculation of any IQ scores it was excluded from all sub~equellt analyses.
Procedure
Procedures used to collect the WISC-III normati ve data are descn bed in Wechsler (1991). For the Referred Black sample, the WISC-HI was admmistereu by state certified school psychologists as part of the multidisciplinary evaluation process to determine eligibility for ~pecial education services. The Referred B lack sample was extracted from the results or two previous WISC-III data collection surveys. The flr~t survey (Canivez & Watkins, 1998) wa:, of 2,Oon NASP practitioners from across the Cnlted States. In the second SUfYey (Watkins & Ku~h, 2000), special education dm~etors of Arizona ~chool districts were asked to proVide anOJ,ymous WISC-III data. From these 1\\ 0 WISe-III data sets, 509 Black students were initially Identlfied; however, Digit Span and Symb(d Search subtests were not admini:-tered to 161 ofthe~e students
73

74
School Psychology Review, 2001, Volume 30, No.1
Table 1 Components of Five Incremental Fit CFA Models for WISC-III Subtests
with Referred Black Students and Black and White Students from the WISC-III Normative Sample
Model Model Model Model Model
One Two Three Four Five
IN IN IN IN IN
SM SM SM SM SM
va VO va va va
CM CM CM CM CM
AR AR AR PC PC
DS DS DS PA PA
PC PC PC BD BD
PA PA PA OA OA
BD
I BD BD AR AR
OA OA OA DS , DS
CD CD CD CD CD
SS SS SS SS SS
Note. TN = TnfonnatJ(1n. SM = SimilantIes. AR = Arithmetic. VO = Vocabulary. CN! = Comprehemion, DS = Digit Span, PC = PIcture Completion, CD = Codll1g. PA = Picture Arrangement. BD = Block DC'lgn, OA = Object Assembly, SS = Symbol Search.
who were consequently excluded from the present study. Special education placements were independently determined by a multidisciplinary team based on federal and state special education rules and regulations.
Data Analyses
Exploratory factor analyses. Scaled scores from the 12 WISC-1lI subtests combined to form a 12 x 12 correlation matrix. Consis-
tent with exploratory factor analyses (EFA) reported in the WISC-III technical manual (Wechsler, 1991) on data comprising the standardization sample, maximum likelihood extraction (using squared multiple correlations) with Varimax rotation was conducted. As recommended by Gorsuch (1983), mUltiple criteria were used to determine the number of factors to retain, including the scree test (Cattell, 1966) and parallel analysis (Horn, 1965). The

scree test plots eigenvalues against factors to visually identify the optimum number of common factors. Parallel analysis compares eigenvalues extracted from the sample data with eigenvalues generated from random normal data containing the same number of subjects and variables. Factors are considered meaningful when they are represented by larger eigenvalues than are produced by Ihls random data (Lautensch lager, 1989).
Contlrmatory factor analyses. Although EFA is useful for identifying the latent constructs that could account for the intercorrelations of a set of variables, it produces mathematically indeterminate results (Gorsuch, 1983). That is, no single unique mathematical solution can be identified. Confirmatory factor analysis (CFA) is well suited for testing which of a number of competing models best fits the data. Gerbing and Hamilton (1996) demonstrated that exploratory factor analysis "is a useful tool to aid the researcher in recovering an underlying measurement model that can then be evaluated with CFA" (p. 71), and Carroll (1995) recommended that both exploratory and confirmatory analyses be conducted and reported when studying cognitive abilities.
Confilmatory factor analyses were conducted by the authors on the Referred Black sample using version 5.4 of the statistical software EQS for the Macintosh (Bentler & Wu, 1995). CFA of the Standardization Black and Standardizatlon White WISC-III samples were performed by The Psychological Corporation using AMOS 3.6 (Arbuckle, 1997). A series of five incremental fit models were analyzed. Covariance matrices of the 12 WISC-III subtests served as input for these procedures. Each of the :~ive models was evaluated using maximum likelihood estimation. Sub tests that comprise each model are presented in Table 1. These models were based upon previous empirical and theoretical analyses of the WISCIII (Floyd & Widaman, 1995; Kamphaus, Benson, Hulchinson, & Platt, 1994; Kush, 1996; Kush &: Watkins, 1997; Roidet al., 1993; Wechsler, 1991; Woodcock, 1990). Model 1 included all 12 sub tests in a single factor, whereas Model 2 reflected the traditional
WISCIII Construct Validity
WISC-III Verbal (lN, SM, va, CM, AR, DS; see Table l) and Performance (PC, PA, BD, OA, CD, SS; see Table I) factors. Model 3 examined a three-factor model that included a Perceptual Speed factor (Coding and Symbol Search were pulled from their respective Verbal and Performance factors). Model 4 reflected the four-factor model thought to underlie the WISC-lII (Verhal Comprehension = IN, SM. va, CM: Perceptual Organization = PC, PA, BD. OA; Freedom from Distractibility = AR, OS; Processing Speed = CD. SS). Finally, Model S examined a five-factor model identical to Model 4 except that Arithmetic and Digit Span were allowed to load as separate factors.
Results
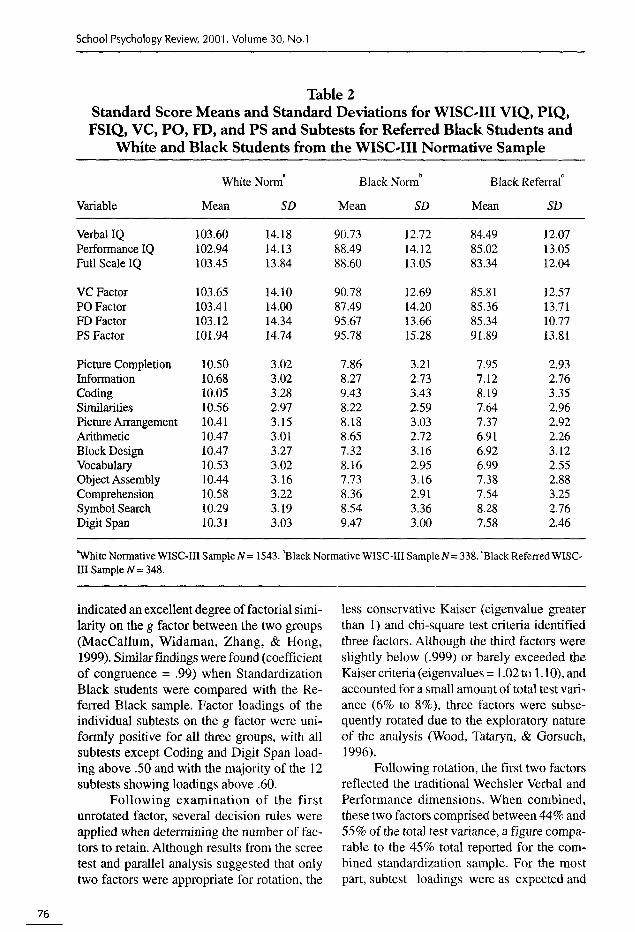
Descriptive statistics for Verbal, Performance, and Full Scale IQs of the WISC-III, the four factor indexes. and individual subtests are presented in Table 2 for all three samples. The IS-point difference between Standardization White and Standardization Black students is consistent with previous research on the WISC-R. And, as would be expected, Referred Black students exhibited slightly lower Full Scale IQ scores than did Standardization Black students. Additionally, the relatively equal Verbal and Performance IQ scores within each sample is congruent with the small differences found in the WISC-R standardization sample for Black children (Kaufman & DoppeJt, 1976) and with existing research on the WISC-III involving Black students (Kush & Watkins, 1997; Slate & Jones, 1995). Table 3 presents the WISC-III subtest intercorrelation matrix for the Referred Black. children.
Exploratory factor analyses (EFA). Results of the maximum-likelihood exploratory factor analyses for all three groups are presented in Table 4. An examination of the first unrotated factor in each of these analyses indicates that a moderate percentage of total WISC-III variance (44% to 53%) was accounted for by a large latent general factor (g). This is comparable to the 43% attributed to g in the standardizatIOn sample. When comparing WISC-III Standardization Black and Standardization White student~, a coefficient of congruence (Wrigley & Neuhaus, 1955) of .99
75
76
School Psychology Review, 2001, Volume 30, No.1
Table 2 Standard Score Means and Standard Deviations for WIse-Ill VIQ, PIQ, FSIQ, ve, PO, FD, and PS and Subtests for Referred Black Students and
White and Black Students from the WIse-Ill Normative Sample
White Norm .
Black Norm b
Black Referral"
Variable Mean SD Mean SD Mean SD
VerbalIQ 103.60 14.18 90.73 12.72 84.49 12.07 Performance IQ 102.94 14.13 88.49 14.12 85.02 13.05 Full Scale IQ 103.45 13.84 88.60 13.05 83.34 12.04
VC Factor 103.65 14.10 90.78 12.69 85.81 12.57 PO Factor 103.41 14.00 87.49 14.20 85.36 13.71 FD Factor 103.12 14.34 95.67 13.66 85.34 10.77 PS Factor 101.94 14.74 95.78 15.28 91.89 13.81
Picture Completion 10.50 3.02 7.86 3.21 7.95 2.93 Information 10.68 3.02 8.27 2.73 7.12 2.76 Coding 10.05 3.28 9.43 3.43 8.19 3.35 Similarities 10.56 2.97 8.22 2.59 7.64 2.96 Picture Arrangement 10.41 3.15 8.18 3.03 7.37 2.92 Arithmetic 10.47 3.01 8.65 2.72 6.91 2.26 Block Design 10.47 3.27 7.32 3.16 6.92 3.12 Vocabulary 10.53 3.02 8.16 2.95 6.99 2.55 Object Assembly 10.44 3.16 7.73 3.16 7.38 2.88 Comprehension 10.58 3.22 8.36 2.91 7.54 3.25 Symbol Search 10.29 3.19 8.54 3.36 8.28 2.76 Digit Span 10.31 3.03 9.47 3.00 7.58 2.46
"white Nonnative WISC-III Sample N = 1543. 'Black Normative WISC-III SampleN = 338. 'Black Referred WISC-III Sample N = 348.
indicated an excellent degree offactorial similarity on the g factor between the two groups (MacCallum, Widaman, Zhang, & Hong, 1999). Similar findings were found (coefficient of congruence = .99) when Standardization Black students were compared with the Referred Black sample. Factor loadings of the individual subtests on the g factor were uniformly positive for all three groups, with all subtests except Coding and Digit Span loading above .50 and with the majority of the 12 subtests showing loadings above .60.
Following examination of the first unrotated factor, several decision rules were applied when determining the number of factors to retain. Although results from the scree test and parallel analysis suggested that only two factors were appropriate for rotation, the
less conservative Kaiser (eigenvalue greater than 1) and Chi-square test criteria identified three factors. Although the third factors were slightly below (.999) or barely exceeded the Kaiser criteria (eigenvalues = 1.02 to 1.10), and accounted for a small amount of total test variance (6% to 8%), three factors were subsequently rotated due to the exploratory nature of the analysis (Wood, Tataryn, & Gorsuch, 1996).
Following rotation, the first two factors reflected the traditional Wechsler Verbal and Performance dimensions. When combined, these two factors comprised between 44% and 55% of the total test variance, a figure comparable to the 45% total reported for the combined standardization sample. For the most part, subtest loadings were as expected and

Wlse·11I Construct Validity
Table 3 Intercorrelations among WISC~III Subtests for
Referred Black Students (N = 348)
IN CD SM PA AR BD VO OA CM SS DS
PC 41 .14 .36 44 .32 .53 A4 48 AO .33 .20
IN .05 .51 38 .50 .33 .57 .29 AO .31 .21
CD .17 .24 .04 .16 .17 .20 .23 .49 -.03
SM .39 .33 .39 .60 .30 .31 .38 .20
PA .31 A8 .51 .44 .42 .48 .10
AR .24 .44 .30 .41 .20 .24
BD .35 .60 .33 .38 .20
VO .38 .67 .36 .13
OA .37 .43 .23
CM .31 .18
SS .16
Note. PC = Picture CompletIOn; IN = Infonllation, CD = Coumg, SM ; Smillarltle'. PA = PICture Arrangement. AR = Arithmetic; BI> = Block DeSign; va = Vocabulary; OA = OhJect As,embly. CM = ComprehenSion. SS = Symbol Search; OS = Digit Span.
aligned closely with their respective latent dimensions. Although most commonly associated with the Performance subtests, the Picture Arrangement subtest di~played comparable loadings on both the Verbal and Performance factors. The third factor was characterized by strorg loadings from only two subtests (Coding and Symbol Search), whIch correspond to the Processing Speed factor in the standardization sample. No evidence of the Freedom from Distractibility factor emerged, with Arithmetic exhibiting a strong loading on the Verbal factor and Digit Span failing to load on any of the three extracted factors in two of the samples. The Arithmetic subtest ex.hibited moderate loadings on both the Verbal and Processing Speed factors only for Standanlization Black students.
As expected, good to excellent (MacCallum et a1., 1999) factorial similarity was found between Standardization White and
Standardization Black students for both the Verbal and Performance hctors (coefficients of congruence = .99 and .92, respectively). Similar congruence emerged when Verbal and Performance factors from the Referred Black and Standardi7atltll1 Black samples were examined (coefficients of congruence = .98 and .92, respectively). Good congruence was also evidenced between Standardization White and Standardization Black samples (coefficient of congruence = .94) on the PS factor; however, the degree of simJlarity was borderline (coefficient of congruence = .l-I7) when Referred Black and Standardization Black samples were compared.
Confinnatory factor analyses (CFA). No index of model fit has been generally accepted as superior, so several were applied to ensure that multiple aspect~ of model fit could be captured (Hu & Bentler, 1995). Model evaluation stati~tics are presented in Table 5.
77

I~ Table 4 <J>
n
Exploratory Maximum Likelihood/Varimax Factor Loadings of the WISC .. III for Referred Black (RB) :::r-0 Q..
Students, Black Students from the WISC .. III Standardization Sample (SB), and White Students "D V> '<
from the WISC .. III Standardization Sample (SW) n :::r-0 0-no '<
g Loading Factor I Factor II Factor III AI tP < iii'
Subtest RB SB SW RB SB SW RB SB SW RB SB SW ,~ N 0
PC .63 .65 .60 .36 .34 .34 .55* .60* .47* .13 .14 .01 0
IN .63 .73 .76 .62* .70* .73* .28 .22 .30 .03 .18 .01 < Q.. c
CD .32 .48 .46 .05 .11 .12 3
.02 .14 .10 .77* .66* .82* tP w
SM .67 .74 .76 .62* .68* .72* .26 .31 .30 .18 .14 .01 P z ?
PA .67 .61 .54 Al * .35 .29 .44* .31 .32 .31 .32 .24
AR .51 .70 .72 .51 * .52* .51* .24 .22 .38 -.01 .35 .21
BD .64 .74 .70 .20 .33 .25 .77* .62* .76* .17 .35 .19
VO .81 .78 .76 .84* .76* .79* .21 .29 .20 .17 .17 .17
OA .63 .61 .63 .23 .20 .22 .66* .70* .63* .23 .18 .18
CM .70 .72 .67 .68* .70* .65* .21 .20 .18 .22 .20 .18
SS .58 .59 .60 .24 .20 .20 .34 .20 .34 .61* .70* .61*
DS .25 .59 .49 .16 .38 .30 .27 .17 .29 -.04 .39 .19
Eigenvalue 4.87 5.35 5.04 1.35 1.21 1.28 1.10 1.02 .999
% ViTiance 44 53 51 37 45 42 7 10 11 6 8 8
Note. RB N", 348, SB N", 338, SW N = 1543. PC = Picture Completion; IN = Information; CD = Coding; SM = Similarities; PA = Picture Arrangement; AR = Arithmetic; BD = Block Design; va '" Vocabulary; OA = Object Assembly; CM = ComprehensiOn; SS = Symbol Search; DS = DigIt Span. * Sigmficant Factor Loading

WISC-III Construct Validity
Table 5 WISC .. III CFA Model Evaluation Statistics Across Three Samples
Model/Sample'
One Factor
Bla(:k Referred
Black Norm
White Norm
1\voFactor
Black Referred
Black Norm
Whh:eNorm
Three Factor
Black Referredb
Black Norm
White Norm
Four Factor
Black Referredb
Black Norm
White Norm
df
366.1** 54
261.9** 54
1234.1** 54
225.1 ** 53
159.8** 53
712.5** 53
160.1** 52
112.3** 51
386.9 51
151.5** 49
79.1* 48
212.4** 48
90% CI )(2
OFI CFI RMSEA RMSEA Diff df
.837 .792 .129 .116-.141
.869 .867 .107 .094-.120
.865 .828 .119 .113-.125
.902 .885 .097 .084-.110 141**
.920 .932 .077 .064-.091 102**
.924 .904 .090 .084- 096 522**
.927 .928
.947 .961
.956 .951
.077 .064-.091 65**
.060 .045-.075 48** 2
.065 .059-.071 326** 2
.932 .932 .078 .064-.092 8.6* 3
.963 .980 .044 .026-.061 33** 3
.977 .976 .047 .041-.054 175** 3
ON = 348, 338, and 1543 for Black Referred, Black Nonn, and White Nonn samples, respectively. ~egative error variance for Symbol Search reqUlred that it be fixed to allow model to be estimated. 'p < .05. "p < .001.
None of the models could be accepted based upon the population )(2 because the >[2 measure is extremely sensitive to large sample sizes (Crowley & Fan, 1997).
Given this limitation of the )(2, it is prudent to look at competing models (Loehlin, 1992) and alternative fit indices (B yrne, 1994). Competing mcdels can be judged by calculating the difference in their )(2 values. A statistically significant change in )(2 between two models indicates that one model provides a significantly better fit than the other.
Three alternative fit indices are presented in Table 5: the goodness offit index (GFI), the comparative fit index (CFI), and the root mean square error of approximation (RMSEA). The CFI assesses fit relative to a haseline null
model. The GFI is an index of the relative amount of the variances and covariances jointly accounted for by the model and is analogous to R2 in multiple regression. The RMSEA reflects the covariance residuals adjusted for degrees of freedom. Thus, it is a measure of badness of fit, whereas the GFI and CFI indexes reflect goodness offit. Only RMSEA has a known sampling distribution and can, therefore, be used to judge competing models (MacCallum, Browne, & Sugawara, 1996; Rigdon, 1996) as well as absolute (mis)fit.
GFl and CFI are normed to fall within a range of 0.0 to 1.0, with larger values indicating better fit. RMSEA values also range from 0.0 to 1.0. However, in contrast, smaller values represent a better fit. Generally, GFI and
79

80
School Psychology Review, 2001, Volume 30, No.1
CFI values greater than .90 and RMSEA values of .05 or less indicate an acceptable fit to the data (Bentler, 1992; Tabachnick & Fidell, 1996). However, Hu and Bentler (1998,1999) recommended a combination rule that requires both a CFI cutoff value close to .95 and an RMSEA value near .06 to minimize Type I and Type II error rates.
Analysis of the five-factor model was attempted, but resulted in numerous negative error variance estimates. Thus, Model 5 was detennined to be problematic (Velicer & Fava, 1998) and was excluded from further consideration (Bentler & Chou, 1987). GFI, CFI, and RMSEA indices suggested that the three- and four-factor models were relatively equivalent for all three samples (see Table 5). The fourfactor solution for both Standardization White and Standardization Black samples clearly met Hu and Bentler's (1998, 1999) combinatorial fit criterion of CFI ~ .95 and RMSEA ~ .06. RMSEA 90% confidence intervals (MacCallum et aI., 1996) revealed that (a) there was no clear distinction between two-, three-, and four-factor solutions for the Referred Black sample; (b) there was no clear distinction between three- and four-factor solutions for the Standardization Black sample; and (c) there was a clear superiority of the four factor solution for the Standardization White sample. However, )(2 difference analyses indicated statistically significant improvements in successive model fit between Models 1,2,3, and 4 for all three samples. That is, the addition of a second factor improved model fit over the one-factor model, the addition of a third factor improved over the two-factor model, and the addition of a fourth factor improved over the threefactor model. When overall Type I error was controlled while examining this sequence of nested model tests (Bentler, 2000), however, the four-factor solution was statistically superior for the Standardization Black and Standardization White samples but not for the Referred Black sample. Thus, it appears that the four-factor model exhibits the best overall fit for the Standardization White and Standardization Black samples whereas there was no clear distinction between three- and four-factor models for the Referred Black sample.
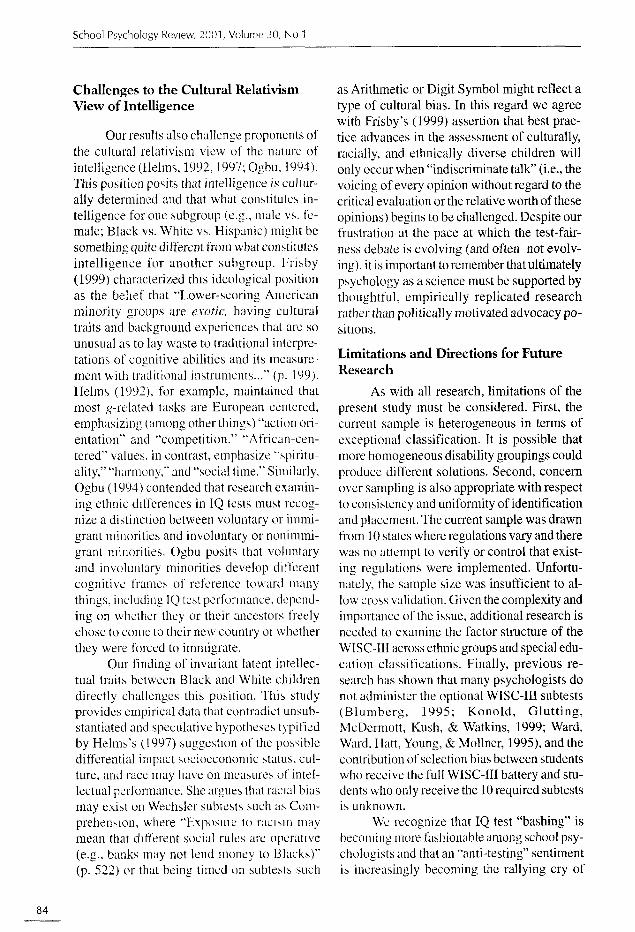
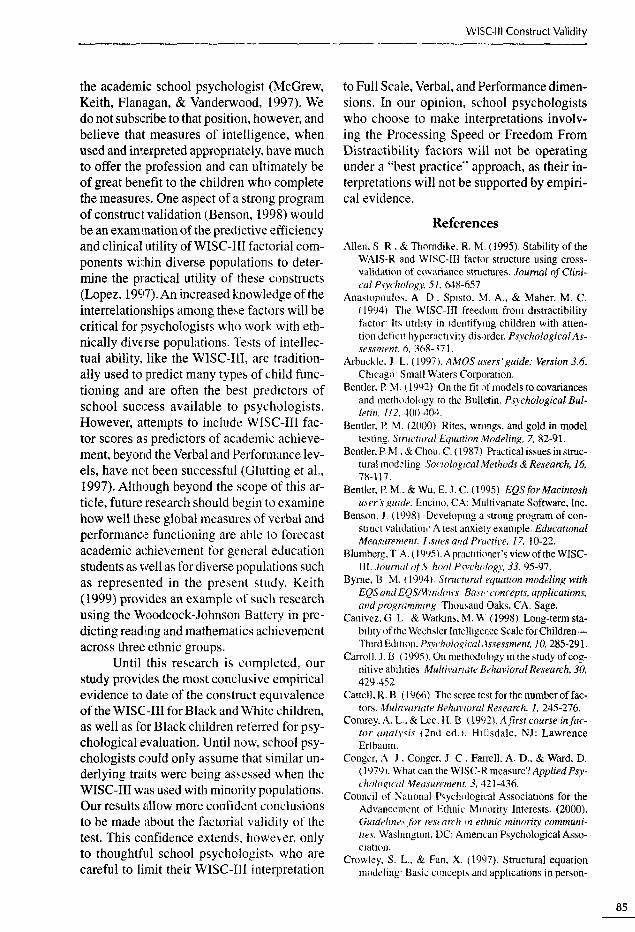
Four-factor solutions for all three samples are provided in Table 6. Standardized structural coefficients for the four-factor model based on the Referred Black sample are also presented in Figure 1.
Discussion
Full Scale, Verbal, and Performance IQs
These results provide qualified support for the construct validity of WISC-TII scores when comparing Standardization White and Standardization Black students and Black students referred for psychological evaluation. As expected, results of the present study indicated that subtests from the WISC-TII produced substantial g loading across all three samples of students. Results of this study, considered within the context of other research (Kush & Watkins, 1997; Slate & Jones, 1995) further indicate that school psychologists can reasonably conclude that the WISC-III Verbal and Perfonnance indices can be thought of as relatively robust indicators of intelligence for both White and Black children. Although school psychologists who work with these populations of children had previously assumed the similarity of factor structure across ethnic groups, our study is the fIrst to provide empirical evidence to support this claim. Additionally, our study suggests that these findings can be extended to both referred and nonreferred Black students.
Factor Score Indices
Empirical support is less definitive for the existence of the two smaller factor scores, Freedom from Distractibility and Processing Speed. Across all three samples, EFA suggested that only three factors could best account for the pattern of correlations found between WISC-III subtests: Verbal Comprehension (VC), Perceptual Organization (PO), and Processing Speed (PS). Arithmetic (AR) consistently loaded on the VC factor but Digit Span (DS) failed to show a strong salient loading on any single factor. The PS factor accounted for a very small proportion of the total WISC-III variance (6-8%) and when Standardization Black students were compared with Referred

Table 6 Standardized Structural Coefficients for Model Four of the WISC-III for Referred Black Students and White and
Black Students from the WISC-III Normative Sample
Factor I Factor II Factor III Factor IV
White Black Black White Black Black White Black Black White Black Black
Subtest Nonn Nonn Referral Norm Norm Referral Norm Norm Referral Nonn Nonn Referral
IN .80 .75 .67
SM .79 .77 .71
VO .82 .83 .86
CM .69 .75 .74
PC .59 .68 .68
PA .50 .57 .69
BD .78 .79 .74
OA .69 .67 .72
AR .83 .71 .74
DS .52 .59 .32
CD .61 .63 .50
SS .91 .80 .98
Note. PC = Picture Completion; IN = Information; CD = Coding; SM = Similarities; PA = Picture Arrangement; AR = Arithmetic; BD = Block Design; va = Vocabulary; OA = Object Assembly; CM = Comprehension; SS = Symbol Search; DS = Digit Span.

82
School Psychology Review, 2001, Volume 30, No.1
Figure 1. Four-factor model fit and standardized loadings of the WIse-III for referred Black students.
.74 ·1 IN
.70 .. 8M
.52 ·1 VO
.67 ·1 CM
.73 .. , PC
.72 ·1 PA
.68 ·1 BD
.70 ·1 OA
.67 ·1 AR
.95 .\ D8
.87 ·1 CD
.18 ·1 88
PO FD PS
:1 .71 .73 .46
.58 .58
.29

Black students, the resultant borderline coefficient of congruence on the PS factor was indicative oflow factorial similarity between the two groups. Because the goal of the present study was to replicate the analyses utilized on the entire WISC-III standardization sample, Varimax rotation was perfornled on all three samples in the present study. However, when too many factors are rotated with the Varimax method ther!~ is a tendency for the variance of small, unimportant variables to be inflated, which subsequently has the effect of "robbing" larger factor:; of their share of appropriate variance (Comrey & Lee, 1992).
Confirmatory Analyses
The confirmatory factor analyses indicated that, overall, a four-factor model exhibited a statistically better fit to the data for the Standardization Black and Standardization White samples, but there was no clear distinction between the three- and four-factor models for the Rderred Black sample. Inspection of specific CFA structure loadings from the four-factor model reveals anomalies in the third and fourth factors, especially for the Referred Bl.1ck sample. For example, only 10% of the variance associated with DS and 25% of the variance associated with CD were explained. Irregularities with the third and fourth factors have been reported in previous studies with nonexceptional students (Allen & Thorndike, 1995; Sattler, 1992; Thorndike, 1992; Woodcock, 1990), but these problems have been especially prevalent with samples of exceptional students (Grice, Krohn, & Logerquist, 1999; Kush, 1996; Ravert. 1999). Tabachnick and Fidell (1983) made the following observation:
A variable with a low squared multiple correlation with all other variables or low correlations with all factors does not share variance with either variables or factors and has not participated in the analysis ... the dimension represented by the outlying variable may repre~.ent either a promi~ing lead for future work or (probably) error varianl·e. but its interpretation ao.>,aits clanficatJon by more research. (p. 380)
Contradictory factor analytic re~ults may partially be attributed to stati~tical artifacts.
WISC-III Construct Validity
According to Gorsuch (1983), "it is generally difficult to replicate factors with fewer than five or six salient variables per factor" (p. 332). Velicer and Fava (1998) abo noted that three variables per factor in a sample are a bare minimum requirement for recovering a population factor pattern. Another statlstical consideration is especially pertinent for CFA results because "For any given model. there will generally be alternative models, repre~ented by different pattern~ of relations among the variables, that are indistinguishable from the original model in terms of goodness of fit to sample data" (MacCallum, Wegener, Lchino, & Fabrigar, 1993, p. 185).
Reise. Widaman, and Pugh (1993) indicated that "no CFA model should be accepted or rejected on statistical grounds alone; theory, judgment. and persuasive argument should playa key role in defending the adequacy of any e"timated CFA model" (p. 554). Wechsler (1939. 1991) provided no underlying theoretical explanation for why these additional dil11en~ions of intellectual ability (FD and PS) should exist (Macmann & Barnett, 1992. 1994; Witt & Gresham, 1985) and there is evidence that the third and fourth factors show little incremental validity in predicting academic achievement (Glutting. Youngstrom, Ward, Ward, & Hale. 1997) and behavioral dysfunction (Riccio. Cohen, Hall, & Ross, 1997). Nor do they contnbute to diagnostic accuracy Vvith exceptional ~tudents (Watkins, Kush, & Glutting. 1997). Further. their longterm stabiltty is unsatisfactory (Canivez & Watkins, 1998). Given the lack of theoretical support. weak factorial invariance. inadequate long-term stability, and trivial incremental validity of the FD and PS factors, we recommend that interpretation of WISC-III scores beyond global, verbal. and performance dimensions should he undertJken with extreme caution. Thu~, we agree with Keith and Witta's (1997) assertion that the W[SC-III is first and foremost a measure of general intelligence or g, but we dl;,agree With their suggestion that interpretations beyond the FuJI Scale IQ will be more valId If ba,ed on the four optional index scores than on the Verbal and Performance IQs.
83
84
School Psychology Review, 2001, Volume 30, No 1
Challenges to the Cultural Relativism View of Intelligence
Our results also challenge proponents of the cultural relativism view of the nature of intelligence (Helms, 1992,1997; Oghu, 1994), This position po~it1', that intelligence is culturally determined and that what con~titute~ intelligence for one :-,ubgroup (e.g., male vs. female; Black VS. White %. Hispanic) might be something quite different from what constitutes intelligence for another subgroup. Fri:--by (1999) characterized this ideological po"ition as the beitef that "'Lower-scoring American minority groups are exotic, having cultural traits and background experience" that are so unusual a<; to lay waste to traditional interpretations of cognitive abilities and its measurement with traditional in"truments ... " (p. 199). Helm" (1992), for example, maintained that most g-related tasks are European centered, emphasizing (among other things) "action orientation" and "competition." "African-centered" values, in contrast, emphasize ""pirituality," "harmony," and "social time." Similarly, Ogbu (1994) contended that research examining ethnic differences in IQ tests mu"t recognize a distinction between voluntary or immigrant minorities and involuntary or nonimmigrant minorities. Ogbu posits that voluntary and involuntary minorities develop di fferent cognitive frallle~ of reference toward many things, including lQ te~t performance, depending on whether they or their ancestors freely chose to come to their new country 01 whether they were forced to immigrate.
Our fimling of invariant latent intellectual trait:.. between Black and White children directly challenges thi~ po:,ition. Thi~ study provides empirical data that contradict unsubstantiated and speculative hypotheses typified by HelIn:-, 's (1997) wggestlon of the po~~ible differential impact "ocioeconomic status, culture, and race may have on measure~ of intellectual performance. She argues that raCial bias may exi:,t on Wechsler subte~ts ~uch a~ COl11-prehel1~lon, where "EXpOSlll e to racl~m may mean that dltferent social rules are operative (e.g., banks may not lend money to Blacks)" (p. 522) or that being timed on subte~b such
as Arithmetic or Digit Symbol might reflect a type of cultural bias. In this regard we agree with Frisby's (1999) assertion that best practice advances in the assessment of culturally, racially, and ethnically diverse children will only occur when "indiscriminate talk" (i.e., the voicing of every opinion without regard to the critical evaluation or the relative worth of these opinions) begins to be challenged. Despite our frustration at the pace at which the test-fairness debate is evolving (and often not evolving), it is important to remember that ultimately p~ychology as a science must be supported by thoughtful, empirically replicated research rather than politically motivated advocacy positlons.
Limitations and Directions for Future Research
As with all research, limitations of the present study must be considered. First, the current sample is heterogeneous in terms of exceptional classification. It is possible that more homogeneous disability groupings could produce different solutions. Second, concern over sampling is also appropriate with respect to consistency and uniformity of identification and placement. The current sample was drawn from 10 states where regulations vary and there was no attempt to verify or control that existing regulations were implemented. Unfortunately, the sample size was insufficient to allow cro~s validation. Given the complexity and importance of the issue, additional research is needed to examine the factor structure of the WISe-Ill across ethnic groups and special education classifications. Finally, previous research has shown that many psychologists do not administer the optional WISC-IlI subtests (Blumberg, 1995; Konold, Glutting, McDermott, Kush, & Watkins, 1999; Ward, Ward, Halt, Young, & Mollner, 1995), and the contribution of selection bias between students who rec~ive the full WISC-III battery and students who only receive the 10 required subtests i~ unknown.
We recognize that IQ test "bashing" is becoming more fashionable among school psychologists and that an "anti-testing" sentiment i~ increasingly becoming the rallying cry of
the academic school psychologist (McGrew, Keith, Flanagan, & Vanderwood, 1997). We do not subscribe to that position, however, and believe that measures of intelligence, when used and imerpreted appropriately, have much to offer the profession and can ultimately be of great benefit to the children who complete the measures. One aspect of a strong program of construc t validation (Benson. 1998) would be an exammation of the predictive efficiency and clinical utility ofWISC-J[] factorial components wi::hin diverse populations to determine the practical utility of these constructs (Lopez, 1997). An increased knowledge of the interrelationships among the~e factors will be critical for psychologists who work with ethnically diverse populations. Tests of intellectual ability. like the WISC-IlI. are traditionally used to predict many type~ of child functioning and are often the best predictors of school success available to psychologists. However, attempts to include WISC-III factor scores as predictors of academic achievement, beyond the Verbal and Performance levels. have not been successful (Glutting et aI., 1997). Although beyond the scope of this article, future research should begin to examine how well these global measures of verbal and performanc.; functioning are able to forecast academic achievement for general education students as well as for diverse populations such as represented in the present study. Keith (1999) provides an example of such research using the vvoodcock-Johnson Battery in predicting reading and mathematics achievement across three ethnic groups.
Until this research is completed. our study provides the most conclusive empirical evidence to date of the construct eqUivalence of the WISe-III for Black and White children, as well as for Black children referred for psychological evaluation. Until now, school psychologists could only assume that similar underlying traits were being assessed when the WISC-III was used with minority populations. Our results allow more confident conclusions to be made about the factorial validity of the test. This confidence extends, howe\-er, only to thoughtful school psychologisb who are careful to limit their WISC-III interpretation
WIse-III Construct Validity
to Full Scale, Verbal. and Performance dimensions. In our opinion, school psychologists who choose to make interpretations involving the Processing Speed or Freedom From Distractibility factors will not be operating under a "best practice" approach, as their interpretations will not be supported by empirical evidence.
References
Allen, S R, & Thorndike, R. M. (1995). Stability of the WAIS-R and WISC-IlI factor structure using crossvalidation of covariance structures. Journal of Clinical P~ch()logy. Sf. 648-657
Anastopoulos, AD. SPIsto, M. A., & Maher, M. C. (1994) The WISC-III freedom from dIstractibility factllf" It, utIlIty in IdentifYIng children with attention defIcIt hyperactIvity dis·lrder. Psychological Assessment. O. 368-37l.
Arbuckle, J l. (1997). AMOS users' guide: Version 3.6. ChICago' Small Waters Corpllration.
Bentler, P. M. (1992) On the fit of models to covariances and methndol(lgy to the Bulletin. Psychological Bulletin. ] f2. 400-404.
Bentler. P. M. (200m Rites, wrongs, and gold in model testing. Structural Equation Modeling. 7. 82-91.
Bentler. P. M , & Chou. C. (1987) Practical issues in structural modeling SOCIological Methods & Research, 16, 78-117.
Bentler, P. M .. & Wu. E. J. C. (1995) EQS for Macintosh u~er:~ gill de. Encino, CA: Multivanate Software, Inc.
Benson. 1. ( 1998) DeveloplOg a strong program of construct valldatiolI' A test anxiety example. EducatIOnal MeaSllrement. I.sues and Practice. ]7. 10-22.
Blumherg. T A. (1995). A practItioner's view of the WISCIII. Journal of S hoof P,ychu/og}; 33. 95-97.
Byrne, B M. (1994\. Structural equation modeling with EQS and EQS/H'tndmrs BaSI.' concepts. applications, and programmmg. Thou~and Oaks, CA. Sage.
Canivez. G L & Watkln" M. W (1998). Long-tenn stabIlIty of the We.:hsler IntellIgence Scale for ChildrenTlurd Edition. Psvch%gical.\ssessment, 10.285-291.
Carroll, J. B (1995). On methodology m the study of cognilive abllItic& Multivariate Behavioral Research. 30. 429-452
Cattell, R. B (1966) The scree test for the numberoffactors. Multlvarulfe Behal'wral Research. 1. 245-276.
Comrey. A. L .. & Lee. H. B (1992). Afirst course infactor anaI.nis (2nd ed.). HIllsdale, NJ: Lawrence Erlbaum.
Conger, A J. Conger. J C. Farrell, A. D., & Ward, D. (1979). What can the WISC-R measure? Applied PsyChO/UgICIlI Measurement. 3. 421-436.
Council of NatIOnal P~ychoJogiL:al AssociatIOns for the Advancement of Ethnic Minority Interests. (2000). GUldt'fllle.\ for resI·arch In ethnic minority communities. Waslullgton. DC: Amencan Psychological Assocwtwn.
Crowley, S. L.. & Fan, X. (1997). Structural equation modeling' Bask concepts and apphcations in person-
85

86
School Psychology Review, 2001, Volume 30, No.1
ality assessment research. Journal of Personality Assessment, 68. 508-531.
Dean, R S. (1980). Factor structure of the WISC-R with Anglos and Mexican-Americans. Journal of School Psychology, 18, 234-239.
Floyd, F. J., & Widaman, K. F. (1995). Factor analysis in the development and refinement of clinical assessment instruments. Psychological Assessment. 7. 286-299.
Frisby, C. L. (1999). Straight talk about cognitive assessment and diversity. School Psychology Quarterly. 14. 195-207.
Gerbing, D. w., & Hamilton, J. G. (1996). Viability of exploratory factor analysis as a precursor to confirmatory factor analysis. Structural Equation Modeling. 3, 62-72.
Glutting, J. 1., Youngstrom, E. A., Ward, T., Ward. S .• & Hale, R. L. (1997). Incremental efficacy of WISC-III factor scores in predicting achievement: What do they tell us? Journal of Psychological Assessment. 9. 295-301.
Gorsuch, R L. (1983). Factor analysis (2nded.). Hillsdale, NJ: Erlbaum.
Greenberg, R D., Stewart, K. J., & Hansche, W. 1. (1986). Factor analysis of the WISC-R for White and Black children evaluated for gifted placement. Journal of Psychoeducational Assessment, 4, 123-130.
Grice, 1. w., Krohn, E. J., & Logerquist, S. (1999). Crossvalidation of the WISC-III factor structure in two samples of children with learning disabilities. Journal of Psychoeducational Assessment, 17, 236-248.
Gutkin, T. B., & Reynolds, C. R, (1981). Factorial similarity of the WISC-R for White and Black cluldren from the standardization sample. Journal of Educational Psychology. 73.227-231.
Helms, 1. E. (1992). Why is there no study of cultural equivalence in standardized cognitive ability testmg? American Psychologist. 47. 1083-110 1.
HeIms, J. E. (1997). The triple quandary ofrace, culture, and social class in standardized cognitive abihty testing. In D. P. Flanagan. 1. L. Genshaft. & P. L. Hamson (Eds.), Contemporary intellectual assessment: Theories. tests and issues (pp. 517-532). New York: Guilford.
Hom, J. L. (1965). A rationale and test for the number of factors in factor analysis. Psychometrcka. 30. 179-185.
Hu, L., & Bentler, P. M. (1995). Evaluating model fit. In R H. Hoyle (Ed.). Structural equation modelmg: Concepts. issues, and applications (pp. 76-99). Thousand Oaks, CA: Sage.
Hu, L., & Bentler, P. M. (1998). Fit indices in covariance structure modeling: Sensitivity to underparameterized model misspecification. Psycholugical Methods, 3, 424-453.
Hu, L., & Bentler, P. M. (1999). Cutoff criteria for fit indexes in covariance structure analysis: Conventional criteria versus new alternatives. Structurul Equation Modeling. 6, I-55.
Hutton, 1. B., Dubes, R., & Muir, S. (1992) Assessment practices of school psychologists: Ten years later. School Psychology Review. 21, 271-284.
Juliano.J. M., Haddad, F. A., & Carroll, J. L. (1988). Threeyear stabIlity of WISC-R factor score~ for bldck and
white, female and male children classified as learning disabled. Journal of School Psychology. 26. 317-325.
Kamphaus, R. W. (1993). Clmical assessment of children's intelligence. Needham Heights, MA: Allyn & Bacon.
Kamphaus, R. w.. Benson, 1., Hutchinson, S., & Platt, L. O. (1994). Identification of factor models for the WISC-III. Educational and Psychological Measurement. 54, 174-186.
Kaufman, A. S. (1975). Factor analysis of the WISC-R at eleven age levels between 6 and 16 years. Journal of Clinical and Consulting Psychology, 43, 135-147.
Kaufman, A. S .. & DoppeJt, J. (1976). Analysis ofWISC-R standardization data in terms of stratification variables. Child Development. 47. 165-171.
Kaufman, A. S., & Hollenback, G. P. (1974). Comparative structure of the WPPSI for blacks and whites. Journal of Clinical Psychology. 30. 1316-1319.
Keith, T. Z. (1999). Effects of general and specific abilities on student achievement: Similarities and differences across ethnic groups. School Psychology Quarterly, 14. 239-262.
Keith, T. Z., & Witta, E. L. (1997). Hierarchical and crossage confirmatory factor analysis of the WISC-Ill: What does it measure? School Psychology Quarterly, 12, 89-107.
Konold, T. R, Glutting, 1. J., McDermott, P. A., Kush, I. c., & Watkins, M. W. (1999). Structure and diagnostic benefits of a normative subtest taxonomy developed from the WISC-lII standardIzatIon sample. Journal of School Psychology. 37. 29-48.
Konold, T. R, Kush, 1. C., & Canivez, O. L. (1997). Factor rep\Jcation of the WISC-Ill in three independent samples of children receiVIng special education. Journal of Psychoeducational Assessment, 15, 123-137.
Kush, J. C. (1996). Factor structure of the WISC-III for students With learning disabilities. Journal of Psychoeducational Assessment, 14. 32-40.
Kush, J. C, & Watkins, M. W. (1997). Construct validity of the WISC -III verbal and performance factors for black special education students. Assessment. 4, 297-304.
Lautenschlager, O. J. (1989). A comparison of alternatives to conductIng Monte Carlo analyses for determining parallel ;lllaly~is criteria. Multivariate Behavioral Research. 24, 365-395.
Lindsey, J. (1967). The factional organization of intelligence in children as related to the variables of age, sex, and subculture. Dissertation Abstracts International. 27. 3664A-3665A.
Loehhn. 1. C. (1992) Latent variable models: An introductuJn to factor, path. and structural analysis (2nd ed.). Hillsdale, NJ: Erlbaum.
Logerquist-Hansen, S., & Barona, A (1994, August). Factor structure of the Wechsler Intelligence Scale for Chtidren-lIl for Hispanic and non-HispaniC white children with learnmg disabilities. Paper presented at the meeting of the American Psychological Association, Lo, Angeles, CA.
Lopez, R (1997) The practical impact of current research and Issues in intellIgence test interpretatlOn and use for mulueultural populatIOns School Psychology Review. 26. 249-254.

Lutey, c., & Copeland, E. P. (1982) Cogmtive a~sessment of the school-aged child. In C. R. Reynolds & T. B. Gutkin (Eds.), The handbook of school psychology (pp. 12J-: 55). New York: John Wiley.
MacCallum, R. C., Browne, M. w., & Sugawara, H. M. (1996). Power analysis and determination of sample size for covariance structure modeling. Psychological Methods, ], 130-149.
MacCallum, R. C., Wegener. D. T., Uchino, B. N., & Fabngar, L. R. (1993). The problem 01 equivalent models in applications of covanance structure analysis. Psychl)logical Bulletin, 114, Ix5-IY9
MacCallum, R c., Wldaman, K. F.. Zhang. S., & Hong, S, (1999). Sample size in factor analysl'. Psychological Methods, 4, 84-99.
Macmann, G M., & Barnett, D W. (]992) Redefming the WISC-R: Implications for pr"fes,lOlIal practice and public policy. lournal ofSl'e( wi tdllcatlOn, 26, 139-161.
Macmann, G. M., & Barnett. D W. (]9941. Structural analysis of correlated factors. Le,~ons hom the Verbal-Performance dichotomy of th,' Wechsler Scales. School Psychology Quarterly, 9, lol-IY7
McGrew, K. S. (1997). Analysis of the major mtelligence batteries accordmg to a proposed compre hensive GfGc frame\,ork. In D. P. Flanagan. J. L. (Jenshaft. & P. L. Hamson (Eds.), Colltempormy lntel/t'( tual assessment: Theories, tests and issue.\ (pp. 151-179). New York: Guilford.
McGrew, K. S .. Keith, T. Z., F'lanagan, D. P .. & Vanderwo:ld, M (1997) Beyond R The Impact ofGfGc speclfic cognitive abilitie, research on the future use and Interpretation of Intelligence teq~ in schools. School PS:lch%gy Review. 26. 18<i-2W.
Messick, S. (1989). Validity. In R. L. Linn lEd.), EducatIOnal memurement (3rd ed.). New York: Amencan Council OIL Education & Macrmllan Puhh,hing.
Ogbu, J. U. (1994). Culture and l\Itdhgcn\:e. In R. J Sternberg (Ed.), Encyclopedia of human Intelligence (vol 2, pp 328-338). New York i\lacllllllan.
Ravert, C. M. (1999). Meta-anal),si,1 otIaClor analvses of the Wechsler Intelligence Scalt jll( Clllidren-Tlllrd Edition among exceptional ~tlId,nts Unpubli,hed master's ttesis, The Pennsylvama State l!llIversity.
Reise, S. P., Widaman, K. F, & Pugh. R. H (1993) Conftrrnatory fictor analysl~ and Item re'pon,c theory: Two approache, for exploring mea,url'ment Invanance. Psychologxal Bulletin, 1l4, 552-5h6.
Reschly, D. (1978). WISC-R factor structure among Anglos, Elacks, Chicanos. and native Amencan Papagos. 1 ?umal of Consulting and Cllllical Psychology, 46, 417-422.
Reynolds, C. R., & Ford, L. (l994) Compdratlve threefactor solutions of the WISe-Ill and WISC-R at II age levels between 6-1/2 and 16- J 12 year, . .4rchlvewf Clinical N,'uropsychology. 9, 553-:;70.
Reynolds, C. It, & Gutkin, T. B. (1980). Stahility of the WISC-R fictor structure across ,ex at t\.lt> age leveh. loumal ofClmical Psych%g,; 3(). 775 777.
Reynolds, C F .. , & Kaufman. A. S (1940) A "essment of children's intelligence with the Welh,kr Intelligence Scale for Children-Revl,ed (WISC-R) In C. R
WISC-1I1 Construct Validity
Reynold~ & R. W. Kamphaus (Eds.), Handhook of psychological and educotumal assessment of children: Illtflllgerlce il/ld achIevement (pp. 127-165). New York: Guilford.
RiccIO. C. A . Cohen. M J . Hall. J., & Ross, C. M (1997). The third and fourth factor, of the WISC-IIl: What they don't measure Journal of Psvchoeducational Assessml'nt. 15,27-:'9.
Rigdon. E. E (IY96) CFA VeT<;U, RMSEA: A comparison of two til mdexes for structural equallon modeilng. Stntl'tllral EqllaTlIIl1 Modelmg. 3, 369-379.
Rogers. M. R. (19%). Psychot'ducational assessment of culturally and ImgUl,ncally ,livef';e children and youth. In H B Vance (Ed.). Psvc/7r%glcal assessment of children: Be,'{ practice., .for ~(}1()()1 and clinical settmgs (2nd cd. pp 355-3i\4) Nev. York' Wiley.
Roid. (, A" I'nfltera. A . & WeI's. L G. (1993). ReplicatIOn of the WISe-Ill facto! structure in an mdependent sample. Journal of P'\choeducatllmal Assessmenf. 11.0-21.
Roid, G. H, & Wonall, W (I (97) Rephcation of the Wechsler Intelligence Seal<: for Chlidren-Third EditIOn four-factor model In the Canadian normative sample Pl'Vchologlcai Asse, Impnt. 9.512-515.
Sattler. J. M (1974) Asses.lmem ojchtldren 's Intelligence. PhiladdphJa. Saunder,.
Sattkr, J. M (1992\ A,'sl'ssment ofchddren: WISC-IlI and WPPSI-R supplement. San Diego, CA: Jerome Saltier.
Scardapane,1. R (1996) Farror structure of the WISCII/Fir IIIda.lllfled. learnIl1R-dimhled. and high-IQ group.l. l.'npllhlishcd doctcral dissertation, Hofstra Univer,ny. NeW York.
Slate, J R .. & .Jones. C H (\995). Preliminary evidence of the validay of the WlSC-lIl for African American student, llllllergolllg special education evaluation. Educational und PlY, hologlcal Measurement, 55, 1039-1046.
Tabachnick. B G .. & Flddl. L S. (19R3) USing multivanllte .1{(it/.ltT( s New Yorl-- Harper & Row.
Tabachnick. B. G .. &. Fidei\, L S. (1996). USing multivarwte StotWICS ("lrd ed.). ]\ew York: HarperColllns.
Taylor, R. L . & Ziegler. E. W . (19iP) C(lmpanson of the fir:,[ prinCipal factor on th,' WISC-R across ethnic groups Educat/()//al and P,I'Fhologicai Measurement, 47,691-694.
Taylm, R. L, Ziegler. E W. &. Parlenio, 1. (1984). An investigation nl WISC-R Vnhal-Performance differences a~ it functloll of cthmc ,tatus. Psychology m the Sch"o!.'. 21,4'7-441
Thompson, B . & D.lniel. L. G (l996). Factor analytic eVidence lor the c(}n,truct validity o[.,cores. A hIstorical overview Jild 'mme gUidelines Educational and Psycl/()I()~I( III Mell~!jrel1le1lT 56 197-208.
Thorndike. R L. (l(N2. Apn\) fntt'lhRence tests: What Ii e h(ll'l' Illld 11 hat \,'e .1/lOul<l hal'e. Paper pre<;ented at the meeting oftht r\aHonal A,sociation of School Psychologl,h. Na,ll\ ilIe. TN.
Valencia, R. R .. Rankin. R. 1.. & Oakland, T. (1997). WISC-R tactor structure~ among White. Mexican Amencan, and Atncan AmCllcan children: A research note. P.lVch%l!Y III tlte Schools, 34. 11-10.
87

88
School Psychology Review, 2001, Volume 30, No.1
Velicer, W E, & Fava, 1. L. (1998) Effects of variable and subject sampling on factor pattem recovery. Psychological Methods, 3, 231-251.
Ward, S. B., Ward, T. J., Hatt, C. V, Young, D. L., & Mollner, N. R. (1995). The mCldence and utility of the ACID, ACIDS, and SCAD proflles In a referred population. Psvchology in the Schools, 32, 267-276.
Watktns. M W, & Kush, 1. C. (2000). Confirmatoryfactor analysis olthe WISC-III for students wah learl1lng disahilities. Manuscript submllted for pubhcation.
Watkins, M. W, Kush, J. c.. & Gluttmg, J. J. (1997). Prevalence and diagnostIc ulllJly of the WISC-III SCAD profile among children wtth dIsabilities. Schoo! Psychology Quarterly, 12, 235-248
Wechsler, D. (1939) Measurement of adult intelligence. Baltlmore: Williams & Wllhams.
Wechsler, D. (1974). Wechsler Intelligence Scale for Children-Revlsed San Antomo, TX: The Psychological CorporatJon.
Wechsler, D. (1991). Wechsler Intelligence Scale for Children-Third edition: Manual. San Antonio, TX: Psychological Corporation.
Witt, J. C .. & Gresham, F. M. (1985). [Review of Wechsler Intelligence Scale for Children-Revised]. In J. V. Mitchell. Jr. (Ed.), The ninth mental measurements yearhook (Vol. 2, pp. 1716-1719). Lmcoln, NE: Buros InstItute of Mental Measurements.
Wood, 1. M., Tataryn. D. J.. & Gorsuch, R. L. (1996). Effects of under- and overextraction on principal axis factor analysis with vanmax rotation. Psychological Methods, 1.254-265.
Woodcock. R. W (1990). Theoretical foundations of the WJ-R measures of cognitlve ability. Journal of PSYi hoeducatlOnal Assessment, R. 231-258.
Wngley, C. c.. & Neuhaus. J. O. (1955). The matching of two sets of factors. American Psychologist, 10, 418-419.
Joseph C. Kush, Ph.D. is an ASSOCiate Professor and Coordmator of the School Psychology Program at Duquesne University. His research interests include cognitive and intellectual theory and as~essment.
Marley W. Watkins is Professor-in-Charge of Graduate Programs in School Psychology at The Pennsylvama State Umversity and a Diplomate of the American Board of Professional Psychology. He is a graduate of the University of Nebraska-Lincoln school psychology program and was a practicing school psychologist for j 5 years before entering academe.
Thomas J. Ward, Ph D. is Associate Dean of the School of Education and Associate Professor in the School P,ychology and Counselor Education area at The College of WIlliam and Mary. His research interests include ability assessment. school violence, and at-risk programs.
Sandra B. Ward, PhD. is Associate Professor in the School Psychology and Counselor Education area at The College of WIlliam and Mary. Her research mterests include ability assessment, consultation, and supervision.
Gary L. Canivez, Ph D. is Associate Professor of Psychology at Eastern Illinois University principally involved m the School Psychology program. His research interests include assessment of intelligence, achievement, and psychopathology; and investigation of racial/ethic group bias in psychological and educational testing.
Frank C. Worrell is an Associate Professor in the School Psychology program at The Pennsylvania State University. His research mterests include academic talent development, dropout prevention, and African-Amencan educational issues.