container industry outlook - container owners association · container industry outlook the ‘new...
TRANSCRIPT

Container Industry Outlook
The ‘New Normal’ for
Container Owners
Rotterdam - November 14th 2016
Mark Bennett

Not much good news• Shipping line record losses
• The largest bankruptcy in shipping history - Hanjin
• Leasing companies – losses despite high utilization
• Container production contracting
• Global political uncertainty
• Weak global growth
• Weak container cargo growth

Overcapacity• Vessel capacity – much higher than cargo volumes
• Vessel capacity increase in 2016 slower but still exceeds cargo growth
• Freight rates have fallen to uneconomic levels
• Hanjin: 3% of global capacity disappeared – but only temporary
• Freight rates improve due to Hanjin failure in some trades
• Vessel scrapping with modest cargo growth may absorb current surplus capacity in 3 to 4 years - if no further major vessel orders
• Shipyards desperate for orders - low prices & government finance
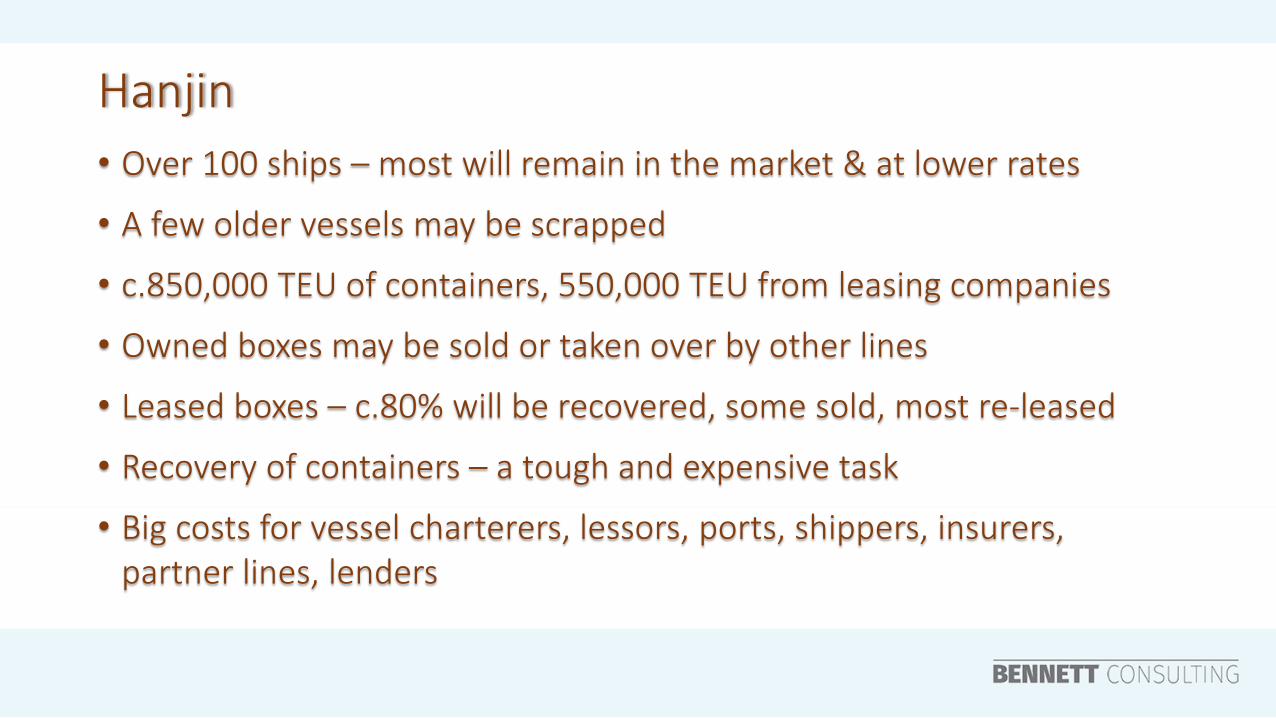
Hanjin
• Over 100 ships – most will remain in the market & at lower rates
• A few older vessels may be scrapped
• c.850,000 TEU of containers, 550,000 TEU from leasing companies
• Owned boxes may be sold or taken over by other lines
• Leased boxes – c.80% will be recovered, some sold, most re-leased
• Recovery of containers – a tough and expensive task
• Big costs for vessel charterers, lessors, ports, shippers, insurers, partner lines, lenders

Shanghai – Los Angeles Freight Rates
500
1000
1500
2000
2500
3000
2012 2013 2014 2015 2016
Profitablility range
Source: World Container Index

Atlantic Trade – freight rates
0
500
1000
1500
2000
2500
3000
RTM-NYC NYC-RTM
Source: World Container Index

Global Freight Rates
500
700
900
1,100
1,300
1,500
1,700
1,900
2,100
2,300
2,500
Source Bloomberg
Profitablility range

Freight Rates
• Supply side: Surplus vessel capacity
• Demand side: Low cargo growth
• Increased scrapping
• Restraint on ordering new vessels
• Profitability will improve with supply/demand imbalance correction
• Mergers & consolidation may improve efficiency but not freight rates
• Bankruptcies don’t get rid of surplus vessel capacity

Exports from China
• China’s exports peaked in 2014
• Exports declined 7.7% in the first 10 months of 2016
• Migration of manufacturing to China - finished several years ago
• ‘Near-sourcing’ & protectionism may further impact cargo growth
• Strong export growth from China was the norm for more than 20 years
• The New Normal: low growth & contraction of China export cargo

China Exports per month US$ Bn
50
100
150
200
250
Source: Tradingeconomics.com

Drivers of Demand for Containers
• Cargo growth
• Retirements
• Trade imbalances
• Seasonal factors
• Container price
• Factory Space
• Shipping Line & Leasing company utilisation
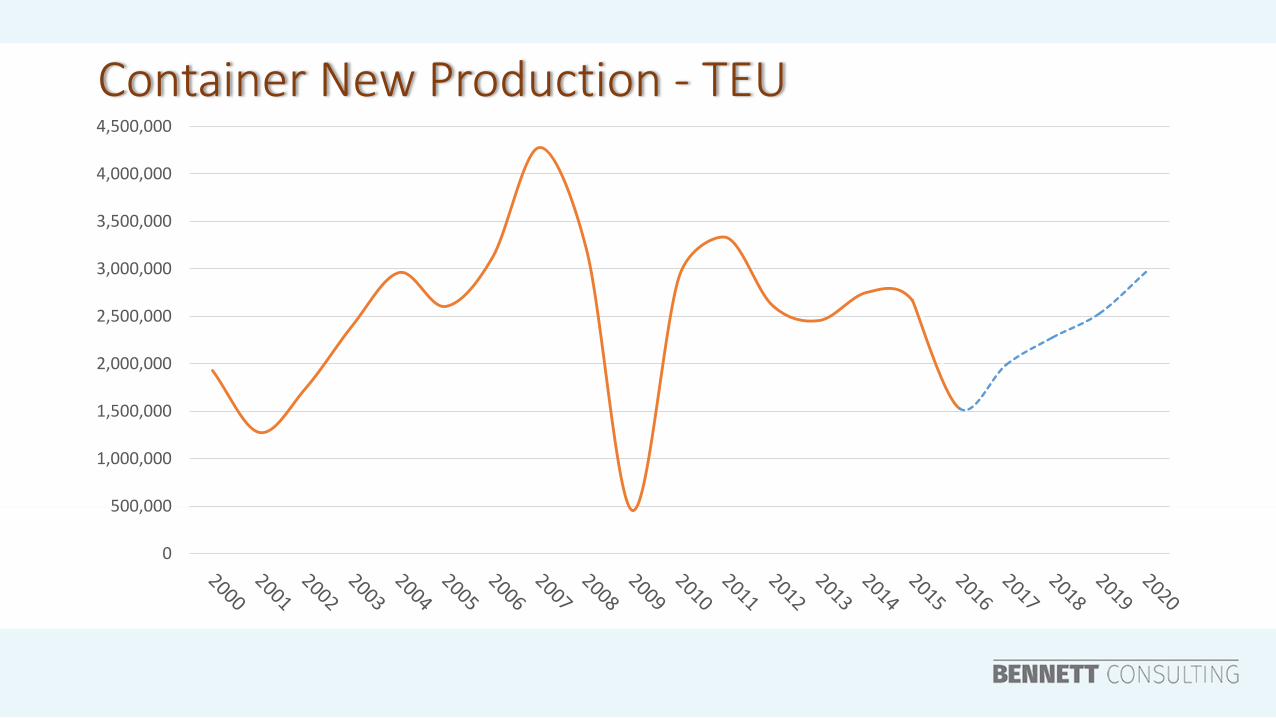
Container New Production - TEU
0
500,000
1,000,000
1,500,000
2,000,000
2,500,000
3,000,000
3,500,000
4,000,000
4,500,000

Container Production Outlook
• Very low trade growth or even contraction
• New production demand will come more from replacing retirements
• Increase in retirement volumes from 2018
• More retirements = downward pressure on re-sale prices
• Factories: nominal production capacity of c.5+ million TEU
• Productivity impacted by weak labor retention & waterborne paint
• 2016: less than 1.5M TEU of dry vans manufactured

Price Drivers for New Containers
• Cost of iron ore, metallic coal and steel
• Demand for containers and factory space availability
• Transition to waterborne paint with productivity impact and investment hurdle
• Iron ore and steel prices rising from a cyclical low in good part due to futures market speculation

Iron Ore and Steel Price $/ton
0
20
40
60
80
100
120
140
160
180
200
200
300
400
500
600
700
800
900
steel iron ore
20’ price
$2400
20’ price
$2650
20’ price
$2300
20’ price
$2100
20’ price
$1950
20’ price
$1250

Conclusions
• Low cargo growth is the ‘New Normal’
• Profitability of lines, lessors & container factories will remain under pressure
• Credit risk remains for some shipping lines
• Container prices: unlikely to return to the high levels of 5 years ago
• Container production volumes: tempered by lack of growth
• Consolidation in the industry likely to continue - but will not improve low freight rates, rental rates or container prices