copyright oxford university press 2009 chapter 11 depreciation
TRANSCRIPT
Copyright Oxford University Press 2009
Chapter 11Depreciation
Copyright Oxford University Press 2009
• Basic Aspects of Depreciation• Historical Depreciation Methods• Modified Accelerated Cost Recovery
System (MACRS)• Depreciation and Asset Disposal• Unit-of-Production Depreciation• Depletion• Spreadsheets and Depreciation
Chapter Outline

Copyright Oxford University Press 2009
• Understand the concepts of depreciation, deterioration, and obsolescence
• Use historical and MACRS to calculate annual depreciation charge and book value over the asset’s life
• Account for capital gains/losses, ordinary losses, and depreciation recapture due to the disposal of a depreciated asset
• Use unit-of-production and depletion depreciation methods in economic analysis
• Use spreadsheets to calculate depreciation
Learning Objectives
Copyright Oxford University Press 2009
• Decline in market value of an asset due to deterioration or obsolescence
• Decline in value of an asset to its owner• Systematic allocation of an asset’s cost over its
useful or depreciable life (accountant’s definition)
Basic Aspects of Depreciation
Copyright Oxford University Press 2009
Expenses:• Part of regular business operations• “Consumed” over short period of time• Sometimes recurring• Do not lose value gradually over time• Subtracted from business revenues as they
occur• Reduce income taxes as they can be written off
when they occur• Examples: labor, utilities, materials, insurance,…
Depreciation and Expenses

Copyright Oxford University Press 2009
Depreciation:• Business costs due to capital assets are not fully
written off when they occur• Capital assets lose value gradually over time • Capital cost must be written off or depreciated
over its depreciable life or recovery period• Reduce the taxable income, and thus reduce
income taxes as they were written off• It is a non-cash cost• Examples: building, plants, machines,…
Depreciation and Expenses
Copyright Oxford University Press 2009
A property is depreciable If:• The property must be used for business purposes
to produce income.• The property must have a useful life that can be
determined, and the useful life must be longer than one year.
• The property must be an asset that decays, gets used up, wears out, becomes obsolete, or loses value to the owner from natural causes.
Only the owner of property may claim depreciation expenses
Basic Requirements for Depreciation

Copyright Oxford University Press 2009
Tangible property: can be seen, touched, and felt.• Real property: land, buildings, and things growing on,
built upon, constructed on, or attached to the land• Personal property: equipment, furnishings, vehicles,
office machinery, and anything that is tangible excluding real property
Intangible property: has value but cannot be directly seen or touched, examples include patents, copyrights, and trademarks, trade names, and franchises.
Types of Property
Copyright Oxford University Press 2009
• Almost all tangible property can be depreciated except land, factory inventory, containers considered as inventory, and leased property.
• Tangible property used in both business and personal activities can be depreciated, but only in proportion to the use for business purposes.
• Intangible property can generally be depreciated.
Property and Depreciation
Copyright Oxford University Press 2009
Depreciation Calculation Fundamentals
t to 1j
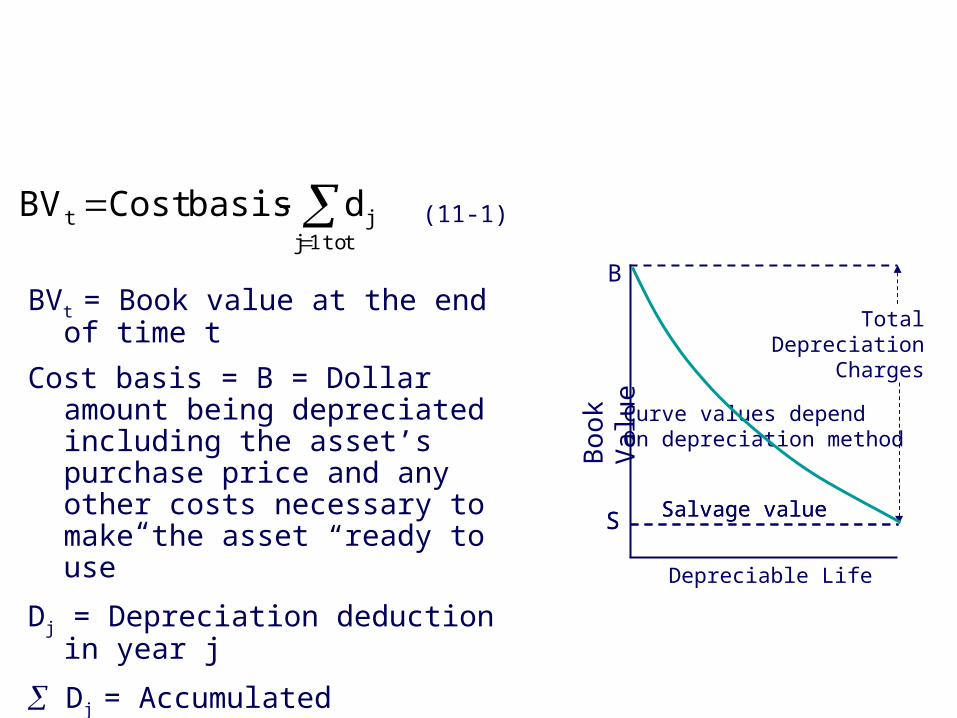
jt d-basis CostBV (11-1)
BVt = Book value at the end of time t
Cost basis = B = Dollar amount being depreciated including the asset’s purchase price and any other costs necessary to make the asset “ready to use”
Dj = Depreciation deduction in year j
Dj = Accumulated depreciation charges from time 1 to j
Bo
ok V
alu
e
B
Depreciable Life
Curve values dependOn depreciation method
TotalDepreciation
Charges
S Salvage valueS Salvage value
Copyright Oxford University Press 2009
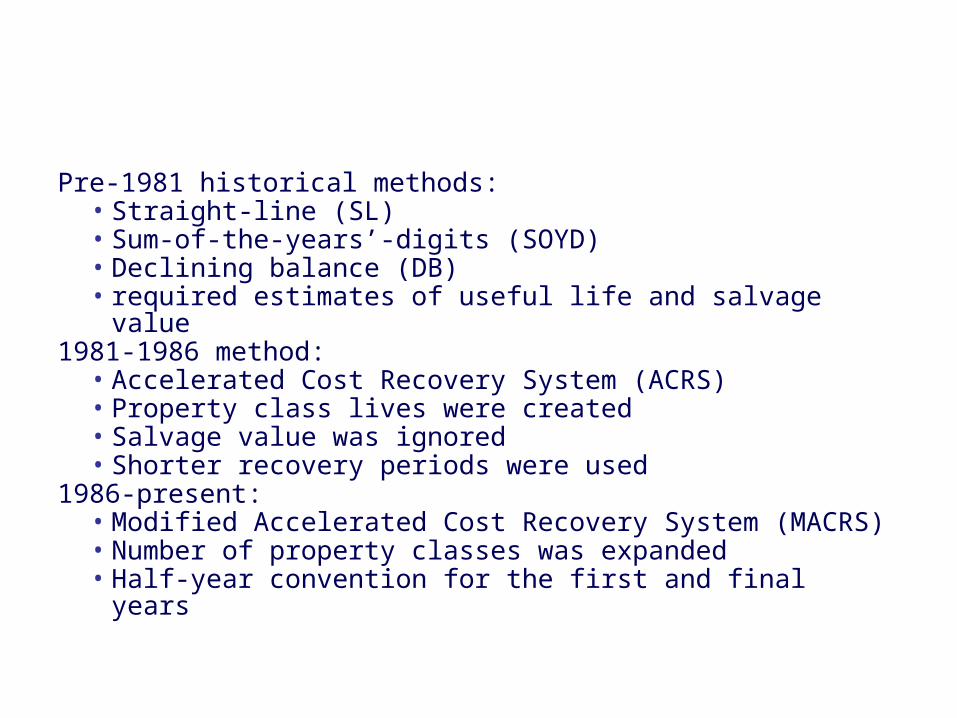
Pre-1981 historical methods:• Straight-line (SL)• Sum-of-the-years’-digits (SOYD)• Declining balance (DB)• required estimates of useful life and salvage value
1981-1986 method: • Accelerated Cost Recovery System (ACRS)• Property class lives were created• Salvage value was ignored• Shorter recovery periods were used
1986-present: • Modified Accelerated Cost Recovery System (MACRS)• Number of property classes was expanded • Half-year convention for the first and final years
Depreciation Methods
Copyright Oxford University Press 2009
Historical Depreciation Methods
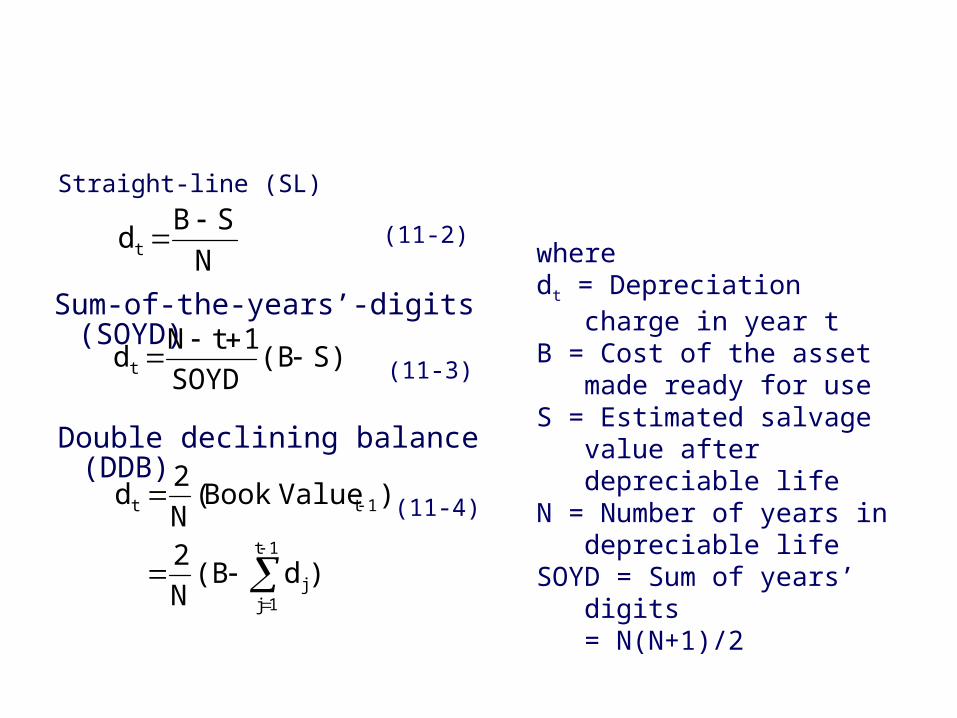
Straight-line (SL)
N
SBdt
Sum-of-the-years’-digits (SOYD)
Double declining balance (DDB)
(11-2)
S)(BSOYD
1tNdt
(11-3)
)d(BN
2
)ValueBook(N
2d
1t
1jj
1tt
(11-4)
wheredt = Depreciation charge in
year tB = Cost of the asset made
ready for useS = Estimated salvage value
after depreciable lifeN = Number of years in
depreciable lifeSOYD = Sum of years’ digits
= N(N+1)/2
Copyright Oxford University Press 2009
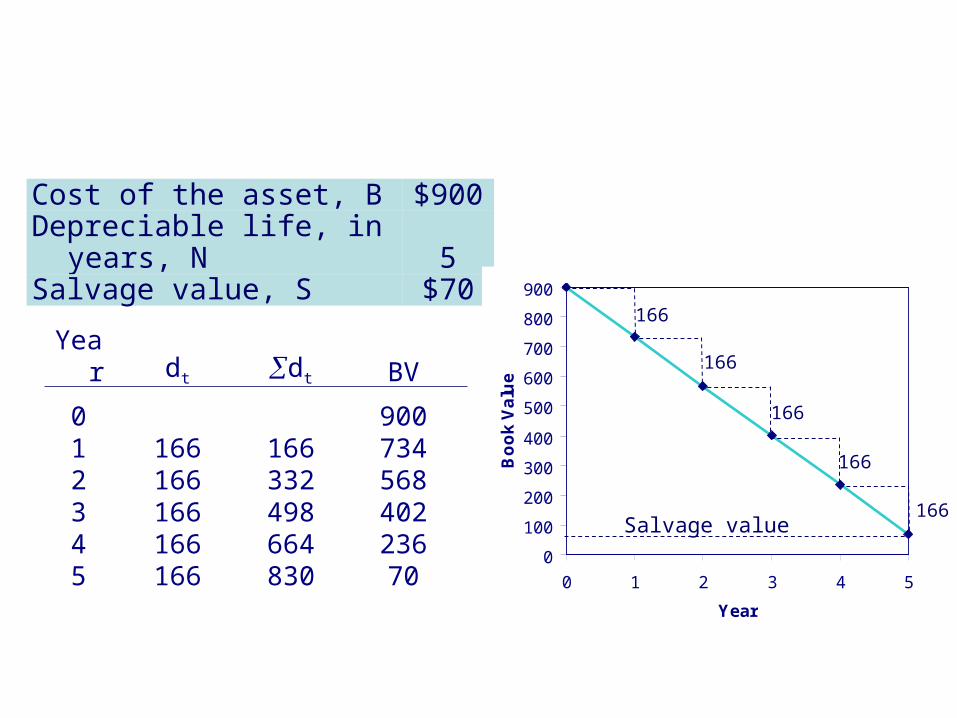
Example 11-2 SL Depreciation
Cost of the asset, B $900Depreciable life, in years, N 5Salvage value, S $70
0
100
200
300
400
500
600
700
800
900
0 1 2 3 4 5
Year
Bo
ok
Va
lue
166
166
166
166
166Salvage value
Year dt dt BV
0 9001 166 166 7342 166 332 5683 166 498 4024 166 664 2365 166 830 70

Copyright Oxford University Press 2009
Example 11-3 SOYD Depreciation
Cost of the asset, B $900Depreciable life, in years, N 5Salvage value, S $70
Year dt dt BV
0 $900.001 $276.67 $276.67 623.332 221.33 498.00 402.003 166.00 664.00 236.004 110.67 774.67 125.335 55.33 830.00 70.00
0.00
100.00
200.00
300.00
400.00
500.00
600.00
700.00
800.00
900.00
0 1 2 3 4 5
Year
Bo
ok
Va
lue
277
221
166
111
55Salvage value

Copyright Oxford University Press 2009
Example 11-4 DDB Depreciation
Cost of the asset, B $900Depreciable life, in years, N 5Salvage value, S $70
Year dt dt BV
0 900.001 360.00 360.00 540.002 216.00 576.00 324.003 129.60 705.60 194.404 77.76 783.36 116.645 46.66 830.02 69.98 0.00
100.00
200.00
300.00
400.00
500.00
600.00
700.00
800.00
900.00
0 1 2 3 4 5
Year
Bo
ok
Va
lue
360
216
130
7847Salvage value
Copyright Oxford University Press 2009
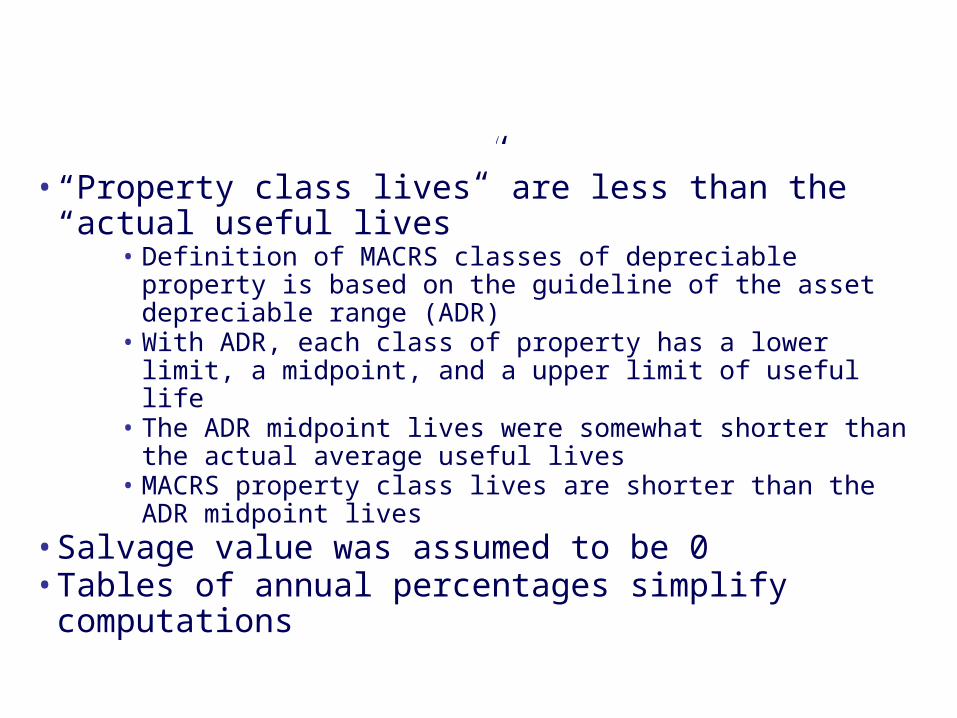
• “Property class lives” are less than the “actual useful lives”
• Definition of MACRS classes of depreciable property is based on the guideline of the asset depreciable range (ADR)
• With ADR, each class of property has a lower limit, a midpoint, and a upper limit of useful life
• The ADR midpoint lives were somewhat shorter than the actual average useful lives
• MACRS property class lives are shorter than the ADR midpoint lives
• Salvage value was assumed to be 0• Tables of annual percentages simplify computations
Advantages of Modified Accelerated Cost Recovery System

Copyright Oxford University Press 2009
• General Depreciation System (GDS)• Based on declining balance with switch to straight-line
depreciation• Alternative Depreciation System (ADS)
• ADS provides a longer recovery period and uses straight-line depreciation
• ADS must be used for • Tangible property used primarily outside the United States• Property that is tax exempt or financed by tax-exempt bonds• Farming property placed in service when uniform capitalization
rules are not applied• ADS may be elected for an asset, it is not possible to
switch back to the GDS.
Modified Accelerated Cost Recovery System (MACRS)
Copyright Oxford University Press 2009
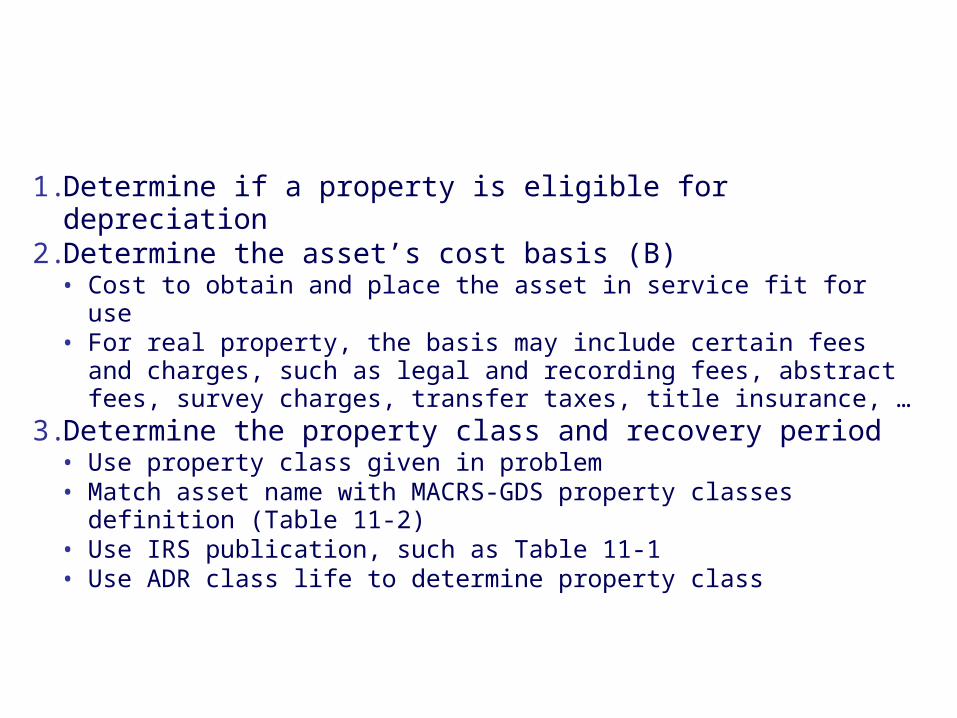
1. Determine if a property is eligible for depreciation2. Determine the asset’s cost basis (B)
• Cost to obtain and place the asset in service fit for use• For real property, the basis may include certain fees and
charges, such as legal and recording fees, abstract fees, survey charges, transfer taxes, title insurance, …
3. Determine the property class and recovery period• Use property class given in problem• Match asset name with MACRS-GDS property classes
definition (Table 11-2)• Use IRS publication, such as Table 11-1• Use ADR class life to determine property class
Procedures in Applying MACRS-GDS Depreciation
Copyright Oxford University Press 2009
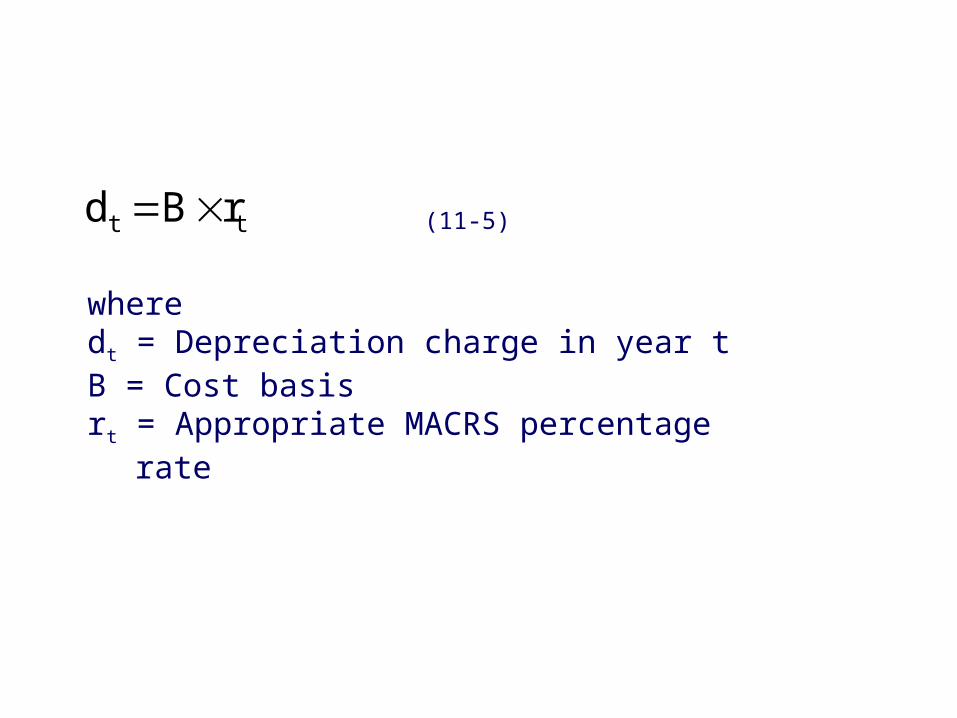
Applying MACRS-GDS Depreciation
tt rBd (11-5)
wheredt = Depreciation charge in year tB = Cost basisrt = Appropriate MACRS percentage rate

Copyright Oxford University Press 2009
Table 11-1 Example Class Lives and MACRS Property Classes
IRS Asset Class
Asset DescriptionClass Life
(years)ADR
MACRS Property Class (years)
GDS ADS
00.11 Office furniture, fixtures, and equipment 10 7 1000.12 Information Systems: computer/peripheral 6 5 600.22 Automobiles, taxis 3 5 500.241 Light general-purpose trucks 4 5 500.25 Railroad cars and locomotives 15 7 1500.40 Industrial steam and electric distribution 22 15 2201.11 Cotton gin assets 12 7 1201.21 Cattle, breeding or dairy 7 5 713.00 Offshore drilling assets 7.5 5 7.513.30 Petroleum refining assets 16 10 1615.00 Construction assets 6 5 6

Copyright Oxford University Press 2009
Table 11-1 Example Class Lives and MACRS Property Classes
IRS Asset Class
Asset DescriptionClass Life
(years)ADR
MACRS Property Class (years)
GDS ADS
21.10 Manufacture of grain and grain mill products 17 10 1722.2 Manufacture of yarn, thread, and woven fabric 11 7 1124.10 Cutting of timber 6 5 632.20 Manufacture of cement 20 15 2037.11 Manufacture of motor vehicles 12 7 1248.11 Telephone Communications assets and buildings 24 15 2448.2 Radio and television broadcasting equipment 6 5 649.12 Electric utility nuclear production plant 20 15 2049.13 Electric utility steam production plant 28 20 2849.23 Natural gas production plant 14 7 1450.00 Municipal wastewater treatment plant 24 15 2480.00 Theme and amusement park assets 12.5 7 12.5
Copyright Oxford University Press 2009
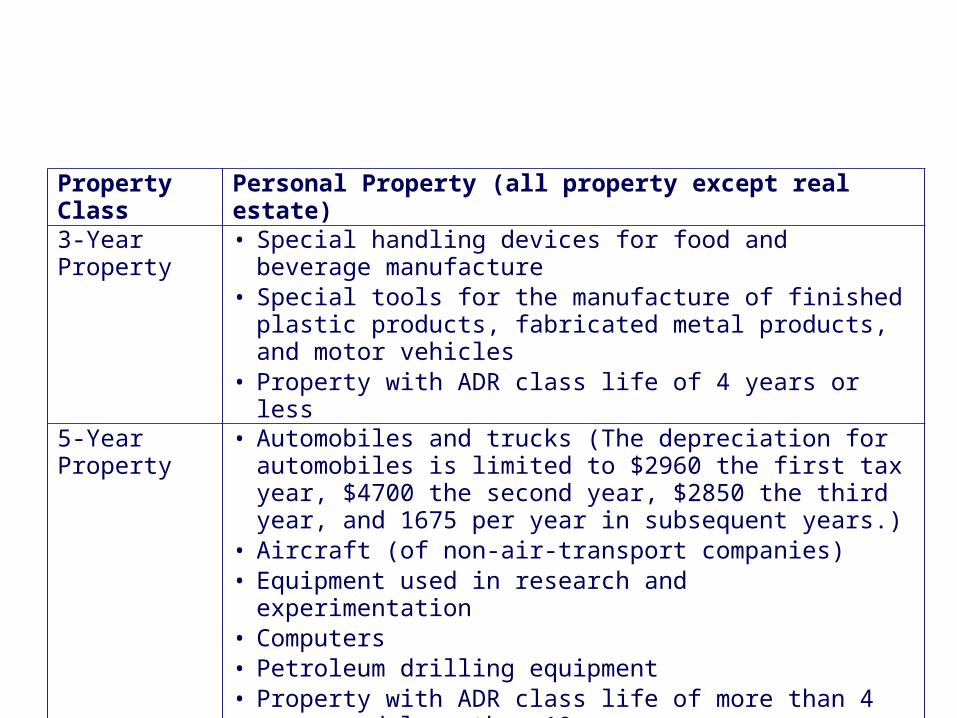
Table 11-2 MACRS GDS Property Classes
Property Class Personal Property (all property except real estate)3-Year Property • Special handling devices for food and beverage manufacture
• Special tools for the manufacture of finished plastic products, fabricated metal products, and motor vehicles
• Property with ADR class life of 4 years or less5-Year Property • Automobiles and trucks (The depreciation for automobiles is limited to
$2960 the first tax year, $4700 the second year, $2850 the third year, and 1675 per year in subsequent years.)
• Aircraft (of non-air-transport companies)• Equipment used in research and experimentation• Computers• Petroleum drilling equipment• Property with ADR class life of more than 4 years and less than 10 years
7-Year Property • All other property not assigned to another class• Office furniture, fixtures, and equipment• Property with ADR class life of 10 years or more and less than 16 years

Copyright Oxford University Press 2009
Table 11-2 MACRS GDS Property Classes
Property Class Personal Property (all property except real estate)10-Year Property • Assets used in petroleum refining and certain food products
• Vessels and water transportation equipment • Property with ADR class life of 16 years or more and less than 20 years
15-Year Property • Telephone distribution plants • Municipal sewage treatment plants • Property with ADR class life of 20 years or more and less than 25 years
20-Year Property • Municipal sewers • Property with ADR class life of 25 years or more
Property Class Real Property (real estate)27.5 Year Residential rental property (does not include hotels and motels)
39 Years Nonresidential real property
Copyright Oxford University Press 2009
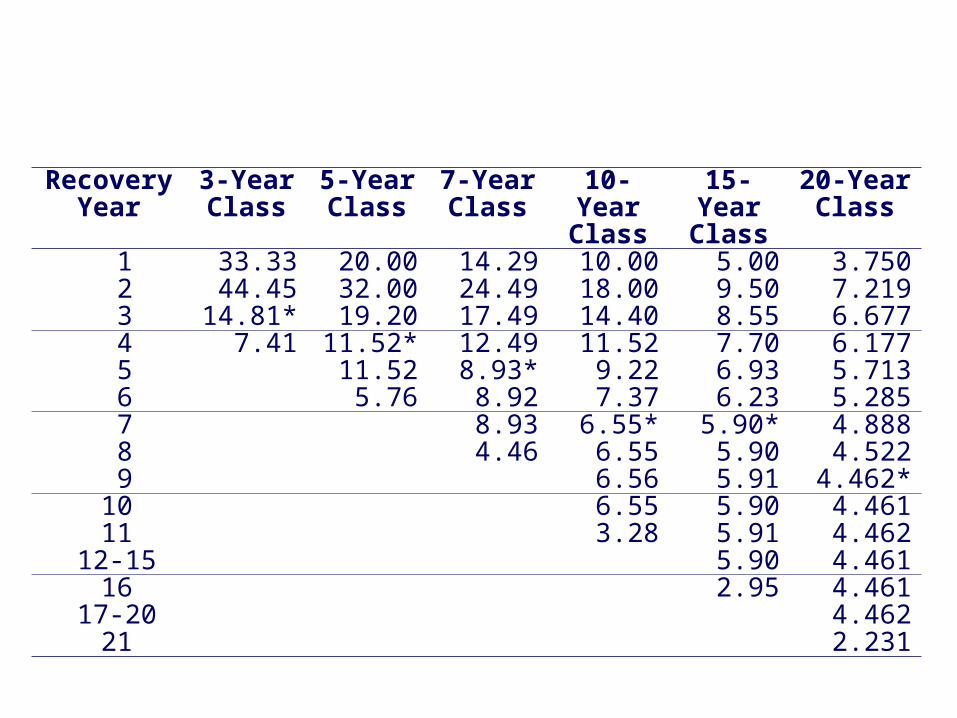
Table 11-3 MACRS GDS Percentage Rate
Recovery Year
3-YearClass
5-YearClass
7-YearClass
10-Year Class
15-Year Class
20-Year Class
1 33.33 20.00 14.29 10.00 5.00 3.750 2 44.45 32.00 24.49 18.00 9.50 7.219 3 14.81* 19.20 17.49 14.40 8.55 6.677 4 7.41 11.52* 12.49 11.52 7.70 6.177 5 11.52 8.93* 9.22 6.93 5.713 6 5.76 8.92 7.37 6.23 5.285 7 8.93 6.55* 5.90* 4.888 8 4.46 6.55 5.90 4.522 9 6.56 5.91 4.462* 10 6.55 5.90 4.461 11 3.28 5.91 4.462
12-15 5.90 4.461 16 2.95 4.461
17-20 4.462 21 2.231
Copyright Oxford University Press 2009
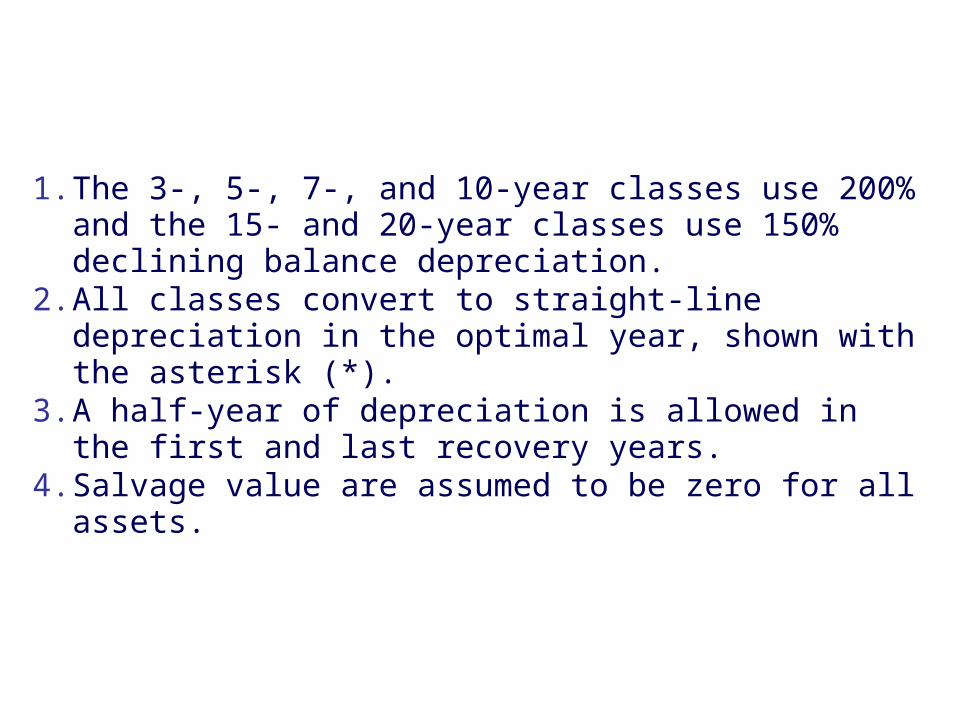
1. The 3-, 5-, 7-, and 10-year classes use 200% and the 15- and 20-year classes use 150% declining balance depreciation.
2. All classes convert to straight-line depreciation in the optimal year, shown with the asterisk (*).
3. A half-year of depreciation is allowed in the first and last recovery years.
4. Salvage value are assumed to be zero for all assets.
Calculation of MACRS GDS Percentages
Copyright Oxford University Press 2009
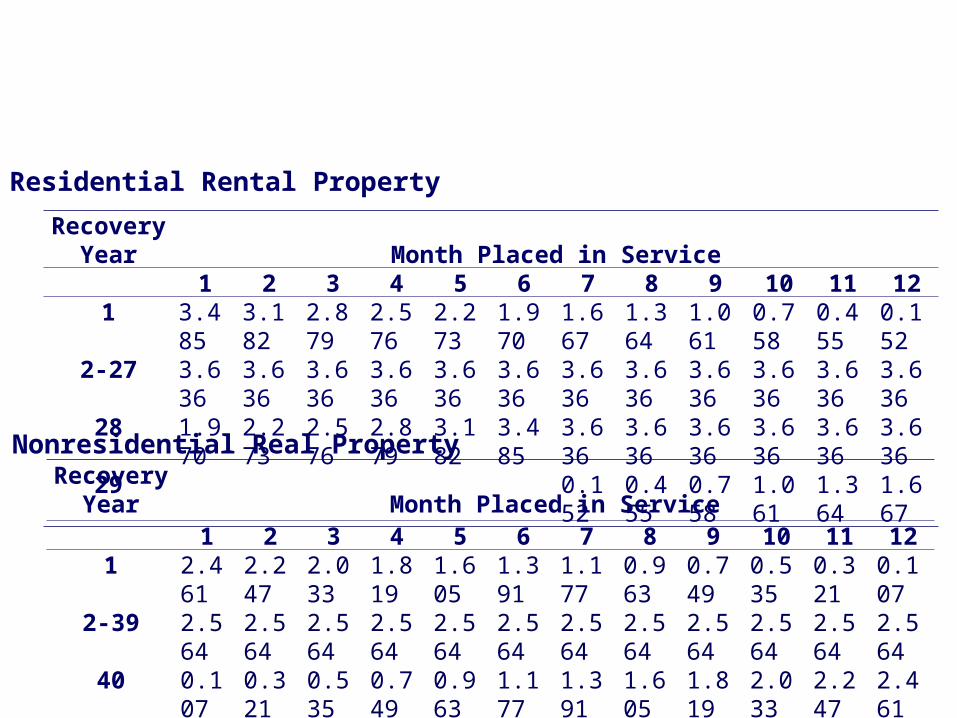
Table 11-4 MACRS GDS Percentage Rate
Residential Rental Property
RecoveryYear Month Placed in Service
1 2 3 4 5 6 7 8 9 10 11 121 3.485 3.182 2.879 2.576 2.273 1.970 1.667 1.364 1.061 0.758 0.455 0.152
2-27 3.636 3.636 3.636 3.636 3.636 3.636 3.636 3.636 3.636 3.636 3.636 3.63628 1.970 2.273 2.576 2.879 3.182 3.485 3.636 3.636 3.636 3.636 3.636 3.63629 0.152 0.455 0.758 1.061 1.364 1.667
RecoveryYear Month Placed in Service
1 2 3 4 5 6 7 8 9 10 11 121 2.461 2.247 2.033 1.819 1.605 1.391 1.177 0.963 0.749 0.535 0.321 0.107
2-39 2.564 2.564 2.564 2.564 2.564 2.564 2.564 2.564 2.564 2.564 2.564 2.56440 0.107 0.321 0.535 0.749 0.963 1.177 1.391 1.605 1.819 2.033 2.247 2.461
Nonresidential Real Property
Copyright Oxford University Press 2009
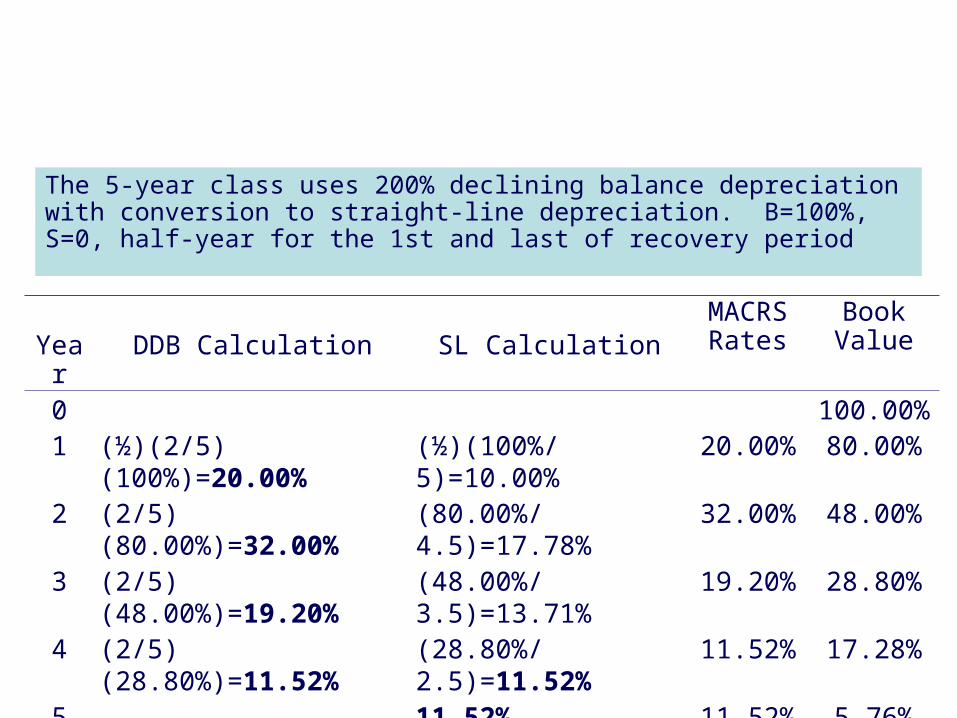
Example 11-5 Calculation of MACRS GDS Percentages
The 5-year class uses 200% declining balance depreciation with conversion to straight-line depreciation. B=100%, S=0, half-year for the 1st and last of recovery period
Year DDB Calculation SL CalculationMACRS Rates
Book Value
0 100.00%1 (½)(2/5)
(100%)=20.00%(½)(100%/5)=10.00%
20.00% 80.00%
2 (2/5)(80.00%)=32.00%
(80.00%/4.5)=17.78%
32.00% 48.00%
3 (2/5)(48.00%)=19.20%
(48.00%/3.5)=13.71%
19.20% 28.80%
4 (2/5)(28.80%)=11.52%
(28.80%/2.5)=11.52%
11.52% 17.28%
5 11.52% 11.52% 5.76%6 (½)11.52%=5.76% 5.76% 0.00%
Copyright Oxford University Press 2009
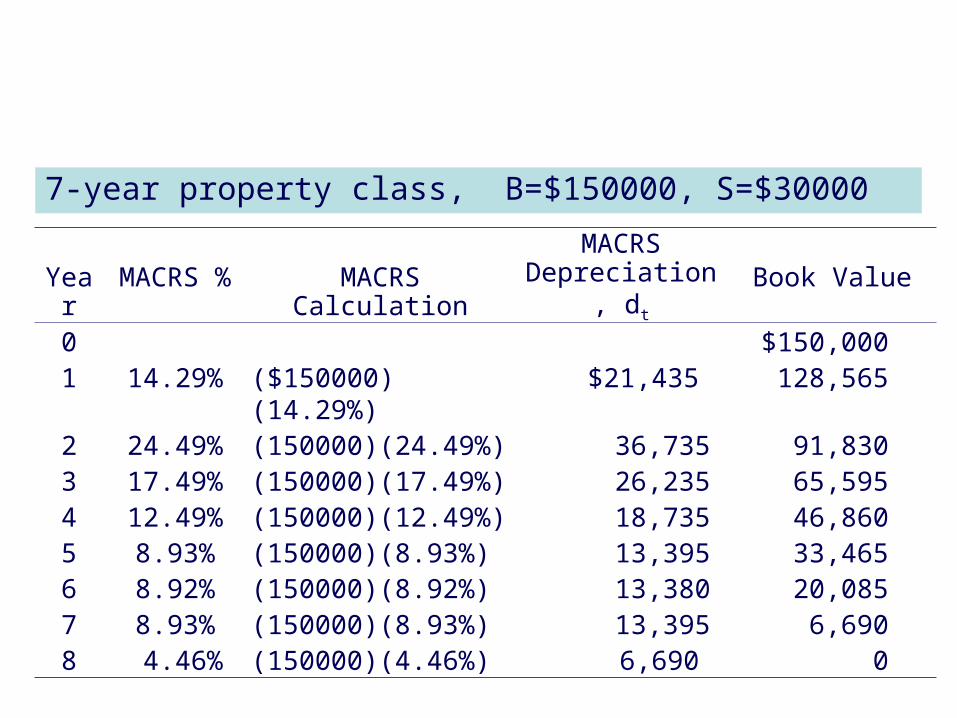
Example 11-6 Calculation of MACRS GDS Depreciation
7-year property class, B=$150000, S=$30000
Year MACRS % MACRS CalculationMACRS
Depreciation, dt Book Value0 $150,0001 14.29% ($150000)(14.29%) $21,435 128,5652 24.49% (150000)(24.49%) 36,735 91,8303 17.49% (150000)(17.49%) 26,235 65,5954 12.49% (150000)(12.49%) 18,735 46,8605 8.93% (150000)(8.93%) 13,395 33,4656 8.92% (150000)(8.92%) 13,380 20,0857 8.93% (150000)(8.93%) 13,395 6,6908 4.46% (150000)(4.46%) 6,690 0
Copyright Oxford University Press 2009
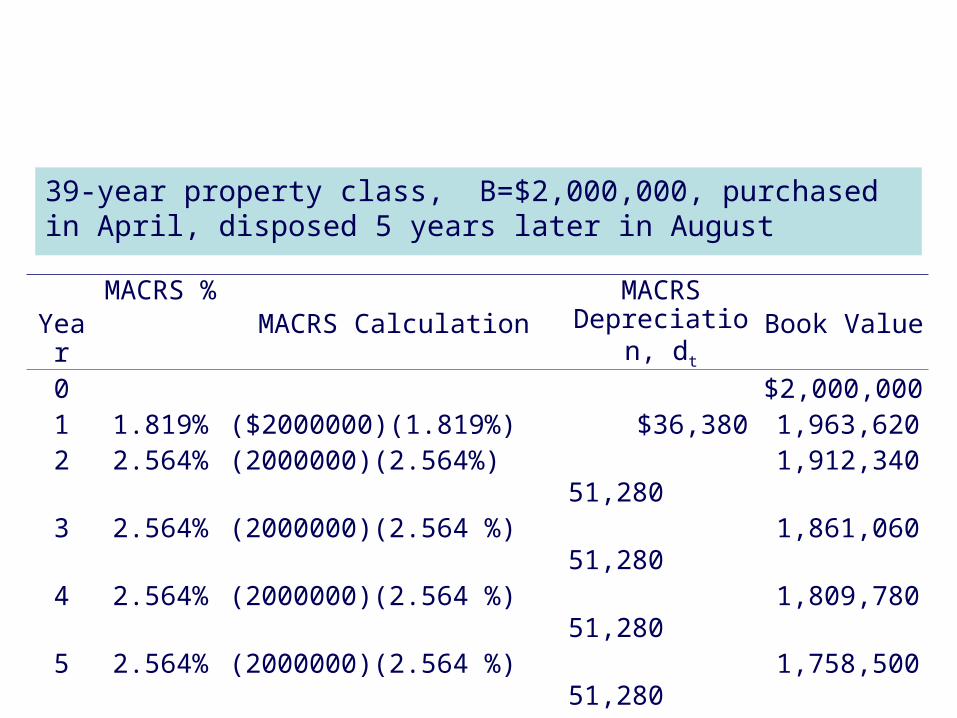
Example 11-7 Calculation of MACRS GDS Depreciation
39-year property class, B=$2,000,000, purchased in April, disposed 5 years later in August
YearMACRS
% MACRS CalculationMACRS
Depreciation, dt Book Value0 $2,000,0001 1.819% ($2000000)(1.819%) $36,380 1,963,6202 2.564% (2000000)(2.564%) 51,280 1,912,3403 2.564% (2000000)(2.564 %) 51,280 1,861,0604 2.564% (2000000)(2.564 %) 51,280 1,809,7805 2.564% (2000000)(2.564 %) 51,280 1,758,5006 2.564% (7.5/12)(2000000)(2.564 %)
32,1001,726,400
273,600

Copyright Oxford University Press 2009
Example 11-8 Comparison of Depreciation Methods
0
25000
50000
75000
100000
125000
150000
0 1 2 3 4 5 6 7 8 9 10
Year
Bo
ok
Va
lue
MACRS
SL
SOYD
DDB
Copyright Oxford University Press 2009
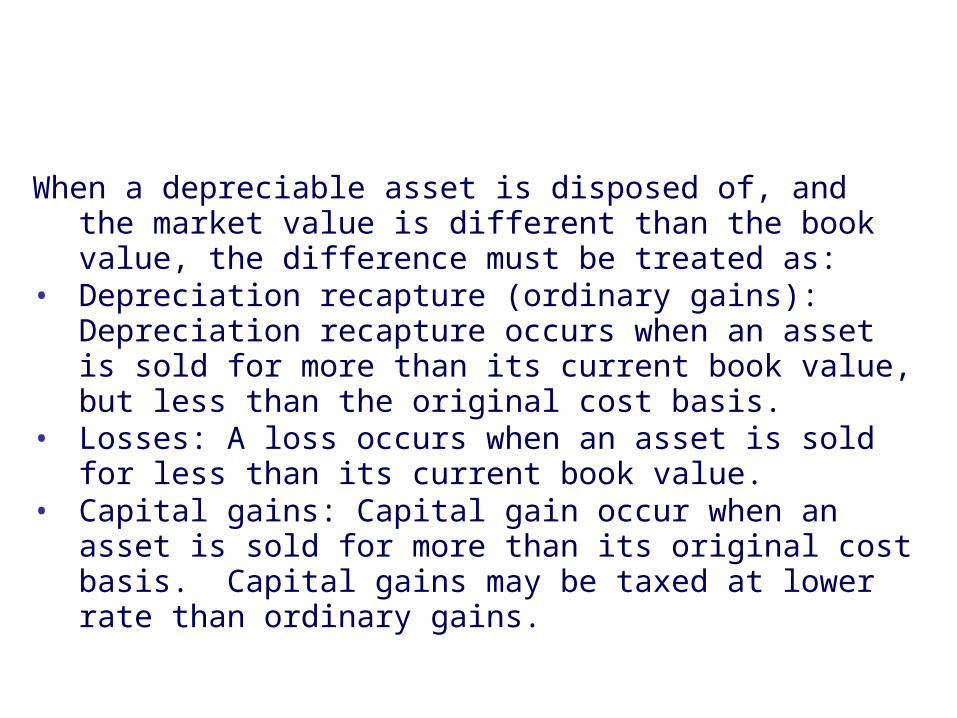
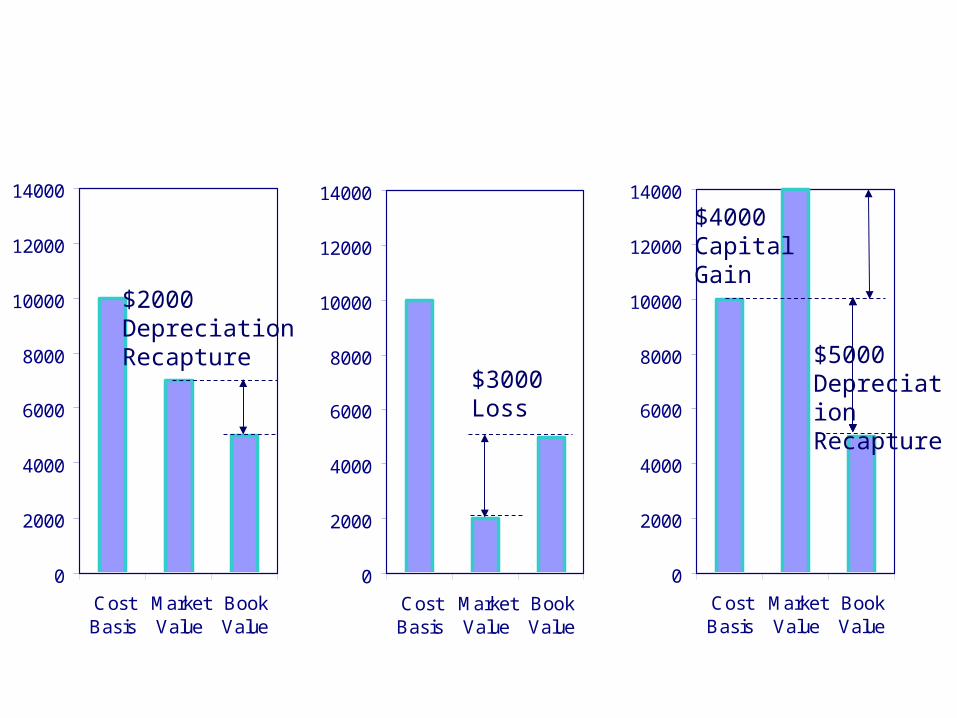
When a depreciable asset is disposed of, and the market value is different than the book value, the difference must be treated as:
• Depreciation recapture (ordinary gains): Depreciation recapture occurs when an asset is sold for more than its current book value, but less than the original cost basis.
• Losses: A loss occurs when an asset is sold for less than its current book value.
• Capital gains: Capital gain occur when an asset is sold for more than its original cost basis. Capital gains may be taxed at lower rate than ordinary gains.
Depreciation and Asset Disposal
Copyright Oxford University Press 2009
Depreciation and Asset Disposal
0
2000
4000
6000
8000
10000
12000
14000
CostBasis
MarketValue
BookValue
0
2000
4000
6000
8000
10000
12000
14000
CostBasis
MarketValue
BookValue
0
2000
4000
6000
8000
10000
12000
14000
CostBasis
MarketValue
BookValue
$2000 DepreciationRecapture
$4000 CapitalGain
$3000 Loss
$5000 DepreciationRecapture
Copyright Oxford University Press 2009
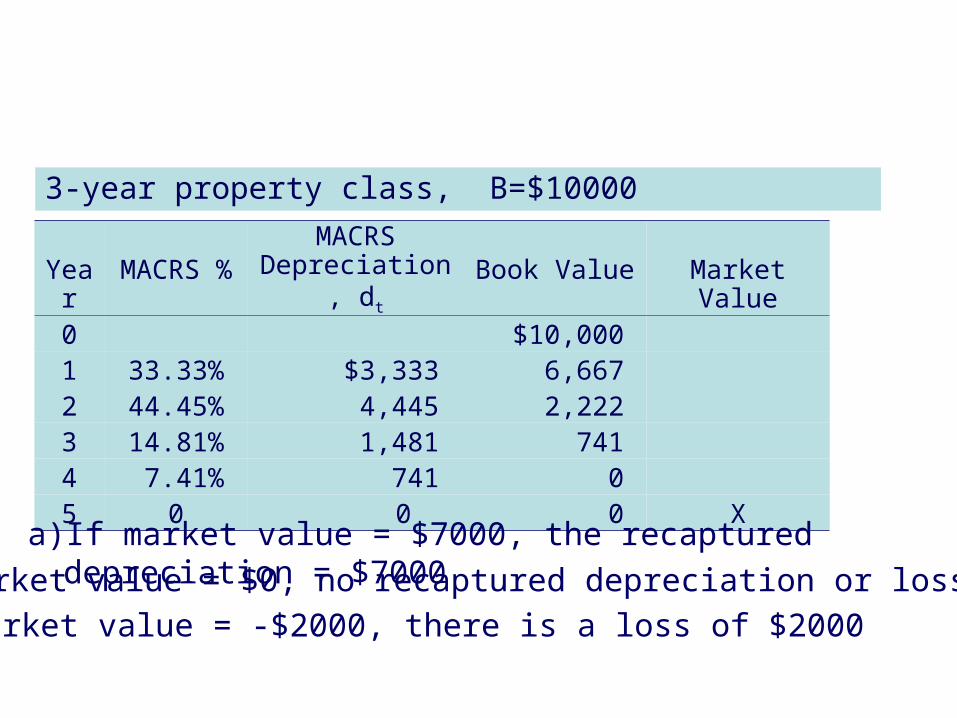
Example 11-9 Depreciation and Asset Disposal
3-year property class, B=$10000
Year MACRS %MACRS
Depreciation, dt Book Value Market Value0 $10,0001 33.33% $3,333 6,6672 44.45% 4,445 2,2223 14.81% 1,481 7414 7.41% 741 05 0 0 0 X
a) If market value = $7000, the recaptured depreciation = $7000
b) If market value = $0, no recaptured depreciation or loss
c) If market value = -$2000, there is a loss of $2000

Copyright Oxford University Press 2009
Example 11-10 Depreciation and Asset Disposal
Year MACRS %MACRS
Depreciation, dt Book Value Market Value0 $10,0001 33.33% $3,333 6,6672 44.45% 4,445 2,2223 14.81% (1/2)1,481=740.5 1,481.5 $2500
1)Year MACRS %
MACRS Depreciation, dt Book Value Market Value
0 $10,0001 33.33% $3,333 6,6672 44.45% (1/2)4,445=2,222.5 4,444.5 $2500
Market Value – Book Value = $2500 – 4444.5 = - 1944.5 (Loss)
2)
Market Value – Book Value = $2500 – 1481.5 = 1018.5 (Recaptured Depreciation)
Copyright Oxford University Press 2009
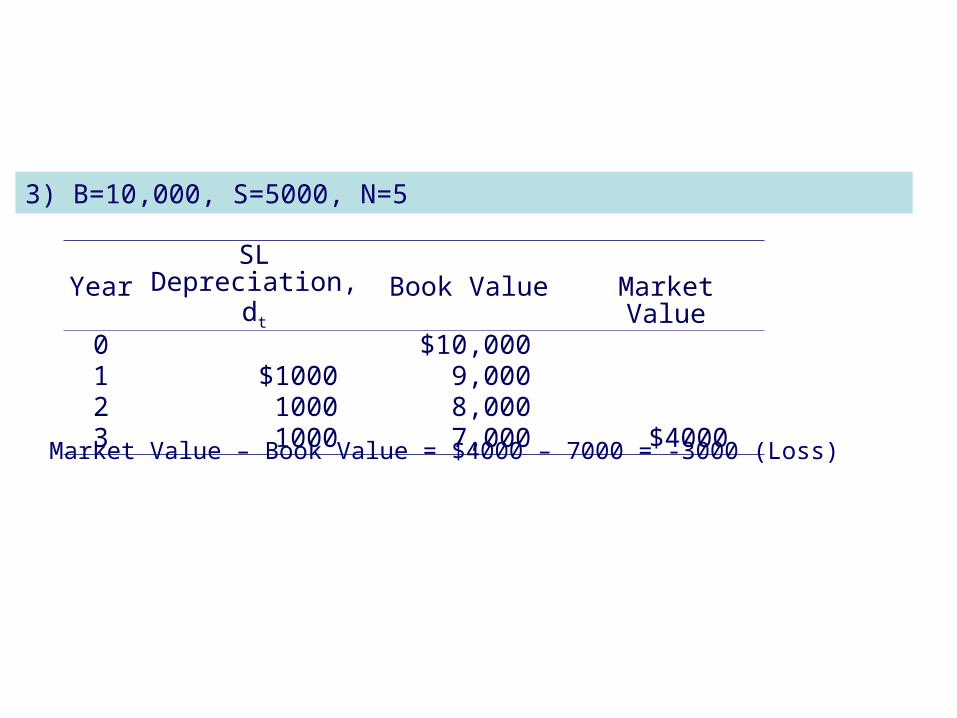
Example 11-10 Depreciation and Asset Disposal
YearSL Depreciation,
dt Book Value Market Value0 $10,0001 $1000 9,0002 1000 8,0003 1000 7,000 $4000
3) B=10,000, S=5000, N=5
Market Value – Book Value = $4000 – 7000 = -3000 (Loss)
Copyright Oxford University Press 2009
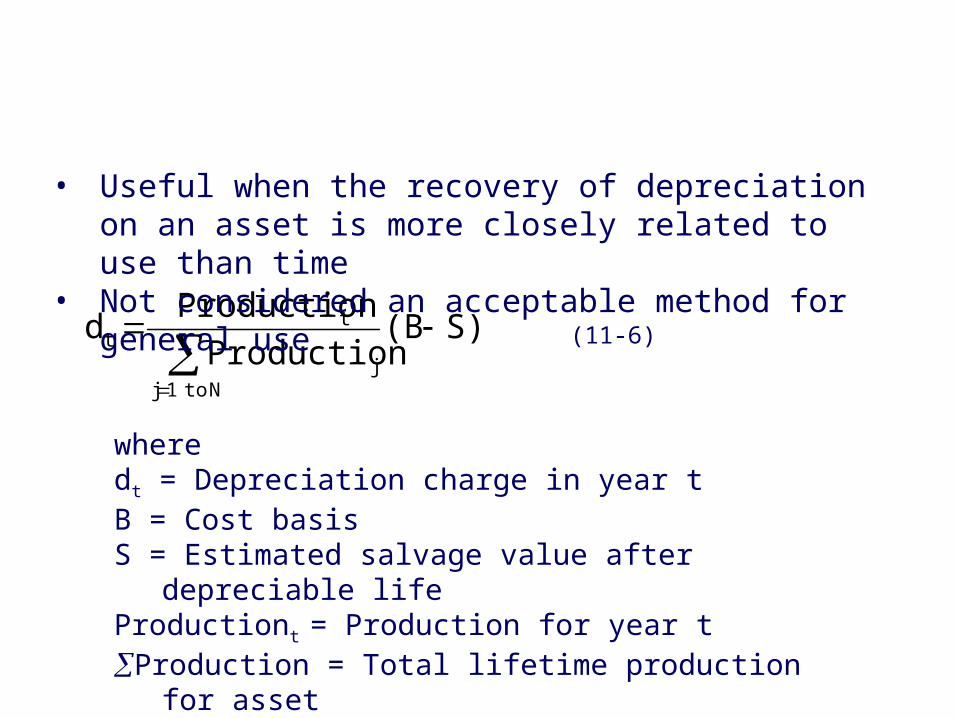
Unit-of-Production Depreciation
S)(BProduction
Productiond
N to 1jj
tt
(11-6)
wheredt = Depreciation charge in year tB = Cost basisS = Estimated salvage value after depreciable lifeProductiont = Production for year tProduction = Total lifetime production for asset
• Useful when the recovery of depreciation on an asset is more closely related to use than time
• Not considered an acceptable method for general use

Copyright Oxford University Press 2009
Example 11-11 Unit-of-Production Depreciation
5-year depreciable life, B=$900, S=$70
YearAnnual
ProductionUOP Depreciation
CalculationUOP
Depreciation, dt
Book Value
0$900
1 4,000 (4,000/40,000)(830) $83817
2 8,000 (8,000/40,000)(830) 166651
3 16,000 (16,000/40,000)(830) 332319
4 8,000 (8,000/40,000)(830) 166153
5 4,000 (4,000/40,000)(830) 8370
40,000

Copyright Oxford University Press 2009
Depletion
• Depletion is the exhaustion of natural resources as a result of their removal.
• Except for standing timber and most oil and gas wells, depletion allowance is the larger of the two methods.
• Cost Depletion:• Similar to the unit-of-production depreciation method• Permissible for standing timber and most oil and gas wells• Cost of land must be excluded from the property cost
• Percentage Depletion:• Depletion allowance is a certain percentage of the property’s
gross income during the year• Cannot exceed 50% of the property’s taxable income
computed without the depletion deduction
Copyright Oxford University Press 2009
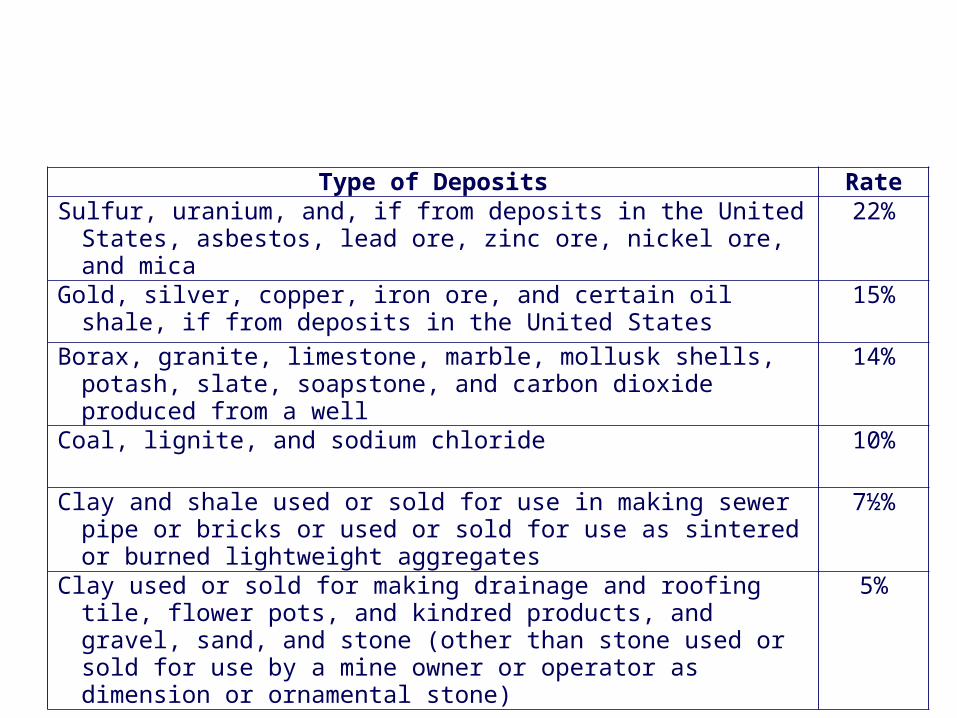
Table 11-6 Percentage Depletion Allowance
Type of Deposits RateSulfur, uranium, and, if from deposits in the United States, asbestos,
lead ore, zinc ore, nickel ore, and mica22%
Gold, silver, copper, iron ore, and certain oil shale, if from deposits in the United States
15%
Borax, granite, limestone, marble, mollusk shells, potash, slate, soapstone, and carbon dioxide produced from a well
14%
Coal, lignite, and sodium chloride 10%
Clay and shale used or sold for use in making sewer pipe or bricks or used or sold for use as sintered or burned lightweight aggregates
7½%
Clay used or sold for making drainage and roofing tile, flower pots, and kindred products, and gravel, sand, and stone (other than stone used or sold for use by a mine owner or operator as dimension or ornamental stone)
5%
Copyright Oxford University Press 2009
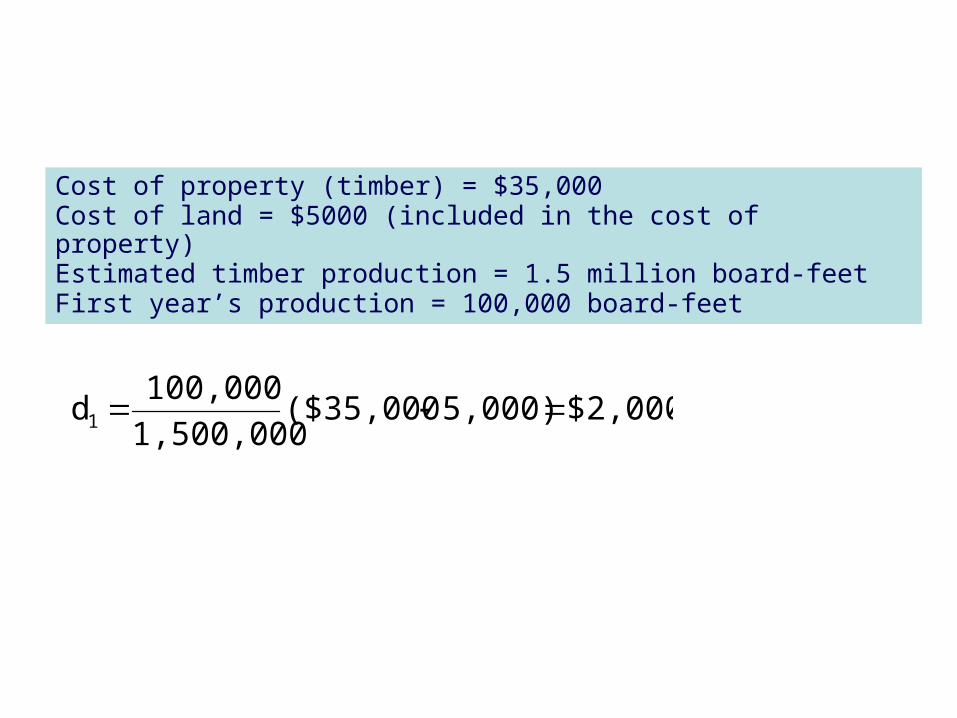
Example 11-12 Cost Depletion
Cost of property (timber) = $35,000Cost of land = $5000 (included in the cost of property)Estimated timber production = 1.5 million board-feetFirst year’s production = 100,000 board-feet
$2,0005,000)($35,0001,500,000
100,000d1
Copyright Oxford University Press 2009
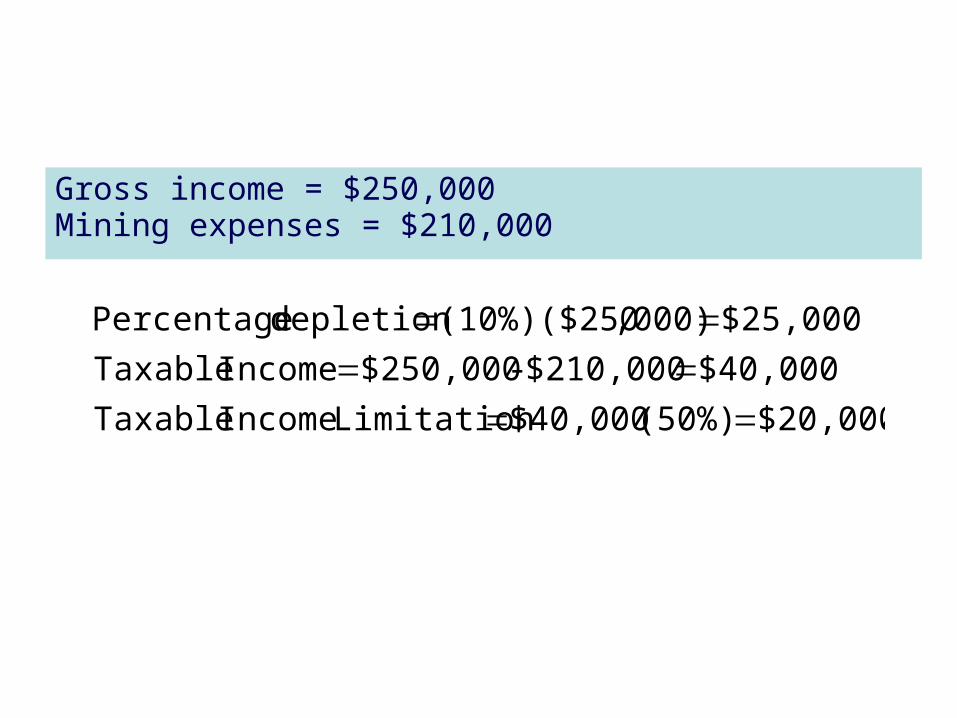
Example 11-13 Percentage Depletion
Gross income = $250,000Mining expenses = $210,000
$20,000(50%) $40,000Limitation Income Taxable
$40,000$210,000 - $250,000Income Taxable
$25,000,000)(10%)($250depletion Percentage
Copyright Oxford University Press 2009
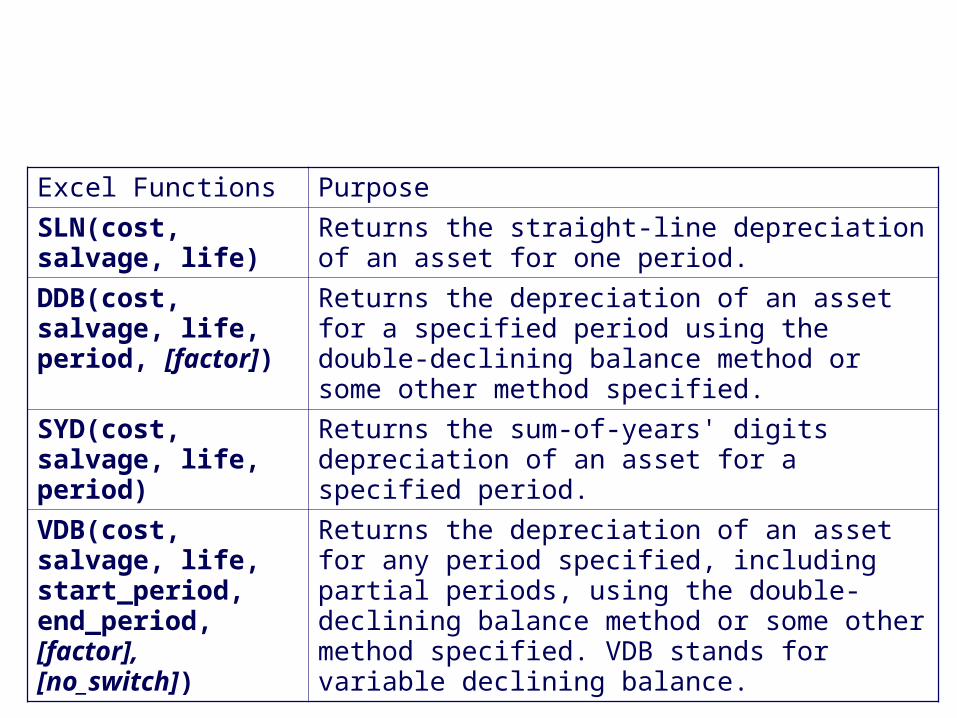
Spreadsheet and Depreciation
Excel Functions Purpose
SLN(cost, salvage, life)
Returns the straight-line depreciation of an asset for one period.
DDB(cost, salvage, life, period, [factor])
Returns the depreciation of an asset for a specified period using the double-declining balance method or some other method specified.
SYD(cost, salvage, life, period)
Returns the sum-of-years' digits depreciation of an asset for a specified period.
VDB(cost, salvage, life, start_period, end_period, [factor], [no_switch])
Returns the depreciation of an asset for any period specified, including partial periods, using the double-declining balance method or some other method specified. VDB stands for variable declining balance.