copyright warning &...
TRANSCRIPT

Copyright Warning & Restrictions
The copyright law of the United States (Title 17, United States Code) governs the making of photocopies or other
reproductions of copyrighted material.
Under certain conditions specified in the law, libraries and archives are authorized to furnish a photocopy or other
reproduction. One of these specified conditions is that the photocopy or reproduction is not to be “used for any
purpose other than private study, scholarship, or research.” If a, user makes a request for, or later uses, a photocopy or reproduction for purposes in excess of “fair use” that user
may be liable for copyright infringement,
This institution reserves the right to refuse to accept a copying order if, in its judgment, fulfillment of the order
would involve violation of copyright law.
Please Note: The author retains the copyright while the New Jersey Institute of Technology reserves the right to
distribute this thesis or dissertation
Printing note: If you do not wish to print this page, then select “Pages from: first page # to: last page #” on the print dialog screen

The Van Houten library has removed some of the personal information and all signatures from the approval page and biographical sketches of theses and dissertations in order to protect the identity of NJIT graduates and faculty.

ABSTRACT
SEISMIC CHARACTERIZATION OF
RECYCLED AGGREGATE CONCRETE
by
Amin Jamali
There are significant environmental benefits of recycling waste concrete and reusing it as
aggregate for structural concrete, but the use of Recycled Aggregate Concrete (RAC) is
yet limited to non-structural applications such as road sub-base. Widespread application
of RAC in areas such as seismic design requires an improved knowledge of RAC
behavior under multiaxial state of stresses.
The main objective of this research is the characterization of seismic properties of
RAC by developing a stress-strain model which can reasonably describe the behavior
under both unconfined and confined conditions. An extensive experimental program,
including testing of several plain RAC cylinders as well as reinforced RAC columns, was
conducted. There are numerous variables influencing the behavior of confined RAC,
creating unlimited experimental possibilities, so the tests parameters were chosen to be
limited to square columns with normal strength RAC and rectilinear tie configurations.
Stress-strain curves were obtained for several 4 inches by 8 inches RAC cylinders
with compressive strength from 2.5 ksi to 7.5 ksi. Based on the experimental results, a
new model for stress-strain behavior of plain RAC was developed. Up to an axial strain
of 0.0025, a nonlinear equation is considered for the ascending branch, which is primarily
a function of compressive strength and elastic modulus, while the descending branch is a
straight line and is a function of compressive strength. A sustaining branch was proposed
where the plain RAC is capable of sustaining 10% of the compressive strength.

44 reinforced RAC columns, 10 inches by 10 inches in section and 32 inches in
height with nine different combination of tie patterns and spacings were tested under
quasi-static (1.6 10-5
per in.) and dynamic (1.6 10-2
per in.) axial straining rates. The
columns with a volumetric ratio of ties of 1.5% more were capable of sustaining the load
than the columns with lower volumetric ratios. Under the fast straining rate, the columns
showed about 27% increase in strength. The columns with sufficient and well-distributed
lateral confinement did not also show any stiffness degradation under cyclic loading.
Special attention was paid to recording the axial strains at which vertical cracks
were developing, as well as the strains at which the cover was no longer effective. These
strains were indicative of the gradual transition of axial stresses from cover to the core.
Based on these strains and contributions of concrete and longitudinal steel in for each
column, a new one-of-a-kind stress-strain model for confined RAC was proposed. The
model is comprised of an ascending-transition-descending structure would be suitable to
define the behavior. The ascending branch proposed for plain RAC is applicable for
confined RAC as well. The transition zone starts at a strain of 0.0020 and ends at a strain
where the cover is completely ineffective. The descending branch is a straight line and
primarily a function of the lateral reinforcement. The variables required to define the
curve were described in terms of the compressive strength of plain RAC, the yield
strength of steel tie and the volumetric ratio of the confinement steel.
The proposed models for plain and confined RAC were examined under the
flexural loading condition using two identical RAC beams. The nonlinear load-
deformation of the beam predicted using the proposed RAC models agreed with the
experimental results to within 10%.

SEISMIC CHARACTERIZATION OF
RECYCLED AGGREGATE CONCRETE
by
Amin Jamali
A Dissertation
Submitted to the Faculty of
New Jersey Institute of Technology
in Partial Fulfillment of the Requirements for the Degree of
Doctor of Philosophy in Civil Engineering
Department of Civil and Environmental Engineering
January 2011

Copyright © 2011 by Amin Jamali
ALL RIGHTS RESERVED
.

APPROVAL PAGE
SEISMIC CHARACTERIZATION OF
RECYCLED AGGREGATE CONCRETE
Amin Jamali
Dr. Mohamad Ala Saadeghvaziri, Dissertation Co-Advisor Date
Professor of Civil Engineering, New Jersey Institute of Technology
Dr. Mohamed Mahgoub, Dissertation Co-Advisor Date
Assistant Professor of Civil Engineering, New Jersey Institute of Technology
Dr. Dorairaja Raghu, Committee Member Date
Professor of Civil Engineering, New Jersey Institute of Technology
Dr. John R. Schuring, Committee Member Date
Professor of Civil Engineering, New Jersey Institute of Technology
Dr. Nazhat Aboobaker, Committee Member Date
Project Manager, New Jersey Department of Transportation

BIOGRAPHICAL SKETCH
Author: Amin Jamali
Degree: Doctor of Phi losophy
Date: January 2011
Undergraduate and Graduate Education:
• Doctor of Philos:>phy in Civil Engineering, New Jersey Institute of Technology, Newark, NJ, 2011
• Master of Science in Civil Engineering, K. N. Toosi University of Technology, Tehran, Iran, 2000
• Bachelor of Science in Civil Engineering, Razi University, Kermanshah, Iran, 1998
Major: Civil Engineering
Presentations and Publications:
Amin Jamali and Mohamad Ala Saadeghvaziri, "Shear Transfer Mechanism in Slab-onGirder Bridges," Fifth International Conference on Bridge Maintenance, Safety and Management (IABMAS10), Philajelphia, PA, July 2010.
Amin Jamali and Mohamaj Ala SacDeghvaziri, "Controllaj Composite Action to EI i mi nate Deck Cracki ng," The A I SC Structures Congress' North A meri can Steel Construction Conference (NASCC) , Orlando, Florida, May 2010.
Mohamaj Ala SacDeghvaziri and Amin Jamali, "An Innovative Concept to Eliminate Deck Cracking," Transportation Research Board 88th Annual Meeting, Washington DC, January 2009.
Mohamad Ala Saadeghvaziri and Amin Jamali, "Application of FRPs in development of high performance conti nuity connections," Fourth I nternational Conference on FRP Composites in Civil Engineering (CICE2008), Zurich, Switzerland, July 2008.
iv

v
To: Bābā and Māmān

vi
ACKNOWLEDGMENT
First and foremost I present my sincerest gratitude to Dr. Mohamad Ala Saadeghvaziri,
my research advisor, who greatly supported me throughout my PhD studies with his
patience and knowledge. One simply could not wish for a better or friendlier advisement.
I also offer my sincere thankfulness to my research co-advisor, Dr. Mohamed Mahgoub,
who made this work possible by his invaluable comments and continuous support.
I am very grateful to the members of my doctoral dissertation committee, Dr.
John R. Schuring, Dr. Dorairaja Raghu and Dr. Nazhat Aboobaker who generously gave
their precious time and expertise to read and better my work.
It is an opportunity to show my appreciation to the Concrete Industry
Management program at NJIT for their financial support to this study. I am also very
thankful to: William Araujo from NJIT, Frank Johansson from Mechanical Components
Inc., Ricardo Arocha, Rob Roberts, Gilbert Morales, Michael McKendrick, Terry
Mooney and Bill Hall from Weldon Materials Inc., Giacomo Abrusci from Bronx CFS
steel Inc., Jamie M. Gentoso and David White from Sika Inc. and Mike Mota from CRSI.
I thank all the CEE staff specially Mr. Allyn Luke for his generous laboratory
support, Dallas Link, Marion Balavender and Bob Morris.
I owe all my accomplishments to my truly exceptional family. There has not been
a single moment in my life without their unconditional support and desire for my success.
Words are not able to express my gratitude to them. All the credit of accomplishing this
study belongs to them.

vii
TABLE OF CONTENTS
Chapter Page
1 INTRODUCTION……............................………………..…………………………. 1
1.1 Motivation…............................……………..…………………………….......... 1
1.1.1 Saving Natural Resources……………………………………………...... 1
1.1.2 Landfills and Generation of Construction and Demolition Debris ……... 2
1.2 Current Applications of RAC …………….…………………………………..... 4
1.3 Significance of Research and Objective ……………………………………….. 4
1.4 Scope…………………………………………………………………………… 5
1.5 Contents………………………………………………………………………… 6
2 LITERATURE REVIEW………………………….. ………………………………. 7
2.1 Properties of Plain RAC…………………….………………………………….. 7
2.1.1 Compressive Strength…………………………………………………… 7
2.1.2 Modulus of Elasticity……………………………………………………. 10
2.1.3 Tensile and Flexural Strength………………………………...…………. 11
2.1.4 Bond Strength…………………………………………………………… 11
2.1.5 Creep and Shrinkage…………………………………………………….. 12
2.1.6 Freeze-Thaw Resistance………………………………………………… 12
2.1.7 Permeability, Carbonation and Chloride Ion Penetration……………….. 14
2.1.8 Density and Workability of RAC………………………………...……... 15
2.1.9 Summary of RAC Properties…………………………………..……….. 16
2.2 Behavior of RAC Beams……………………………………………………….. 17

viii
TABLE OF CONTENTS
(Continued)
Chapter Page
2.3 Behavior of Confined Concrete ……………………………………………..… 20
2.3.1 Behavior of Unconfined Concrete under Monotonic Load……………... 20
2.3.2 Behavior of Unconfined Concrete under Cyclic Load………………….. 21
2.3.3 Behavior of Confined Concrete…………………………………………. 22
2.3.3.1 Active Confinement……………………………………………... 23
2.3.3.2 Passive Confinement…………………………………………...... 23
2.3.4 Mechanism of Confinement……………………………………………... 23
2.3.5 Parameters Influencing Rectangular Confinement……………………… 25
2.3.5.1 Volumetric Ratio of Transverse Reinforcement………………… 26
2.3.5.2 Characteristics of Transverse Reinforcement…………………… 26
2.3.5.3 Tie Spacing……………………………………………………… 27
2.3.5.4 Longitudinal Reinforcement……………………………………... 27
2.3.5.5 Size of Ties………………………………………………………. 27
2.3.5.6 Other Factors……………………………………………………... 28
2.3.6 Concrete Models……………………………………………………..…. 28
2.4 Summary……………………………………………………………………….. 32
3 EXPERIMENTAL WORK……….………………………………………………… 33
3.1 General……………………...………...………………………………………... 33
3.2 Materials…………………………..…………………………………………… 33
3.2.1 Original Concrete and Recycled Coarse Aggregates (RCA)……………. 33

ix
TABLE OF CONTENTS
(Continued)
Chapter Page
3.2.2 Column RAC mix……………………………………………………….. 34
3.2.3 Plain RAC Strength……………………………………………………… 38
3.2.4 RAC Cylinders for Developing Stress-Strain model……………………. 40
3.2.5 Longitudinal and Lateral Steel………………………………………...… 41
3.3 Fabrication of Columns………………………………………………………… 44
3.3.1 Forms……………………………………………………………………. 44
3.3.2 Casting and Curing……………………………………………………… 44
3.3.3 Reinforcing Cages……………………………………………………….. 45
3.3.4 Column Designation…………………………………………………….. 47
3.3.5 Glass Fiber Reinforced Polymer confinement…………………………... 49
3.4 Instrumentation………………………………………………………………… 50
3.4.1 External Instrumentation………………………………………………… 50
3.4.2 Internal Instrumentation…………………………………………………. 51
3.5 Test Setup………………………………………………………………………. 53
3.5.1 Capping………………………………………………………………….. 53
3.5.2 Positioning………………………………………………………………. 53
3.5.3 Loading Unit and Data acquisition System……………………………... 54
3.6 Loading Procedure……………………………………………………………... 54
4 ANALYSIS AND DISCUSSION OF TEST DATA……………………………….. 56
4.1 Test Observations ……………………………………………………………… 56

x
TABLE OF CONTENTS
(Continued)
Chapter Page
4.1.2 Plain RAC Cylinders...……………………………………………..……. 56
4.1.2 Reinforced RAC Columns.……………………………………………… 56
4.2 Contribution of Cover and Core Concrete……………………………………... 63
4.2.1 Spalling Mechanism…………………………………………………….. 63
4.2.1 Transition of Stresses……………………………………………………. 63
4.2.2 Concrete Contributions…………………………………………………. 67
4.3 Effects of Reinforcement Variables on Behavior of RAC Columns ………...... 69
4.3.1 Effect of Volumetric Ratio ……………………………………………… 69
4.3.2 Effect of Tie Spacing …………………………...………………………. 70
4.3.3 Effect of Tie Configuration …………………………………………….. 72
4.4 Effect of Loading Rate on Strength and Ductility of RAC Columns…………. 73
4.4.1 Effect of Loading Rate on Strength…………………….……………….. 73
4.4.2 Effect of Loading Rate on Ductility…………………………………….. 75
4.5 Effect of Cyclic Loading……………………………………………………….. 79
5 ANALYTICAL PREDICTION OF RAC STRESS-STRAIN BEHAVIOR……….. 83
5.1 General………………………………………………………………………….
83
5.2 Development of Stress-Strain Formulation for Plain RAC……………………..
83
5.2.1 Experimental Stress-Strain Curves……………………………………… 83
5.2.2 Proposed Stress-Strain Model for Plain RAC…………………………… 87
5.3 Model for Confined RAC………………………………………………………. 90

xi
TABLE OF CONTENTS
(Continued)
Chapter Page
5.3.2 Stress-Strain Curve of Confined RAC………………...………………........... 98
5.3.3 Experimental and Predicted Values of Ks Factor……………………………. 100
5.3.4 Transition and Descending Branches.………………………………………... 102
5.3.5 Sample Analysis……………………………………………………………… 106
6 EXAMINATION OF RAC MODELS IN FLEXURE……………………………... 109
6.1 Numerical Analysis…………………………………………………………...... 109
6.1.1 Material and Geometrical Properties……………………………………. 109
6.1.2 Calculation of Deflections………………………………………………. 113
6.2 Experimental Results …………………………………………………………... 115
7 CONCLUSIONS.....………….……………………………………………………... 121
7.1 General……... ..……………………………………………………………...… 121
7.2 Conclusions from the Experimental Study...……………….……………….….. 121
7.3 Conclusions from the Analytical Study………………………………………... 122
7.3.1 Proposed Model for Plain RAC…………………………………………. 122
7.3.2 Proposed Model for Confined RAC…………………………………….. 124
7.4 Recommendation for Future Research…………………………………………. 125
APPENDIX A FAILURE MODE OF RAC COLUMNS…...………………………... 126
APPENDIX B DETERMINATION OF CONCRETE CONTRIBUTION…………… 136
APPENDIX C EXPERIMENTAL STRESS-STRAIN CURVES…………………….. 142
REFERENCES ………………………………………………………………………... 152

xii
LIST OF TABLES
Table Page
1.1 Building-related C&D Debris Generation in 1996…………………………..…... 3
1.2 Building-related C&D Debris Generation in 2003………………………………. 3
2.1 Compressive Strengths of Recycled Concrete…………………………………… 8
2.2 Compressive Strengths of Original and Recycled Concrete……………………... 9
2.3 Frost Resistance of RAC……………...………………………………………….. 14
2.4 Specific Gravity of Natural and Recycled Aggregates…………………………... 16
2.5 Summary of RAC Properties…………………………………………………….. 17
2.6 Proposed Models for Confined Normal Concrete……………………………….. 32
3.1 Results of RCA Sieve Analysis …………………………………………………. 35
3.2 Compressive Strength of the Original Concrete…………………………………. 35
3.3 RAC Mix Proportions……………………………………………………………. 36
3.4 Physical Properties of Recycled Aggregates…………………………………….. 37
3.5 Compressive Strengths of Cylinder Samples on the Day of Column Testing vs.
the Strengths on the Day of Obtaining Stress-Strain Curves……………………..
39
3.6 Mix Proportions for Target Strengths of 2500 psi to 7000 psi…………………... 41
3.7 Mechanical Properties of Longitudinal Steel…………………………………….. 43
3.8 Mechanical Properties of Tie Steel………………………………………………. 43
3.9 Details of the Specimens…………………………………………………………. 48
4.1 Strains Corresponding to Cracking Condition of RAC Columns………………... 65
4.2 Calculated and Experimental Axial Strengths and Contributions……………….. 68

xiii
LIST OF TABLES
(Continued)
Table Page
4.3 Calculated and Experimental Dynamic Axial Strengths………………………… 76
4.4 Variation of Static-to-Dynamic Axial Strength Ratios with Respect to s ……... 77
5.1 Experimental Values of Strength Enhancement due to Confinement, sK ………. 101
6.1 Predicted Curvature and Deflection Values ……………………………………... 120

xiv
LIST OF FIGURES
Figure Page
1.1 The US annual production of sand and gravel…………………………………… 2
1.2 Composition of demolition debris ………………………………………………. 3
1.3 (left) States recycling concrete as aggregate, (right) States recycling concrete as
aggregate base…………………………………………………………………….
4
2.1 Modulus of elasticity as a function of cement/water ratio……………………….. 11
2.2 Effect of fly ash on creep of RAC……………………………………………….. 13
2.3 Effect of water/binder ratio and fly ash on RAC shrinkage……………………… 13
2.4 Half-cell potentials of rebars in RAC and normal concrete……………………... 15
2.5 Chloride Ion penetration in normal concrete and RAC………………………….. 15
2.6 Load-deformation of RAC versus NAC beams………………………………….. 19
2.7 Cracking of RAC and NAC beams………………………………………………. 19
2.8 Typical monotonic stress-strain behavior of normal concrete…………………… 21
2.9 Typical cyclic stress-strain behavior of normal concrete………………………… 22
2.10 Effect of hydrostatic pressure on concrete strength……………………………… 24
2.11 Stress-strain curves from triaxial compression tests……………………………... 25
2.12 Effect of confinement on strength and ductility…………………………………. 25
2.13 Confinement by circular spirals………………………………………………….. 26
2.14 Confinement by rectangular ties…………………………………………………. 26
2.15 Concrete stress-strain model proposed by Sheikh and Uzumeri, 1982………...... 31
2.16 Concrete stress-strain model proposed by Mander et al., 1988………………….. 31

xv
LIST OF FIGURES
(Continued)
Figure Page
3.1 Weldon Materials crushing facilities, New Jersey……………………………….. 34
3.2 Stress-strain curves of the original concrete…………………………………….. 35
3.3 “TSAM” and normal mixing approach…………………………………………... 37
3.4 Improvement of ITZ by employing “TSMA”……………………………………. 37
3.5 Compressive strength of the finalized RAC mix………………………………… 38
3.6 Mixing arrangements…………………………………………………………….. 38
3.7 Testing machine used for measuring strength of concrete cylinders…………….. 40
3.8 Typical stress-strain curves for plain RAC cylinders……………………………. 40
3.9 (left) Longitudinal rebars samples, (right) Tie steel samples…………………….. 42
3.10 Tensile behavior of longitudinal rebars (left) and tie steel (right)……………….. 43
3.11 Plywood forms…………………………………………………………………… 44
3.12 Tie configurations………………………………………………………………... 46
3.13 Tie spacing and end extra reinforcement………………………………………… 47
3.14 Example cages…………………………………………………………………… 47
3.15 Additional end confinement using GFRP laminates……………………………... 50
3.16 Measuring axial deformation of cylinder by a pair of extensometers…………… 51
3.17 CEA-06-240UZ-120 electrical strain gauge (trimmed to 4 9 mm)……………... 52
3.18 Examination of bond quality of a strain gauge installed on 3/16” steel wire……. 53
3.19 Location of tie strain gauges……………………………………………………... 53
3.20 Application of hydro-stone®
gypsum cement……………………………………. 54

xvi
LIST OF FIGURES
(Continued)
Figure Page
3.21 1000-kip MTS815 servo-hydraulic loading unit and other hardware…………… 55
4.1 RAC stress strain curves vs. models for normal concrete……………………….. 57
4.2 Typical failure of RAC and normal concrete cylinders…………………………..
57
4.3 Axial deformation of column B1-2………………………………………………. 58
4.4 Failure of Column A1-1 under static loading……………………………………. 60
4.5 Failure of Column B2-2 under static loading……………………………………. 61
4.6 Failure of Column C3-2 under static loading……………………………………. 62
4.7 Tie strain versus longitudinal strains…………………………………………….. 66
4.8 Concrete contribution and stress transition zone………………………………… 66
4.9 Determination of concrete contributions for Columns A1-1 and A1-2………….. 69
4.10 Gain in strength and ductility due to confinement……………………………….. 70
4.11 Effect of transverse steel configuration on column behavior……………………. 71
4.12 Effect of transverse steel amount on column behavior…………………………... 72
4.13 Effect of strain rate on behavior of column type A1…………………………….. 78
4.14 Effect of strain rate on behavior of column type B2……………………………... 78
4.15 Cyclic behavior of column A1-5 subjected to cyclic loading……………………. 80
4.16 Cyclic behavior of column B1-5 subjected to cyclic loading …………………… 80
4.17 Cyclic behavior of column B3-5 subjected to cyclic loading …………………… 81
4.18 Cyclic behavior of column C1-5 subjected to cyclic loading …………………… 81
4.19 Cyclic behavior of column C2-5 subjected to cyclic loading …………………… 82

xvii
LIST OF FIGURES
(Continued)
Figure Page
4.20 Cyclic behavior of column C3-5 subjected to cyclic loading …………………… 82
5.1a Experimental and predicted stress-strain curves for plain RAC ………………… 85
5.1b Experimental and predicted stress-strain curves for plain RAC ………………… 85
5.1c Experimental and predicted stress-strain curves for plain RAC ………………… 86
5.1d Experimental and predicted stress-strain curves for plain RAC ………………… 86
5.1e Experimental and predicted stress-strain curves for plain RAC ………………… 87
5.2 Variation of n with respect to RAC compressive strength…………………..….. 90
5.3 Variation of f with respect to RAC compressive strength…………………….. 90
5.4 Proposed model for compressive stress-strain behavior of plain RAC………….. 91
5.5 Shape of arching action…………………………………………………………... 93
5.6 Unconfined areas at tie level…………………………………………………….. 94
5.7 Arching action along the column height…………………………………………. 94
5.8 Experimental stress-strain curve for column A1-1………………………………. 100
5.9 Power regression to determine and ……………………………………….. 101
5.10 Approximation of cc ……………………………………………………………. 105
5.11 Approximation of and values………………………………………………... 105
5.12 Proposed RAC model versus proposed models for normal concrete …………… 108
6.1 Cross-sectional properties of the RAC beams…………………………………… 112
6.2 Stress-strain behavior of the materials used in the numerical analysis ………….. 113
6.3 Beam divisions for numerical calculation……………………………………….. 115

xviii
LIST OF FIGURES
(Continued)
Figure Page
6.4 Analytical moment-curvature diagram…………………………………………... 116
6.5 Beam test setup: (top) Beam-1, (bottom) Beam-2……………………………….. 117
6.6 Development of cracks and crushing: (top) Beam 1, (bottom) Beam 2………….
118
6.7 Calculated and experimental load-deformation of the RAC beams …………….. 119
7.1 Proposed model for compressive stress-strain behavior of plain RAC………….. 123
7.2 Proposed model for compressive stress-strain behavior of confined RAC……… 125
A.1 Failure of Column A1-1 under static loading……………………………………. 127
A.2 Failure of Column A1-2 under static loading……………………………………. 127
A.3 Failure of Column A2-1 under static loading……………………………………. 128
A.4 Failure of Column A2-2 under static loading……………………………………. 128
A.5 Failure of Column A3-1 under static loading……………………………………. 129
A.6 Failure of Column A3-2 under static loading……………………………………. 129
A.7 Failure of Column B1-1 under static loading……………………………………. 130
A.8 Failure of Column B1-2 under static loading……………………………………. 130
A.9 Failure of Column B2-1 under static loading……………………………………. 131
A.10 Failure of Column B2-2 under static loading……………………………………. 131
A.11 Failure of Column B3-1 under static loading……………………………………. 132
A.12 Failure of Column B3-2 under static loading……………………………………. 132
A.13 Failure of Column C1-1 under static loading……………………………………. 133
A.14 Failure of Column C1-2 under static loading……………………………………. 133

xix
LIST OF FIGURES
(Continued)
Figure Page
A.15 Failure of Column C2-1 under static loading……………………………………. 134
A.16 Failure of Column C2-2 under static loading……………………………………. 134
A.17 Failure of Column C3-1 under static loading……………………………………. 135
A.18 Failure of Column C3-2 under static loading……………………………………. 135
B.1 Determination of concrete contributions for Columns A1-1 and A1-2………….. 137
B.2 Determination of concrete contributions for Columns A1-1 and A1-2………….. 137
B.3 Determination of concrete contributions for Columns A1-1 and A1-2………….. 138
B.4 Determination of concrete contributions for Columns A1-1 and A1-2………….. 138
B.5 Determination of concrete contributions for Columns A1-1 and A1-2………….. 139
B.6 Determination of concrete contributions for Columns A1-1 and A1-2………….. 139
B.7 Determination of concrete contributions for Columns A1-1 and A1-2………….. 140
B.8 Determination of concrete contributions for Columns A1-1 and A1-2………….. 140
B.9 Determination of concrete contributions for Columns A1-1 and A1-2………….. 141
C.1 Experimental stress-strain curve for column A1-1………………………………. 143
C.2 Experimental stress-strain curve for column A1-2………………………………. 143
C.6 Experimental stress-strain curve for column A2-1………...…………………….. 144
C.4 Experimental stress-strain curve for column A2-2………………………………. 144
C.5 Experimental stress-strain curve for column A3-1…………………………….… 145
C.6 Experimental stress-strain curve for column A3-2………………………………. 145
C.7 Experimental stress-strain curve for column B1-1………………………………. 146

xx
LIST OF FIGURES
(Continued)
Figure Page
C.8 Experimental stress-strain curve for column B1-2………………………………. 146
C.9 Experimental stress-strain curve for column B2-1………...…………………….. 147
C.10 Experimental stress-strain curve for column B2-2………………………………. 147
C.11 Experimental stress-strain curve for column B3-1…………………………….… 148
C.12 Experimental stress-strain curve for column B3-2………………………………. 148
C.13 Experimental stress-strain curve for column C1-1………………………………. 149
C.14 Experimental stress-strain curve for column C1-2………………………………. 149
C.15 Experimental stress-strain curve for column C2-1………...…………………….. 150
C.16 Experimental stress-strain curve for column C2-2………………………………. 150
C.17 Experimental stress-strain curve for column C3-1…………………………….… 151
C.18 Experimental stress-strain curve for column C3-2………………………………. 151

xxi
LIST OF SYMBOLS
ib dimension of concrete core
id center-to-center distance between adjacent longitudinal rebars
f concrete stress
1f strength of confined concrete
2f lateral hydrostatic pressure
addf additional strength due to confinement
cf strength of confined concrete
ccf strength of confined concrete
ccf enhance compressive strength of confined concrete
icf insitu strength of confined concrete
sf tie stress
ucf enhance compressive strength of unconfined concrete
dyn
yf dynamic yield stress of steel
stat
yf static yield stress of steel
yhf yield stress of tie steel
cf compressive strength of concrete
m number of perimeter longitudinal rebars
n a factor corresponding to variation of elastic modulus
s tie spacing

xxii
LIST OF SYMBOLS
(Continued)
sA area of longitudinal rebars
ccA area enclosed by the centerline of outer ties
)(tieeA net concrete area enclosed by the centerline of outer ties
B width of concrete core
C center-to-center distance between adjacent longitudinal rebars
cE modulus of elasticity
secE secant modulus of elasticity
eK a factor corresponding to the effective area of concrete core
sK the coefficient of effectiveness
oP compressive load capacity of concrete column
occP design strength of concrete core
cP compressive load capacity of net concrete area
ccP compressive load capacity of concrete core
)(confcP additional core load strength due to confinement
(max)concP maximum contribution of concrete in axial load bearing capacity
)(unconfcP load bearing capacity of the concrete core without confinement effect
maxP experimental load capacity of concrete column
cZ slope of descending branch in stress-strain curve of confined concrete
pZ slope of descending branch in stress-strain curve of plain concrete

xxiii
LIST OF SYMBOLS
(Continued)
* a factor that represents the combined effectiveness of the tie configuration and
longitudinal rebars
f stress corresponding to axial strain of 0.0040
a factor representing the effect of tie configuration of compressive strength
constant
constant
concrete strain
straining rate
oo strain corresponding to strength of unconfined concrete
%50 strain corresponding to 50% of confined concrete strength
c strain corresponding to strength of unconfined concrete
co strain corresponding to strength of unconfined concrete
cc strain corresponding to strength of confined concrete
1s first strain corresponding to strength of confined concrete
2s second strain corresponding to strength of confined concrete
constant
s volumetric ratio of transverse reinforcement

1
CHAPTER 1
INTRODUCTION
1.1 Motivation
The earth’s natural resources are being consumed at a very high rate for many years. The
potential depletion of resources, CO2 emissions and high energy consumption rates in the
process of production, increases the necessity of recycling. All sectors of the society are
responsible for these concerns, specially the construction industry.
As a major construction material, concrete is increasingly judged by its
environmental impacts and reusing the readily available concrete is becoming very
important. Considering that much of the US infrastructures and urban buildings now
require renovation and replacement, the concrete left behind can be a valuable source of
aggregate for new concrete. Such a concrete is usually called Recycled Aggregate
Concrete (RAC). Through cost analyses, it is shown that recycling concrete as aggregate
for new concrete production can be a cost-effective method for construction (Tam, 2008).
1.1.1 Saving Natural Resources
There are significant ecological advantages in recycling the waste concrete left behind
from construction and demolition into aggregates, including protecting the natural
resources as well as saving ecological environment.
Figure 1.2 shows the US annual production of sand and gravel in the past 18
years. The data was compiled from the annual U.S. Geological Survey Mineral
Commodity report. More than one billion tons of construction sand and gravel valued at
$7.6 billion was produced in 2008, 44% of which was used as concrete aggregates. On

2
the average, there is 38 million tons annual increase in sand and gravel production.
Continuation of such a dramatic use of natural resources can certainly have
environmental impacts.
0
250
500
750
1000
1250
1500
1992 1996 2000 2004 2008
Year
Pro
duct
ion (
mil
lion t
ons)
Figure 1.1 The US annual production of sand and gravel.
Source: U.S. Geological Survey Mineral Commodity report, 2009.
1.1.2 Landfills and Generation of Construction and Demolition Debris
Another significant benefit of recycling concrete and building materials is elimination of
the need for landfills. According to the US Environmental Protection Agency (EPA530-
R-95-019 report) in 1994 there were 1889 Construction and Demolition (C&D) waste
landfills across the US. In 2004 this number dropped to 1500 (Simmons, 2006). Some
states including Iowa, New Hampshire and Rhode Island have no or as low as only one
available C&D waste landfill. Sometimes landfill tipping fees can be as high as $100 per
ton.
A significant amount of C&D debris is annually generated in the US. Tables 1.1
and 1.2 present the amount of building-related debris generated in 1996 and 2003,
respectively. In 1996, only 20 to 30 percent of the generated C&D waste was recycled

3
(Franklin Associates, 1998) while in 2003 this number was increased to 48% (EPA530-
R-09-002, 2009). Although there is an obvious trend toward increasing the C&D
recovery, 52% of the generated waste is still expensively discarded into landfills. A
considerable part of the C&D debris is concrete as shown in Figure 1.2.
Table 1.1 Building-related C&D Debris Generation in 1996
Source Residential Nonresidential Total
(Million tons) Percent
Million tons Percent Million tons Percent
Construction 7 11% 4 6% 11 8%
Renovation 32 55% 28 36% 60 44%
Demolition 20 34% 45 58% 65 48%
Total 59 100% 77 100% 136 100%
Percent 43% 57% 100%
Source: Franklin Associates, 1998.
Table 1.2 Building-related C&D Debris Generation in 2003
Source Residential Nonresidential Total
(Million tons) Percent
Million tons Percent Million tons Percent
Construction 10 15% 5 5% 15 9%
Renovation 38 57% 33 32% 71 42%
Demolition 19 28% 65 63% 84 49%
Total 67 100% 103 100% 170 100%
Percent 39% 61% 100%
Source: EPA530-R-09-002, 2009.
Roofing
Brick
Concrete
Wood
Landfill debris
Scrap iron
Roofing
Figure 1.2 Composition of demolition debris. Source: Franklin Associates, 1998.

4
1.2 Current Applications of RAC
Within the past 25 years, the use of RAC for base or sub-base applications has been
widely accepted by many highway agencies. In 2004, the Federal Highway
Administration (FHWA) conducted a national review on RAC. This survey showed that
that in many states RAC was primarily used as fill or sub-base materials and less often as
aggregates in pavement concrete, as shown in Figure 1.3.
There are many suppliers of ready rubble across the country that receive
considerable demand for recycled aggregates as fill and base for construction projects
such as buildings, parking lots, roads and drain ducts. Other potential uses include ballast,
sub-ballast, drainage, erosion control and filter material. However, the use of recycled
concrete as aggregate in structural concrete has until now been restricted by the lack of
experience and knowledge on RAC behavior.
Figure 1.3 (left) States recycling concrete as aggregate, (right) States recycling concrete
as aggregate base.
1.3 Significance of Research and Objective
RAC is generally acknowledged to be slightly less strong than NAC due to its higher
porosity resulted from old cement mortar adhered to the surface. This has created

5
hesitations in the use of RAC as a structural material, confining its use to low-grade
applications like road work sub-base, embankments, drainage and at the best in
pavements. Widespread application of RAC, such as seismic, requires knowledge on
behavioral characteristics such as ductility, material behavior under biaxial and triaxial
state of stresses, loading rate, strength degradation, etc. which have not yet been
sufficiently investigated.
One of the most important factors that can strongly affect the seismic response of
a RAC structural member is the stress-strain characteristics. Knowledge on the behavior
of RAC under different confinement configurations and derivation of a stress-strain
model is very essential to analysis and design of a RAC structural member. The main
objective of this research was characterizing seismic properties of RAC by developing a
stress-strain model that can reasonably describe the behavior under unconfined and
confined conditions.
1.4 Scope
To achieve the research objective, an experimental approach was employed. Forty-four
reinforced RAC columns, 10 inches by 10 inches in section and 32 inches in height with
different reinforcement configurations were built. These columns were instrumented and
tested under monotonic and cyclic loading at New Jersey Institute of Technology. There
were numerous parameters influencing the behavior of confined RAC, including steel and
unconfined concrete strengths and lateral reinforcement pattern, size and distribution.
This created unlimited experimental possibilities. Therefore the parameters were limited
to square columns with normal strength RAC and rectilinear tie configurations.

6
1.5 Contents
Chapter 2 reviews the literature on durability and mechanical properties of plain RAC as
well as the very limited research work on behavior of RAC beams. Some of the widely
used stress-strain models for normal concrete are also reviewed. The experimental
program is described in Chapter 3 in details. Chapter 4 summarizes the experimental
results and observations as well as analysis of the effects of different variables on the
behavior of RAC. Chapter 5 is dedicated to development of a model for predicting the
behavior of unconfined RAC under uniaxial compression, followed by detailed
presentation on developing a stress-strain model for confined RAC. Chapter 6 examines
the proposed models for plain and confined RAC in flexure where predicted load-
deformation of RAC beams is compared with experimental results. Conclusions and
recommendations for future research are presented in Chapter 7.

7
CHAPTER 2
LITERATURE REVIEW
2.1 Properties of Plain RAC
Within the past several decades various researchers have studied the durability and
mechanical properties of plain RAC. In this section, the available findings on properties
of plain RAC is presented.
2.1.1 Compressive Strength
In general, the majority of researchers have reported 5% to 30% decrease in the
compressive strength of concrete made of coarse recycled aggregate, depending on the
quality of the parent concrete and mix design (Hansen and Narud 1983, Ravindrarajah
and Tam 1985, Topcu and Guncan 1995, Yamato et al. 1998, Ajdukiewicz and
Kliszczewicz 2002, Topcu and Sengel 2004, Rahman et al. 2009). Buck (1977)
performed one of the earliest investigations on RAC properties. He used concrete from
different sources as aggregates in new concrete. Keeping the water/cement ratio (w/c)
constant, he observed an average of 20% less strength in the RAC. The use of water
reducing admixture and higher cement content was reported to be effective in producing
a stronger concrete. Rahal (2007) found 10% decrease in the compressive strength of
coarse aggregate RAC while Yamato et al. (1998) observed 20%, 30% and 45% decrease
in compressive strength of RAC made using 30%, 50% and 100% of coarse aggregate
replacement, respectively. Not many researchers have found higher compressive strength
for RAC as compared to its parent concrete. Hansen and Narud (1983) made different
grades of RAC with high-strength concrete (w/c = 0.40), medium-strength concrete (w/c

8
= 0.70) and low-strength concrete (w/c = 1.20) as aggregate. The RAC specimens were
prepared with the same mix proportions and aggregate grading as the three original
concretes. All the specimens were then cured under the same conditions as the original
concretes (i.e. in water at 40 degrees Celsius and tested for compressive strength after 28
days). It was shown that RAC specimens gained approximately the same strength as the
corresponding parent concretes, as shown in Table 2.1 except for high-strength concrete
made with low-grade recycled aggregates. They, therefore, concluded that the
compressive strength of recycled concrete depends on the strength of the original
concrete, and that it is largely influenced by a combination of the w/c ratio of the original
concrete and that of the RAC. Poon et al. (2004) also stated that recycled aggregate has
more angular shape and rough surface texture compared to natural aggregate that can lead
to better bond and higher strength of RAC. They stated that to increase the compressive
strength, recycled aggregates should be oven dried to create the interfacial bond between
cement paste and aggregate particles.
Table 2.1 Compressive Strengths of Recycled Concrete
Series compressive strength (MPa)
H H/H H/M H/L1 M M/H M/M M/L
2 L L/H L/M L/L
1 56.4 61.2 49.3 34.6 34.4 35.1 33 26.9 13.8 14.8 14.5 13.4
2 61.2 60.7 36.0 36.2 14.5 13.6
3 58.5 60.6 33.2 36.0 15.0 12.8
1 High-strength concrete made with low-strength recycled aggregates
2 Medium-strength concrete made with low-strength recycled aggregates
Source: Hansen and Narud, 1983.
The use of recycled fine aggregates is not usually favorable as it can reduce the
workability and strength. Khatib (2005) observed only 10% reduction in the compressive
strength of RAC when 100% of the natural sand was replaced with recycled fine

9
aggregates. Evangelista and de Brito (2007) found out that 30% replacement of the fine
natural aggregates with recycled aggregates did not jeopardize the strength. It is also
shown that blends of 50% natural and 50% recycled sands produced strengths up to 20%
less than recycled concrete made with all natural sands, as shown in Table 2.2. In general,
it should be noted that the use of fine recycled aggregate in RAC requires extra prudence.
Table 2.2 Compressive Strengths of Original and Recycled Concrete
w/c
compressive strength (ksi)
natural coarse and
fine aggregate
(original concrete)
recycled concrete
aggregate and
100% natural sand
recycled coarse
aggregate, 50%
recycled fine
aggregate and
50% natural sand
recycled coarse
aggregate and
100% recycled
fine aggregate
0.45 5.44 5.36 4.93 4.35
0.55 4.19 4.13 3.62 3.12
0.68 3.19 3.04 2.54 1.88
Source: ACI555R-01.
Rahman et al. (2009) studied the effect of recycled coarse aggregate size on
compressive strength and physical properties (including water absorption and specific
gravity) of RAC. They found that the compressive strength is reduced upon increasing
the size of recycled coarse aggregates. Tam et al. (2009) studied the physio-chemical
reactions of cement paste around aggregate for normal concrete and RAC. They found
out that because of the large amount of mini-cracks in the recycled aggregate, the
concrete samples with recycled aggregate substitution had lower values of physio-
chemical reactions than those without recycled aggregate replacement. The mini-cracks
absorb some of the required water and reduce water amount for mixing; thus hinder the
hydration and reduce the concrete strength. On the contrary, Domingo-Cabo et al. (2009)
reported increase in the compressive strength of RAC upon increasing the percentage of

10
recycled coarse aggregate. It was argued that this phenomenon was possibly caused by
the greater water absorption of the dried recycled aggregates produced a smaller effective
water/cement ratio. Corinaldesi and Moriconi (2009) studied the effect of silica fume and
fly ash on improving compressive strength of RAC. They observed that the strength can
be improved to equal or even exceed those of normal aggregate concrete by adding fly
ash or silica fume to the mixture.
2.1.2 Modulus of Elasticity
Usually the modulus of elasticity of a RAC made of recycled fine and coarse aggregates
is approximately 25% to 40% less that of parent concrete while for a concrete made with
only recycled coarse aggregates, it is approximately 10% to 33% less, as shown in Table
2.1. For RAC made with recycled coarse aggregate, Sri Ravindrarajah and Tam (1985)
observed a reduction in modulus of elasticity up to 30% while Topcu and Guncan (1995)
reported 20% reduction and Domingo-Cabo et al. (2009) noticed approximately 15%
reduction in the modulus of elasticity compared to the one of the parent concrete. It is
concluded that the reduction in RAC modulus of elasticity with the increase of recycled
aggregate content is inevitable. Berndt (2009) studied the effect of blast furnace slag and
fly ash on improving mechanical properties of RAC. They suggested that concrete mixes
with 50% replacement of cement with blast furnace slag may show better modulus of
elasticity. Corinaldesi and Moriconi (2009) studied the effect of silica fume and fly ash
on improving modulus of elasticity of RAC. They observed that the strength can be
improved to equal or even exceed those of normal aggregate concrete by adding fly ash
or silica fume to the mixture.

11
Figure 2.1 Modulus of elasticity as a function of cement/water ratio. Source: ACI-555R-01.
2.1.3 Tensile and Flexural Strength
The effect of recycled aggregates on tensile and flexural strengths of RAC has been
investigated in various studies. The majority of findings indicate that RAC made with
recycled coarse aggregate and natural fine aggregate exhibits less than 10% reduction in
tensile strength. RAC made with recycled coarse and fine aggregates experiences
reductions in tensile strengths of 10-20% (Hansen 1986). The effect of recycled
aggregate in tensile strength of concrete appears to be insignificant.
2.1.4 Bond Strength
Xiao and Falkner (2007) examined the behavior of bond between reinforcement and
RAC. They reported that, for equivalent mix proportions, bond strength between RAC
and reinforcement was similar to that of normal concrete, irrespective of the recycled
aggregate replacement. For the case of similar compressive strength of RAC and the
parent concrete, the bond strength of the RAC is even higher than the bond strength of
the NAC. Eguchi et al. (2007), Etxeberria et al. (2007) and Corinaldesi and Moriconi
(2009) studied the bond strength of reinforced RAC and observed no specific issues.

12
2.1.5 Creep and Shrinkage
According to Building Contractors Society of Japan (1978), RAC made with recycled
coarse aggregate and natural sand experienced shrinkage of 20% to 50% greater than
concrete made with all natural aggregates. However, RAC made with recycled coarse and
fine aggregates experienced shrinkage of 70 to 100% greater than that of corresponding
NAC. Sri Ravindrarajah and Tam (1985) showed that RAC creep is approximately 30%
to 60% higher than that of its parent concrete. This was attributed to the higher paste
content of RAC as creep of concrete is proportional to the content of paste or mortar in
concrete. Domingo-Cabo et al. (2009) studied the creep and shrinkage variations in RAC
with different substitution percentages (20%, 50% and 100%) of coarse aggregates,
keeping cement and cement/water ratio constant. It was observed that 50% replacement
of coarse aggregate caused more than 40% increase in creep and 20% increase in
shrinkage. In the case of complete replacement of coarse aggregate, more than 50%
increase in creep and 70% increase in shrinkage was observed.
Kou et al. (2007) showed that the 25% to 35% cement replacement with fly ash
can considerably reduce the creep of RAC, as shown in Figure 2.2. This behavior was
attributed to the greater long term strength development due to the pozzolanic reaction of
fly ash. They also studied the effect of fly ash on shrinkage of RAC. At the age of 16
weeks, free shrinkage of the original concrete and the RAC made with 35% cement
replacement with fly ash were almost identical, as shown in Figure 2.3.
2.1.6 Freeze-Thaw Resistance
Buck (1977) observed that the freeze-thaw resistance of RAC is higher than the
corresponding original concrete as presented in Table 2.3. Some studies showed that

13
there is almost no difference between freeze-and-thaw resistances of RAC and its parent
concrete (Hansen 1986).
Figure 2.2 Effect of fly ash on creep of RAC. Source: Kou et al., 2007.
Figure 2.3 Effect of water/binder ratio and fly ash on RAC shrinkage. Source: Kou et al., 2007.

14
Table 2.3 Frost Resistance of RAC
type of aggregate No. of
Cycles
Durability
Factor
natural gravel and sand 300 4
coarse recycle aggregate and natural sand 300 28
coarse and fine recycle aggregate 300 30
Source: Buck, 1977.
2.1.7 Permeability, Carbonation and Chloride Ion Penetration
Due to the absorption of the old cement mortar attached to the aggregate particles, RAC
is generally acknowledged to posses higher water absorption compared to normal
concrete. For example, Hansen (1986) reported that concrete made of recycled aggregates
with water/cement ratio of 0.5 to 0.7 shows permeability of two to five times more than
normal concrete.
Levy and Helene (2004) showed that in general, the high alkaline reserve in RAC
compared to normal concrete, helped the reinforcement remain passive (PH>7) much
longer which can significantly delay the corrosion of the reinforcement compared to
normal concrete. Corinaldesi and Moriconi (2009) also reported that RAC prepared with
lower water/cement did not present evidence of corrosion danger. This observation was
attributed to the low permeability of the concrete, even if a porous aggregate, such as
recycled aggregate was used.
The reinforcement corrosion in concrete exposed to a chloride ion (sea water, de-
icing salt, etc.) is usually of a great concern. In general, RAC has higher chloride ion
penetration depth. Khan (1984) showed that the reduction in water/cement ratio can
significantly improve the corrosion resistant of RAC, as shown in Figure 2.4. Kou et al.
(2007) also showed that 25-35% fly ash as a substitute for cement was very effective in

15
reducing chloride penetration depth. Increasing curing time was also reported to be very
beneficial, as shown in Figure 2.5.
Figure 2.4 Half-cell potentials of rebars in RAC and normal concrete. Source: Khan, 1984.
Figure 2.5 Chloride Ion penetration in normal concrete and RAC. Source: Kou et al., 2007.
2.1.8 Density and Workability of RAC
As a result of the low density of the old cement mortar that remains adhered to the
aggregate, recycled aggregate generally has a density slightly less than that of its parent
concrete, as presented in Table 2.4.

16
Table 2.4 Specific Gravity of Natural and Recycled Aggregates
Type of aggregate Size (mm) SSD
* Specific
Gravity
Original natural gravel
4-8
8-18
16-32
2.50
2.62
2.61
Recycled aggregate
(From high-strength concrete)
4-8
8-18
16-32
2.34
2.45
2.49
Recycled aggregate
(From low-strength concrete)
4-8
8-18
16-32
2.34
2.42
2.49
*Saturated Surface-Dry
Source: Hansen and Narud, 1983.
As the recycled aggregate content of RAC increases, its workability decreases.
This may also be attributed to the rougher surface texture, greater angularity and presence
of mortar residue adhered to the crushed recycled aggregates compared with the smooth,
rounded natural stone (Hansen and Narud 1983). In improving the workability,
sometimes the use of dry-surface saturated aggregates is suggested (Hansen 1992). On
the contrary, Poon et al. (2004) believed that air-dried recycled aggregate is more
preferred because RAC made of saturated aggregate may bleed its excess water. For the
same slump, ACI555R-01 recommends adding 5% more free water for RAC than that of
conventional concrete with the same slump. In general, the use of plasticizers is always
recommended.
2.1.9 Summary of RAC Properties
The compressive strength of RAC made with recycled coarse aggregate is 5-30% smaller
than that of normal concrete. The use of recycled fine aggregate in RAC is usually not
recommended because it can significantly reduce the workability of RAC as well as the
compressive strength. Modulus of elasticity of RAC is usually 10-33% smaller than that

17
of normal concrete. RAC made with recycled coarse aggregate experiences up to 50%
higher shrinkage and creep compared with normal concrete. The use of small
water/cement ratio, flyash, silicafume on other pozzolans can significantly reduce the
creep and shrinkage of RAC. The use of small water/cement ratio and pozzolans
improves the durability of RAC as well. The mechanical properties and durability of
plain RAC are summarized in Table 2.5.
Table 2.5 Summary of RAC Properties
property range of expected changes from NAC
compressive strength 5% to 30% less
tensile strength 0% to 10% less
modulus of elasticity 10% to 33% less
bond strength almost the same
drying shrinkage 20% to 50% more
creep 30% to 60% more
permeability up to 5 times more
freeze-thaw durability Higher
carbonation up to 65% more
corrosion might be slightly more
2.2 Behavior of RAC Beams
A limited number of studies on behavior of RAC beams were identified. These studies
were mostly concerned about the load bearing capacity of RAC beams compared to
NAC.
Mukai and Kikuchi (1988) conducted one of the earliest studies on the effect of
recycled aggregates on load-bearing capacity and deformation of concrete beams. They

18
replaced 30% of the natural gravel with recycled coarse aggregate. The ultimate load-
bearing capacity and deformation of the RAC beams were the same of reference normal
concrete beam. They concluded that the use of 30% recycled coarse aggregate may be
warranted for “structural concrete”.
Concrete aggregate has a significant influence on the shear behavior of reinforced
beams. Thus, the shear behavior of RAC beams has been studied more than other
behavioral parameters, such as flexural behavior. Fonteboa and Abella (2007) studies the
shear behavior of full-size simply supported RAC beams with 50% recycled coarse
aggregate. They compared the shear load-bearing capacity and deflections with those of
normal concrete beams. Both RAC and normal concrete beams had the same compressive
and tensile splitting strength. Although significant splitting cracks along the tension side
was observed in RAC beams, there was no significant difference in the ultimate load
capacities, as shown in Figure 2.6. Fathifazl et al. (2009) investigated the effect of
span/depth ratio and beam size on the shear strength of RAC beams without shear
reinforcement. Using the proposed mix proportioning method, several beams were made
and tested. The results showed that the shear strength of RAC beams can be comparable
or even superior to that of beams made entirely with natural aggregates. They did not find
any major difference between the failure modes and cracking pattern of RAC and normal
concrete beams. Etxeberria et al. (2007) studied the shear load-bearing capacity of RAC
beams. They made 100% recycled coarse aggregate concrete beams as well as normal
concrete beams. Under ultimate loads, the 100% unreinforced RAC beams showed 16%
less strength than that of normal unreinforced concrete beams. They tested reinforced
beams with 25% and 50% recycled coarse aggregate replacement. No reduction in the

19
load-bearing capacity was observed.
Ajdukiewicz and Kliszczewicz (2007) performed experimental study on bearing
capacity of full-scale simply supported RAC beams under bending. They observed that
on the average, the load-bearing capacity of RAC beams was almost equal to that of the
corresponding normal concrete beams, as shown in Figure 2.7. The mid-span deflection
under service loads, however, was up to 100% higher than that of the companion normal
concrete beams. The crack patterns and failure modes were similar.
Figure 2.6 Load-deformation of RAC versus NAC beams. Source: Fonteboa and Abella, 2007.
Figure 2.7 Cracking of RAC and NAC beams. Source: Ajdukiewicz and Kliszczewicz, 2007.

20
Although the available research work on plain RAC mechanical properties as well
as the behavior of RAC beams do not refute the use of RAC as a structural material,
widespread application of RAC, such as seismic, requires knowledge on behavioral
characteristics such as ductility, material behavior under biaxial and triaxial state of
stresses due to lateral confinement, loading rate, strength degradation, etc. The available
literature does not address these variables.
2.3 Behavior of Confined Concrete
In this section an introduction to the behavior of unconfined and confined concrete is
presented. Both active and passive confinement of concrete are discussed. A summary of
some of the previous experimental work on concrete confinement is presented as well.
2.3.1 Behavior of Unconfined Concrete under Monotonic Load
The compressive strength of concrete is usually obtained from cylinders with a height to
diameter ratio of 2. Figure 2.8 shows the typical stress-strain behavior of concrete
cylinders under axial compression. The strain at the maximum strength is approximately
0.002 in all the curves. Concrete tested in load-control setup usually fails abruptly
because it can not absorb the release in strain energy from the testing machine when the
load drops after the maximum stress. A displacement-control setup is therefore necessary
to trace the falling branch of the stress-strain curve.
For plain concrete in compression, a ductile behavior can not be achieved because
the concrete can not maintain the maximum stress with increasing deformation. However,
as long as the reduction in stress is gradual (usually for low and normal strength concrete)
some approximation of ductility is possible.

21
Ductility in reinforced concrete in compression requires ductile behavior of both
reinforcement and concrete. Ductility in the reinforcement is achieved if local buckling is
prevented. In concrete, the ductility can be achieved by close spacing of lateral
reinforcement and proper distribution of longitudinal reinforcement around the core
perimeter. Ductility is achieved when yielding of all reinforcements can be developed
prior to occurrence of crushing in concrete.
2.3.2 Behavior of Unconfined Concrete under Cyclic Load
While behavior of materials and members under cyclic loading is of a prime interest in
seismic design, the general load-deformation relationship under monotonic loading can
give an indication of strength and ductility under cyclic loading, as shown in Figure 2.9.
Since Sinha et al. (1964) it is well established that the envelope curve under repeated
loading is almost identical to the curve obtained from monotonic loading. While cyclic
loading tends to reduce the stiffness of the reinforced concrete structural member, the
strength and ductility should not be adversely affected (Park and Paulay, 1975).
Figure 2.8 Typical monotonic stress-strain behavior of concrete. Source: Park and Paulay, 1975.

22
Figure 2.9 Typical cyclic stress-strain behavior of normal concrete. Source: Sinha et al., 1964.
2.3.3 Behavior of Confined Concrete
The main factor influencing the seismic behavior of concrete is lateral confinement. The
term confinement refers to the restraining effect of lateral reinforcement (in the form of
hoops, spirals or hydrostatic pressure) which causes a change in the state of stresses from
uniaxial to multiaxial.
Mahgoub (1997) investigated two innovative confinement techniques for
columns: corrugated steel jacketing and flat steel jacketing with expansion anchors. Four
large scale concrete column-base models were tested under cyclic loading. Experimental
results showed that confinement enhanced the column ductility. Mechanism of
confinement can be simply explained as follows: due to application of the axial
compressive load, concrete expands laterally. This expansion causes internal cracking in
the concrete. Lateral pressure that confines the concrete controls the extent of internal
cracking and permits further axial deformation and increase in the volume prior to failure,
resulting in significant enhancement in ductility and appreciable increase in strength.
Confinement can be provided in either active or passive forms, as defined in the
following sub- sections.

23
2.3.3.1 Active Confinement. Richart et al. (1928) conducted one of the earliest
studies on the failure of concrete under combined stresses due to presence of confining
fluid pressure and found the following relationship for the strength:
21 fkff c (2.1)
where 1f is the enhanced strength, cf is unconfined strength,
2f is the lateral
hydrostatic pressure and k is lateral stress coefficient. The average value of k for the
tests they conducted was 4.1, as shown in Figure 2.10. Improvement in strength and
ductility can be seen from Figure 2.11.
2.3.3.2 Passive Confinement. In practice, concrete is usually confined by transverse
reinforcement in the form of either spirals or rectangular ties. At low levels of concrete
axial strain, the transverse reinforcement is hardly stressed, meaning the confinement is
not in action yet. As the transverse strains become so high that the concrete bears against
the lateral reinforcement, the confinement action comes into play. Therefore, lateral
reinforcement provides a passive confinement.
In passive confinement, if the confinement comes to action before the concrete
reaches its maximum stress, then the stress gain may be substantial. Upon yielding of the
lateral reinforcement, it can not provide additional confinement. When the confinement is
delayed (due to presence of shrinkage gap at lateral reinforcement-concrete core interface
or small Poisson ratio), its contribution maintains the ductility but the stress gain may be
negligible.
2.3.4 Mechanism of Confinement
Figure 2.12 qualitatively illustrates the effects of different types of confinement. The

24
amount of lateral reinforcement in each case is such that its yield force is equal to the
lateral hydrostatic pressure. Continuing effectiveness of lateral reinforcement appears to
depend upon its shape. The reason for the considerable difference between the
confinement by spirals and rectangular ties is illustrated in Figure 2.13 and 2.14. Due to
their shape, circular spirals are in axial hoop tension and provide a continuous confining
pressure around the circumference, which at large transverse strains approximates fluid
confinement. Ties however, can apply confining pressure only near the corners of the
section, because the concrete pressure in the lateral direction will tend to bend the ties
outward. The bending resistance of the ties may restrain the concrete to some degree but
this usually requires a large outward deflection, thus a significant portion of the cross
section may be unconfined. In the space between the ties, the confined area of the
concrete may even be further reduced due to the arching of concrete between the ties, as
shown in Figure 2.14.
Figure 2.10 Effect of hydrostatic pressure on concrete strength. Source: Richart et al., 1928.

25
2.3.5 Parameters Influencing Rectangular Confinement
As illustrated in Figure 2.12, confinement by rectangular lateral reinforcement has a little
effect on the stress-strain curve until the uniaxial strength of the concrete is approached.
The behavior of confined concrete at high strains depends upon the state of lateral
confining pressure (Sheikh and Uzumeri, 1982). There is a number of factors determine
this state of pressure, some of which are discussed in the following sub-sections.
Figure 2.11 Stress-strain curves from triaxial compression tests. Source: Richart et al., 1928.
Figure 2.12 Effect of confinement on strength and ductility. Source: Penelis and Kappos, 1997.

26
Figure 2.13 Confinement by circular spirals. Source: Park and Paulay, 1975.
Figure 2.14 Confinement by rectangular ties. Source: Park and Paulay, 1975.
2.3.5.1 Volumetric Ratio of Transverse Reinforcement. The ratio of the volume
of lateral reinforcement to the volume of concrete is an important factor which
determines the extent of lateral pressure on concrete. A high lateral reinforcement content
creates high confining pressure capability and consequently can result in higher strength
and ductility of the confined concrete.
2.3.5.2 Characteristics of Transverse Reinforcement. The yield strength and
stress-strain relation of the tie reinforcement determines the state of confining pressure
and specifies the maximum confining pressure possible. For steel with pronounced flat
yield plateau, when the yielding occurs, it permits the concrete to expand without
providing further confinement. The internal cracking of the concrete core then starts to

27
progress, resulting in drop of the strength. Transverse reinforcement with round-house
stress-strain shape, on the other hand, can keep providing restraints to the concrete
expansion at high lateral strains until either it fails in tension or the core concrete fails to
carry any load. This results in a concrete behavior which is more ductile than the one
obtained by using lateral reinforcement with flat yield plateau.
2.3.5.3 Tie Spacing. In a confined concrete member under compression, the clear
distance between the ties should theoretically approach zero to achieve a uniform
confinement throughout the length of the member. In a compressive member, the
effectively confined zone tends to arch between the ties as previously shown in Figure
2.14. If the tie spacing is large, a significant volume of the concrete can not be confined.
The area of the effectively confined concrete, therefore, seems to be directly influenced
by the spacing of lateral reinforcement; the larger the spacing the smaller would be the
confined core. Tie spacing also controls the local buckling of the longitudinal rebars.
2.3.5.4 Longitudinal Reinforcement. Longitudinal rebars are usually large in
diameter. The ratio of rebar diameter to the tie spacing is a measure of how the rebars can
effectively confine the concrete. However, the longitudinal rebars must be placed tightly
against the transverse reinforcement so that they can provide the confining reactions to it.
This would require each rebar to be supported by a bend of tie exactly conforming to the
its size. If the rebars are spread around the perimeter of the confined core, they will help
reduce the spalling of the concrete core. Close distance between each two adjacent
longitudinal rebars reduces the arch effect which leads to increase the effectively
confined area of the core.

28
2.3.5.5 Size of Ties. A larger size for lateral reinforcement should lead to more
effective confinement for a given unsupported length of a tie. If the flexural stiffness of
the tie bar is small, concrete pressure can easily bend the ties outward and the ties will not
effectively confine the concrete. Therefore this parameter is very significant, specially if
there are no longitudinal rebars to help the lateral reinforcement.
2.3.5.6 Other Factors. In addition to the variables discussed above, there are
several other factors such as concrete strength, Poisson ratio, loading rate, shrinkage,
creep, etc. which to less extent affect the behavior of the confined concrete. During
experimental work, the effect of these variables can be eliminated through using a
uniform mix, curing and loading procedure.
2.3.6 Concrete Models
No research work been carried out in order to determine the properties of confined RAC.
Although it may not be directly applicable, it would be very beneficial to review some of
the proposed models for confined normal concrete.
Various models for unconfined and confined concrete were proposed. Kent and
Park (1971) proposed one of the earliest models for concrete confined by rectangular
transverse reinforcement. Although this model did not capture any increase in the
strength due to the presence of transverse reinforcement, it showed an increase in
ductility. This work was the basis of further improvements by Scott et al. (1982) in which
an increase in the strength was noticed. Different investigators such as Sheikh and
Uzumeri (1982), Dilger et al. (1984), Ahmad and Shah (1985) and Mander et al. (1988)
carried out numerous experiments on small-scale or nearly full-size confined specimens.
It was observed that strength, as well as ductility of concrete substantially increase

29
whenever multiaxial state of stress is used, as shown in Figures 2.15 and 2.16.
The most commonly used models, among different proposed models, are those
suggested by Sheikh and Uzumeri (1982) and Mander et al. (1988). This is possibly
because they were based on adequate number of reliable experiments. The Sheikh and
Uzumeri (1982) set of equations is applicable to rectangular sections. The equations
express the gain of strength in terms of the effectively confined. The Sheikh and Uzumeri
(1982) proposed equations are as follows:
ss
occ
s fB
s
B
C
P
BK
2
2
22
21
5.51
73.21 (2.2)
scocc ABfP 285.0 (2.3)
6
1 1055.0 css fK (2.4)
c
ssoos
f
f
B
s
C '0.51
81.01
2
2 (2.5)
s
BZ
s4
3
5.0 (2.6)
where n is the number of longitudinal bars, s is the volumetric ratio of the transverse
reinforcement and sf is the tensile strength of the transverse reinforcement (usually
taken as the yield strength), cf is the compressive strength of unconfined concrete and sA
is the area of longitudinal reinforcement. Other parameters are demonstrated in Figure
2.15. Due to sudden failure of the specimen or due to failure of instrumentation devices,
it is difficult to obtain the curve beyond 85s . Because of lack of reliable data after this
point, the region proposed by their equation may not be really reliable.

30
The model proposed by Mander et al. (1988) is applicable to both rectangular and
circular cross sections with any transverse reinforcement type (i.e. spiral or rectangular
ties). This model can be expressed by the following equations:
c
yhse
c
yhse
cccf
fK
f
fKff
2
94.71254.2254.1
(2.7)
2
2
2
2
1
2
'1
6
'1
B
A
B
s
B
C
Ks
e (2.8)
151c
cccocc
f
f (2.9)
where s is the volumetric ratio of the transverse reinforcement, sA is the area of
longitudinal rebars, yhf is the yield strength of the transverse reinforcement and cf is the
strength of unconfined concrete. Other parameters are shown in Figure 2.16.
Although various researchers have proposed different models for confined
concrete (Table 2.6), they all agree that the strength and ductility can be improved if:
The lateral reinforcement bars are placed at a relatively close pitch;
The longitudinal rebars are well distributed around the perimeter;
The volume of lateral rebars to the volume of the concrete core is increased;
The yield strength of the transverse reinforcement is increased.
The monotonic stress-strain curve of concrete is assumed to practically coincide
with the envelope of cyclic loading stress-strain response (Kappos 1997), with some
discrepancies in the range of large inelastic deformation in which the monotonic curve is

31
assumed to be the enveloping curve. For practical purposes, usually the most important
aspect in modeling concrete under compression is the envelope curve rather than the
detailed shape of the reloading and unloading curves. The test results for confined
concrete by Mander et al. (1984) and other researchers support this assumption.
Figure 2.15 Concrete stress-strain model proposed by Sheikh and Uzumeri, 1982.
Figure 2.16 Concrete stress-strain model proposed by Mander et al., 1988.
The monotonic stress-strain curve of concrete is assumed to practically coincide
with the envelope of cyclic loading stress-strain response (Kappos 1997), with some
discrepancies in the range of large inelastic deformation in which the monotonic curve is
assumed to be the enveloping curve. For practical purposes, usually the most important

32
aspect in modeling concrete under compression is the envelope curve rather than the
detailed shape of the reloading and unloading curves. The test results for confined
concrete by Mander et al. (1984) and other researchers support this assumption.
2.4 Summary
Earlier investigations on mechanical properties and durability of RAC are reviewed. Plain
RAC with 100% aggregate replacement has 30% less strength than NAC but with the
use of low water/cement ratio and pozzolans like fly ash, the strength can significantly be
enhanced. Although durability is not a major issue in RAC, the use of pozzolans can
enhance it. The very limited literature on behavior of RAC members is presented as well.
RAC beams can exhibit load-carrying capacities comparable to normal concrete beams.
Table 2.6 Proposed Models for Confined Normal Concrete
Constitutive Model Rising Branch Softening
Rate cc
residual
f
f
Park et al. (1982)
2
2
cc
c
cc
ccKf
cc50
5.0 2.0
Sheikh and Uzumeri
(1982)
2
11
2
s
c
s
ccKf
s
bcs75.0
5.0
3.0
Kappos (1991)
2
2
cc
c
cc
ccKf
cc50
5.0 0.25
Saatcioglu and Razvi
(1992)
K
cc
c
cc
ccfK
21/12
2)1( cc
ccf
85
15.0 2.0
Hoshikuma et al.
(1997)
1
11
n
cc
ccc
nE ;
ccccc
ccc
fE
En
c
yh
sf
f2'
2.11
0.5

33
CHAPTER 3
EXPERIMENTAL WORK
3.1 General
To study different variables influencing the behavior of confined RAC, an extensive
experimental investigation was carried out. Forty-four reinforced RAC columns, 10
inches by 10 inches in section and 32 inches in height, were tested under concentric axial
loading. The core dimensions (measured from center to center of the exterior ties) were
kept constant at 8 x 8 inches for all column specimens.
3.2 Materials
3.2.1 Original Concrete and Recycled Coarse Aggregate (RCA)
The RCA was obtained from five cubic yards of a discarded concrete mass. To ensure
easy flow of fresh RAC through the reinforcements, the maximum RCA size was limited
to 3/8 inch.
Figure 3.1 briefly shows the crushing machinery utilized to produce the RCA. The
crushing process was the same as crushing natural stones. The waste concrete was fed to
rotary crushers and the product was passed through stacks of shaking screens to obtain
the size of interest. Larger aggregates were automatically fed back to the crushers
The RCA stockpile was further screened to separate the fines (i.e., smaller than
#8). Sieve analysis was carried out to make sure that the gradation of the RCA conforms
to the ASTM C33-3 requirements for size of coarse aggregates, as presented in Table 3.1.
Several 4 x 8 inch cylinders were sampled from the original concrete. The specimens

34
were cured for 7 days under standard laboratory conditions. At the age of 21 and 28
days the cylinders were tested for compressive strength where average strengths of 4.24
and 4.42 ksi were obtained, respectively, as shown in Figure 3.2 and Table 3.2. The
maximum strength was almost achieved at the age of 21 days, the age at which the RCA
was produced. Fast strength gain was due to the use of accelerator in concrete mix
design.
Figure 3.1 Weldon Materials crushing facilities, New Jersey.
Several 4 x 8 inch cylinders were sampled from the original concrete. The
specimens were cured for 7 days under standard laboratory conditions. At the age of 21
and 28 days the cylinders were tested for compressive strength where average strengths
of 4.24 and 4.42 ksi were obtained, respectively, as shown in Figure 3.2 and Table 3.2.
The maximum strength was almost achieved at the age of 21 days, the age at which the
RCA was produced. Fast strength gain was due to the use of accelerator in concrete mix.

35
Table 3.1 Results of RCA Sieve Analysis
Sieve
designation Percent passed
1
ASTM C33
requirement
3/8” 93 85-100
#4 16 10-30
#8 1 0-10
#16 0 0-5
1 average of three samples of 1000 grams
Table 3.2 Compressive Strength of the Original Concrete
Specimen number
21-day
compressive
strength (ksi)
28-day
compressive
strength (ksi)
1 4.27 4.42
2 4.32 4.49
3 4.24 4.35
4 4.12 4.40
Average 4.24 4.42
0
1
2
3
4
5
0 0.0025 0.005 0.0075 0.01 0.0125Strain
Str
ess
(ksi
)
NAC Cylinder #1
NAC Cylinder #2
Figure 3.2 Stress-strain curves of the original concrete.

36
3.2.2 Column RAC mix
A small laboratory-scale 6 CF electric concrete mixer was used for mixing. To ensure
homogeneity of the concrete, only 2.25 CF concrete was mixed in each load, enough to
cast one column and a few 4 x 8 inch cylinder specimens at a time.
In order to improve the quality of RAC, the “Two-Stage Mixing Approach
(TSMA)” recommended by Tam et al. (2005) was employed, as shown in Figure 3.3.
Through experiments, Tam et al. (2005) showed that their proposed mixing procedure
improved the strength of aggregate-paste Interfacial Transition Zone (ITZ), as illustrated
in Figure 3.4, and hence improved the strength. During the first stage of mixing, TSMA
uses half of the required water for mixing leading to formation of a thin layer of cement
slurry on the surface of RCA which will permeate into the porous old cement mortar,
filling up the old cracks and voids. At the second stage of mixing, the remaining water is
added to complete the concrete mixing process.
The RAC mix proportions and physical properties of the constituent materials are
presented in Tables 3.3 and 3.4, respectively. The mix design was obtained through a
trial-and-adjustment procedure such that a 21-day compressive strength of 4.25 ± .25 ksi
can be achieved while the slump remains about 5 inches. This slump was necessary to
ensure easy flow of the fresh RAC through the reinforcement. In the absence of high
early strength cement, 20% of the cement content was replaced by silica fume. With the
use of accelerators, most of the concrete strength was achieved within the first two
weeks, as shown in Figure 3.5. An average compressive strength of 4.3 ksi was obtained
which was very close to the strength of original concrete. Figure 3.6 shows the mixing
arrangement.

37
Table 3.3 RAC Mix Proportions
Cement
Type I (lb)
Silica
Fume (lb) RCA (lb)
Sandclay
(lb) Water (lb)
Accelerator1
(oz)
Water
reducer2 (oz)
12.25 3.25 60.50 53.00 10.25 4 6
1PRO-SET
® CaCl,
2 Sikament
® 86
Table 3.4 Physical Properties of Recycled Aggregates
Property Bulk
Specific Gravity
SSD
Specific Gravity
Apparent
Specific Gravity
Water
Absorption
Quantity 2.32 2.37 2.49 5.67%
Figure 3.3 “TSAM” and normal mixing approach. Source: Tam et al., 2005.
Figure 3.4 Improvement of ITZ by employing “TSMA”. Source: Tam et al., 2005.
RCA
RCA
RCA
RCA
ITZ (no voids) Interfacial Transition Zone
Cement Mortar Cement Mortar
Voids

38
0
1
2
3
4
5
3 7 14 21Age (days)
Co
mp
ress
iv S
tren
gth
(k
si)
Sample #1
Sample #2
Sample #3
Sample #4
Average
Figure 3.5 Compressive strength of the finalized RAC mix.
Figure 3.6 Mixing arrangement.
3.2.3 Plain RAC Strength
On the average, three 4 x 8 inch cylinder samples were sampled from each column batch.
The samples were cured under standard condition and about seven days after testing each
column, their stress-strain curves were obtained using the same MTS815 loading. It was
not possible to obtain the stress-strain curves on the same day that the column was tested

39
because the MTS815 machine could not conveniently be setup for cylinder testing
frequently. The delay in obtaining stress-strain curves, however, could not make a
significant difference because most of the strength had been achieved due to the use of
accelerator and silica fume. This is shown in Table 3.5 where the average compressive
strengths on the day of column testing and on the day of obtaining stress-strain curves are
compared. A Forney QC 50 machine, as shown in Figure 3.7, was used to solely measure
the strength of RAC cylinders while the stress-strain curves were later obtained using the
MTS815 loading unit. Typical stress-strain curves of the plain RAC cylinders are shown
in Figure 3.8. The column designations are described in section 3.3.4.
Table 3.5 Compressive Strengths of Cylinder Samples on the Day of Column Testing vs.
the Strengths on the Day of Obtaining Stress-Strain Curves
Column
Strength (ksi) Percent
difference
(%) On the day of
column testing
On the day of obtaining
stress-strain curves
A1-1 4.31 4.26 -1
A2-1 4.16 4.12 -1
A3-1 4.41 4.26 -4
B1-1 4.12 4.23 3
B2-1 4.22 4.18 -1
B3-1 4.30 4.36 1
C1-1 4.15 4.23 2
C2-1 4.25 4.34 2
C3-1 4.36 4.45 2
A1-2 4.32 4.41 2
A2-2 4.31 4.35 1
A3-2 4.05 4.05 0
B1-2 4.51 4.42 -2
B2-2 4.41 4.32 -2
B3-2 4.11 4.23 3
C1-2 4.10 4.06 -1
C2-2 4.17 4.09 -2
C3-2 4.01 4.13 3

40
Figure 3.7 Testing machine used for measuring strength of concrete cylinders.
0
1
2
3
4
5
0.0000 0.0025 0.0050 0.0075 0.0100Axial Strain
Str
ess
(ksi
)
RAC Cylinder #1
RAC Cylinder #2
RAC Cylinder #3
test terminated
significant damage
Figure 3.8 Typical stress-strain curves for plain RAC cylinders.
3.2.4 RAC Cylinders for Developing Stress-Strain model
RAC cylinders with wide range of strength were made, cured and tested to obtain their
stress-strain curves, as presented in Chapter 4. Target strengths from 2500 psi to 7000 psi
were considered. The proportions of these mixes were obtained by modifying the

41
cementitious material as well as the water, without changing the quantity of aggregate.
Sufficient Water Reducer admixture was used to obtain the desired workability, as shown
in Table 3.6.
Table 3.6 Mix Proportions for Target Strengths of 2500 psi to 7000 psi
Cylinder
Designation
Cement
Type I
(lb)
Silica
Fume
(lb)
RCA
(lb)
Sandclay
(lb)
Water
(lb)
Accelerator1
(oz)
Water reducer2
(oz)
A1 and A2 12.25 -- 60.50 53.00 14.00 6 --
A3 and A4 12.25 -- 60.50 53.00 13.00 6 --
A5 and A6 12.25 -- 60.50 53.00 12.00 6 --
A7 and A8 12.25 -- 60.50 53.00 11.00 6 4
A9 to A11 12.25 3.25 60.50 53.00 10.25 4 6
A12 and A13 14.00 3.25 60.50 53.00 10.25 4 6
A14 and A15 15.00 3.25 60.50 53.00 10.25 4 6
A16 and A17 17.00 3.25 60.50 53.00 11.00 4 8
A18 and A19 18.00 4.00 60.50 53.00 12.00 4 10
A20 and A21 21.00 4.00 60.50 53.00 12.00 4 12
A22 and A23 24.00 4.00 60.50 53.00 13.00 4 12
1PRO-SET
® CaCl,
2 Sikament
® 86
3.2.5 Longitudinal and Lateral Reinforcement
Grade 60 deformed steel rebars of #3 through #6 were used to provide a constant
longitudinal reinforcement content of approximately 1.7% of the columns gross cross-
sectional area. This value represent what usually is utilized in construction practice.
Twelve 8-inch long samples of #3, #4 and #5 of the longitudinal rebar were tested for
tension using a MTS 810 servo-hydraulic uniaxial loading unit, as shown in Figure 3.9. It
is worth mentioning that steel has a very similar behavior in tension and compression.

42
Therefore, the results obtained for the steel under tension were assumed to be the same
for compression. Some important mechanical properties of the longitudinal reinforcement
samples are presented in Table 3.7. The stress-strain curves of the longitudinal
reinforcement samples are shown in Figure 3.10.
Smooth 3/16-inch cold-rolled galvanized steel bars were used for the tie
reinforcement. The 3/16-inch bar is relatively easy to bend which is a significant
advantage over using larger sizes. Twelve 8-inch long samples were randomly taken from
the wire bundles (Figure 3.9). Based on ASTM E8, tension tests were then carried out on
these samples using the servo-hydraulic uniaxial MTS 810 loading unit. Some important
mechanical properties of the transverse steel samples are presented in Table 3.8. The
stress-strain curves of the tie steel are shown in Figure 3.10.
Figure 3.9 (left) Longitudinal rebars samples, (right) Tie steel samples.

43
0
20
40
60
80
100
120
0 0.05 0.1 0.15 0.2 0.25Strain
Str
ess
(ksi
)
Sample 1
Sample 2
Sample 3
Sample 4
Sample 5
average yield stress= 70 ksi
0
20
40
60
80
0 0.05 0.1 0.15 0.2 0.25Strain
Str
ess
(ksi
)
Sample 1
Sample 2
Sample 3
Sample 4
Sample 5
average yield stress= 63 ksi
Figure 3.10 Tensile behavior of longitudinal rebars (left) and tie steel (right).
Table 3.7 Mechanical Properties of Longitudinal Reinforcement
Sample
Elastic
Modulus
(ksi)
Yield
Stress
(ksi)
Maximum
Stress
(ksi)
Yield Strain
(ksi)
Maximum
Strain
1 (bar #3) 29700 70 97 .0021 >.225
2 (bar #3) 30400 71 103 .0021 >.225
3 (bar #3) 29600 68 97 .0020 >.225
4 (bar #4) 29400 70 98 .0021 >.225
5 (bar #4) 30200 72 102 .0020 >.225
average 29900 70 99 .0210 >.225
Table 3.8 Mechanical Properties of Tie Reinforcement
Sample
Elastic
Modulus
(ksi)
Yield
Stress
(ksi)
Maximum
Stress
(ksi)
Yield Strain
(ksi)
Rupture
Strain
(ksi)
1 30200 64 72 .0025 >.12
2 29800 59 70 .0025 >.12
3 29000 65 75 .0023 >.12
4 29100 62 72 .0024 >.12
5 30100 63 74 .0022 >.12
average 29600 63 73 .0024 >.12

44
3.3 Fabrication of Columns
Forty-four columns were cast in sets of five. In order to obtain a uniform distribution of
stresses in the instrumented region and to provide adequate length for the development of
failure mechanism, a width-to-length ratio of 1/3 was considered. The columns were 32
inches high and had square cross section of 10 inches by 10 inches.
3.3.1 Forms
15/32-inch plywood was used to make the forms, as shown in Figure 3.11. For easy
removal of the forms, the walls were first covered in 6 mil plastic sheet. Through practice
it was found that the plastic sheet may not be appropriate as it would get ripped by the
cages during placement. Painting and oiling the plywood was a better alternative.
Figure 3.11 Plywood forms.
3.3.2 Casting and Curing
Each column was cast vertically in six layers. A concrete vibrator was used to thoroughly
consolidate the core and the cover concrete. The columns were kept under laboratory
conditions for 24 hours. The forms were then removed and the columns were properly

45
covered by plastic sheets. After four days the covers were removed and the columns
were exposed to laboratory condition. The age of the columns at the time of testing varied
between 21 days to 28 days. The forms were sufficiently painted prior to each use.
3.3.3 Reinforcing Cages
Three different lateral reinforcement configurations shown in Figure 3.12 were under
consideration. Such configurations are frequently used in construction practice.
Configuration “A” had four longitudinal rebars and one tie while configuration “B” had 8
longitudinal rebars with two ties at the same level. Configuration “C” had 12 longitudinal
rebars with three ties. These uppercase letters were used to designate the columns. For all
of the columns, the size of cages from center to center of the outer tie was 8 x 8 inches.
The length of the longitudinal rebars was 30 inches. A one-inch thick concrete cover was
considered for the top and bottom of the columns, as shown in Figure 3.13. This was
necessary to ensure that the longitudinal rebars were not in direct contact with the load
which may cause local rebar buckling. Details of reinforcement are presented in Table
3.9. From the table, by utilizing three different tie spacings, quite wide range of
transverse reinforcement volumetric ratio (i.e., volume of the transverse reinforcement to
the volume of the core between two adjacent ties) was achieved. In order to facilitate the
development of yield strength of the steel wires, 135-degree hooks with at least 3-inch
extension were provided. In total, more than 2300 ties were fabricated. Sample cages are
shown in Figure 3.14.

46
Figure 3.12 Tie configurations.

47
Figure 3.13 Tie spacing and end extra reinforcement.
Figure 3.14 Example cages.

48
3.3.4 Column Designation
In the alphanumeric characters in the titles of the columns (e.g., B2-4) the letter
represents the lateral reinforcement pattern (i.e., A, B or C, as previously shown in Figure
3.12). The first number after the letter indicates the tie spacing in inches (i.e., 1, 2 or 3, as
shown in Figure 3.13). The number after the dash sign is the specimen sequence number.
Table 3.9 Details of the Specimens
specimen
longitudinal steel transverse steel Concrete
Strength
sA (in2) gross (%)
core (%) s (in) s (%) cf (ksi)
A1-1 1.76 0.018 .028 1 0.88 4.26
A1-2 1.76 0.018 .028 1 0.88 4.41
A1-3 1.76 0.018 .028 1 0.88 4.17
A1-4 1.76 0.018 .028 1 0.88 4.28
A1-5 1.76 0.018 .028 1 0.88 4.29
A2-1 1.76 0.018 .028 2 0.44 4.12
A2-2 1.76 0.018 .028 2 0.44 4.35
A2-3 1.76 0.018 .028 2 0.44 4.28
A2-4 1.76 0.018 .028 2 0.44 4.46
A3-1 1.76 0.018 .028 3 0.29 4.26
A3-2 1.76 0.018 .028 3 0.29 4.05
A3-3 1.76 0.018 .028 3 0.29 4.24
A3-4 1.76 0.018 .028 3 0.29 4.16
B1-1 1.68 0.017 .026 1 1.51 4.23
B1-2 1.68 0.017 .026 1 1.51 4.42
B1-3 1.68 0.017 .026 1 1.51 4.34
B1-4 1.68 0.017 .026 1 1.51 4.21
B1-5 1.68 0.017 .026 1 1.51 4.39
B2-1 1.68 0.017 .026 2 0.75 4.18
B2-2 1.68 0.017 .026 2 0.75 4.32
B2-3 1.68 0.017 .026 2 0.75 4.18
B2-4 1.68 0.017 .026 2 0.75 4.35
B2-5 1.68 0.017 .026 2 0.75 4.47

49
Table 3.9 Details of the Specimens (Continued)
specimen
longitudinal steel transverse steel Concrete
Strength
sA (in2) gross (%)
core (%) s (in) s (%) cf (ksi)
B3-1 1.68 0.017 .026 3 0.50 4.36
B3-2 1.68 0.017 .026 3 0.50 4.23
B3-3 1.68 0.017 .026 3 0.50 4.38
B3-4 1.68 0.017 .026 3 0.50 4.42
B3-5 1.68 0.017 .026 3 0.50 4.16
C1-1 1.68 0.017 .026 1 2.10 4.23
C1-2 1.68 0.017 .026 1 2.10 4.06
C1-3 1.68 0.017 .026 1 2.10 4.26
C1-4 1.68 0.017 .026 1 2.10 4.17
C1-5 1.68 0.017 .026 1 2.10 4.28
C2-1 1.68 0.017 .026 2 1.05 4.34
C2-2 1.68 0.017 .026 2 1.05 4.09
C2-3 1.68 0.017 .026 2 1.05 4.41
C2-4 1.68 0.017 .026 2 1.05 4.27
C2-5 1.68 0.017 .026 2 1.05 4.19
C3-1 1.68 0.017 .026 3 0.70 4.45
C3-2 1.68 0.017 .026 3 0.70 4.13
C3-3 1.68 0.017 .026 3 0.70 4.19
C3-4 1.68 0.017 .026 3 0.70 4.33
C3-5 1.68 0.017 .026 3 0.70 4.25
Max 4.47
Min 4.05
Average 4.27
3.3.5 Glass Fiber Reinforced Polymer (GFRP) confinement
It was intended to localize the failure to the centrally instrumented region of the columns
as much as possible. For this purpose additional ties were considered for each end of the
column specimens, as shown in Figures 3.13 and 3.14. For Type B and C columns where

50
spacing was 1 inch, no extra ties were provided because practically there was no
sufficient room available for additional ties. The column ends were further confined with
two layers of 6-inch wide SikaWrap® GFRP laminates, as shown in Figure 3.15.
Depending on the smoothness of the surface, Sikadur Hex 300®
or Sikadur Hex 30®
epoxies were used to bond the laminates to the column surface. As shown in Chapter 4,
the utilized technique was relatively successful and in many columns most of the failures
took place within the instrumented region. The epoxy used to bond the laminates was a
hazardous material and extreme precautions had to be exercised in its application.
Figure 3.15 Additional end confinement using GFRP laminates.
3.4 Instrumentation
3.4.1 External Instrumentation
Direct Current Differential Transformers (DCDTs) were utilized to monitor the axial
deformation of the columns. In order to eliminate end effects, only 20 inches of the mid
region of the columns was instrumented (Figure 3.16). Individual DCDTs were first
assigned to monitor the axial deformation on each side of the columns because it was

51
thought that the readings might be significantly different. During the first few tests,
however, it was observed that the readings are very close so there was no real need for
more than one measurement.
A holding frame was fabricated to place the DCDTs in the position of interest.
Since the lateral expansion of the column could break the frame or cause disturbance in
readings, compressive springs were placed on the frame such that the frame could expand
freely upon lateral expansion of the columns. The DCDTs were placed some distance
away from the specimen to safeguard them from disturbance of the falling debris. The
sensors were frequently calibrated during the experiments.
For monitoring axial deformations of the RAC cylinders, an average measurement
obtained by two 4-inch extensometers was used, as shown in Figure 3.16.
Figure 3.16 Measuring axial deformation of cylinder by a pair of extensometers.
3.4.2 Internal Instrumentation
In the absence of more resilient and environment-tolerant measurement gauges, some of
the ties were instrumented using Vishay Micro-Measurements CEA-06-240UZ-120

52
electrical strain gauges, as shown in Figure 3.17. CEA strain gauges are a general-
purpose family of strain gauges encapsulated in polyimide which are widely used in
advance experimental stress analysis. This type of strain gauges are very delicate and
may not be really appropriate for use in concrete work where it is exposed to hard objects
(coarse aggregates, rod and vibrator for proper consolidation, etc).
Surface preparation and installation of the electrical strain gauges on the small
surface of 3/16-inch ties required utmost precision and experience. The small diameter of
ties compared to the width of strain gauges could create bonding issues. The strain gauge
edges were trimmed as much as possible. Some trial installations on 8-inch long
specimens were conducted and tested under the MTS 810 loading unit, at a slow rate of
15 lb per second. The data was collected using a Micromeasurement P3®
Strain Indicator,
as shown in Figure 3.18. In some of the trial specimens, premature failure of the
soldering tabs or delamination of the strain gauge occurred. To avoid losing data during
testing the RAC columns due to such incidents, one additional strain gauge was installed
on each tie. Figure 3.19 shows the location of strain gauges on the ties. In each column
one tie was instrumented. In practice, it was found that this type of strain gauges was not
suitable for the purpose as installation and handling was difficult. Only columns with
sequence number “1” were instrumented.
Figure 3.17 CEA-06-240UZ-120 electrical strain gauge.

53
0
10
20
30
40
50
60
70
80
0.00 0.01 0.02 0.03Strain
Str
ess
(ksi
)
0.41%
Strain gauge still functional after this point
0.2% offset method
Figure 3.18 Examination of bond quality of a strain gauge installed on 3/16” steel wire.
Figure 3.19 Location of strain gauges on ties.
3.5 Test Setup
3.5.1 Capping
To ensure good contact with the loading heads, the column ends were capped with hydro-
stone®
gypsum cement, as shown in Figure 3.20. This product is self-leveling when
poured and its strength can exceed 10,000 psi after only few hours. The concrete
cylinders were capped with Sulphur.
3.5.2 Positioning
Ceiling crane was used to lift the column specimens, which weighed approximately 320
lbs each. To ensure uniform load applications, one-inch thick steel plates were placed

54
between the column and the MTS815 upper head.
3.5.3 Loading Unit and Data Acquisition System
All concrete specimens were concentrically loaded in the 1000-kips MTS815 servo-
hydraulic loading unit, as shown in Figure 3.20. All test loads and actuator positions were
controlled via MTS TestStar® digital controller. Automatic loading processes were also
programmed and introduced to the MTS machine through TestWare® software.
Figure 3.20 Application of hydro-stone®
gypsum cement.
The load and displacement generated by the loading unit as well as the DCDT and
the internal sensor data were fed to a System 5000® data acquisition hardware which was
programmed using StrainSmart® software. The data were recorded at 10-second and
0.01-second intervals for the low-rate and fast-rate loadings, respectively.
3.6 Loading Procedure
A 2000 lb compressive load was initially applied on each column and all the sensors
zeroed. Then at a rate of 1000 lb per second, up to 25% of the expected strength, a
loading-unloading loop was applied on each column to further consolidate the hydro-

55
stone caps. The main loading stage then was conducted. In order to obtain the full
range of load-displacement curves, a displacement-control loading approach was utilized.
In the case of static loading, the columns were pushed to failure at a strain rate of 1.6
10 -5
in/in/s. The repeatability of test results was verified by testing two columns of each
type. Monotonic tests were also conducted using higher straining rate of 1.6 10 -2
in/in/s. Similar to static loading, two columns of the same type were tested to ensure the
repeatability of the results.
Figure 3.21 1000-kip MTS815 servo-hydraulic loading unit and other hardware.
In the case of cyclic loading, the MTS815 unit was programmed to apply five
cycles such that the loading-unloading loops were uniformly distributed across the axial
deformation range. The cycles were applied at a rate of 1.6 x 10 -1
in/in/s that is the strain
rate normally used in seismic testing (Kappos, 1997). Seven columns were tested under
cyclic loading: A1-5, B1-5, B2-5, B3-5, C1-5, C2-5 and C3-5. Testing of column B2-5
had to be prematurely terminated due to technical difficulties with the MTS loading unit.

56
CHAPTER 4
ANALYSIS AND DISCUSSION OF TEST DATA
Results of the experimental work are presented in this chapter, primarily in the form of
force-deformation and stress-strain curves. Both behaviors of cover and core concrete are
discussed in details and their individual contributions to the load bearing are calculated.
4.1 Test Observations
4.1.1 Plain RAC Cylinders
Figure 4.1 shows the typical stress-strain curve of RAC cylinders versus a few widely
used models for normal concrete. By comparing the RAC experimental stress-strain
curve and the theoretical curve for normal concrete the following statement can be made:
RAC cylinders demonstrate relatively smaller modulus of elasticity;
The strain corresponding to the maximum strength is approximately 0.0025 for
RAC that is appreciably more than the average value of 0.002 for normal
concrete;
Compared to normal-strength normal aggregate concrete, the change in modulus
of elasticity (i.e., variation in the slope of the ascending branch) is less significant;
The cracking and compressive failure of the plain RAC cylinders were not
different from those of normal concrete under compression. Most often shear-type
failure was observed for both, as shown in Figure 4.2.
4.1.2 Reinforced RAC Column
Separate DCDTs were used to measure the axial deformations on each side of the
columns. The differences between the readings were insignificant, as shown in Figure 4.3
for column B1-2. This was primarily due to the concentric nature of the loading,

57
precision in fabrication of the reinforcement cage and thorough consolidation of the
concrete. Due to the fear of damaging the DCTDs, they were removed at relatively small
axial deformations.
0
1
2
3
4
5
0.0000 0.0010 0.0020 0.0030 0.0040 0.0050
Strain
Str
ess
(ksi
)
RAC Cylinder (fc=4.19 ksi)
Todeschini (1964)
Popovic (1973)
Kent-park (1971)
Strain at maximum stress=0.0026
Ec=2060 ksiStrain at maximum stress=0.0020
Ec=3600 ksi
Figure 4.1 RAC stress strain curves vs. models for normal concrete.
Figure 4.2 Typical failure of RAC and normal concrete cylinders.

58
0
100
200
300
400
500
600
0 0.1 0.2 0.3 0.4 0.5
Axial Deformation (in)
Axia
l L
oad
(K
ips)
B1-2-DCDT-South
B1-2-DCDT-West
B1-2-DCDT-East
B1-2-DCDT-North
Average
Figure 4.3 Axial deformation of column B1-2.
Typical failure and load-deformation of the columns under static loading were
similar to those shown in Figures 4.4 to 4.6 for columns A1-1, B2-2 and C3-2 tested. The
behavior of the RAC columns was continuously observed during the testing, particularly
for development of cracks in vertical direction. The general behavior of the RAC
columns was similar to that of normal reinforced concrete columns under axial load,
reported by various researchers (Sargin 1971, Kent and Park 1971, Vallenas et al. 1977,
Sheikh and Uzumeri 1982, Mander 1984). The first visual indication of distress in the
columns was the development of vertical cracks in the corners. Very similar to the
reported value of 0.0015 to 0.0020 for normal concrete, the vertical cracks started
appearing at all four corners of the columns at a longitudinal strain of approximately
0.0020. As the loading proceeded, faster growth of the vertical cracks occurred. These
cracks, however, started widening at a longitudinal strain of approximately 0.0030 and
large slabs of the cover concrete gradually started spalling off in a rather simultaneous
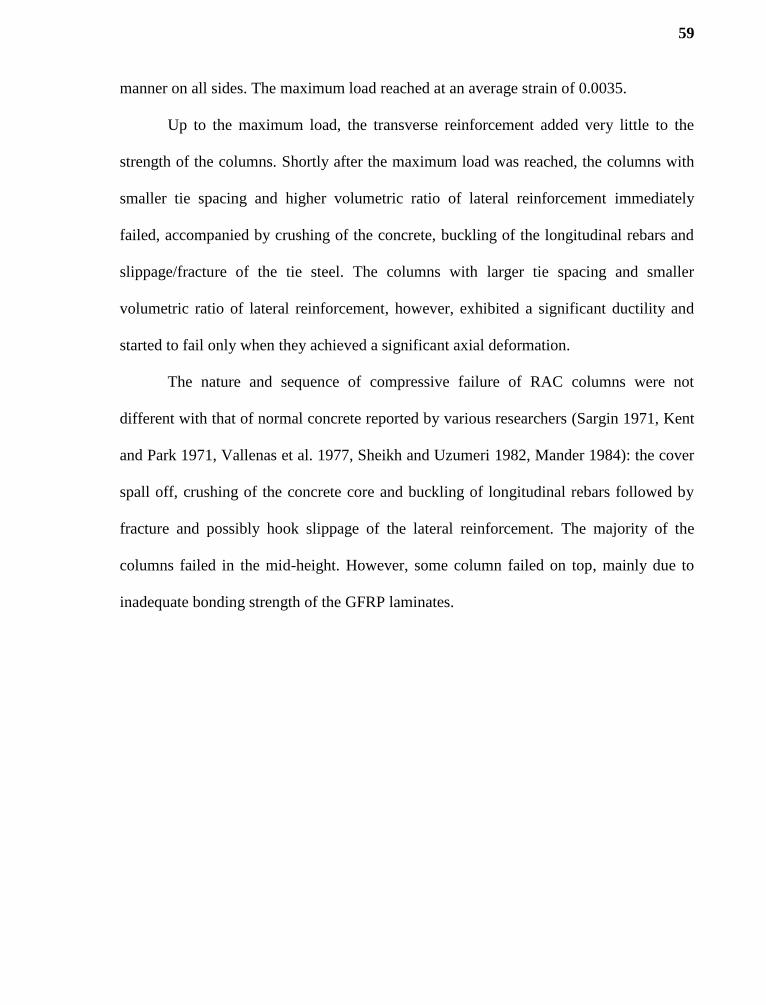
59
manner on all sides. The maximum load reached at an average strain of 0.0035.
Up to the maximum load, the transverse reinforcement added very little to the
strength of the columns. Shortly after the maximum load was reached, the columns with
smaller tie spacing and higher volumetric ratio of lateral reinforcement immediately
failed, accompanied by crushing of the concrete, buckling of the longitudinal rebars and
slippage/fracture of the tie steel. The columns with larger tie spacing and smaller
volumetric ratio of lateral reinforcement, however, exhibited a significant ductility and
started to fail only when they achieved a significant axial deformation.
The nature and sequence of compressive failure of RAC columns were not
different with that of normal concrete reported by various researchers (Sargin 1971, Kent
and Park 1971, Vallenas et al. 1977, Sheikh and Uzumeri 1982, Mander 1984): the cover
spall off, crushing of the concrete core and buckling of longitudinal rebars followed by
fracture and possibly hook slippage of the lateral reinforcement. The majority of the
columns failed in the mid-height. However, some column failed on top, mainly due to
inadequate bonding strength of the GFRP laminates.

60
South and East sides North and West sides
Figure 4.4 Failure of Column A1-1 under static loading.

61
South and East sides North and West sides
Figure 4.5 Failure of Column B2-2 under static loading.

62
South and East sides North and West sides
Figure 4.6 Failure of Column C3-2 under static loading.

63
4.2 Contribution of Cover and Core Concrete
4.2.1 Spalling Mechanism
While the cover is still in place, it can be assumed that the longitudinal strains in the
cover and the core are equal (Kent and Park 1971, Vallenas et al 1977, Sheikh and
Uzumeri, 1982). In the early stages of loading where the longitudinal strains are very
small, due to small Poisson’s ratio of concrete the lateral expansion of the column is
consequently very small. Therefore, the lateral confinement provided by the transverse
reinforcement at this stage is insignificant and the column behaves as if there is no lateral
reinforcement. With the increase in the longitudinal strain, the lateral strain of the column
starts increasing. Since the core is restrained against expansion by the transverse
reinforcement, a gradual separation occurs at the core-cover interface. After this point,
the core and cover start behaving differently. The cover behaves like a brittle-slender
component under compression. It starts unloading until its contribution to carrying the
load completely diminishes. From this point onward, the load is entirely carried by the
core and the behavior is primarily influenced by the lateral reinforcement.
4.2.2 Transition of Stresses
Determining the axial strain at which the cover was no longer effective required
continuous visual monitoring, tapping the column with a small hammer and interpretation
of the strain in lateral reinforcements. For normal concrete columns, Park and Paulay
(1975) suggested that the cover can be assumed ineffective at u50 , the strain at which the
stress drops to 50% of the maximum stress in concrete cylinders. The u50 of the normal-
strength RAC cylinders tested in this study was around 0.0050 while the strain at which

64
the complete cover spalled off was in a wider range of 0.0040 to 0.0070. For normal
concrete, various researchers reported quite different values for strain at which the cover
becomes completely ineffective. While Vallenas et al. (1977) reported a strain
approximately 0.0100, Sheikh and Uzumeri (1982) observed a strain between 0.004 and
0.005.
Table 4.1 presents the axial strains corresponding to different cracking conditions
of the RAC columns: the strains at which first vertical crack started appearing and the
strains at which the cover became completely ineffective. The cracking strains are in fact
the axial strains at which the strain in the outer ties started increasing. The strains were
obtained by interpretation of the strain history of columns shown with * sign in Table 4.1.
For other columns, it was assumed that the strains are the same. The tie strains are plotted
against column longitudinal strains in Figure 4.7. From the figure, an average of 0.0020
can be assumed as the strain at which the ties undergo tensile stresses which means the
onset of passive confinement action. Before this stage, it can be assumed that the axial
stresses are uniformly carried by the core and cover concrete. After the complete spall,
the core is completely responsible for carrying the axial stresses. Between the strains
corresponding to “hair cracking” and “complete spall”, there is a “transition” zone where
the stresses are carried by a complicated combination of the core and the cover. Since the
exact shape of the transition is not possible to determine, conservatively, a simple linear
shape may be assumed. Figure 4.8 schematically illustrates the stress transition
mechanism and the stress-strain behavior of the confined RAC (curve OABC).

65
Table 4.1 Strains Corresponding to Cracking Condition of RAC Columns
Column cf (ksi) s (%) Crack Initiation Complete Spall
A1-1* 4.26 0.88 0.0019 0.0037
A1-2 4.41 0.88 0.0019 0.0035
A2-1* 4.12 0.44 0.0021 0.0033
A2-2 4.35 0.44 0.0021 0.0036
A3-1* 4.26 0.29 0.0018 0.0031
A3-2 4.05 0.29 0.0018 0.0033
B1-1* 4.23 1.51 0.0022 0.0058
B1-2 4.42 1.51 0.0022 0.0053
B2-1* 4.18 0.75 0.0019 0.0052
B2-2 4.32 0.75 0.0019 0.0048
B3-1* 4.36 0.50 0.0016 0.0042
B3-2 4.23 0.50 0.0016 0.0038
C1-1* 4.23 2.10 0.0023 0.0070
C1-2 4.06 2.10 0.0023 0.0053
C2-1* 4.34 1.05 0.0019 0.0047
C2-2 4.09 1.05 0.0019 0.0043
C3-1* 4.45 0.70 0.0021 0.0043
C3-2 4.13 0.70 0.0021 0.0046
Average: 0.0020 .00397 .0040

66
0
0.0004
0.0008
0.0012
0.0016
0.002
0 0.001 0.002 0.003 0.004 0.005 0.006 0.007 0.008
Axial Strain
Tie
Str
ain
A1-1
A2-1
A3-1
B1-1
B2-1
B3-1
C1-1
C2-1
C3-1
The average strain at which
vertical hair cracks appear on
the RAC columns=0.0020
Figure 4.7 Tie strain versus longitudinal strains.
Figure 4.8 Concrete contribution and stress transition zone.

67
4.2.3 Concrete Contribution
In order to obtain the stress-strain relationship for RAC under axial compression rather
than that of the composite section, it was necessary to obtain the concrete contribution in
carrying the axial load. Figure 4.9 shows the concrete contribution in columns A1-1 and
A1-2 as an example. For these columns, the concrete contributions were obtained by
subtracting the contribution of longitudinal steel from the total load. It was assumed that
the strains in steel and concrete were equal and the longitudinal steel has an elasto-plastic
behavior. Repeatability of the test results can also be easily verified from the figure.
Table 4.2 presents the maximum values of contributions as well as design values.
The table includes cconc PP /)( max values which roughly indicate the gain in concrete
strength due to confinement. Based on ACI, the design values are obtained as follows:
yscc fAAfP 85.00 (4.1)
ccc AfP 85.0 (4.2)
ccccc AfP 85.0 (4.3)
where cf is the compressive strength of the concrete, cA is the total concrete area, ccA is
the area of the concrete core and yf is longitudinal steel yield stress. Due to size effects
and uneven consolidation in columns, the real compressive strength of concrete columns
is usually less than cf . The ACI code assumes that the design strength of concrete is
cf85.0 . This assumption is based on the observations and tests results of Karsan and
Jirsa (1969).

68
Table 4.2 Calculated and Experimental Axial Strengths and Contributions
Specimen
Compressive
Strength
Of Concrete
Cylinder
(ksi)
Calculated Experiment
Total
Load
Total Concrete
Contribution
Core
Contribution Total Load
Concrete
Contribution Strain at
maxP 0
max0
P
PP
cc
conc
P
P max)(
0P
(kips) cP (kips) ccP (kips) maxP (kips) max)( concP
(kips)
A1-1 4.26 478 356 225 492 370 0.0022 3% 1.40
A1-2 4.41 490 368 233 468 346 0.0026 -4% 1.26
A2-1 4.12 466 344 218 449 327 0.0027 -4% 1.28
A2-2 4.35 485 363 230 474 352 0.0026 -2% 1.30
A3-1 4.26 478 355 225 449 327 0.0026 -6% 1.24
A3-2 4.05 460 338 214 427 305 0.0024 -7% 1.21
B1-1 4.23 475 354 224 511 393 0.0057 8% 1.49
B1-2 4.42 491 369 234 536 418 0.0058 9% 1.52
B2-1 4.18 471 349 221 501 383 0.0024 6% 1.47
B2-2 4.32 483 361 228 518 400 0.0028 7% 1.49
B3-1 4.36 486 364 231 495 377 0.0028 2% 1.39
B3-2 4.23 475 354 224 480 362 0.0027 1% 1.37
C1-1 4.23 475 354 224 546 428 0.0092 15% 1.62
C1-2 4.06 461 339 215 520 404 0.0066 13% 1.60
C2-1 4.34 484 362 230 524 406 0.0027 8% 1.50
C2-2 4.09 463 342 217 494 402 0.0031 6% 1.57
C3-1 4.45 493 372 236 518 400 0.0026 5% 1.44
C3-2 4.13 467 345 219 485 367 0.0031 4% 1.42

69
0
100
200
300
400
500
600
0 0.005 0.01 0.015 0.02
Axial Strain
Ax
ial
Lo
ad (
kip
s)
A1-1-total
A1-2-total
A1-1-concrete
A1-2-concrete
steel
`
longitudinal steel transverse steel concrete
specimen
As (in2) gross (%)
core (%) s (in) s (%) fc (ksi)
A1-1 1.76 .018 .028 1 .88 4.26
A1-2 1.76 .018 .028 1 .88 4.41
total load
concrete contribution
contribution of longitudinal
steel
Figure 4.9 Determination of concrete contributions for Columns A1-1 and A1-2.
4.3 Effects of Reinforcement Variables on Behavior of RAC Columns
The RAC columns exhibited significant gain in ductility and appreciable increase in
strength due to the presence of lateral reinforcement. There were different factors
corresponding to the lateral reinforcement that affected the RAC load-deformation
curves. These factors are described in this section.
4.3.1 Effect of Volumetric Ratio
Volumetric ratio, s , is defined as the volume of transverse reinforcement to the volume
of core. The enhancing effect of volumetric ratio on strength and ductility of normal
concrete columns has been well recognized (Vallenas et al 1977, Sheikh and Uzumeri
1982, Mander et al. 1988). In this study, similarly, it was observed that increasing the

70
amount of transverse reinforcement had a significant effect on improving the strength
and ductility of the RAC columns. This observation can be verified by comparing the
load-deformation behavior of the RAC columns presented in Figure 4.10. It can be easily
noted that the columns with higher volumetric ratio of lateral reinforcement sustain
considerable level of load while other columns show a rapid degradation of strength.
While the well confined RAC columns (for instance B1-1) showed a definite increase in
the maximum load-bearing capacity over that of poorly confined ones (for instance A3-
1), the primary increase was in the ductility (i.e., their ability to sustain the applied loads)
and energy absorption capacity (i.e., the area under load-deformation curves).
0
100
200
300
400
500
600
0 0.05 0.1 0.15 0.2 0.25 0.3 0.35 0.4 0.45 0.5
Axial Deformation (in)
Ax
ial
Lo
ad (
kip
s)
C1-1
B1-1
C2-1
A1-1
B2-1
A3-1 A2-1
B3-1
C3-1
Figure 4.10 Gain in strength and ductility due to confinement.

71
4.3.2 Effect of Tie Spacing
Tie spacing had a substantial impact on the ductility, and to lesser extent, on the strength
of the RAC columns as shown in Figure 4.11. Smaller tie spacing creates a stress
condition similar to hydrostatic pressure. The small tie spacing for the RAC columns
provided better confinement of the concrete core between the tie levels, as well as
avoiding premature buckling of the longitudinal rebars. Larger spacing on the other hand,
resulted in a smaller confined area of concrete core and consequently smaller strength
gain and poor ductile behavior. Therefore, for an equal amount of volumetric ratio of
lateral steel, the use of smaller ties at closer spacing is superior than the use of larger ties
at larger spacing.
0
100
200
300
400
500
600
0 0.005 0.01 0.015 0.02
Axial Strain
Ax
ial
Lo
ad (
kip
s)
`̀̀
C3-1 ( =0.70, s=3 in)
C2-1 ( =1.05, s=2 in)
C1-1 ( =2.10, s=1 in)
f =4.23 ksic
f =4.34 ksic
f =4.45 ksic
Figure 4.11 Effect of transverse steel spacing on column behavior.

72
0
100
200
300
400
500
600
0 0.005 0.01 0.015 0.02Axial Strain
Ax
ial
Lo
ad (
kip
s)
`̀̀
B2-1 ( =0.75, s=2 in)
A1-1 ( =0.88, s=1 in)
C3-1 ( =0.70, s=3 in)
f =4.18 ksic
f =4.26 ksic
f =4.45 ksic
Figure 4.12 Effect of transverse steel configuration on column behavior.
4.3.3 Effect of Tie Configuration
Various researchers have shown that the effectiveness of confining steel primarily
depends on the distribution of confining pressure (Vallenas et al. 1977, Sheikh and
Uzumeri 1982, Mander 1984) which in turn is affected by the configuration of lateral
reinforcement and distribution of the longitudinal rebars. In the columns that were
confined with single-perimeter ties (configuration “A”), the cross-sectional area of the
core concrete was not efficiently confined. These columns in general showed a relatively
poor behavior. On the other hand, in the columns that the longitudinal rebars were all
supported by the ties (configuration “B” and “C”) the cross-sectional area of the core
concrete was very effectively confined and the columns exhibited superior behavior.
Distributing the longitudinal reinforcement has another important role. It provides

73
additional confinement across the height of the column between adjacent ties and
consequently increases the volume of effectively confined core. Figure 4.12 shows the
effect of tie configuration on the behavior of RAC columns. As it can be seen, with even
smaller amount of volumetric ratio for transverse reinforcement (amount of transverse
reinforcement in unit volume of core concrete), the specimens with configuration C
exhibited almost equal strength and ductility to that of configuration A. The column with
configuration “B” showed even superior behavior, as it can be seen from the figure.
4.4 Effect of Loading Rate on Strength and Ductility of RAC Columns
Various researchers have shown that normal concrete exhibits higher compressive
strength under higher straining rates (Dilger et al. 1984, Shuaib and Shah 1985). Typical
strain rates induced to structural members by earthquake motions with normal frequency
content usually ranges between 0.01 in/in/s and 0.02 in/in/s (Kappos, 1995). In this
section, the behavior of RAC column under such strain rate is discussed. Similar to
Dilger et al. (1984) and Shuaib and Shah (1985), a straining rate of 0.016 in/in/s was
adopted.
4.4.1 Effect of Loading Rate on Strength
Table 4.3 presents the estimated and experimental load bearing capacities of the RAC
columns tested under the strain rate of 0.016 in/in/s. In the absence of any equation for
RAC, the strength of unconfined (cover) and confined (core) areas were estimated using
the equations proposed by Dilger et al. (1984) and Shuaib and Shah 1985, for normal
concrete.
For unconfined concrete column, Dilger et al. suggested the following equation:

74
)log08.038.1(
icuc ff (4.4)
where
ucf is the enhanced unconfined concrete strength due to the high loading rate,
is the straining per second and icf is the insitu unconfined strength under static loading.
For concrete confined by lateral reinforcement, Shuaib and Shah (1985) suggested the
following equation:
30.004.0
log
log)
25.11(
2
61.6
si
yts
uc
ucccb
sf
fff
(4.5)
where s is the static strain rate (i.e., 1.6x10
-5 per second), is the high strain rate (i.e.,
0.016 per second), s is the volumetric ratio of lateral reinforcement in percent, ytf is
the yield stress of tie steel in ksi, s is tie spacing in inches and ib is the core dimension
in inches.
To calculate to the effect of the strain rate on the strength of longitudinal rebars,
Soroushian and Sim (1986) suggested the following equation for estimating the dynamic
yiled stress:
log0927.01033.146.11054.6 44 stat
y
stat
y
stat
y
dyn
y ffff (4.6)
where dyn
yf and stat
yf are dynamic and static yield stresses in ksi, respectively. Using the
above equations, the load bearing capacities were calculated, as presented in Table 4.3.

75
Equations 4.4 and 4.5 could reasonably predict the experimental values of the strength.
Therefore, in absence of more accurate equations, these equations may be used to
estimate the gain in the strength of plain and confined RAC under high-rate loading.
The effect of lateral steel volumetric ratio, s , on strength gain due to high
straining rate can be observed from Table 4.4 where the average values of experimental
static ( statP ) and dynamic ( dynP ) load bearing capacities are presented. Under the high
straining rate, RAC columns showed 7% to 26% increase in ultimate axial strength. It can
be clearly noticed that the strength gain can be improved by increasing the amount of
lateral steel.
4.4.2 Effect of Loading Rate on Ductility
Figures 4.13 and 4.14 show the behavior of A1-3 and B2-3 columns under the high strain
rate of 0.016 per second. It is clearly noticed that due to the effect of high straining rate,
the strength is considerably increased. The initial stiffness (slope of the ascending
branch) also shows an appreciable increase. The ductility, however, was not significantly
affected by the loading rate. This behavior is similar to that of normal concrete columns
under high strain rates (0.2 in/in/s), observed by Digler et al. They did not notice any
noticeable change in the ductility of concrete columns due to the fast loading rate.

76
Table 4.3 Calculated and Experimental Dynamic Axial Strengths
Specimen s
(in) s (%) icf
(ksi)
ucf
(ksi)
ccf
(ksi)
Caclulated Experimental
Percent
Difference Cover
Strength
(kips)
Core
Strength
(kips)
Steel
Strength
(kips)
dynP
(kips)
Maximum
load
(kips)
A1-3 1 0.88 3.62 4.48 4.69 137 292 146 575 554 -4
A1-4 1 0.88 3.75 4.63 4.84 142 301 146 589 568 -4
A2-3 2 0.44 3.50 4.33 4.41 132 275 146 553 513 -8
A2-4 2 0.44 3.70 4.57 4.65 140 290 146 576 535 -8
A3-3 3 0.29 3.62 4.48 4.52 137 281 146 565 473 -19
A3-4 3 0.29 3.44 4.26 4.30 130 268 146 544 465 -17
B1-3 1 1.51 3.60 4.45 4.81 136 300 141 577 650 11
B1-4 1 1.51 3.76 4.64 5.00 142 312 141 595 631 6
B2-3 2 0.75 3.55 4.39 4.54 134 283 141 558 581 4
B2-4 2 0.75 3.67 4.54 4.68 139 292 141 572 605 6
B3-3 3 0.50 3.71 4.58 4.66 140 290 141 571 552 -4
B3-4 3 0.50 3.60 4.45 4.52 136 282 141 559 557 0
C1-3 1 2.10 3.60 4.45 4.97 136 309 141 587 731 20
C1-4 1 2.10 3.45 4.27 4.81 131 300 141 571 716 20
C2-3 2 1.05 3.69 4.56 4.76 140 297 141 577 634 9
C2-4 2 1.05 3.48 4.30 4.51 132 281 141 554 614 10
C3-3 3 0.70 3.78 4.68 4.78 143 298 141 582 561 -4
C3-4 3 0.70 3.51 4.34 4.45 133 277 141 551 580 5

77
Table 4.4 Variation of Static-to-Dynamic Axial Strength Ratios with Respect to s
s (%) Specimen
Dynamic
Capacity,
dynP (kips)
Average
(kips) Specimen
Static
Capacity,
statP (kips)
Average
(kips) Percent
Difference
0.88 A1-3 554 561
A1-1 492 480 14
0.88 A1-4 568 A1-2 468
0.44 A2-3 513 524
A2-1 449 461.5 12
0.44 A2-4 535 A22 474
0.29 A3-3 473 469
A3-1 449 438 7
0.29 A3-4 465 A3-2 427
1.51 B1-3 650 640.5
B1-1 511 523.5 18
1.51 B1-4 631 B1-2 536
0.75 B2-3 581 593
B2-1 501 509.5 14
0.75 B2-4 605 B2-2 518
0.50 B3-3 552 554.5
B3-1 495 487.5 12
0.50 B3-4 557 B3-2 480
2.10 C1-3 731 723.5
C1-1 546 533 26
2.10 C1-4 716 C1-2 520
1.05 C2-3 634 624
C2-1 524 509 18
1.05 C2-4 614 C2-2 494
0.70 C3-3 561 570.5
C3-1 518 501.5 12
0.70 C3-4 580 C3-2 485
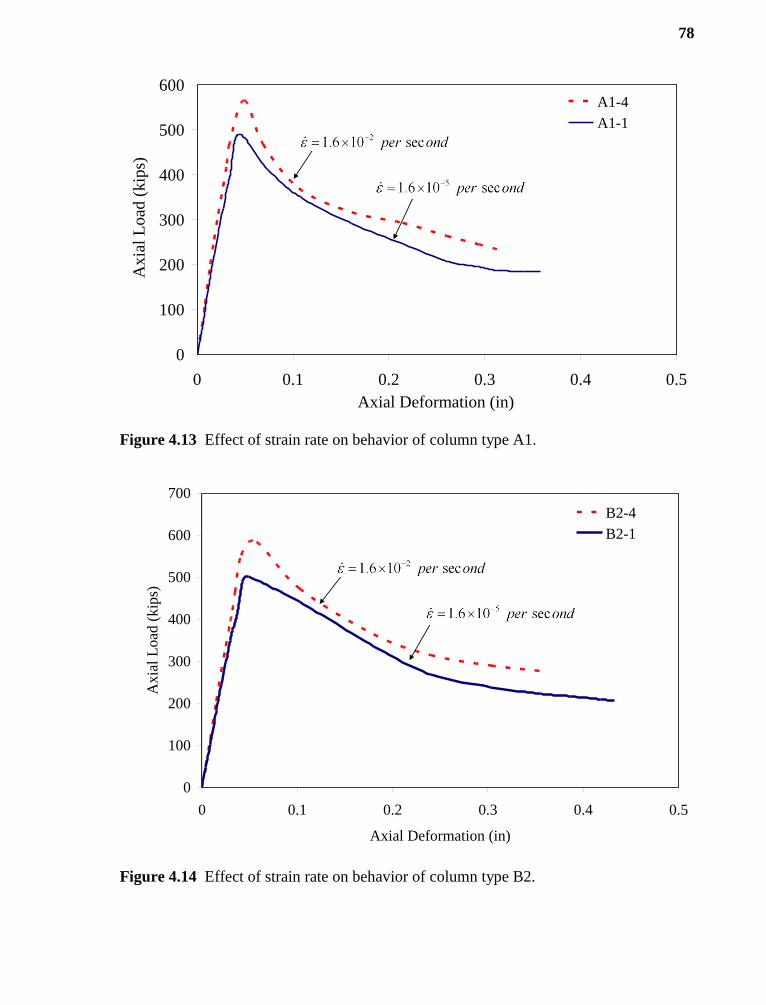
78
0
100
200
300
400
500
600
0 0.1 0.2 0.3 0.4 0.5
Axial Deformation (in)
Ax
ial
Load
(kip
s)
A1-4
A1-1-total
Figure 4.13 Effect of strain rate on behavior of column type A1.
0
100
200
300
400
500
600
700
0 0.1 0.2 0.3 0.4 0.5
Axial Deformation (in)
Ax
ial
Lo
ad (
kip
s)
B2-4
B2-1
Figure 4.14 Effect of strain rate on behavior of column type B2.

79
4.5 Effect of Cyclic Loading
The results of uniaxial cyclic tests on unconfined normal concrete have revealed that
considerable degradation of stiffness due to cyclic loading can occur (Sinha et al. 1967,
Karsan and Jirsa 1969). However, when effectively confined, concrete can maintain its
stiffness under cyclic loading conditions (Priestly et al., 1981). Figures 4.15 to 4.20 show
the load-deformation diagrams of the RAC columns under cyclic loading. It can be
easily noticed that for the columns with higher confinement (i.e., higher volumetric ratio
of lateral reinforcement and smaller tie spacing) the strength and stiffness is not adversely
affected by the load cycles whereas in the columns with smaller confinement, the slope of
the unloading and reloading branches significantly decreases by increasing the number of
cycles. This observation indicates that similar to normal concrete, adequate confinement
of RAC is essential in order to obtain the desirable ductility under cyclic conditions.
For plain concrete, is well established that the stress-strain envelope curve under
cyclic loading is almost identical to the curve obtained from monotonic loading (Sinha et
al. 1964, Karsan and Jirsa 1969, Shah et al. 1983 and Mander 1984). Figure 4.15 shows
the monotonic and cyclic stress-strain curves of columns A1-4 and A1-5, respectively. It
can be seen that the monotonic curve, although not perfectly, approximates the envelope
of the cyclic curve.

80
0
100
200
300
400
500
600
0 0.05 0.1 0.15 0.2 0.25 0.3 0.35 0.4
Axial Deformation (in)
Ax
ial
Load
(kip
s)
A1-5
A1-1-total
Figure 4.15 Behavior of column A1-5 subjected to cyclic loading.
0
200
400
600
800
0 0.1 0.2 0.3
Axial Deformation (in)
Ax
ial
Load
(kip
s)
B1-5
Figure 4.16 Behavior of column B1-5 subjected to cyclic loading.

81
0
200
400
600
0 0.1 0.2 0.3
Axial Deformation (in)
Ax
ial
Load
(kip
s)
B3-5
Figure 4.17 Behavior of column B3-5 subjected to cyclic loading.
0
200
400
600
800
0 0.1 0.2 0.3
Axial Deformation (in)
Ax
ial
Load
(kip
s)
C1-5
Figure 4.18 Behavior of column C1-5 subjected to cyclic loading.

82
0
200
400
600
800
0 0.1 0.2 0.3
Axial Deformation (in)
Ax
ial
Load
(kip
s)
C2-5
Figure 4.19 Behavior of column C2-5 subjected to cyclic loading.
0
200
400
600
0 0.1 0.2 0.3
Axial Deformation (in)
Ax
ial
Load
(kip
s)
C3-5
Figure 4.20 Behavior of column C3-5 subjected to cyclic loading.

83
CHAPTER 5
ANALYTICAL PREDICTION OF RAC STRESS-STRAIN BEHAVIOR
5.1 General
RAC stress-strain formulation is an essential for predicting the behavior of structural
members. While there are various formulations for estimating the stress-strain
relationship of normal concrete, a model for RAC stress-strain does not yet exist. Since
the mechanical properties of RAC are quite different compared to those of normal
concrete, the stress-strain equations for normal concrete are not suitable for RAC. This
chapter is devoted to developing models for plain and confined RAC.
5.2 Development of Stress-Strain Formulation for Plain RAC
5.2.1 Experimental Stress-Strain Curves
Using an MTS815 loading unit, experimental stress-strain curves for the plain RAC
cylinders were obtained. A wide range of compressive strength (2.5 ksi to 7 ksi) was
considered, as previously discussed in section 3.2.4. Axial deformation of the RAC
cylinders was measured using two individual extensometers. The average of these two
reading was considered as the axial deformation of the specimens. During the trial
experiments, it was observed that the descending branch of the stress-strain curves of a
RAC cylinder is influenced by the location of the extensometers. Therefore, it was
necessary to be consistent in positioning the extensometers in order to obtain consistent
results.

84
If the testing of concrete cylinders under axial compression is conducted in a
load-control mode, after reaching the maximum load, the cylinder fails abruptly and the
descending branch can not be accurately recorded. In a displacement-control mode,
however, the failure occurs at the rate of the applied displacement and the descending
branch can be easily attained. All of the stress-strain curves in this study were obtained in
displacement-control mode with a strain rate of 1.6 10-5
per second. Figure 5.1a to 5.1e
show the experimental stress-strain curves of the RAC cylinders which compressive
strength lies between 2.40 and 7.30 ksi. These figures also include the predicted stress-
strain curves which will be later discussed in this chapter.
Referring to Figure 5.1a to 5.1e, it can be seen that similar to that of normal
concrete, the stress-strain curve of RAC cylinders has a nonlinear nature. It consists of an
ascending branch up to the maximum stress, followed by a descending branch that for the
most part is a relatively straight line. The descending branch is then continued by a
sustaining branch where the stress remains almost unchanged.
Along the ascending branch of the stress-strain curve and up to the maximum
stress, the RAC cylinders did not experience any significant damage. After the maximum
strength was reached, however, the specimens started crumbling and the load started
dropping. The slope of the descending branch was substantially affected by the strength
of the RAC. Usually, the higher the strength of the concrete, the steeper the descending
branch was. Therefore any equation to approximate the slope of the descending branch
should include the strength as a key variable. Also, the strain corresponding to the peak
stress appeared to be independent of the RAC strength. All the cylinders reached their
maximum strength at a strain about 0.0025.

85
0
1
2
3
4
5
6
7
8
0.000 0.002 0.004 0.006 0.008
Strain
Str
ess
(ksi
)
A18 (fc=6.08 ksi)
A18 (predicted)
A13 (fc=5.02 ksi)
A13 (predicted)
A8 (fc=3.61 ksi)
A8 (predicted)
A3 (fc=2.4 ksi)
A3 (predicted)
Figure 5.1a Experimental and predicted stress-strain curves for plain RAC.
0
1
2
3
4
5
6
7
8
0.000 0.002 0.004 0.006 0.008
Strain
Str
ess
(ksi
)
A19 (fc=6.61 ksi)
A19 (predicted)
A14 (fc=5.16 ksi)
A14 (predicted)
A9 (fc=4.19 ksi)
A9 (predicted)
A4 (fc=2.57 ksi)
A4 (predicted)
Figure 5.1b Experimental and predicted stress-strain curves for plain RAC.

86
0
1
2
3
4
5
6
7
8
0.000 0.002 0.004 0.006 0.008
Strain
Str
ess
(ksi
)
A5 (fc=3.08 ksi)
A10 (fc=4.28 ksi)
A15 (fc=5.57 ksi)
A20 (fc=6.52 ksi)
A5 (predicted)
A10 (predicted)
A15 (predicted)
A20 (predicted)
Figure 5.1c Experimental and predicted stress-strain curves for plain RAC.
0
1
2
3
4
5
6
7
8
0.000 0.002 0.004 0.006 0.008
Strain
Str
ess
(ksi
) A21 (fc=7.17 ksi)
A21 (predicted)
A16 (fc=5.70 ksi)
A16 (predicted)
A11 (fc=4.62 ksi)
A11 (predicted)
A6 (fc=3.12 ksi)
A6 (predicted)
A1 (fc=1.92 ksi)
A1 (predicted)
Figure 5.1d Experimental and predicted stress-strain curves for plain RAC.

87
0
1
2
3
4
5
6
7
8
0.000 0.002 0.004 0.006 0.008
Strain
Str
ess
(ksi
) A22 (fc=7.30 ksi)
A22 (predicted)
A17 (fc=5.92 ksi)
A17 (predicted)
A12 (fc=4.81 ksi)
A12 (predicted)
A7 (fc=3.53 ksi)
A7 (predicted)
A2 (fc=2.11 ksi)
A2 (predicted)
Figure 5.1e Experimental and predicted stress-strain curves for plain RAC.
5.2.2 Proposed Stress-Strain Model for Plain RAC
Various mathematical models for normal concrete were examined and found incapable
for predicting the RAC behavior, as previously shown in Figure 4.1. Therefore a new
model should be developed.
A stress-strain equation in the form of )(f should satisfy the following
conditions: (a) 0)0(f ,(b) cc ff )( , (c) cEf )0(' and (d) 0)( cf .
The proposed model to predict the ascending portion of RAC stress-strain curves follows
the equation suggested by Popovic (1973):
1)/(
)/(
n
nff
n
c
c
c (5.1)

88
where f (in ksi) and are stress and strain variables, cf is the maximum stress (in ksi),
c is the strain corresponding to the maximum stress and n is a factor that determines the
variation in the slope of ascending branch and is calculated as follows:
ccc
c
c
c
fE
E
EE
En
/sec
(5.2)
where cE is initial tangent modulus of elasticity and secE is the secant modulus.
Variations of the slope of ascending branch, n , with respect to compressive
strength is shown in Figure 5.2. The following simple equation is proposed to
approximate n :
32
cfn (5.3)
Visual examination of the experimental stress-strain curves showed that assuming
a straight line for the descending branch was reasonable. The slope of descending branch
was observed to be primarily a function of f which is the stress corresponding to a
strain of 0.004. A linear approximation of the descending branch is as follows:
)( cpc Zff (5.4)

89
where pZ is the slope of the descending branch. pZ can be conveniently obtained if
f is known. As shown in Figure 5.3, f was found to be a function of cf (in ksi)
where:
15.05.2
cf
f (5.5)
The slope of the descending branch can be expressed as a function of the compressive
strength:
1004000015.0
15.06.0
0015.0c
cfc
p fff
Z (5.6)
As previously discussed in Chapter 2, various researchers observed that normal
concrete is capable of sustaining some stresses after the descending branch (Kent and
Park 1971, Sheikh and Uzumeri 1982, Mander 1988, Kappos 1997). Similar observations
were made laboratory tests in study. In general, it was observed assuming a sustaining
stress of 0.1 cf may not be unrealistic.
Figures 5.1a through 5.1e compare the experimental results with the predicted
curves. It can be seen that the agreement between the predicted and experimental curves
is satisfactory. The proposed model for plain RAC is summarized in Figure 5.4.

90
0
2
4
6
8
0 1 2 3 4 5 6 7 8 (ksi)
Figure 5.2 Variation of n with respect to RAC compressive strength.
0
1
2
3
4
0 2 4 6 8
(ksi)
(ksi
)
Figure 5.3 Variation of f with respect to RAC compressive strength.

91
0.0
025
Str
ess
Strain
Figure 5.4 Proposed model for compressive stress-strain behavior of plain RAC.
5.3 Model for Confined RAC
5.3.1 Confinement Effectiveness
Similar to the method employed by Sheikh and Uzumeri (1982) and Mander (1984) for
normal concrete, the relationship between the strengths of the confined and plain RAC
can be expressed as follows:
),,,( ssccc fsfff (5.7)
where ccf and cf are strengths of confined and plain RAC, respectively, s is the
volumetric ratio of transverse steel, s is the tie spacing, sf is the stress in transverse
steel, and is a factor which takes into account the effect of tie configuration and
distribution of longitudinal steel.

92
In rectangular ties the confining pressure is mostly due to the reaction of the
ties at the angle bends of the transverse steel as oppose to the uniform lateral pressure of
spirals. Due to local effects of the ties, an arching action develops between each two
adjacent longitudinal rebars and therefore, part of core remains unconfined. Sheikh and
Uzumeri (1982), Mander (1984) and other researchers assumed that the arching action is
in the form of a second degree parabola with an initial tangent slope of approximately 45
degrees as shown in Figure 5.5, such that:
id
xxy
2
(5.8)
where id is the center-to-center distance between the adjacent longitudinal rebars. The
unconfined area due to one arch, iA , is:
id
i
i
i
ddx
d
xxA
0
22
6)( (5.9)
and therefore the net area at the tie level, tienetA )( , can be estimated as follows:
2
1
)( )(6
1 m
i
icctiee dAA (5.10)
where ccA is the area enclosed by the center line of outer ties and m is the number of

93
perimeter longitudinal rebars. It is clear that the effectively confined area can be
increased by increasing the number of longitudinal rebars. Equation 5.10 can be rewritten
as:
n
i i
in
i
i
cc b
dd
A 1
22
1
)(6
11)(
6
11 (5.11)
where is defined as the ratio of effectively confined core at tie level to the core area.
Therefore, the area of effectively confined concrete at the tie level can be written as:
2
)( icctiee bAA (5.12)
where ib is center-to-center distance between opposite sides of external tie, as shown in
Figure 5.6.
Figure 5.5 Shape of arching action. Source: Sheikh and Uzumeri, 1982.

94
Figure 5.6 Unconfined areas at tie level.
Figure 5.7 Arching action along the column height.
Arching action also happens along the height of the column, midway between the
tie levels, as shown in Figure 5.7. The shaded areas in this figure represent the
ineffectively confined areas. Similar to confined area at tie level, it is assumed that the
curve along which the unconfined and confined concrete separate can be defined by a
second degree parabolic equation as defined in Equation 5.8. The exact shape of this
curve is not very important because the strength of the compressive concrete is governed
by the smallest area of the cross section which is at the center of each two sets of tie.
Apparently larger distance between the ties reduces this effective area.

95
The area of effectively confined area at midway between the ties without
considering the horizontal arching action at the tie level can be simply calculated from
Figure 5.6:
222
)( )2
1()5.0(i
iim idccb
sbsbA (5.13)
and finally, the net area of confined concrete at midway between adjacent ties is
calculated using Equations 5.11 through 5.13:
cccc
ii
im idcce AAb
s
b
sbAA *)
21()
21( 222
)( (5.14)
where * is a factor which represents the combined effectiveness of the tie
configuration and longitudinal rebar arrangement.
The additional core strength due to confinement effect can be expressed as
follows where (max)concP is the maximum load carried by the concrete core, )(unconfcP is the
load bearing capacity of the concrete core without confinement effect and )(confcP is the
additional core load strength due to confinement:
)()((max) confcunconfcconc PPP (5.15)
With an insitu strength of icf , Equation 5.15 can be rewritten as:

96
eaddccicconfcccicconc AfAfPAfP )((max) (5.16)
where addf is the additional strength due to confinement. At this point, sK factor or the
effectiveness coefficient, which represents the increase in strength due to the effect of
transverse reinforcement, can be obtained through a set of mathematical operations:
cc
confc
ic
cc
conc
A
Pf
A
P )((max) (5.17)
cc
eaddiccc
A
Afff (5.18)
ccic
eadd
ic
cc
Af
Af
f
f1 (5.19)
eadd
cc
s AfP
K1
1 (5.20)
and finally:
ccadd
cc
s AfP
K *1
1 (5.21)
Richart et al. (1928) found that the increase in the concrete strength confined by
fluid pressure was proportionally higher for lower confining pressure, i.e., they observed
higher sK values for lower fluid pressures. Kent and Park (1971) reported that the
strength increasing effect of square lateral reinforcement in normal concrete was

97
proportional to the square root of volumetric ratio of the steel tie, i.e., 2/1)( saddf .
Based on these observations, Sheikh and Uzumeri (1982) assumed that the effect of
confining pressure in enhancing the strength of the confined normal concrete is equal
to 2/1)( ssf where sf is the stress in lateral reinforcement at the time of the maximum
resistance of confined concrete and is a constant. In this study a similar concept is
utilized. The gain in the strength of confined RAC is expressed as:
)( sytadd ff (5.22)
where ytf is the yield stress of the lateral reinforcement, s is the volumetric ratio of ties
and and are constants. Substituting Equation 5.22 in Equation 5.21:
)(*1
1 sytcc
cc
s fAP
K (5.23)
In Equation 5.23, the variables and are to be obtained through linear regression of
the tests results. It should be noted that when the confinement is fully active, the lateral
reinforcement will eventually yield. Therefore, in Equation 5.23 the tie yield stress ytf is
used. For normal concrete, Sheikh and Uzumeri (1982) suggested 2.73 and 0.5 for
and variables. For RAC these variables are determined in section 5.3.4.

98
5.3.2 Stress-Strain Curve of Confined RAC
In this section the procedure for determining the stress-strain curve of confined RAC is
illustrated. Figure 5.8 graphically shows the entities necessary to determine the stress-
strain curve of column A1-1 as an example. In order to establish the stress-strain curve
for the confined core, the followings are necessary:
Stress-strain curve of unconfined RAC;
“gross” stress-strain curve of RAC column. This curve is obtained by dividing the
concrete contribution to the gross area of the concrete. Similar to the example in
Figure 4.10 for Column A1-1, for each column, the concrete contribution is
obtained. In Appendix B, the concrete contributions of all of the columns tested
under static loading are presented;
Stress-strain curve of “core” concrete. This curve is obtained by dividing the
concrete contribution to the area of the concrete core;
Strain corresponding to the onset of confinement action. As previously described,
this is the strain at which the vertical cracks appear. Table 4.1 presents the values
of this strain for all the columns. An average value of 0.0020 for this strain is very
close to the exact one and consequently is adopted for all of the columns;
Strain at which the cover is no longer effective in carrying the axial load. Table
4.1 presents the values of this strain.
Using the concept described in Section 4.2 and having the above mentioned
entities specified, the stress-strain curve of the confined RAC in column A1-1 (OABC)
was determined, as shown in Figure 5.8. In Appendix C, the stress-strain curves of all the
columns tested under static loading are presented.
The stress-strain behavior of the confined RAC can be described by four parts: a
nonlinear ascending branch which continues up to cracking strain (OA), a straight
transition line which is located between the strains corresponding to hair cracks and
complete cover spall-off (AB), and linear descending branch followed by the sustaining

99
branch (BC). An examination of the descending branch of the load-deformation curves
(Figure B1 to B9 in Appendix B) shows that between cc and %50 (the strain
corresponding to 50% of ccf ), the descending branch appears to be quite straight.
Therefore, cc and %50 were used to determine the slope of descending branch.
With reference to Figure 5.8, the stress-strain relationship for confined RAC is
suggested as follows:
Ascending branch (i.e., 0020.0 ):Stress-strain relationship of unconfined
normal concrete is applicable to the strains smaller than cracking strain. For the
RAC columns, an average strain of 0.002 is suggested as the cracking strain;
Transition branch (i.e., cc0020.0 ): The exact shape of the transition curve
is difficult to determine. A straight line can be conservatively used. Determination
of cc is necessary to determine this portion of the stress-strain curve;
Deterioration branch (i.e., cc ): A descending straight line is suggested. A
sustaining branch similar to that of unconfined concrete is assumed for the
confined RAC where the stress remains constantly equal to cf10.0 .

100
0
1
2
3
4
5
6
7
0 0.0025 0.005 0.0075 0.01 0.0125 0.015 0.0175 0.02
Axial Strain
Str
ess
(ksi
)
A1-1-gross
A1-1-core
A1-1 cylinder fc=4.26 ksi
cover spall-off
hair cracks
fcc=4.61 ksi
1/2 fcc=2.31 ksi 0
.00
37
0.0
09
6
0.0
01
9
O
A
B
C
Figure 5.8 Experimental stress-strain curve for column A1-1.
5.3.3 Experimental and Predicted Values of Ks Factor
The experimental values for the coefficient of effectiveness, sK , were obtained using the
maximum core strength ccf and insitu strength cf85.0 , as presented in Table 5.1. It is
clearly noted that the ccconc PP /)( max values (from Table 4.2) in general tend to
overestimate the gain in the strength but it may be used for rough estimation of the real
gain in the strength. Figure 5.9 shows the mathematical approach utilized in order to
determine the constants and in Equation 5.23. Linear regression of the
experimental values of sK with respect to and , suggested that a value of 4.0
and a values of 1/3 for may be employed, as shown in the figure. Based on these
values, Equation 5.23 can be written as follow:
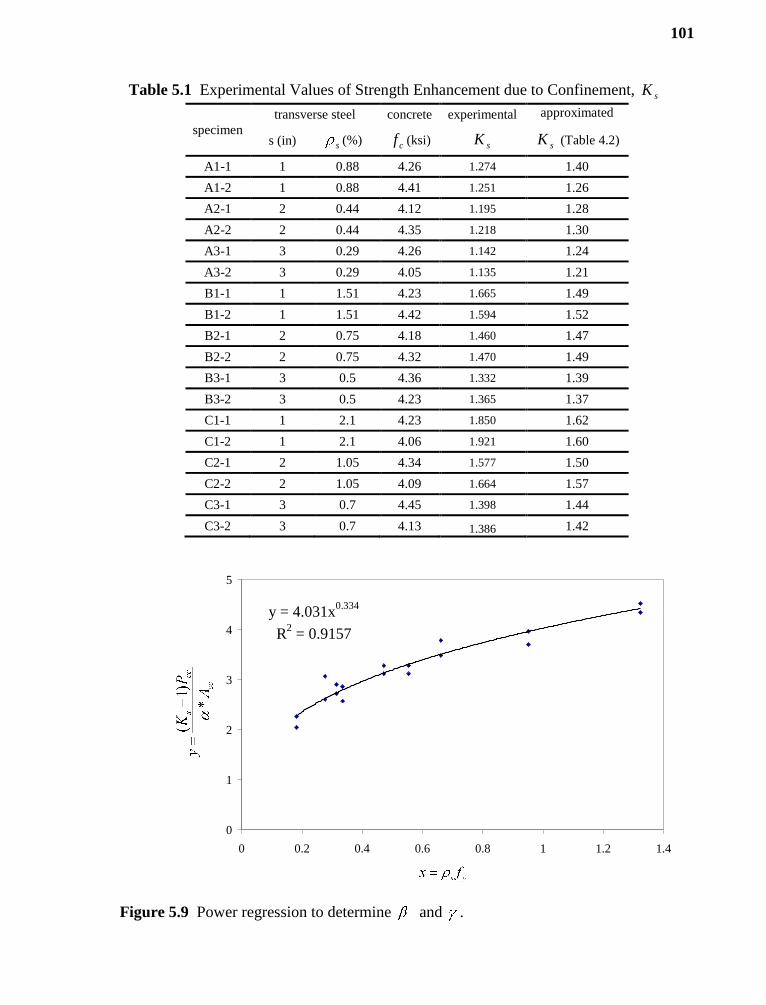
101
Table 5.1 Experimental Values of Strength Enhancement due to Confinement, sK
specimen
transverse steel concrete experimental approximated
s (in) s (%) cf (ksi) sK sK (Table 4.2)
A1-1 1 0.88 4.26 1.274 1.40
A1-2 1 0.88 4.41 1.251 1.26
A2-1 2 0.44 4.12 1.195 1.28
A2-2 2 0.44 4.35 1.218 1.30
A3-1 3 0.29 4.26 1.142 1.24
A3-2 3 0.29 4.05 1.135 1.21
B1-1 1 1.51 4.23 1.665 1.49
B1-2 1 1.51 4.42 1.594 1.52
B2-1 2 0.75 4.18 1.460 1.47
B2-2 2 0.75 4.32 1.470 1.49
B3-1 3 0.5 4.36 1.332 1.39
B3-2 3 0.5 4.23 1.365 1.37
C1-1 1 2.1 4.23 1.850 1.62
C1-2 1 2.1 4.06 1.921 1.60
C2-1 2 1.05 4.34 1.577 1.50
C2-2 2 1.05 4.09 1.664 1.57
C3-1 3 0.7 4.45 1.398 1.44
C3-2 3 0.7 4.13 1.386 1.42
y = 4.031x0.334
R2 = 0.9157
0
1
2
3
4
5
0 0.2 0.4 0.6 0.8 1 1.2 1.4
Figure 5.9 Power regression to determine and .

102
3/1)(0.4*1
1 sytcc
cc
s fAP
K (5.24)
It should be recalled that in calculation of sK for normal concrete, Sheikh and Uzumeri
(1982) assumed the values of 2.73 and 0.5 for and , respectively.
5.3.4 Transition and Descending Branches
In order to define the complete stress-strain relationship, ccf , cc and slope of the
descending branch (i.e., the deterioration rate) are required. This section is devoted to
develop statistical equations to approximate these variables.
The first step in determination of the transition and descending branches is the
approximation of cc in terms of confinement variables. By examining the c and cc
values, a trend comes into view as shown in Figure 5.10. From the figure, cc can be
approximated in terms of c (which is assumed to be constantly 0.0025) and sK , such
that:
cscc K )12( (5.25)
and the transition line can be expressed as the following equation:
ccc
cccc ffff
0020.0 (5.26)
For the descending branch a straight line is assumed. The general expression of such a
line is similar to that of the descending branch of unconfined RAC (Equation 5.4):

103
)( cc Zff (5.27)
where Z is the slope. As described in sub-section 5.3.2, the slope Z can be conveniently
obtained through the following equation:
)(2 %50 cc
ccfZ (5.28)
where %50 is the strain corresponding to 50% of ccf . Examination of Figures C.1 to C.17
in Appendix C suggests that any equation used to approximate the slope of unloading
branch should be a function of confinement variables such that it generates proportionally
lower slopes for higher confinement values. Such an equation should also be flexible to
be reduced to Equation (5.7) when there is no confinement. After extensive examination
of different possible equations, the following equation is suggested:
)(1 yts
p
f
ZZ (5.29)
where fallE is the slope of descending branch in unconfined RAC (Equation 5.6) and
variables and are constants to be determined by regression analysis, as shown in
Figure 5.11. The final form of Equation 5.29 is:
22 )(161
100400
)(161 yts
c
yts
p
f
f
f
ZZ (5.30)

104
and finally, the suggested set of equations for confined RAC is summarized as
follows:
Ascending branch ( 0020.00 ):
1)/(
)/(
n
nff
n
c
c
c Equation (5.1)
ccc
c
c
c
fE
E
EE
En
/sec
Equation (5.2)
32
cfn Equation (5.3)
Transition branch ( cc002.0 ):
ccc
cccc ffff
0020.0 Equation (5.27)
cscc K )12( Equation (5.25)
Descending branch ( cc ):
2)(161
100400
yts
c
f
fZ (5.30)

105
0.003
0.004
0.005
0.006
0.007
0.008
1 1.1 1.2 1.3 1.4 1.5 1.6 1.7 1.8 1.9 2
1
1
Figure 5.10 Approximation of cc .
0
10
20
30
40
50
0 0.2 0.4 0.6 0.8 1 1.2 1.4
1
1
Figure 5.11 Approximation of and values.

106
5.3.5 Sample Analysis
Given:
Column section (C2-2) 10 in. 10 in.
Longitudinal reinforcement 4 #3 and 4 #4 (As=1.68 in2)
Lateral reinforcement 3/8” @ 2 in. c/c
Configuration “C” (See Figure 3.12)
Center-to-center of the outer tie 8 in.
Cylinder compressive strength 4.32 ksi
Longitudinal reinforcement yield stress 70.0 ksi
Lateral reinforcement yield stress 63.0 ksi
Calculations:
Tie length at a level .75)3
8282(284 in
3/8” cross sectional area=0.0276 in2
Tie volume= 75 0.0276=2.061 in3
Core volume=82
2=128 in3
s 0.016
(Equations 5.11) 667.0)8
4(8
6
11 2 511.0)
82
21(667.0* 2
(Equations 4.2) kipsPcc 8.228)68.18(32.485.0 2
(Equations 5.24) 564.1)63016.0(48511.08.228
11 3/12
sK
(Equations 5.25) 0053.00025.0)1564.12()12( cscc K
(Equations 5.30) 106)(161
1004002
ys
c
f
fZ

107
Using Equations 5.1, 5.27 and 5.30, the stress-strain curve of the confined core was
calculated and plotted against the experimental results for column C2-2, as shown in
Figure 5.12. From the Figure, it can be concluded that the proposed model is very
accurate within the ascending and transition branches. The predicted descending branch
however, slightly deviates from the experimental curve but it is within the margins of
experimental results. It is worth to recall that the exact shape of the transition branch is
very difficult to determine. The use of a straight line to describe the transition branch is
just because of its simplicity.
Due to smaller modulus of elasticity of RAC, the mathematical models for normal
concrete may not be able to accurately capture the stress-strain behavior of RAC. This is
can also be seen in Figure 5.12 where the predicted stress-strain of the RAC is plotted
against Sheikh and Uzumeri (1982) and Mander (1984) models which are widely used for
approximating stress-strain behavior of normal concrete. As it can be seen from the
figure, there is a significant difference between the slope of the ascending branch of RAC
stress-strain curve and those predicted by Sheikh and Uzumeri (1982) and Mander (1984)
models.

108
0
1
2
3
4
5
6
0 0.003 0.006 0.009 0.012
Axial Strain
Str
ess
(ksi
)
Proposed model for confinedRACMander et al. (1984) model fornormal concreteSheikh and Uzumeri (1978)model for normal concreteProposed model for confinedRACExperimental curves (C2-2)
Figure 5.12 Proposed RAC model versus models for normal concrete.

109
CHAPTER 6
EXAMINATION OF RAC MODELS IN FLEXURE
The proposed models for unconfined and confined RAC under axial compressive stresses
were examined in flexure. For this purpose, two RAC beams were constructed and tested
using the MTS loading unit. Experimental load-deformation behavior of RAC beams
were obtained and compared with the nonlinear behavior predicted using the proposed
models.
.
6.1 Numerical Analysis
6.1.1 Material and Geometrical Properties
Geometrical properties of the beams are shown in Figure 6.1. For the purpose of analysis,
the beam is longitudinally divided into multiple segments. Each cross section is divided
into fibers, as shown in Figure 6.1. The reinforcing steel is assumed to be elastic-
perfectly plastic, characterized by its elastic modulus and yield stress.
An average compressive strength of 4.22 ksi was obtained for two RAC cylinder
samples. The mechanical properties of the reinforcing steel were the same as those of
column reinforcing steel, as presented in Chapter 3, since similar ones were used. The
unconfined stress-strain relationships are calculated as follows:
From Equation (5.3): 11.532
22.43
2
cfn
also: 1688sec
c
cfE ksi 11.5
1688sec c
c
c
c
E
E
EE
En 2099cE ksi

110
0025.00 : (Equation5.1)
11.40025.0
8626
111.50025.0
0025.011.522.4
11.511.5f
cc0025.0 : (Equations 5.6) 1788100400 cfall fE ksi
(Equations 5.4) )0025.0(178822.4)( cfallc Eff
The proposed equations for RAC confined in square ties should generate
reasonable results for rectilinear cross sections as long as the tie dimensions are not
significantly different. The confined stress-strain relationships for the beam core RAC,
are calculated as follows:
Volume of steel tie: 359.00276.0)0.45.2(2tieV in3
Volume of confined core: 155.1)0.45.2(coreV in3
Tie steel volumetric ratio: 024.015
359.0s
(Equations 5.11) 258.0)0.45.2(10
2
6
11
6
)(
1 22
2
1
cc
m
i
i
A
d
Having the tie spacing s and tie dimensions b and w :
(Equations 5.14) bw
swsb
A
A
cc
m idcc )5.0)(5.0(*
)(
147.00.45.2
)75.04)(75.05.2(258.0
(Equations 4.2) ccccc AfP 85.0
91.32)05.0211.0245.2(0.485.0 kips

111
Therefore, the effectiveness coefficient can be calculated:
(Equations 5.24) 3/1)(0.4*1
1 sytcc
cc
s fAP
K
205.1)024.063(0.410147.091.32
11 3/1
Also:
(Equations 5.25) 0035.00025.0)1205.12()12( cscc K
(Equations 5.30) 47)63024.0(161
10022.4400
)(161
100400
22
yts
c
f
fZ ksi
Finally, the stress-strain relation for the confined core can be presented as:
0020.00 :
11.40025.0
8626
111.50025.0
0025.011.5
)22.4(11.511.5
f
0035.00020.0 : 4330020.00035.0
89.332.4
0020.0
89.3f
0035.0 : )0035.0(4632.4)( cccc Zff
Ignoring the tensile resistance of concrete that is customary in the calculation of
ultimate load bearing capacity, can lead to overestimation of the deflections. Currently
there is no available tensile stress-strain model for RAC. It is assumed that similar to
normal concrete, tensile concrete behaves in a linear-elastic manner up to the peak stress.
The strain softening branch is commonly considered to be a straight line. The slope of the
tensile softening branch is calculated using Bazant and Oh (1983) model:

112
t
c
tf
EE
57
70
(6.1)
where tE is the slope of strain softening branch in psi, cE is concrete modulus of
elasticity (the same for tension and compression) in psi and tf is tensile strength in psi
which can be estimated using the ACI equation for estimating tensile strength:
49042205.75.7 ct ff psi
The stress-strain model for the concrete in tension then can be calculated as follows:
00025.00c
t
E
f: cE
00025.0 : 000,26949057
000,100,270tE psi
)00025.0(269490.0)( ttt Ef ksi
The stress-strain diagrams are shown in Figure 6.2.
Figure 6.1 Cross-section of the RAC beams.

113
0
1
2
3
4
5
0 0.002 0.004 0.006 0.008 0.01
Strain
Un
con
fin
ed R
AC
Str
ess
(ksi
)
0
1
2
3
4
5
0 0.002 0.004 0.006 0.008 0.01
Strain
Co
nfi
ne
RA
C S
tres
s (k
si)
0
0.1
0.2
0.3
0.4
0.5
0 0.0005 0.001 0.0015 0.002
Strain
RA
C T
ensi
le S
tres
s (k
si)
0
20
40
60
80
0 0.002 0.004 0.006 0.008 0.01
Strain
Lo
ng
itu
din
al S
teel
Str
ess
(ksi
)
Figure 6.2 Stress-strain behavior of the materials used in the numerical analysis.
6.1.2 Calculation of Deflections
In analysis of the beams, the Bernoulli-Navier’s hypothesis is employed. It states that all
the beam sections remain plane and perpendicular to the longitudinal axis. This
assumption is valid because a length-to-depth ratio of 7 that is relatively high and
consequently the shear deformations are negligible. It is also assumed that geometrically
nonlinear effects are negligible. The equations of equilibrium with respect to axial load
and bending moment are:
ss
AA
AdAfdAfN
CCUC
(6.1)

114
sss
A
c
A
c AddAfddAfdM
CCUC
(6.2)
where f is the concrete stress (either tensile of compressive), s is the stress in
longitudinal steel, sA is the area of longitudinal steel and cd and sd are the distance from
concrete finite elements and steel rebars to the beam’s top extreme fiber, respectively. In
the above equations, the first term refers to the contribution of unconfined concrete, the
second term refers to the contribution of confined concrete and the third term refers to the
contribution of longitudinal steel.
According to the principle of virtual work, the midspan deflection can be
evaluated in terms of internal moments and curvatures:
dxxmx
L
0
)()( (6.3)
where )(xm is the internal moment due to unit load in the direction of , )(x is the
curvature and L is the length of the beam. For the beams under consideration, the above
integral was evaluated numerically such that the equilibrium equations were satisfied.
The following steps were utilized. It should be noted that use of a computer program is
necessary to run the iterations:
Determine the relation between the internal moment and the curvature at different
cross sections. For this, given a small increment of curvature, adjust the axial
strain such that Equation 6.1 is satisfied. Obtain the internal moment using
Equation 6.2. Repeat the same procedure to obtain the complete range of the
moment-curvature;

115
Using the complete moment-curvature data and the loading condition and
Equation 6.3 compute the deflection.
In calculation of the moment-curvature diagram, the beam was divided to 7 equal
segments, as shown in Figure 6.3. The use of smaller divisions was found to be
unnecessary because it did not significantly change the results. Figure 6.4 shows the
calculated moment-curvature. The data are presented in Table 6.1. 1M through 7M are
the moments in sections 1 through 7 and 1 through 7 are the corresponding curvatures,
as shown in Figure 6.4. Using the iterative approach described, the moment-curvature
and load-deflection curves were computed as presented in Table 6.1.
Figure 6.3 Beam divisions for numerical calculation.
6.2 Experimental Results
Figure 6.5 shows the two identical beams tested under the MTS 810 loading unit. The
total beam length was 60 inches while the clear span was 42 inches. Concentrated load
was applied on the middle of the beams at a constant rate of 0.0005 inch per second and
the load-deformation data was recorded.
Figure 6.6 shows the development of tensile cracks and crushing in the beams
prior to ultimate failure. The tensile cracks appeared at a deflection of 0.017 inch and
0.021 inch for Beam-1 and Beam-2, respectively. The cracking deflection was quite close
to the calculated value of 0.022 in. The crushing of the compressive concrete started a

116
deflection of 0.205 inch and 0.240 inch for Beam-1 and Beam-2, respectively while the
calculated cracking deflection was 0.233 inch, quite close to the experimental values. The
beams exhibited considerable ductility and eventually failed in flexure, as shown in
Figure 6.6. Up to a deflection of 0.40 inches, the calculated behavior is quite close to the
actual behavior of the RAC beams. For higher deflection however, differences become
more noticeable.
In Figure 6.7 the load-deformation curve predicted using the proposed RAC
models are compared with the experimental results. As it can be noted, the prediction is
very close to the experimental results. In general, the differences between the predicted
and experimental curves are less than 10%. The deviation of the predicted and
experimental curves may be attributed to the confining effect of the loading plats, where
that are not considered in the numerical calculations.
0
20
40
60
80
100
0 0.002 0.004 0.006
Curvature
Mo
men
t (i
n.-
kip
)
Figure 6.4 Analytical moment-curvature diagram.

117
Figure 6.5 Beam test setup: (top) Beam-1, (bottom) Beam-2.

118
Figure 6.6 Development of cracks and crushing: (top) Beam 1, (bottom) Beam 2.

119
0.0
2.0
4.0
6.0
8.0
10.0
0.00 0.10 0.20 0.30 0.40 0.50
Displacement (in)
Load
(kip
s)
Calculated
Beam #1
Beam #2
Figure 6.7 Calculated and experimental load-deformation of the RAC beams.

120
Table 6.1 Predicted Curvature and Deflection Values
Strain Curvature
(in-1
)
Moment
(in.-kips)
P
(kips) 1M &
7M
2M &
6M
3M &
5M 4M 1
& 7 2
& 6 3 & 5 4
(in)
0 0 0 0 0 0 0 0 0 0 0 0 0
0.0001 2.99E-05 5.94 0.57 0.85 2.54 4.24 5.94 8.1195E-06 1.6239E-05 2.4359E-05 3.2478E-05 0.006
0.0003 8.97E-05 11.87 1.13 1.70 5.09 8.48 11.87 1.6239E-05 3.2478E-05 4.8717E-05 6.4956E-05 0.012
0.0004 1.21E-04 17.71 1.69 2.53 7.59 12.65 17.71 2.4216E-05 4.8432E-05 7.2870E-05 9.7784E-05 0.018
0.0005 1.54E-04 22.56 2.15 3.22 9.67 16.11 22.56 3.0851E-05 6.1703E-05 9.3349E-05 1.3432E-04 0.024
0.001 3.39E-04 26.63 2.54 3.80 11.41 19.02 26.63 3.6411E-05 7.3049E-05 1.1481E-04 1.7544E-04 0.029
0.0015 5.36E-04 44.11 4.20 6.30 18.91 31.51 44.11 6.0326E-05 1.3053E-04 2.3060E-04 3.2478E-04 0.055
0.002 7.26E-04 61.79 5.88 8.83 26.48 44.13 61.79 8.5058E-05 2.1189E-04 3.7213E-04 7.0061E-04 0.101
0.0025 9.04E-04 72.48 6.90 10.35 31.06 51.77 72.48 1.0010E-04 2.5755E-04 5.4269E-04 1.1173E-03 0.148
0.003 1.06E-03 77.89 7.42 11.13 33.38 55.63 77.89 1.0771E-04 2.8063E-04 6.2890E-04 1.7170E-03 0.201
0.0035 1.24E-03 80.02 7.62 11.43 34.29 57.14 80.02 1.1068E-04 2.8965E-04 6.6260E-04 2.2642E-03 0.245
0.004 1.40E-03 80.09 7.62 11.43 34.29 57.14 80.09 1.1068E-04 2.8965E-04 6.6260E-04 2.7216E-03 0.278
0.0045 1.49E-03 78.87 7.51 11.27 33.80 56.34 78.87 1.0909E-04 2.8483E-04 6.4458E-04 3.1032E-03 0.304
0.005 1.56E-03 77.89 7.42 11.13 33.38 55.63 77.89 1.0771E-04 2.8063E-04 6.2890E-04 3.4143E-03 0.326
0.0055 1.64E-03 77.00 7.33 11.00 33.00 55.00 77.00 1.0646E-04 2.7684E-04 6.1476E-04 3.6657E-03 0.343
0.006 1.75E-03 76.17 7.25 10.88 32.64 54.41 76.17 1.0529E-04 2.7329E-04 6.0147E-04 3.9118E-03 0.360
0.0065 1.88E-03 75.05 7.14 10.71 32.14 53.57 75.05 1.0365E-04 2.6830E-04 5.8286E-04 4.1696E-03 0.377
0.007 2.03E-03 73.71 7.02 10.53 31.59 52.65 73.71 1.0183E-04 2.6279E-04 5.6229E-04 4.4460E-03 0.395
0.0075 2.17E-03 72.48 6.90 10.35 31.06 51.77 72.48 1.0010E-04 2.5755E-04 5.4269E-04 4.7425E-03 0.415

121
CHAPTER 7
CONCLUSIONS
7.1 General
This chapter summarizes the most important findings as well as the conclusions drawn
from both the experimental and the analytical study carried out during this research. The
novel models proposed for plain and confined RAC are summarized. In general, the
results showed that RAC may be suitable for structural use. The chapter ends with a brief
list of areas recommended for further research.
7.2 Conclusions from the Experimental Study
An extensive experimental program including testing of several plain RAC cylinders as
well as 44 reinforced RAC columns, 10 inches by 10 inches in section and 32 inches in
height, with different tie arrangements was conducted at the High Performance Concrete
Laboratory of New Jersey Institute of Technology. The specimens were tested under
quasi-static and dynamic (both monotonic and cyclic) axial compression. The following
conclusions can be drawn from the results of these tests:
1. Depending on the compressive strength, the elastic modulus of plain RAC is 30%
to 50% less than that of normal concrete. The higher the strength, the less the
difference is;
2. The strain corresponding to maximum compressive strength of a plain RAC is
0.0025. This value is appreciably more than the average value of 0.002 for normal
concrete;
3. When efficiently confined with rectilinear ties and longitudinal reinforcement,
RAC can exhibit a significant gain 60% more strength compared with the design
values. The gain in the strength, however, is not proportional to the increase in
volumetric ratio of the ties;

122
4. Similar to normal confined concrete, the gain in ductility-- which is of significant
interest in seismic design of structural members-- by improving confinement
variables is very pronounced. This finding shows that in general, RAC may be
suitable for structural and seismic use;
5. In particular, distributing the longitudinal steel around the perimeter of the
column, reducing the spacing of the ties and increasing volumetric ratio of the
lateral reinforcement improves the enhancing effects of the confinement;
6. The strength may be roughly approximated by finding the ccconc PP /)( max ratio. In
general this ratio tend to over estimate the real gain in the strength;
7. Up to an axial strain about 0.0020 and regardless of the amount of lateral
reinforcement, RAC columns behave as if they are plain. At this stage vertical
hair cracks appear on the cover. Interestingly, for normal concrete columns, the
strain corresponding to the onset of confinement action is similarly observed to be
between 0.0015 and 0.0020;
8. The strain at which the cover spalls off is in a wide range of 0.0040 to 0.0070,
depending on the amount of lateral reinforcement. For normal concrete a strain
between 0.004 and 0.005 is suggested, which is a narrower range; this means that
the mechanism of confinement in RAC columns has a quite slower nature;
9. The compressive failure mode of RAC columns is not different with normal
concrete columns: cover spall off, core crushing and buckling of longitudinal
rebars followed by breaking and possibly hook slippage of the lateral
reinforcement;
10. Under high straining rates, RAC column show 7% to 26% increase in ultimate
axial strength. In order to approximate the gain in strength due to high straining
rates and in the absence of specific equations for RAC, the proposed equation for
normal concrete may be used;
7.3 Conclusions from the Analytical Study
7.3.1 Proposed Model for Plain RAC
A set of mathematical expressions is proposed to predict the stress-strain behavior of
RAC. The proposed model contains a nonlinear ascending branch and a linear falling
branch followed by sustaining branch, as shown in Figure 7.1. For the sustaining branch
is assumed, i.e., the falling branch continues until it meets the strain axis. The set of

123
equations are as follows:
Ascending branch ( 0025.00 ):
1)/(
)/(
n
nff
n
c
c
c Equation (5.1)
ccc
c
c
c
fE
E
EE
En
/sec
Equation (5.2)
32
cfn Equation (5.3)
Ascending branch ( 0025.0 ):
)( cpc Zff Equation (5.4)
100400 cp fZ Equation (5.6)
Figure 7.1 Proposed model for compressive stress-strain behavior of plain RAC.

124
7.3.2 Proposed Model for Confined RAC
A model for predicting stress-strain behavior of confined RAC was developed. The
model is limited to normal-strength RAC with square ties. Similar to previous studies on
confinement of normal concrete, the gain in the compressive strength is expressed in
terms of the area of effectively confined concrete. In calculation of the effectively
confined area, the effect of in-plane and vertical arching action is included. The proposed
model contains a nonlinear ascending branch, a linear transition branch and a linear
falling branch, as shown in Figure 7.2. A sustaining branch Similar to that of plain RAC
was assumed for the confined RAC. The following set of equations is proposed to
approximate the stress-strain behavior of confined RAC:
Ascending branch ( 0020.00 ):
1)/(
)/(
n
nff
n
c
c
c Equation (5.1)
ccc
c
c
c
fE
E
EE
En
/sec
Equation (5.2)
32
cfn Equation (5.3)
Transition branch ( cc002.0 ):
ccc
cccc ffff
0020.0 Equation (5.27)
cscc K )12( Equation (5.25)
Descending branch ( cc ):

125
)( cccc Zff Equation (5.27)
2)(161
100400
yts
c
cf
fZ Equation (5.30)
Figure 7.2 Proposed model for compressive stress-strain behavior of confined RAC.
7.4 Recommendation for Future Research
The study conducted to propose the model for confined RAC was limited to columns
with square cross section and made of normal-strength RAC. Application of the proposed
analytical model to other conditions such as high-strength RAC, spiral or rectangular
transverse reinforcement and other design possibilities require further research. In
particular, the following research areas appear to be the next steps:
1. The applicability of the proposed model to RAC made of RCA with different
cleanliness and quality;
2. The applicability of the proposed model to spiral, rectangular and irregular
configurations of ties. The use of full-size of near-full size specimen is
recommended;
3. The applicability of the model for high-strength RAC;

126
APPENDIX A
FAILURE MODE OF RAC COLUMNS
In this appendix photos illustrating the failure mode of the RAC column are presented.

127
South and East sides North and West sides
Figure A.1 Failure of Column A1-1 under static loading.
South and East sides North and West sides
Figure A.2 Failure of Column A1-2 under static loading.

128
South and East sides North and West sides
Figure A.3 Failure of Column A2-1 under static loading.
South and East sides North and West sides
Figure A.4 Failure of Column A2-2 under static loading.

129
South and East sides North and West sides
Figure A.5 Failure of Column A3-1 under static loading.
South and East sides North and West sides
Figure A.6 Failure of Column A3-2 under static loading.

130
South and East sides North and West sides
Figure A.7 Failure of Column B1-1 under static loading.
South and East sides North and West sides
Figure A.8 Failure of Column B1-2 under static loading.

131
South and East sides North and West sides
Figure A.9 Failure of Column B2-1 under static loading.
South and East sides North and West sides
Figure A.10 Failure of Column B2-2 under static loading.

132
South and East sides North and West sides
Figure A.11 Failure of Column B3-1 under static loading.
South and East sides North and West sides
Figure A.12 Failure of Column B3-2 under static loading.

133
South and East sides North and West sides
Figure A.13 Failure of Column C1-1 under static loading.
South and East sides North and West sides
Figure A.14 Failure of Column C1-2 under static loading.

134
South and East sides North and West sides
Figure A.15 Failure of Column C2-1 under static loading.
South and East sides North and West sides
Figure A.16 Failure of Column C2-2 under static loading.

135
South and East sides North and West sides
Figure A.17 Failure of Column C3-1 under static loading.
South and East sides North and West sides
Figure A.18 Failure of Column C3-2 under static loading.

136
APPENDIX B
DETERMINATION OF CONCRETE CONTRIBUTION
In this appendix the contributions of concrete and longitudinal reinforcement in carrying
the axial load are presented.

137
0
100
200
300
400
500
600
0 0.005 0.01 0.015 0.02
Axial Strain
Ax
ial
Lo
ad (
kip
s)
A1-1-total
A1-2-total
A1-1-concrete
A1-2-concrete
steel
`
longitudinal steel transverse steel concrete
specimen
As (in2) gross (%)
core (%) s (in) s (%) fc (ksi)
A1-1 1.76 .018 .028 1 .88 4.26
A1-2 1.76 .018 .028 1 .88 4.41
Figure B.1 Determination of concrete contributions for Columns A1-1 and A1-2.
0
100
200
300
400
500
600
0 0.0025 0.005 0.0075 0.01 0.0125 0.015 0.0175 0.02
Axial Strain
Ax
ial
Lo
ad (
kip
s)
A2-1-total
A2-2-total
A2-1-concrete
A2-2-concrete
steel
longitudinal steel transverse steel concrete
specimen
As (in2) gross (%)
core (%) s (in) s (%) fc (ksi)
A2-1 1.76 .018 .028 2 .44 4.12
A2-2 1.76 .018 .028 2 .44 4.35
Figure B.2 Determination of concrete contributions for Columns A2-1 and A2-2.

138
0
100
200
300
400
500
600
0 0.0025 0.005 0.0075 0.01 0.0125 0.015 0.0175 0.02
Axial Strain
Ax
ial
Lo
ad (
kip
s)
A3-1-total
A3-2-total
A3-1-concrete
A3-2-concrete
steel
`
longitudinal steel transverse steel concrete
specimen
As (in2) gross (%)
core (%) s (in) s (%) fc (ksi)
A3-1 1.76 .018 .028 3 .29 4.26
A3-2 1.76 .018 .028 3 .29 4.05
Figure B.3 Determination of concrete contributions for Columns A3-1 and A3-2.
0
100
200
300
400
500
600
0 0.0025 0.005 0.0075 0.01 0.0125 0.015 0.0175 0.02
Axial Strain
Ax
ial
Lo
ad (
kip
s)
B1-1-total
B1-2-total
B1-1-concrete
B1-2-concrete
steel
longitudinal steel transverse steel concrete
specimen
As (in2) gross (%)
core (%) s (in) s (%) fc (ksi)
B1-1 1.68 .017 .026 1 1.51 4.23
B1-2 1.68 .017 .026 1 1.51 4.42
Figure B.4 Determination of concrete contributions for Columns B1-1 and B1-2.

139
0
100
200
300
400
500
600
0 0.0025 0.005 0.0075 0.01 0.0125 0.015 0.0175 0.02
Axial Strain
Ax
ial
Lo
ad (
kip
s)
B2-1-total
B2-2-total
B2-1-concrete
B2-2-concrete
steel
longitudinal steel transverse steel concrete
specimen
As (in2) gross (%)
core (%) s (in) s (%) fc (ksi)
B2-1 1.68 .017 .026 2 .75 4.18
B2-2 1.68 .017 .026 2 .75 4.32
Figure B.5 Determination of concrete contributions for Columns B2-1 and B2-2.
0
100
200
300
400
500
600
0 0.0025 0.005 0.0075 0.01 0.0125 0.015 0.0175 0.02
Axial Strain
Ax
ial
Lo
ad (
kip
s) B3-1-total
B3-2-total
B3-1-concrete
B3-2-concrete
steel
longitudinal steel transverse steel concrete
specimen
As (in2) gross (%)
core (%) s (in) s (%) fc (ksi)
B3-1 1.68 .017 .026 3 .50 4.36
B3-2 1.68 .017 .026 3 .50 4.23
Figure B.6 Determination of concrete contributions for Columns B3-1 and B3-.2.

140
0
100
200
300
400
500
600
0 0.0025 0.005 0.0075 0.01 0.0125 0.015 0.0175 0.02
Axial Strain
Ax
ial
Lo
ad (
kip
s)
C1-1-total
C1-2-total
C1-1-concrete
C1-2-concrete
steel
longitudinal steel transverse steel concrete
specimen
As (in2) gross (%)
core (%) s (in) s (%) fc (ksi)
C1-1 1.68 .017 .026 1 2.10 4.23
C1-2 1.68 .017 .026 1 2.10 4.06
Figure B.7 Determination of concrete contributions for Columns C1-1 and C1-2.
0
100
200
300
400
500
600
0 0.0025 0.005 0.0075 0.01 0.0125 0.015 0.0175 0.02
Axial Strain
Ax
ial
Lo
ad (
kip
s)
C2-1-total
C2-2-total
C2-1-concrete
C2-2-concrete
steel
longitudinal steel transverse steel concrete
specimen
As (in2) gross (%)
core (%) s (in) s (%) fc (ksi)
C2-1 1.68 .017 .026 2 1.05 4.34
C2-2 1.68 .017 .026 2 1.05 4.09
Figure B.8 Determination of concrete contributions for Columns C2-1 and C2-.2.

141
0
100
200
300
400
500
600
0 0.0025 0.005 0.0075 0.01 0.0125 0.015 0.0175 0.02
Axial Strain
Ax
ial
Lo
ad (
kip
s)
C3-1-total
C3-2-total
C3-1-concrete
C3-2-concrete
steel
longitudinal steel transverse steel concrete
specimen
As (in2) gross (%)
core (%) s (in) s (%) fc (ksi)
C3-1 1.68 .017 .026 3 .70 4.45
C3-2 1.68 .017 .026 3 .70 4.13
Figure B.9 Determination of concrete contributions for Columns C3-1 and C3-2.

142
APPENDIX C
EXPERIMENTAL STRESS-STRAIN CURVES FOR RAC COLUMNS
In this appendix the experimental stress-strain curves are presented.

143
0
1
2
3
4
5
6
7
0 0.0025 0.005 0.0075 0.01 0.0125 0.015 0.0175 0.02
Axial Strain
Str
ess
(ksi
)
A1-1-gross
A1-1-core
A1-1 cylinder fc=4.26 ksi
cover spall-off
hair cracks
fcc=4.61 ksi
1/2 fcc=2.31 ksi 0
.00
37
0.0
09
6
0.0
01
9
Figure C.1 Experimental stress-strain curve for column A1-1.
0
1
2
3
4
5
6
7
0 0.0025 0.005 0.0075 0.01 0.0125 0.015 0.0175 0.02
Axial Strain
Str
ess
(ksi
)
A1-2-gross
A1-2-core
A1-2 cylinder fc=4.41ksicover spall-off
hair cracks
`
fcc=4.74 ksi
0.0
01
9
0.0
03
5
0.0
08
3
1/2 fcc=2.37 ksi
Figure C.2 Experimental stress-strain curve for column A1-2.

144
0
1
2
3
4
5
6
7
0 0.0025 0.005 0.0075 0.01 0.0125 0.015 0.0175 0.02
Axial Strain
Str
ess
(ksi
)
A2-1-gross
A2-1-core
A2-1 cylinder fc=4.12ksicover spall-off
hair cracks
fcc=4.19 ksi
1/2 fcc=2.10 ksi
0.0
03
3
0.0
06
3
0.0
02
1
Figure C.3 Experimental stress-strain curve for column A2-1.
0
1
2
3
4
5
6
7
0 0.0025 0.005 0.0075 0.01 0.0125 0.015 0.0175 0.02
Axial Strain
Str
ess
(ksi
)
A2-2-gross
A2-2-core
A2-2 cylinder fc=4.35 ksi
cover spall-off
hair cracks
0.0
02
1
0.0
03
5
0.0
06
3
fcc=4.38 ksi
1/2 fcc=2.19 ksi
Figure C.4 Experimental stress-strain curve for column A2-2.

145
0
1
2
3
4
5
6
7
0 0.0025 0.005 0.0075 0.01 0.0125 0.015 0.0175 0.02
Axial Strain
Str
ess
(ksi
)
A3-1-gross
A3-1-core
A3-1 cylinder fc=4.26 ksi
cover spal-off
hair cracksfcc=4.14 ksi
1/2 fcc=2.07 ksi
0.0
03
0
0.0
05
2
0.0
01
8
Figure C.5 Experimental stress-strain curve for column A3-1.
0
1
2
3
4
5
6
7
0 0.0025 0.005 0.0075 0.01 0.0125 0.015 0.0175 0.02
Axial Strain
Str
ess
(ksi
)
A3-2-gross
A3-2-core
A3-2 cylinder fc=4.05 ksi
cover spall-off
hair cracks
`̀
0.0
03
3
0.0
05
4
0.0
01
8
fcc=3.96 ksi
1/2 fcc=1.98 ksi
Figure C.6 Experimental stress-strain curve for column A3-2.

146
0
1
2
3
4
5
6
7
0 0.0025 0.005 0.0075 0.01 0.0125 0.015 0.0175 0.02
Axial Strain
Str
ess
(ksi
)
B1-1-gross
B1-1-core
B1-1 cylinder fc=4.23ksicover spall-off
hair cracks
fcc=6.31 ksi
stress=4.91 ksi
0.0
02
2
0.0
05
8
0.0
2
Figure C.7 Experimental stress-strain curve for column B1-1.
0
1
2
3
4
5
6
7
0 0.0025 0.005 0.0075 0.01 0.0125 0.015 0.0175 0.02
Axial Strain
Str
ess
(ksi
)
B1-2-gross
B1-2-core
B1-2 cylinder fc=4.42ksicover spall-off
hair cracks
fcc=6.25 ksi
stress=4.44 ksi
0.0
02 2
0.0
05 3
0.0
Figure C.8 Experimental stress-strain curve for column B1-2.

147
0
1
2
3
4
5
6
7
0 0.0025 0.005 0.0075 0.01 0.0125 0.015 0.0175 0.02
Axial Strain
Str
ess
(ksi
)
B2-1-gross
B2-1-core
B2-1 cylinder fc=4.18 ksi
cover spall-off
hair cracks
fcc=5.19 ksi
1/2 fcc=2.60 ksi
0.0
01
9
0.0
05
2
0.0
11
9
Figure C.9 Experimental stress-strain curve for column B2-1.
0
1
2
3
4
5
6
7
0 0.0025 0.005 0.0075 0.01 0.0125 0.015 0.0175 0.02
Axial Strain
Str
ess
(ksi
)
B2-2-gross
B2-2-core
B2-2 cylinder fc=4.32 ksi
cover spall-off
hair cracks
0.0
01
9
0.0
04
8
0.0
11
8
fcc=5.31 ksi
1/2 fcc=2.66 ksi
Figure C.10 Experimental stress-strain curve for column B2-2.

148
0
1
2
3
4
5
6
7
0 0.0025 0.005 0.0075 0.01 0.0125 0.015 0.0175 0.02
Axial Strain
Str
ess
(ksi
)
B3-1-gross
B3-1-core
B3-1 cylinder fc=4.36 ksi
cover spall-off
hair cracks
fcc=4.94 ksi
1/2 fcc=2.47 ksi
0.0
01
6
0.0
04
2
0.0
07
2
Figure C.11 Experimental stress-strain curve for column B3-1.
0
1
2
3
4
5
6
7
0 0.0025 0.005 0.0075 0.01 0.0125 0.015 0.0175 0.02
Axial Strain
Str
ess
(ksi
)
B3-2-gross
B3-2-core
B3-2 cylinder fc=4.23 ksi
cover spall-off
hair cracks
0.0
01
6
0.0
03
8
0.0
06
7
fcc=4.83 ksi
1/2 fcc=2.42 ksi
Figure C.12 Experimental stress-strain curve for column B3-2.

149
0
1
2
3
4
5
6
7
0 0.0025 0.005 0.0075 0.01 0.0125 0.015 0.0175 0.02
Axial Strain
Str
ess
(ksi
)
C1-1-gross
C1-1-core
C1-1 cylinder fc=4.23 ksi
cover spall-off
hair cracks
fcc=6.68 ksi
stress=6.35 ksi
0.0
02
3
0.0
07
0
0.0
2
Figure C.13 Experimental stress-strain curve for column C1-1.
0
1
2
3
4
5
6
7
0 0.0025 0.005 0.0075 0.01 0.0125 0.015 0.0175 0.02
Axial Strain
Str
ess
(ksi
)
C1-2-gross
C1-2-core
C1-2 cylinder fc=4.06ksicover spall-off
hair cracks
fcc=6.45 ksi
stress=5.58 ksi
0.0
02
3
0.0
06
5
0.0
2
Figure C.14 Experimental stress-strain curve for column C1-2.

150
0
1
2
3
4
5
6
7
0 0.0025 0.005 0.0075 0.01 0.0125 0.015 0.0175 0.02
Axial Strain
Str
ess
(ksi
)
C2-1-gross
C2-1-core
C2-1 cylinder fc=4.34 ksi
cover spall-off
hair cracks
fcc=5.82 ksi
stress=4.22 ksi
0.0
01
7
0.0
04
7
0.0
2
Figure C.15 Experimental stress-strain curve for column C2-1.
0
1
2
3
4
5
6
7
0 0.0025 0.005 0.0075 0.01 0.0125 0.015 0.0175 0.02
Axial Strain
Str
ess
(ksi
)
C2-2-gross
C2-2-core
C2-2 cylinder fc=4.09 ksi
cover spall-off
hair cracks
stress=3.50 ksi
0.0
05
6
0.0
01
7
0.0
18
5
fcc=5.60 ksi
Figure C.16 Experimental stress-strain curve for column C2-2.

151
0
1
2
3
4
5
6
7
0 0.0025 0.005 0.0075 0.01 0.0125 0.015 0.0175 0.02
Axial Strain
Str
ess
(ksi
)
C3-1-gross
C3-1-core
C3-1 cylinder fc=4.45 ksi
cover spall-off
hair cracks
fcc=5.38 ksi
1/2 fcc=2.69 ksi
0.0
01
9
0.0
04
3
0.0
08
3
Figure C.17 Experimental stress-strain curve for column C3-1.
0
1
2
3
4
5
6
7
0 0.0025 0.005 0.0075 0.01 0.0125 0.015 0.0175 0.02
Axial Strain
Str
ess
(ksi
)
C3-2-gross
C3-2-core
C3-2 cylinder fc=4.13ksicover spall-off
hair cracks
fcc=5.11 ksi
0.0
02 1
0.0
04 6
0.0
08 8
1/2 fcc=2.56 ksi
Figure C.18 Experimental stress-strain curve for column C3-2.

152
REFERENCES
Ahmad, S. H. and Shah, S. (1985). Behavior of hoop confined concrete under high strain
rates. ACI Journal, 82(5), 634-647.
Ajdukiewicz , A. B. and Kliszczewicz, A. T. (2002). Influence of recycled aggregates on
mechanical properties of HS/HPC. Cement & Concrete Composites, 24, 269-279.
Ajdukiewicz , A. B. and Kliszczewicz, A. T. (2007). Comparative tests of beams and
columns made of recycled aggregate concrete and natural aggregate concrete. Journal of
Advanced Concrete Technology, 5(2), 259-273.
Blakely, R. W. G. and Park, R. (1973). Prestressed concrete sections with cyclic flexure.
ASCE Journal of Structural Division, 99(8), 1717-1742.
Buck, A. D. (1977). Recycled concrete as a source of aggregate. Journal of the American
Concrete Institute, May, 212-219.
Building Contractors Society of Japan (1978). Study on Recycled Aggregate and
Recycled Aggregate Concrete. Concrete Journal, 16(7), 18-31.
Berndt, M. L. (2009). Properties of sustainable concrete containing fly ash, slag and
recycled concrete aggregate. Construction and Building Materials, 23, 2606-2613.
Corinaldesi, V. and Moriconi G. (2009). Influence of mineral additions on the
Performance of 100% recycled aggregate concrete. Construction and Building Materials,
23, 2869-2876.
Dilger, W. H. et al. (1984). Ductility of plain and confined concrete under different strain
rates. ACI Journal, 81(1), 73-81.
Domingo-Cabo, A. (2009). Creep and shrinkage of recycled aggregate concrete.
Construction and Building Materials, 23, 2545-2553.
Etxeberria, M. et al. (2007). Recycled aggregate concrete as structural material. Materials
and Structures, 40(5), 529-541.
Evangelista, L. and de Brito, J. (2010). Durability performance of concrete made with
fine recycled concrete aggregates. Cement & Concrete Composites, 32, 9-14.
Evangelista, L. and de Brito, J. (2007). Mechanical behaviour of concrete made with fine
recycled concrete aggregates. Cement & Concrete Composites, 29, 397-401.
Fathifazl, G. et al.(2009). Shear strength of reinforced recycled concrete beams without
stirrups. Magazine of Concrete Research, 61(7), 477-490.
Franklin Associates (1998). Characterization of Building-Related Construction and
Demolition Debris in the United States. Prepared for the US Environmental Protection
Agency.
Gonzalez-Fonteboa, B. and Martinez-Abella, F. (2007). Shear strength of recycled
concrete beams. Construction and Building Materials, 21, 887-893.
Hansen, T. C. (1992). RILEM report 6-Recycling of demolished concrete and masonry.

153
Hansen, T. C. and Narud, H. (1983). Strength of recycled concrete made from crushed
concrete coarse aggregate. Concrete International, 5(1), 79-83.
Hognestad, E. (1951). A study of combined bending and axial load in reinforced
concrete members. Bulletin No. 399, Engineering Experiment Station, University of
Illinois.
Hoshikuma, J. (1997). Stress-strain Model for confined reinforced concrete in bridge
piers. ASCE Journal of Structural Engineering, 123(5), 624-623.
Kent, D. C. and Park R. (1971). Flexural members with confined concrete. ASCE Journal
of Structural Division, 97(7), 1969-1990.
Khatib, J. M. (2005). Properties of concrete incorporating fine recycled aggregate.
Cement and Concrete Research, 35, 763-769.
Kou, S. C. et al. (2007). Influence of fly ash as cement replacement on the properties of
recycled aggregate concrete on the properties of recycled aggregate concrete. ASCE
Journal of Materials in Civil Engineering, 19(9), 709-717.
Levy, S. M. and Helene, P. (2004). Durability of recycled aggregates concrete: a safe way
to sustainable development. Cement and Concrete Research, 34, 1975-1980.
Mahgoub, M. (1997). Reinforced Concrete Column Retrofit Using Steel Jackets.
Master’s Thesis. Civil Engineering Department. McMaster University, Canada.
Mander, J. B. (1988). Observed stress-strain behavior of confined concrete. ASCE
Journal of Structural Engineering, 114(8), 1827-1849.
Mander, J. B. (1988). Theoretical stress-strain model for confined concrete. ASCE
Journal of Structural Engineering, 114(8), 1804-1826.
Mukai T. and Kikuchi M. (1988). Properties of reinforced concrete beams containing
recycled aggregate. In: Kasai Y, editor. Demolition and reuse of concrete and masonry
vol. 2: reuse of demolition waste. Proceedings of the second international RILEM
symposium, pp. 670–679.
Park, R. et al. (1982). Ductility of square confined concrete columns. ASCE Journal of
the Structural Division, 108(4), 929-950.
Penelis, G. G. and Kappos, A. J. (1997). Earthquake-resistant concrete structures.: E & F
Spon.
Priestley, M. J. N., Park, R. and Potangaroa, R. T. (1981). Ductility of spirally confined
concrete columns. Proceedings of American Society of Civil. Engineers, Journal of.
Structural Division. 107 (ST1), 181-202.
Rahal, K. (2007). Mechanical properties of concrete with recycled coarse aggregate.
Building and Environment, 42, 407-415.
Rahman, I. A. (2009). Assessment of recycled aggregate concrete. Modern Applied
Science (Canadian Center of Science and Education), 3(10), 47-54.
Rasheeduzzafar and Khan A. (1984). Recycled concrete-A source for new aggregate.
Cement, Concrete, and Aggregates, 6, 17-27.

154
Ravindrarajah, R. Sri and Tam, C. T. (1985). Properties of concrete made with crushed
concrete as coarse aggregate. Magazine of Concrete Research, 37, 29-38.
Richart, F.E., Brandtzaeg, A. and Brown R. L. (1928). A study of the failure of concrete
under combined compressive stress. Bulletin No. 185, Engineering Experiment Station,
University of Illinois.
Saatcioglu, M. and Razvi, S. (1992). Strength and ductility of confined concrete. ASCE
Journal of Structural Engineering, 118(6),1590-1607.
Shah, S. P., Fafitis, A. and Arnold, R. (1983). Cyclic loading of spirally reinforced
concrete. Proceedings of American Society of Civil. Engineers, Journal of. Structural
Division, 109 (7), 1695-1710.
Sheikh, S. A. and Uzumeri, S. M. (1982). Analytical model for concrete confinement in
tied columns. ASCE Journal of the Structural Division, 108(12), 2703-2722.
Sheikh, S. A. and Uzumeri, S. M. (1980). Strength and ductility of tied concrete columns.
ASCE Journal of the Structural Division, 106(5), 1079-1101.
Simmons, P. N. (2006). The state of garbage in America. BioCycle, 47(4), 26-36.
Sinha, B. P., Gerstle, K. H. and Tulin, L. G. (1964). Stress-strain relations for concrete
under cyclic loading. Journal of the American Concrete Institute, 61 (2), 195-210.
Tam, V. W.Y. (2009). Physio-chemical reactions in recycle aggregate concrete. Journal
of Hazardous Materials, 163, 823-828.
Tam, V. W.Y. (2008). Economic comparison of concrete recycling. Conservation and
Recycling, 52, 821-828.
Topcu, I. B. and Guncan, N. F. (1995). Using waste concrete as aggregate. Cement and
Concrete Research, 25(7), 1385-1390.
Topcu, I. B. and Sengel, S. (2004). Properties of concretes produced with waste concrete
aggregate. Cement and Concrete Research, 34(1307), 1312
United States Department of Transportation (2004). Transportation applications of
recycled concrete aggregate-FHWA State of the Practice National Review.
United States Environmental Protection Agency Report EPA530-R-95-019 (2009).
Estimating 2003 building-related construction and demolition materials amount.
United States Geological Survey (2009). Annual mineral commodity summaries.
United States Environmental Protection Agency (1994). List of industrial waste landfills
and construction and demolition waste landfills.
Xiao, J. (2006). Seismic performance of frame structures with recycled aggregate
concrete. Engineering Structures, 28, 1-8.
Yamato, T. (1998). Mechanical properties, drying shrinkage and resistance to freezing
and thawing of concrete using recycled aggregate. ACI Special Publication, SP 179-7,
105-121.