copyright warning &...
TRANSCRIPT

Copyright Warning & Restrictions
The copyright law of the United States (Title 17, United States Code) governs the making of photocopies or other
reproductions of copyrighted material.
Under certain conditions specified in the law, libraries and archives are authorized to furnish a photocopy or other
reproduction. One of these specified conditions is that the photocopy or reproduction is not to be “used for any
purpose other than private study, scholarship, or research.” If a, user makes a request for, or later uses, a photocopy or reproduction for purposes in excess of “fair use” that user
may be liable for copyright infringement,
This institution reserves the right to refuse to accept a copying order if, in its judgment, fulfillment of the order
would involve violation of copyright law.
Please Note: The author retains the copyright while the New Jersey Institute of Technology reserves the right to
distribute this thesis or dissertation
Printing note: If you do not wish to print this page, then select “Pages from: first page # to: last page #” on the print dialog screen

The Van Houten library has removed some of the personal information and all signatures from the approval page and biographical sketches of theses and dissertations in order to protect the identity of NJIT graduates and faculty.
ABSTRACT
TRANSDERMAL AND TRANSBUCCAL DELIVERY OF LIDOCAINE AND NICOTINE: COMBINED EFFECTS OF IONTOPHORESIS
AND CHEMICAL ENHANCERS
by
Ran Wei
This study focused on the effects of iontophoresis and chemical enhancers on drug release.
The transport of Lidocaine HCl (LHCl) and Nicotine Hydrogen Tartrate (NHT) through
the skin and mucosa was evaluated for potential clinical applications. These two potential
delivery routes have the advantage of avoiding first-pass effect. Samples were pretreated
with enhancer solutions for one hour before the experiments. Passive or 0.3 mA
iontophoresis-assisted drug diffusion was conducted for 8 hours to monitor the
cumulative amount of drug released. Graphical methods and mathematical optimization
techniques were implemented to analyze the data. The effects of chemical enhancers on
the delivery rate depend largely on the drug used while iontophoresis mainly increases the
steady-state flux. Parametric analyses show that a balance between high flux and fast
release should be considered when conducting formulation and optimization studies.
Keywords: Iontophoresis; Enhancer; Transdermal; Transbuccal

TRANSDERMAL AND TRANSBUCCAL DELIVERY OF LIDOCAINE AND NICOTINE: COMBINED EFFECTS OF IONTOPHORESIS
AND CHEMICAL ENHANCERS
by Ran Wei
A Thesis Submitted to the Faculty of
New Jersey Institute of Technology in Partial Fulfillment of the Requirements for the Degree of
Master of Science in Pharmaceutical Engineering
Otto H. York Department of Chemical, Biological and Pharmaceutical Engineering
May 2011


APPROVAL PAGE
TRANSDERMAL AND TRANSBUCCAL DELIVERY OF LIDOCAINE AND NICOTINE: COMBINED EFFECTS OF IONTOPHORESIS
AND CHEMICAL ENHANCERS
Ran Wei Dr. Laurent Simon, Thesis Advisor Date Associate Professor of Chemical, Biological and Pharmaceutical Engineering, NJIT Dr. Piero M. Armenante, Committee Member Date Distinguished Professor of Chemical, Biological and Pharmaceutical Engineering, NJIT Dr. Norman Loney, Committee Member Date Professor of Chemical, Biological and Pharmaceutical Engineering, NJIT Dr. Bozena B. Michniak, Committee Member Date Professor of Pharmaceutics, Rutgers University

BIOGRAPHICAL SKETCH
Author: Ran Wei
Degree: Master of Science
Date: April 2011
Undergraduate and Graduate Education:
• Master of Science in Pharmaceutical Engineering,New Jersey Institute of Technology, Newark, NJ, 2011
• Bachelor of Engineering in Pharmaceutical Engineering,Beijing Institute of Technology, Beijing, P. R. China, 2005
Major: Pharmaceutical Engineering

v
Dedicated to my family
vi
ACKNOWLEDGMENT
I would like to express my appreciation to everyone who has helped me during the two
years of my Master’s study at the New Jersey Institute of Technology, Newark, NJ. First,
I thank my advisor, Dr. Laurent Simon, who gave me valuable support during my
research and preparation of this thesis. Conducting research under his guidance was a
pleasant and helpful experience. His excellent knowledge of drug delivery inspired me
and his strict academic attitude set a good example for me. Thanks to him, I understood
scientific research better and gained both a greater insight and a deeper understanding of
controlled release technology.
Second, I want to extend my gratitude to Dr. Bozena B. Michniak and Dr.
Longsheng Hu, Ernest Mario School of Pharmacy, Rutgers University, for supplying the
experimental data used in this work. Also, I would thank NexMed Inc. (San Diego, CA)
for their generous donation of the chemical enhancers DDAIP and DDAIP HCl.
Third, I am also grateful to the thesis committee members: Dr. Bozena B.
Michniak, Dr. Piero Armenante and Dr. Norman Loney. The completion of the project
would have been impossible without their support.
I acknowledge my friends both in the US and China: Xiangming Wu, Wenfeng
Xia, Shuo Yang, Xiaodong Wang, Tian Zhang and Xiaoxue Shan. Without their
encouragement, it would have been difficult for me to overcome several research
obstacles. Finally, I express my deepest gratitude to my family. Their love has been a
continuous source of inspiration. I will try to never disappoint them.

vii
TABLE OF CONTENTS
Chapter Page
1 INTRODUCTION…………………………………………………………………
1
1.1 Transdermal and Transbuccal Delivery……………………………………... 1
1.2 Chemical and Physical Enhancement……………………………………….. 2
1.3 Factors Influencing Chemically- or Physically-Aided Drug Transport………
2
1.4 Drug Selection………………………………………………………………..
3
1.5 Novelty of the Research………………………………………………………
4
2 QUANTIFICATION OF THE EFFECTS OF IONTOPHORESIS ANDCHEMICAL ENHANCERS ON TRANSDERMAL AND TRANSBUCCAL DELIVERY…………………………………………………………………………
5
2.1 Passive and Chemically-Enhanced Transport……………………………….. 5
2.2 Iontophoresis System………………………………………………………... 7
3 EXPERIMENT……………………………………………………………………..
9
3.1 Source of Experimental Data………………………………………………... 9
3.2 Methodology………………………………………………………………… 10
3.3 Modeling Work………………………………………………………………. 11
4 RESULTS AND DISCUSSTION…………………………………………………
12
4.1 Transdermal Delivery……………………………………………………….. 12
4.1.1 Case Study 1: Chemically-Enhanced Diffusion……………………... 12
4.1.2 Case Study 2: Iontophoretic-Chemical Enhancement……………….. 14

viii
TABLE OF CONTENTS (Continued)
Chapter Page
4.1.3 Discussion……………………………………………………………. 18
4.2 Transbuccal Delivery………………………………………………………… 21
4.2.1 Case study 1: Passive and Chemical Enhancement………………….. 21
4.2.2 Case Study 2: Iontophoretic and Chemical Enhancement…………… 23
4.2.3 Discussion……………………………………………………………. 27
5 CONCLUSION…………………………………………………………………….. 29

ix
LIST OF TABLES
Table Page
4.1 The Model Parameters of DDAIP Enhanced Lidocaine Transdermal Delivery System…....………………..………………… …………………………………...
13
4.2 The Model Parameters of a 0.3mA Iontophoretic Lidocaine Delivery SystemPretreated with DDAIP………..……………………………………….................
15
4.3 List of Enhanced Transdermal Delivery Systems Studied...………….………….
16
4.4 The Parameters of LHCl Transbuccal Delivery System Enhanced by DDAIP in PG……………………………………………………………………..
22
4.5 List of Enhanced Transbuccal Delivery Systems Studied..……………………...
23
4.6 Model Parameters of a 0.3mA Iontophoretic LHCl Delivery System Pretreatedwith Enhancer DDAIP in PG.………….…………………………………………
24
x
LIST OF FIGURES
Figure Page
4.1 Predicted vs. experimental cumulative amount of LHCl (Q) pretreated in a PG vehicle and the time flux profile (J). The response time used was 4 teff. The transdermal system was pretreated with 5% DDAIP in PG……………………..
13
4.2 Predicted vs. experimental cumulative amount of LHCl (Q) and the time fluxprofile (J). The response time used was 4 teff. The transdermal system was pretreated with 5% DDAIP in PG before applying 0.3 mA of current…………..
14
4.3 Drug diffusion coefficients for the enhanced transdermal delivery systems.……
16
4.4 Surface concentrations for the enhanced transdermal delivery systems.…………
17
4.5 Fluxes for the enhanced transdermal delivery systems..………………………….
17
4.6 Effective time constants for the enhanced transdermal delivery systems…..……
18
4.7 Gamma values for the iontophoretic transdermal delivery systems.......................
18
4.8 Predicted vs. experimental cumulative amount of LHCl (Q) and the time fluxprofile (J). The response time used was 4 teff. The transdermal system was pretreated with 5% DDAIP in PG……………………………………………….
22
4.9 Predicted vs. experimental cumulative amount of LHCl (Q) and the flux timeprofile (J). The response time used was 4 teff. The transdermal system was pretreated with 5% DDAIP in PG before applying 0.3 mA of current………….
24
4.10 Drug diffusion coefficients for the enhanced transbuccal delivery systems……...
25
4.11 Surface concentrations for the enhanced transbuccal delivery systems………….
25
4.12 Fluxes of the enhanced transbuccal delivery systems…………………………….
26
4.13 Effective time constants for the enhanced transbuccal delivery systems………...
26
4.14 Gamma values for the iontophoretic transbuccal delivery systems...……………. 27

1
CHAPTER 1
INTRODUCTION
1.1 Transdermal and Transbuccal Delivery
Transdermal drug delivery employs intact skin as the site for drug administration [1]. The
skin, which was once regarded as an impermeable membrane, has a unique way of
absorbing small organic molecules. The superficial layer of the epidermis, or stratum
corneum (SC), plays a critical factor in drug delivery. Most molecules penetrate through
the skin via intercellular spaces among the corneocytes of the SC. These regions are filled
with lamellar lipid structures derived from cellular granules of the viable layers of the
epidermis. Advantages, such as no first-pass metabolism in the liver, extended release and
better patient compliance, make the skin an attractive transport route. Approximately 40%
of drug products under clinical evaluation are prepared in transdermal form [1, 2].
Due to the rich supply of blood and the mild pH conditions, the oral mucosa
represents a potential site for drug delivery and absorption. Another advantage lies in the
avoidance of the first-pass elimination in the gastrointestinal (GI) tract [3]. There has
been some interest in the delivery of lidocaine and nicotine via the oral mucosa. This
option would require the study of potential enhancers because of the low permeability of
the buccal membrane which limits drug bioavailability [4].

2
1.2 Chemical and Physical Enhancement
Chemical enhancement methods may help with the transport of molecules through the SC
and mucosal membranes without damaging neighboring cells. Iontophoresis, which
causes the migration of ionic molecules in membranes by the application of an electric
field, has also been studied [5] and resulted in the FDA-approved patch, Lidosite®
(Vyteris Inc., Fairlawn, NJ) [1, 6]. In some investigations, the combination of both
enhancement approaches was evaluated [7] without focusing on a mathematical analysis
of the delivery mechanism. This work centers on the implementation of numerical tools to
assess the effects of these methods on the steady-state flux and the time to reach a desired
delivery rate.
1.3 Factors Influencing Chemically- or Physically-Aided Drug Transport
Both environmental factors and drug molecule properties control the transport rate.
Chiang et al. (1991) investigated the percutaneous absorption of the acidic drug
indomethacin and reported an increase in drug penetration when transport occurred at low
pH. However, since the drug exhibited poor solubility under such conditions, a higher pH
value was required to promote adequate drug release from the device [8]. Factors
dominating the iontophoretic delivery processes include electric field intensity (or,
current density), pH and the physicochemical properties of a drug molecule. To be
delivered under the influence of an electrical field, the drug molecule should be ionic and
in high concentration compared with competing ions (such as co-ions and counter-ions
from the buffer and endogenous environment) [9]. A suitable pH helps keep most drug

3
molecules in ionized forms [10]. Moreover, a high current density (within the range of
human tolerance) or a high level of electronic field can be applied for similar results,
although saturation effects may become a concern [11].
1.4 Drug Selection
Transdermal and transbuccal pathways for lidocaine and nicotine were considered in this
work. Lidocaine HCl (LHCl) is a local anesthetic [12, 13] administered intravenously or
via hypodermic injections [14]. Some researchers have started to study less invasive drug
delivery technologies [15, 16] such as transdermal and oral transbuccal patches. Perry et
al. [17] reported the application of transmucosal delivery of lidocaine in tooth scaling and
root planting, thereby replacing injections with local anesthetics.
Nicotine has been used to assist people endeavoring to quit smoking without
experiencing withdrawal symptoms. It is available in different dosage forms ranging from
nasal sprays [18] to transdermal formulations [19]. While transdermal nicotine hydrogen
tartrate (NRT) preparations did not lead to high nicotine levels in the blood [20], oral
transmucosal products yielded satisfactory results. Four forms are commercially available:
chewing gums (e.g. Nicorette®), lozenges (e.g. CommitTM), sublingual tablets (e.g.
Stoppers®) and oral inhalers (e.g. Nicotrol®) [21]. Relevant investigations were conducted
to evaluate the effects of those dosage forms. For instance, Muramoto et al. (2003)
reported a suppression of withdrawal symptoms following the administration of oral
transmucosal nicotine lozenges [22].

4
1.5 Novelty of the Research
The novelty of this research resides in the application of computational tools to discover
the contributions of chemical enhancers and iontophoresis to the performance of drug-
delivery systems. The way in which both methods can work in tandem will also be
investigated. For passive diffusion, governed by Fick’s law, the steady-state flux is a
function of the partition coefficient (or surface concentration), the diffusion coefficient
and the membrane thickness. The diffusion coefficient and membrane thickness fix the
effective time constant. However, when a current is applied to the membrane, a new
parameter is introduced into the model. As a result, there is a need to derive new
mathematical expressions to properly analyze the roles of the electric field [23-25]. Both
iontophoresis and chemicals may influence transport through the membranes.

5
CHAPTER 2
QUANTIFICATION OF THE EFFECTS OF IONTOPHORESIS AND CHEMICAL ENHANCERS ON TRANSDERMAL
AND TRANSBUCCAL DELIVERY
When designing controlled-release systems for lidocaine and nicotine preparations, it is
imperative to estimate the onset of action of the drug to ensure that the device is suitable
for clinical applications. This metric is usually given by the lag time (tlag) [3], which may
be a poor predictor of the time to reach a steady-state value in some cases [23]. Collins
recommended an effective relaxation time constant (teff), instead, for diffusive processes
[26]:
( )
( )
20
0
lim
lim
sss
effss
s
d ss ds
ts
s
ψψ
ψ ψ
→
→
⎛ ⎞+⎜ ⎟
⎝ ⎠=⎛ ⎞−⎜ ⎟⎝ ⎠
(2.1)
where ψ is the Laplace transform of ψ; ψss is the equilibrium value of the function. The
final expression for teff depends on the mechanisms involved. This work considers teff as
the primary indicator of the response time.
2.1 Passive and Chemically-Enhanced Transport
A model based on Fick’s second law of diffusion is applied:
2
2
C CDat x
∂ ∂=
∂ ∂ (2.2)

6
where C is the concentration at a depth x within the membrane, Da is the diffusion
coefficient of the drug in the membrane and t represents the time.
For this system, there is no drug in the membrane at the beginning of each
experiment:
C (x, 0) =0 (2.3)
The boundary conditions are:
C (0, t) = Cs; C (h, t) =0 (2.4)
where Cs is the concentration at the vehicle-membrane boundary. At the position h
(membrane thickness), a sink condition is maintained and the flux is written as:
QJt
∂=∂
(2.5)
where Q is the cumulative amount of the drug released into the receiver compartment.
The solution for the system defined by Equation (2.1–2.4) is:
2
2 2
2 2 21
( 1) exp1 26
n tDah
sn
ntDaQ hCh n
π
π
∞
=
⎡ ⎤⎛ ⎞⎡ ⎤− −⎣ ⎦⎢ ⎥⎜ ⎟= − −⎜ ⎟⎢ ⎥⎝ ⎠⎣ ⎦∑ (2.6)
After applying a long-time approximation, Equation (2.6) becomes:
2
16ss s
tDaQ hCh
⎛ ⎞= −⎜ ⎟⎝ ⎠
(2.7)
with the time derivatives given by:
ss sQ DaCt h
∂=
∂ (2.8)
According to Equation (2.5), the steady-state flux is:
sss
DaCJh
= (2.9)
The effective time, available from an analytical solution, and the lag time are [24]:

7
27
60effhtDa
= (2.10)
and
2
6laghtDa
= (2.11)
respectively.
2.2 Iontophoresis System
The classic Fick’s second law expression for the iontophoretic systems is:
2
2
C C D CDat x h x
γ∂ ∂ ∂= −
∂ ∂ ∂ (2.12)
where γ is a dimensionless number that stands for the influence of current. The convective
flow of ionic drug transport across the membrane is neglected. The cumulative amount of
drug released is [23, 24]:
222 2
2 2 2
221 2 2
sinh 42 ( 1)2 1 exp1 2
2 4
ns
n
n tDaDaC h nQ t
h e Dan
γ
γγ πγ π
γ γ π
∞
−=
⎧ ⎫⎡ ⎤⎛ ⎞⎛ ⎞⎛ ⎞⎪ ⎪⎢ ⎥⎜ ⎟+⎜ ⎟⎜ ⎟⎪ − ⎪⎢ ⎥⎜ ⎟⎝ ⎠ ⎝ ⎠= + − −⎨ ⎬⎢ ⎥⎜ ⎟− ⎛ ⎞⎪ ⎪⎢ ⎥⎜ ⎟+⎜ ⎟⎪ ⎪⎜ ⎟⎢ ⎥⎝ ⎠ ⎝ ⎠⎣ ⎦⎩ ⎭
∑ (2.13)
The steady-state conditions are:
2
2
sinh cosh2 2 2 2
1 2 sinh2
sss
DaC hQ th e Dγ
γ γ γγ
γγ−
⎡ ⎤⎛ ⎞ ⎛ ⎞−⎜ ⎟ ⎜ ⎟⎢ ⎥⎝ ⎠ ⎝ ⎠⎢ ⎥= +− ⎛ ⎞⎢ ⎥
⎜ ⎟⎢ ⎥⎝ ⎠⎣ ⎦
(2.14)

8
and
1
sss
DaCJh e γ
γ−=
− (2.15)
The determination of the effective time and lag time yields [23]:
( ) ( ) ( )( )2 2 2 2
2
csc h 3 2sinh 4 cosh 42
4 coth 22
eff
ht
Da
γ γ γ γ γ γ
γγ γ
⎛ ⎞ − + − +⎜ ⎟⎝ ⎠=
⎛ ⎞⎛ ⎞ −⎜ ⎟⎜ ⎟⎝ ⎠⎝ ⎠
(2.16)
2
2
2sinh cosh2 2
sinh2
laghtDa
γ γγ
γγ
⎛ ⎞ ⎛ ⎞−⎜ ⎟ ⎜ ⎟⎝ ⎠ ⎝ ⎠= −
⎛ ⎞⎜ ⎟⎝ ⎠
(2.17)
Equation (2.6–2.17) will be used to study the effects of chemical enhancers and the
electric field on the drug release.

9
CHAPTER 3
EXPERIMENT
3.1 Source of Experimental Data
The original data were supplied by Dr. Bozena B. Michniak-Kohn and Dr. Longsheng Hu.
The enhancing roles of several chemicals were examined in this work.
Azone (1-dodecylazacycloheptan-2-one or laurocapram) was the first artificially
designed skin penetration enhancer. The compound is compatible with most organic
solvents including propylene glycol (PG). Its effectiveness lies in the ability to partition
into the bilayer lipids and to interfere with the stacking arrangement, thus raising the
diffusion of various drugs including antiviral agents, antibiotics and steroids [1].
Dodecyl-2-(N,N-dimethyl amino) (DDAIP) and dodecyl-2-(N,N-dimethyl amino)
propionate hydrochloride (DDAIP HCl) are long chained alcohols. DDAIP is not
water-soluble, but dissolves in water-alcohol mixtures and most organic solvents; DDAIP
HCl is soluble in water. The enhancement mechanism of both molecules involves interactions
with SC keratin, resulting in the increase in hydration efficiency and thereby skin penetration.
The effect of DDAIP in promoting drug permeability is comparable to that of azone [27].
Br-iminosulfurane was also examined in this study. Due to the interaction between
its aromatic ring structure and the skin’s lipid plane, the small br-iminosulfurane
molecule is able to affect drug diffusion by attaching to the SC. In addition, the presence
of the solvent may induce further enhancement [28].

10
Propylene glycol (PG) was used as the enhancer vehicle. The combined effects of
chemical enhancers and iontophoresis were also studied. Previous work by Nolan et al.
(2007) showed that the treatments could have a synergistic effect on the permeation of
salbutamol [7].
3.2 Methodology
The experimental protocols are provided in Hu’s work [9]. A Franz diffusion cell system
(PermeGear, Inc., Hellertown, PA, USA), with a donor cell and a receiver compartment,
was used as the in-vitro model. The donor cell contained the prepared drug solution and
the receiver cell was filled with a phosphate buffer saline (PBS) solution at physiological
pH. The tissue samples used in the study originated from the skin and cheek mucosa of a
pig. Before each experiment, the membranes were placed in PBS at physiological pH for
one hour. They were then inserted between two chambers with the exterior side of tissue
facing the donor side. The drug solution was added into the donor compartment at the
beginning of each experiment. Three hundred micro liter samples were collected from the
receptor cell at specific times. For the enhancer pretreatments, 30 μL chemical enhancer
solutions were added to the upper surface of the tissue. The system remained quiescent
for one hour. During the iontophoretic delivery experiments, an Ag-AgCl electrode was
employed to keep a controlled current density of 0.47 mA/cm2 (for the 0.64 cm2 effective
diffusion area) between the two sides of the membrane for 8 hours. The experiment was
conducted at 37 °C using the protocol in [9].

11
3.3 Modeling Work
The model parameters were calculated using a technique similar to the one adopted in [25]
and Equation (2.6), (2.7), (2.13) and (2.14). In the absence of an electric field, the lag
time method, based on Equation (2.7), was implemented. Data, at the beginning of the
experiment, were removed until a linear trend (i.e., steady-state diffusion) was observed.
Extrapolation would give the x-intercept (lag time) and the slope of the line (steady-state
flux). With these two terms known, the values of the diffusion coefficient and surface
concentration can be estimated using Equation (2.8) and (2.11). For iontophoresis, it was
assumed that the diffusion coefficient did not change from the value obtained for passive
diffusion. The lag time was plotted and the root γ estimated. The concentration Cs was
calculated from the slope of Q. Equation (2.6) and (2.14) were applied with a nonlinear
regression routine, in MATLAB (Natick, MA), to refine the results from the graphical
methods:
2
,{ , , } 1
( , , )min i i eDa Cs i
Q Da Cs Qγ
γ∞
=
⎡ ⎤−⎣ ⎦∑ (3.1)
and
2
,{ , } 1
( , )min i i eDa Cs i
Q Da Cs Q∞
=
⎡ ⎤−⎣ ⎦∑ (3.2)

12
CHAPTER 4
RESULTS AND DISCUSSION
The case studies investigated differ by the transport mechanism (passive or iontophoeretic
delivery), the nature of the drug and the type of chemical pretreatment. Appropriate
equations were chosen to analyze the release kinetics and help decipher the specific roles
of chemical enhancers and iontophoresis in the transdermal or transmucosal delivery. The
methodology will help identify systems that meet the objectives of high flux and quick
drug delivery.
4.1 Transdermal Delivery
4.1.1 Case study 1: Chemically-Enhanced Diffusion
Figure 4.1 shows the data for the diffusion of LHCl across the skin (thickness: 550±
50μm) using PG as the vehicle. The procedure was described in Section 3.2. The
predictions agree very well with the laboratory data (Figure 4.1). The calculated
parameter values are listed in Table 4.1. As stated previously, the effective time constant
is a measure of the time it takes the flux to reach an equilibrium value. Based on the
definition in [29, 30], the response time can be viewed as the time elapsed before J
reaches 98% of Jss, or about 4 times the time needed to attain 63.2% of the Jss, (4teff). In
the following discussions, the parameter 4teff denotes the response time constant unless
specified otherwise.

13
Figure 4.1 Predicted vs. experimental cumulative amount of LHCl (Q) pretreated in a PG vehicle and the time flux profile (J). The response time used was 4 teff. The transdermal system was pretreated with 5% DDAIP in PG.
Table 4.1 The Model Parameters of DDAIP Enhanced LHCl Transdermal Delivery System
Thickness of mucosa, h (μm) 550 ± 50
Diffusion coefficient, Da (cm2/hr) 0.00025 ± 0.00010
Surface concentration, Cs (μg/cm3) 4028.94 ± 2344.21
Effective time, teff (hr) 1.42 ± 0.64
Lag time, tlag (hr) 2.02 ± 0.91
Flux, J (μg/cm2hr) 18.24 ± 13.10

14
4.1.2 Case Study 2: Iontophoretic-Chemical Enhancement
These data were generated from 0.47mA/cm2 current-assisted LHCl diffusion across a
dermal membrane pretreated with 5% DDAIP in PG. In this case, Equition (2.12-2.13)
determined the cumulative amount of drug released. Figure 4.2 shows a good agreement
between predicted and experimental data. The calculated parameter values are listed in
Table 4.2.
Figure 4.2 Predicted vs. experimental cumulative amount of LHCl (Q) and the time flux profile (J). The response time used was 4 teff. The transdermal system was pretreated with 5% DDAIP in PG before applying 0.3 mA of current.

15
Table 4.2 The Model Parameters of a 0.3mA Iontophoretic Lidocaine Delivery System
Pretreated with DDAIP
Thickness of mucosa, h (μm) 550 ± 50
Diffusion coefficient, Da (cm2/hr) 0.00025 ± 0.00010
Surface concentration, Cs (μg/cm3) 25496.30 ± 7619.05
Dimensionless number, γ 4.75 ± 1.36
Effective time, teff (hr) 1.00 ± 0.47
Lag time, tlag (hr) 0.62± 0.26
Flux, J (μg/cm2hr) 553.15 ± 230.02
The examples, given above, show that the mathematical models in Section 3.3 are
well suited to explain passive and iontophoretic transports. Table 4.3 lists the systems
investigated and the results are depicted in Figures 4.3-4.6.

16
Table 4.3 List of Enhanced Transdermal Delivery Systems Studied
No. System
1 Transdermal LHCl passive for 8 hrs
2 LHCl Transdermal - PG pretreatment for 1.0 hr
3 LHCl Transdermal - 2.5% Azone in PG pretreatment for 1.0 hr
4 LHCl Transdermal - 5% Br-iminosulfurane in PG pretreatment for 1.0 hr
5 LHCl Transdermal - 5% DDAIP HCl in PG pretreatment for 1.0 hr
6 LHCl Transdermal - 5% DDAIP HCl in water pretreatment for 1.0 hr
7 Transdermal - Nicotine Hydrogen Tartrate (NHT) control
8 Transdermal - NHT PG pretreatment for 1 hr
9 Transdermal - NHT 2.5% Azone in PG pretreatment for 1 hr
10 Transdermal - NHT 5% Br-iminosulfurane in PG pretreatment for 1 hr
11 Transdermal – NHT 5% DDAIP in PG pretreatment for 1 hr
12 Transdermal – NHT 5% DDAIP HCl in PG pretreatment for 1 hr
13 Transdermal – NHT 5% DDAIP HCl in water pretreatment for 1 hr
Diffusion Coefficient
0
0.0005
0.001
0.0015
0.002
0.0025
0.003
1 2 3 4 5 6 7 8 9 10 11 12 13
System
Da (cm2/hr)
Original
0.3 mA
Figure 4.3 Drug diffusion coefficients for the enhanced transdermal delivery systems.

17
Surface Concentration
0
5000
10000
15000
20000
25000
30000
35000
1 2 3 4 5 6 7 8 9 10 11 12 13
System
Cs (μ
g/cm
3 )
Original
0.3mA
Figure 4.4 Surface concentrations for the enhanced transdermal delivery systems.
Flux
0
200
400
600
800
1000
1 2 3 4 5 6 7 8 9 10 11 12 13
System
J (μg
/cm
2 hr)
Original
0.3mA
Figure 4.5 Fluxes for the enhanced transdermal delivery systems.

18
Effective Time
0
0.5
1
1.5
2
2.5
1 2 3 4 5 6 7 8 9 10 11 12 13
System
teff
(hr)
Original
0.3mA
Figure 4.6 Effective time constants for the enhanced transdermal delivery systems.
Gamma
0
5
10
15
20
1 2 3 4 5 6 7 8 9 10 11 12 13
System
γ 0.3 mA
Figure 4.7 Gamma values for the iontophoretic transdermal delivery systems.
4.1.3 Discussion
4.1.3.1 Passive and Chemically-Enhanced Delivery. For passive and chemically-
enhanced deliveries, the diffusion coefficient (Da) and surface concentration (Cs) were
the key model parameters. Based on Figure 4.3 and 4.4, not all chemical enhancers would
bring an increase in Da and Cs. For example, in system 13 (5% DDAIP HCl in water), the
pretreatment led to a decrease in the diffusion coefficient (0.00047 ± 0.00010 cm2/hr).

19
Figure 4.5 and 4.6 show the effects of pretreatments on the flux and the effective
time constants, respectively. For example, in the delivery of LHCl, the highest flux level
was detected when the membrane was pretreated with 5% br-iminosulfurane in PG for 1.0
hr (35.28 ± 18.94 μg/cm2hr). However, the shortest response time corresponded to 5%
DDAIP HCl in water (0.76 ± 0.36 hr, 4teff). The enhancement effects were also
drug-specific. For the NHT transport, the highest flux and shortest response time were
obtained when the skin was pretreated with 5% DDAIP in PG and 5% br-iminosulfurane,
respectively.
The figures also revealed the roles played by Da and Cs in the diffusion process.
Equation 2.10 demonstrates that Da is the main factor influencing teff. The system with
the highest Da should produce the shortest response time. Both Da and Cs are important
in determining the delivery rate. For example, in NHT delivery, system 10 (5%
br-iminosulfurane) has the highest Da level and the shortest response time, whereas
system 13 has the largest Cs value. System 11 (5% DDAIP in PG) yields the largest flux
with moderate Da and Cs values.
4.1.3.2 Iontophoresis-chemical Enhancement. The introduction of parameter γ, in
Equation 2.11, reflects the difference between passive and iontophoretic transport. The
definition expression for γ is:
/zF RTγ = ΔΨ (4.1)
where z is defined as the charge on the drug molecule; F is the Faraday constant; ΔΨ
represents the voltage drop across the membrane (proportional to the resistance of
membrane under the same current condition); R is the ideal gas constant and T is the

20
absolute temperature. The value of γ varies with the chemical enhancer used (Figure 4.7).
These results also show that the membrane resistance has been modified, indicating an
alteration in the physiological properties of the membrane. A sharp increase in the Cs can
be seen in Figure 4.4 following the application of an electric current. As expected, no
significant changes were detected in Da, except for systems 4, 6 and 10, where a decrease
was recorded.
The flux and effective time are used to evaluate the effectiveness of the delivery
systems. According to Figure 4.5, the flux, resulting from the iontophoretic-chemical
enhancement, increases compared to the original passive or chemically-enhanced system.
For the same drug, the flux variations were of the same order of magnitude regardless of
the enhancers applied. As for the response time constant, the enhancement is less
significant than the flux. With enhancers, such as 5% br-iminosulfurane in PG
pretreatment (system 4), 5% DDAIP HCl in PG pretreatment (system 5) and 5% DDAIP
HCl in water pretreatment (system 6), the iontophoresis would delay drug delivery, which
can be regarded as a further proof of a change in the membrane structure.
To obtain a high LHCl blood drug concentration for cure, any pretreatment except
5% DDAIP HCl in PG (system 5) is acceptable, since the enhancers play no significant
role in increasing the transport rate compared with the control (Figure 4.5). However, if a
quick response is needed, system 5 or 1 can be selected. For NHT delivery, all of the
pretreatments, except 12 (NHT 5% DDAIP HCl in PG) and 13, can be applied to reach a
large flux. Enhancer 11 or the enhancer-free control can be chosen if a fast transport rate
is required.

21
4.2 Transbuccal Delivery
The transbuccal delivery data were analyzed using the methodology implemented in the
transdermal studies. A 350 (± 50) μm thick swine cheek mucosa sample was used. Two
representative case studies are given below to compare the experimental data with the
predictions from the models when chemical and iontophoretic - chemical enhancements
were applied.
4.2.1 Case study 1: Passive and Chemical Enhancement
Figure 4.8 illustrate how well the theoretical models predict the experimental data. The
data given in Figure 4.8 were obtained from the delivery of LHCl across a transbuccal
mucosa pretreated by 5% DDAIP with PG as the vehicle. A good agreement was
observed between the two data sets (Figure 4.9). The computed parameters are listed in
Table 4.4. The response time constant (4teff) is also shown in the graph.

22
Figure 4.8 Predicted vs. experimental cumulative amount of LHCl (Q) and the time flux profile (J). The response time used was 4 teff. The transdermal system was pretreated with 5% DDAIP in PG.
Table 4.4 The Parameters of LHCl Transbuccal Delivery System Enhanced by DDAIP in PG
Thickness of mucosa, h (μm) 350 ± 50
Diffusion coefficient, Da (cm2/hr) 0.00026 ± 0.00003
Surface concentration, Cs (μg/cm3) 13392.99 ± 1971.30
Effective time, teff (hr) 0.55 ± 0.17
Lag time, tlag (hr) 0.79 ± 0.25
Flux, J (μg/cm2hr) 99.37 ± 24.04

23
The enhanced transdermucosal systems studied are listed in Table 4.5.
Table 4.5 List of Enhanced Transbuccal Delivery Systems Studied
No. System
1 LHCl Transbuccal – Control (passive)
2 LHCl Transbuccal – PG Pretreated 1.0 hr
3 LHCl Transbuccal - 2.5% Azone in PG Pretreated 1.0 hr
4 LHCl Transbuccal – 5% Br-iminosulfurane in PG Pretreated 1.0 hr
5 LHCl Transbuccal – 5% DDAIP in PG Pretreated 1.0 hr
6 LHCl Transbuccal – 5% DDAIP HCl in PG Pretreatment 1.0 hr
7 LHCl Transbuccal - 5% DDAIP HCl in water Pretreatment 1.0 hr
8 NHT Transbuccal - Control (passive)
9 NHT Transbuccal –5% Br-iminosulfurane in PG pretreatment for 1 hr
10 NHT Transbuccal –5% DDAIP in PG pretreatment for 1 hr
11 NHT Transbuccal – 5% DDAIP HCl in PG pretreatment for 1 hr
12 NHT Transbuccal – 5% DDAIP HCl in water pretreatment for 1 hr
4.2.2 Case Study 2: Iontophoretic and Chemical Enhancement
For the study of the combined effect of iontophoresis and chemical enhancers, a direct
current with an intensity of 0.47mA/cm2 was applied to the mucosa sample. The systems
in Table 4.5 were investigated. The experimental procedures were described in Section
3.2. Figure 4.7 shows the performance of the model in predicting the cumulative amount
of drug released. A detailed list of the parameters is included in Table 4.6.

24
Figure 4.9 Predicted vs. experimental cumulative amount of LHCl (Q) and the flux time profile (J). The response time used was 4 teff. The transdermal system was pretreated with 5% DDAIP in PG before applying 0.3 mA of current.
Table 4.6 Model Parameters of a 0.3mA Iontophoretic LHCl Delivery System Pretreated with Enhancer DDAIP in PG
Thickness of mucosa, h (μm) 350 ± 50
Diffusion coefficient, Da (cm2/hr) 0.000064 ± 0.000003
Surface concentration, Cs (μg/cm3) 29070.09 ± 4361.61
Dimensionless number, γ 6.76 ± 0.53
Effective time, teff (hr) 1.24 ± 0.37
Lag time, tlag (hr) 1.99 ± 0.14
Flux, J (μg/cm2hr) 361.69 ± 80.10

25
The results show that the mathematical modeling methodology given in Section
3.2 is also suitable for the transbuccal delivery studies. The parameters for the remaining
systems are given in Figures 4.9-4.11.
Diffusion Coefficient
0
0.0001
0.0002
0.0003
0.0004
0.0005
1 2 3 4 5 6 7 8 9 10 11
System
Da
(cm
2 /hr)
Original0.3mA
Figure 4.10 Drug diffusion coefficients for the enhanced transbuccal delivery systems.
Surface Concentration
0
20000
40000
60000
80000
100000
120000
1 2 3 4 5 6 7 8 9 10 11
System
Cs (μg
/cm
3 )
Original
0.3mA
Figure 4.11 Surface concentrations for the enhanced transbuccal delivery systems.

26
Flux
0100200300400500600700
1 2 3 4 5 6 7 8 9 10 11
System
J (μg
/cm
2 hr)
Original0.3mA
Figure 4.12 Fluxes of the enhanced transbuccal delivery systems.
Effective Time
0
0.5
1
1.5
2
2.5
3
1 2 3 4 5 6 7 8 9 10 11
System
teff
(hr) Original
0.3mA
Figure 4.13 Effective time constants for the enhanced transbuccal delivery systems.

27
Gamma
02468
10121416
1 2 3 4 5 6 7 8 9 10 11
System
γ 0.3 mA
Figure 4.14 Gamma values for the iontophoretic transbuccal delivery systems.
4.2.3 Discussion
4.2.3.1 Passive and Chemically-Enhanced Delivery. As described in sub-section
4.1.3.1, for passive and chemically-enhanced oral transmucosal delivery, Da and Cs were
the key factors that determine the rate and the level of drug delivery. From Figure 4.9, it
can be observed that the effect of chemical enhancement differs significantly for the two
drugs as indicated by the values of Da or Cs, which influences the delivery rates and
response times.
The highest LHCl flux was obtained with the 5% DDAIP HCl in water
pretreatment (system 7): 19357.64 ± 369.90μg/cm2hr. However, the shortest response
time was recorded for the 5% DDAIP in PG pretreatment (system 5): 2.20 ± 0.68 hr (4teff).
Similarly, there is no optimal NHT delivery that produces both a high steady-state flux
and a fast delivery. The 5% DDAIP HCl in PG pretreatment (system 11) gave the highest
flux, whereas the control group (system 8, no enhancers added) yields the shortest
response time. The value of the effective time constant varies with Da.

28
Further analysis of Figures 4.10-4.12 suggests the relative contributions of Da and
Cs in determining the flux value. Although both parameters influence the flux according
to Equation 2.2, the data reveal that Cs is the main driving force in increasing the flux.
The enhancers did not bring significant changes to Da (e.g. a one fold increase in system
5 compared with the control), but were able to increase Cs dramatically (Figure 4.11).
4.2.3.2 Iontophoretic-Chemical Enhancement. As described in sub-section 4.1.3.
2, the variations in γ (Figure 4.13) are indicative of an alteration in the structure of the
mucosa sample as a result of the chemical enhancers.
The application of current increased the flux significantly. However, iontophoresis
did not play an important role in changing the effective time constant. A moderate
decrease in teff was observed when delivering LHCl pretreated with 5% DDAIP HCl in
PG (system 6). Similar observations were made for the release of NHT pretreated with
5% br-iminosulfurane in PG and 5 % DDAIP in PG (systems 9 and 10, respectively).
However, in other cases, an increase in teff was noticed. If the flux was the only criterion
for enhancer selection, the pretreatment with 5% DDAIP HCl in PG or 5% DDAIP HCl
in water are viable selections as they both resulted in high LHCl delivery rates. However,
based on the response time, the former system was a better selection (1.3 hr vs. 2.8hr, in
terms of 4teff). In the case of NHT transbuccal delivery, the synergistic effect between the
current and chemical enhancer is apparent for the 5% DDAIP HCl in PG and 5% DDAIP
HCl in water (system 11), although the latter exhibits a shorter response time (3.8hr vs.
2.9 hr, 4teff).

29
CHAPTER 5
CONCLUSION
The discussions above suggest several important points. First, pretreatment with the same
chemical enhancer may lead to different results depending on the nature of the membrane
(e.g., skin and oral mucosa). For example, the 5% DDAIP HCl in water pretreatment
results in a sharp increase in the diffusion coefficient for transermal LHCl delivery.
However, when applied to LHCl oral transmucosal delivery, only a mild improvement
was detected in the same parameter. Second, the influence of the enhancers also varies
with the drug analyzed. In the presence of br-iminosulfurane in PG pretreatment, a
synergistic effect between iontophoresis and chemical enhancers increases LHCl flux.
The combination did not produce similar results in the case of NHT transport. Third, the
relative contributions of iontophoresis and chemical enhancers change with the drug and
the membrane. Iontophoresis plays a significant role in increasing the steady-state flux
regardless of the pretreatment. The overall extent of increase seems to be higher for LHCl
than NHT. On the other hand, chemical enhancers play an important role in determining
the response time. In fact, only a few pretreatments were able to increase the flux and
decrease the response time simultaneously. As seen from the figures, when designing a
delivery system several factors, such as the drug (LHCl or NHT), the membrane (dermal
or mucosa) and the enhancer (chemical enhancer or iontophoresis) need to be considered.
The approach proposed in this work provides a method to quantify the influences
of iontophoretic and chemical enhancers on controlled delivery systems. In the

30
development of a suitable drug-release device, the notion of an “optimum design” should
be linked to both the delivery rate (Jss) and the time to reach Jss: a high flux does not
guarantee a quick response time. Even when a balance between the two design criteria is
achieved, the desired clinical outcomes should determine the strategy adopted in the end.

31
REFERENCES
[1] Pathan IB, Setty CM. Chemical Penetration Enhancers for Transdermal Drug Delivery Systems. Trop J Pharm Res. 2009;8(2):173-9
[2] Bauerová K, Matušová D, Kassai Z. Chemical enhancers for transdermal drug transport. Eur J Drug Metab Ph. 2001;26(1-2):85-94.
[3] Sangeetha S, Venkatesh DN, Krishan PN, Saraswathi R. Mucosa as a route for systemic drug delivery, Res J Pharm Biol Chem Sci. 2010;1(3):178-87.
[4] Hassan N, Ahad A, Ali M, Ali J. Chemical permeation enhancers for transbuccal drug delivery. Expert Opin Drug Del. 2010;7(1):97-112.
[5] Siddharth V, Singh PA, Kumar JD, Iontophoresis – an advancement in transdermal drug delivery system. IJPT. 2010;2(3):345-53.
[6] Dixit N, Bali V, Baboota S, Ahuja A, Ali J. Iontophoresis - An Approach for Controlled Drug Delivery: A Review. Curr. Drug Delivery. 2007;4(1):1-10.
[7] Nolan LMA, Corish J, Corrigan OI, Fitzpatrick D. Combined effects of iontophoretic and chemical enhancement on drug delivery II. Transport across human and murine skin. Int. J. of Pharm. 2007;341(1-2):114–24.
[8] Chiang C, Lai J, Yang K. The Effects of pH and chemical enhancers on the percutaneous absorption of indomethacin. Drug Dev Ind Pharm. 1991;17(1):91-111.
[9] Hu L. Transdermal and transbuccal drug delivery enhancement using iontophoresis and chemical enhancers. Ph.D Thesis. New Brunswick, New Jersey: Rutgers University; 2010. 254.
[10] Siddiqui O, Roberts MS, Polack AE. The effect of iontophoresis and vehicle pH on the in-vitro permeation of lignocaine through human stratum corneum. J Pharm Pharmacol. 1985 Oct; 37(10):732-5.
[11] Cázares-Delgadillo J, Naik A, Ganem-Rondero A, Quintanar-Guerrero D, Kalia YN. Transdermal delivery of cytochrome C--A 12.4 kDa protein--across intact skin by constant-current iontophoresis. Pharm Res. 2007 Jul;24(7):1360-8.
[12] Smith DW, Peterson MR, DeBerard SC. Regional anesthesia. Nerve blocks of the extremities and face. Postgrad Med. 1999 Oct 1;106(4):69-73, 77-8.
[13] Pfeifer HJ, Greenblatt DJ, Koch-Weser J. Clinical use and toxicity of intravenous lidocaine: A report from the Boston Collaborative Drug Surveillance Program, Am Heart J. 1976 Aug;92(2):168-73.
[14] Lee PJ, Ahmad N, Langer R, Mitragotri S, Prasad Shastri V. Evaluation of chemical enhancers in the transdermal delivery of lidocaine Int J Pharm. 2006 Feb 3;308(1-2):33-9.
[15] Varshosaz J, Karimzadeh S. Development of cross-linked chitosan films for oral mucosal delivery of lidocaine. Res. in Pharm. Sci. 2007;2(1):43-52.
32
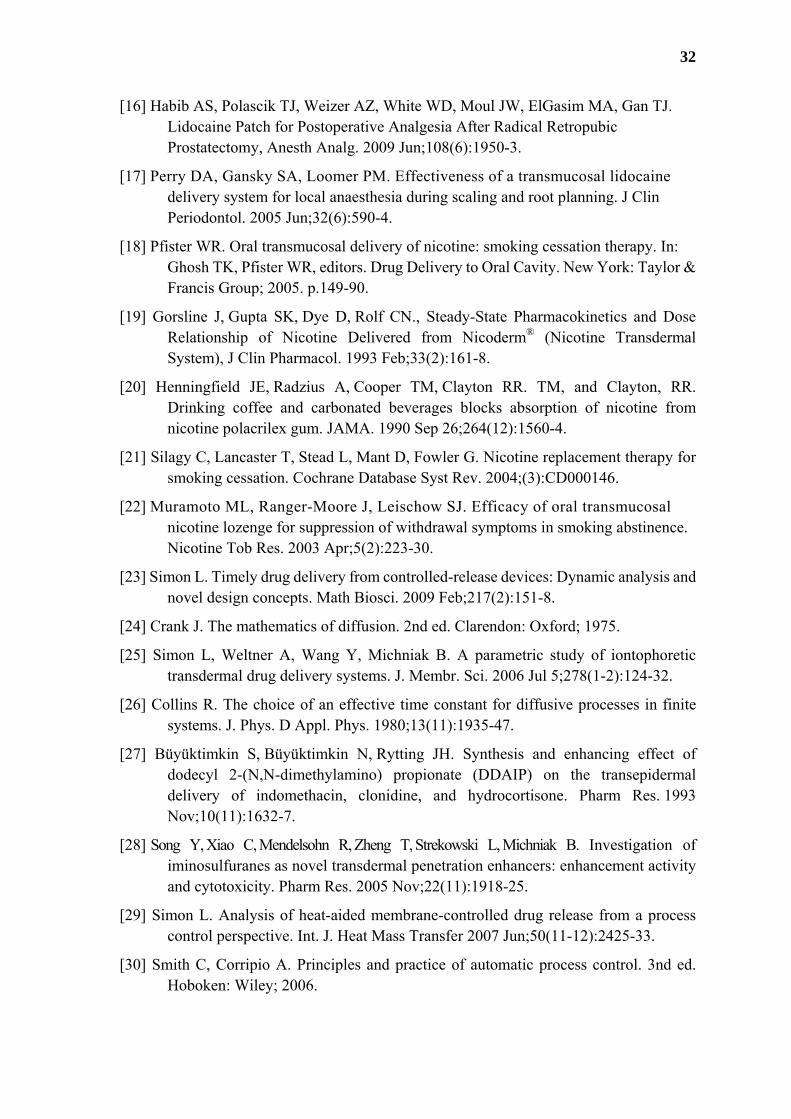
[16] Habib AS, Polascik TJ, Weizer AZ, White WD, Moul JW, ElGasim MA, Gan TJ. Lidocaine Patch for Postoperative Analgesia After Radical Retropubic Prostatectomy, Anesth Analg. 2009 Jun;108(6):1950-3.
[17] Perry DA, Gansky SA, Loomer PM. Effectiveness of a transmucosal lidocaine delivery system for local anaesthesia during scaling and root planning. J Clin Periodontol. 2005 Jun;32(6):590-4.
[18] Pfister WR. Oral transmucosal delivery of nicotine: smoking cessation therapy. In: Ghosh TK, Pfister WR, editors. Drug Delivery to Oral Cavity. New York: Taylor & Francis Group; 2005. p.149-90.
[19] Gorsline J, Gupta SK, Dye D, Rolf CN., Steady-State Pharmacokinetics and Dose Relationship of Nicotine Delivered from Nicoderm® (Nicotine Transdermal System), J Clin Pharmacol. 1993 Feb;33(2):161-8.
[20] Henningfield JE, Radzius A, Cooper TM, Clayton RR. TM, and Clayton, RR. Drinking coffee and carbonated beverages blocks absorption of nicotine from nicotine polacrilex gum. JAMA. 1990 Sep 26;264(12):1560-4.
[21] Silagy C, Lancaster T, Stead L, Mant D, Fowler G. Nicotine replacement therapy for smoking cessation. Cochrane Database Syst Rev. 2004;(3):CD000146.
[22] Muramoto ML, Ranger-Moore J, Leischow SJ. Efficacy of oral transmucosal nicotine lozenge for suppression of withdrawal symptoms in smoking abstinence. Nicotine Tob Res. 2003 Apr;5(2):223-30.
[23] Simon L. Timely drug delivery from controlled-release devices: Dynamic analysis and novel design concepts. Math Biosci. 2009 Feb;217(2):151-8.
[24] Crank J. The mathematics of diffusion. 2nd ed. Clarendon: Oxford; 1975.
[25] Simon L, Weltner A, Wang Y, Michniak B. A parametric study of iontophoretic transdermal drug delivery systems. J. Membr. Sci. 2006 Jul 5;278(1-2):124-32.
[26] Collins R. The choice of an effective time constant for diffusive processes in finite systems. J. Phys. D Appl. Phys. 1980;13(11):1935-47.
[27] Büyüktimkin S, Büyüktimkin N, Rytting JH. Synthesis and enhancing effect of dodecyl 2-(N,N-dimethylamino) propionate (DDAIP) on the transepidermal delivery of indomethacin, clonidine, and hydrocortisone. Pharm Res. 1993 Nov;10(11):1632-7.
[28]iiiSong Y, Xiao C, Mendelsohn R, Zheng T, Strekowski L, Michniak B. Investigation of iminosulfuranes as novel transdermal penetration enhancers: enhancement activity and cytotoxicity. Pharm Res. 2005 Nov;22(11):1918-25.
[29] Simon L. Analysis of heat-aided membrane-controlled drug release from a process control perspective. Int. J. Heat Mass Transfer 2007 Jun;50(11-12):2425-33.
[30] Smith C, Corripio A. Principles and practice of automatic process control. 3nd ed. Hoboken: Wiley; 2006.