cover sheet - southchinaresourcesinc.com.ph · (business address: no., street city / town /...
TRANSCRIPT

SOC SEC FORM 17A 2017
COVER SHEET A S 0 9 2 0 6 4 4 1
SEC Registration Number
S O C R E S O U R C E S I N C .
(Company’s Full Name)
E N Z O B L D G 3 9 9 S E N G I L P U Y A T
A V E N U E M A K A T I C I T Y
(Business Address: No., Street City / Town / Province)
Ronna C. De Leon 8041978/8041977 Contact Person Company Telephone Number
SEC FORM 17-A
(last Friday of May)
1 2 3 1 0 5 2 5 Month Day FORM TYPE Month Day
Fiscal Year Annual Meeting
Not Applicable Secondary License Type, If Applicable
Dept Requiring this Doc Amended Articles Number / Section
Total Amount of Borrowings
362 Total No. of Stockholders Domestic Foreign
To be accomplished by SEC Personnel concerned
File Number LCU
Document ID Cashier
S T A M P S
Remarks: Please use BLACK ink for scanning purposes

SECURITIES AND EXCHANGE COMMISSION
SEC FORM 17-A
ANNUAL REPORT PURSUANT TO SECTION 17
OF THE SECURITIES REGULATION CODE AND SECTION 141
OF THE CORPORATION CODE OF THE PHILIPPINES 1. For the fiscal year ended December 31, 2017
2. SEC Identification Number ASO92-06441 3. BIR Tax Identification No. 001-945-016
4. Exact name of issuer as specified in its charter SOCResources, Inc.
5. Not Applicable 6. (SEC Use Only)
Province, Country or other jurisdiction of Industry Classification Code:
Incorporation or organization
7.
4th Floor Enzo Building 399 Senator Gil Puyat Avenue, Makati
City
1209
Address of principal office Postal Code
8. (632) 804-1978 / 804-1977
Issuer’s telephone number, including area code
9. SOUTH CHINA RESOURCES, INC./ ENZO Bldg. Senator Gil Puyat Avenue
Makati City
Former name, former address and former fiscal year, if changed since last report.
10. Securities registered pursuant to Sections 8 and 12 of the SRC, or Sec. 4 and 8 of the RSA Title of Each Class Number of Shares of Common Stock
Outstanding and Amount of Debt Outstanding
Common Shares 901,920,568
11. Are any or all of these securities listed on a Stock Exchange?
Yes √ No Name of Stock Exchange Class of Securities Listed

Philippine Stock Exchange U
12. Check whether the issuer: (a) has filed all reports required to be filed by Section 17 of the SRC and SRC Rule 17.1 thereunder or Section 11 of the RSA and RSA Rule 11(a)-1 thereunder, and Sections 26 and 141 of the Corporation Code of the Philippines during the preceding twelve (12) months (or for such shorter period that the issuer was required to file such reports);
Yes √ No
(b) has been subject to such filing requirements for the past ninety (90) days.
Yes √ No
13. Aggregate market value of the voting stock held by non-affiliates is P170,506,560 as of
April 30,2018.
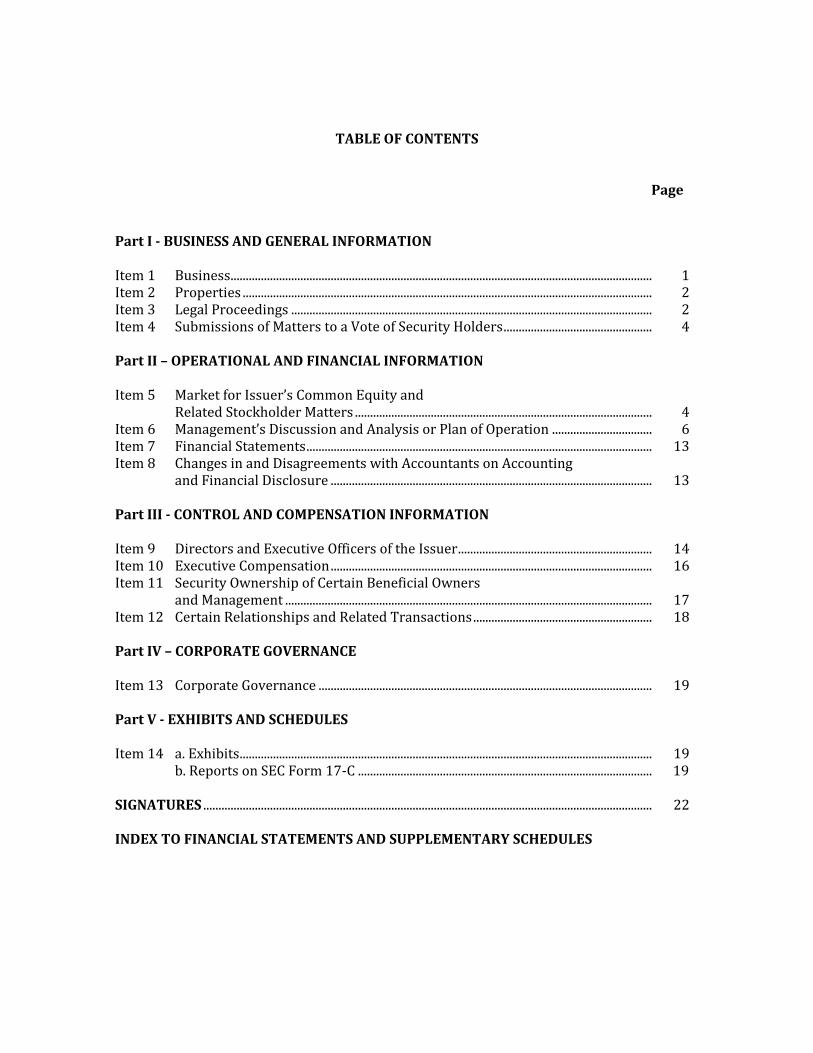
TABLE OF CONTENTS
Page Part I - BUSINESS AND GENERAL INFORMATION Item 1 Business........................................................................................................................................... 1 Item 2 Properties ....................................................................................................................................... 2 Item 3 Legal Proceedings ....................................................................................................................... 2 Item 4 Submissions of Matters to a Vote of Security Holders ................................................. 4 Part II – OPERATIONAL AND FINANCIAL INFORMATION Item 5 Market for Issuer’s Common Equity and Related Stockholder Matters .................................................................................................. 4 Item 6 Management’s Discussion and Analysis or Plan of Operation ................................. 6 Item 7 Financial Statements .................................................................................................................. 13 Item 8 Changes in and Disagreements with Accountants on Accounting and Financial Disclosure .......................................................................................................... 13 Part III - CONTROL AND COMPENSATION INFORMATION Item 9 Directors and Executive Officers of the Issuer ................................................................ 14 Item 10 Executive Compensation .......................................................................................................... 16 Item 11 Security Ownership of Certain Beneficial Owners and Management ......................................................................................................................... 17 Item 12 Certain Relationships and Related Transactions ........................................................... 18 Part IV – CORPORATE GOVERNANCE Item 13 Corporate Governance .............................................................................................................. 19 Part V - EXHIBITS AND SCHEDULES Item 14 a. Exhibits ........................................................................................................................................ 19 b. Reports on SEC Form 17-C ................................................................................................. 19 SIGNATURES .................................................................................................................................................... 22 INDEX TO FINANCIAL STATEMENTS AND SUPPLEMENTARY SCHEDULES

1
PART I - BUSINESS AND GENERAL INFORMATION
ITEM 1: BUSINESS The Securities and Exchange Commission (SEC), on October 30, 2003, approved the amendment of the Company’s Articles of Incorporation to change the primary purpose thereof to that of a holding company and to include its then primary purpose of oil exploration as among the secondary purposes of the Company. On April 25, 2014, the Board of Directors approved the amendment in the Articles of Incorporation to change the name of South China Resources, Inc. to SOCResources, Inc. (SOC). The change was approved by the Philippine SEC on September 04, 2014. SOC was incorporated and registered with the SEC on September 25, 1992 primarily to undertake oil and gas exploration, development and production and became one of the leading exploration companies upon its listing in 1994. Starting in 1995, SOC opted to strengthen its core business by diversifying into other investments. After two decades, the company has now turned out to be one of the strongest holding companies in the market having had investments in real estate, steel fabrication, banking, telecommunications and energy exploration. The diversification process, brought on by the financial crisis of the 90’s, and honed through the years, allowed SOC to invest in technology based and long-term ventures. This gave the company the means to weather the lows of the period. One of the first and significant investments was the acquisition and sale of Bell Telecommunications Philippines, Inc., the acquisition and subsequent sale of Filipinas Plaza along EDSA corner Chino Roces Avenue and minority equity in Premiere Development Bank. The sale of equity investments in Filipinas Plaza and BellTel gave the company the influx of funds for re-investment and following the proven model of acquisition and sale of significant assets, SOC acquired equity in AGP International Inc in December 2010 which in turn gained control of AG&P Manila. AG&P Manila is one of the oldest and largest steel fabrication companies in the country with the unchallenged capability in modular fabrication. AG&P was supposedly a long-term investment however management was able to identify an opportunity which allowed for a shorter turn-around time in recouping this investment. This allowed for recoup of the investment and make a good return in what would have taken the company more than several years at the very least following the usual course of investment and dividend sharing. On January 31, 2012, the company sold its AGP shares at a good profit. Premier Bank on the other hand expanded to almost 40 branches after the company acquired its shares. It became one of the most stable small banks that it became an attractive target for acquisition by a much larger bank. The sale of this asset was concluded with the approval of the sale by the Monetary Board. Following the successful sale of the Filipinas Plaza and in response to the growing need for affordable housing for Filipinos, SOC followed on through the real estate business by acquiring on May 26, 2010 a 2.4 hectare plot in Buli, Muntinlupa strategically located along the South Luzon Expressway. The government estimates the country’s housing backlog at almost 4 million. There lay an opportunity for SOC to serve a basic need of Filipinos. It formed SOC Land Development Corporation (SOC Land), a wholly owned subsidiary, that put up quality homes at affordable prices. The Board of Directors, in a special meeting held November 11, 2010, directed Management to cause the registration with the Securities and Exchange Commission of SOC Land Development Corporation (SOC Land) as a wholly-owned subsidiary of the issuer with an authorized capital stock of One Hundred Sixty Million Pesos (PHP 160,000,000.00), a subscribed capital stock of Forty Million Pesos (PHP 40,000,000.00) and a paid-up capital of Ten Million Pesos (PHP 10,000,000.00). The subsidiary became the property development arm of the company, that is developing a 2.4-hectare community, called Anuva Residences (the Project), situated near Sucat Interchange. It will have four (4) tandem buildings. The total estimated cost of the Project is ₱2.0 billion The first tandem building of ANUVA RESIDENCES, the “ANALA”, projects a Fun Zone image showcasing the Wet and Dry Play Area for children. The building was completed and delivered last May 16, 2015 during the turnover ceremony held on the same day. Amenities facing Anala including the wading pool, children’s playground, al fresco area, cascading water, pond and Trellis Park have been finished as of end 2016 for the residents’ use and enjoyment as well as the parking slots in the lower ground floor for the residents to use.

2
The second tandem building known as AZALEA is currently in a preselling stage focusing on the Green Urban Living
image with amenities like the reflecting pool, adult and kiddie pool, cascades, picnic groves, clubhouse, garden party
and BBQ area. SOC Land’s latest project is a horizontal residential development, ALTHEA RESIDENCES. It is situated in Brgy. Zapote, Biñan City, Laguna and featuring modern homes with tranquil vibe spread in 4.3 hectares of land while a number of house and lot units have been completed, additional construction of other house and lot units is ongoing. SOC has identified other areas for potential investment. To address a growing population, now estimated at 100 million Filipinos and increasing every year, SOC looks at food production. The Company believes that a rising population coupled with rising incomes will drive greater food consumption. Opportunities have been identified to get in this value chain to grow a long-term business that will allow expansion laterally and vertically. The Company entered into an agreement with the Palawan IP group Campong It Mapangarapan It Palawano (CAMPAL) of Rizal, Palawan to undertake agro-industrial development of their ancestral land. The National Commission for Indigenous Peoples (NCIP) handed over to the Company the Certificate of Pre-condition with FPIC (Free Prior Informed Consent) for the agreement last June 2016. The Company has completed project documentation with the LGUs (Local Government Units). SOC and CAMPAL have been conferring with the LGUs and the Palawan Council for Sustainable Development (PCSD) to secure the Strategic Environmental Plan (SEP) Clearance needed for the agro-industrial development of over 3200 hectares of the IP area. The country needs both conventional and renewable energy resources to address its power requirements. SOC is investigating conventional and renewable energy resources, that can provide for base load power that is sustainable for the long term and therefore provide for a steady income stream for the company. Principal products or services and their distribution; competition in the industry; sourcing of raw materials and principal suppliers; dependence on one or few customers; transactions with and/or related parties; and patents, trademarks, licenses, franchises, concessions, royalty agreement, or labor contracts are not applicable with the registrant at this time. The Company’s subsidiary is SOC Land Development Corporation as of December 31, 2017. The Company does not expect any significant changes in its number of employees. Presently, the Company has a total of six (6)officers and employees, all working full-time, one (1) Chairman, one (1) Vice-President for Operations, one (1) Vice-President for Finance, one (1) Accounting Manager , one (1) Accounting Assistant and one (1) Messenger. The Company has no Collective Bargaining Agreements (CBA).
ITEM 2: PROPERTIES On May 26, 2010, the Board of Directors in a special meeting, adopted a resolution authorizing the purchase by the Company of a 24,022.90 sq.m. parcel of land located at the East Service Road of South Superhighway, Brgy. Buli, Muntinlupa City, Metro Manila, registered in the names of, among others, the Company’s majority Directors, and major stockholders, Edgardo P. Reyes, Wilfrido P. Reyes and Belen R. Castro at a purchase price of P312,298,000.00. On July 28, 2010, SOCResources completed the purchase of the land. On March 4, 2011, in exchange for 312,298 additional shares in SOC Land, the Parent Company transferred the said investment property with a fair value of ₱312.3 million. In 2014, SOC Land acquired a property in Binan, Laguna and will be the first house and lot/lots only project of the Company that will be known as Althea Residences (Althea). Althea was formally launched in November 2014 and initially offer 214 choice lots, commercial and residential combined. The Company’s office is located at 4f Enzo Building, 399 Senator Gil Puyat Avenue, Makati City.
ITEM 3: LEGAL PROCEEDINGS The following cases were filed by the Company regarding the Makati City’s assessment of alleged deficiency business taxes:

3
South China Resources, Inc. v. Office of the City Treasurer and/or Makati City Civil Case No. 14-165 Regional Trial Court, Makati City, Branch 66 This is a petition under Section 195 of the Local Government Code (LGC) of 1991 assailing the : (a) City Treasurer of Makati’s “Notice of Assessment No. 13-00381” dated 12 November 2013 issued against SOCResources, Inc. for the amount of ₱4,872,182.45, allegedly representing local business taxes deficiencies, fees and surcharges; and (b) the “Notice of Assessment for South China Resources, Inc. under Letter of Authority No. 2013-0502” dated 8 January 2014, which denied SOCResources, Inc.’s Protest dated 21 December 2013. This case is currently pending trial before the Regional Trial Court (RTC), Makati City, Branch 66 after mediation proceedings before the Philippine Mediation Center and Judicial Dispute Resolution (JDR) hearings failed. During the proceedings, we presented Ms. Ronna De Leon as our lone witness. Ms. De Leon testified, among others, that (a) SOCResources, Inc. is a holding company, engaged in the business of investing in transactions which earn passive income; and (b) the Makati Revenue Code imposes business taxes on holding companies; and (c) she was aware of the ruling of the Court of Tax Appeals in Michigan Holdings, Inc. v. The City Treasurer of Makati City, where it was ruled that the Makati City Treasurer’s assessment of holding companies of local business taxes is invalid for being violative of the LGC and the National Internal Revenue Code. Having submitted their formal offer of documentary evidence, the parties submitted their respective memoranda and the case was thereafter submitted for decision. In a Decision dated 11 October 2017, the case was dismissed by the Regional Trial Court (RTC). SOCResources filed a Motion for Reconsideration dated 10 November 2017, which was denied by the RTC. Thus, SOCResources filed a Petition for Review before the Court of Tax Appeals on 9 February 2018. South China Resources, Inc. v. Office of the City Treasurer and/or Makati City S.P. Proc. No. M-7835 Regional Trial Court, Makati City, Branch 147 This is a petition under Section 195 of the LGC of 1991, assailing: (a) the Billing Assessment dated 13 January 2015 issued by the Business Permits Office of the City of Makati against petitioner for the amount of ₱981,478.00, allegedly representing local business taxes and fees in connection with SOCResources, Inc.’s application for business permit renewal for 2015; and (b) respondent Treasurer’s inaction on SOCResources, Inc.’s Letter Protest dated 25 February 2015. In view of respondents’ failure to file their answer within fifteen (15) days from service of the Summons on 17 August 2015, or until 1 September 2015, petitioner filed its “Motion to Declare Respondents in Default” dated 6 January 2016 (the “Motion”). Meanwhile, respondents filed their “Comment (to Plaintiff’s Motion to Declare Respondents in Default)” dated 28 January 2016, stating that they failed to file their answer due to excusable negligence, consisting of heavy workload and manpower constraints in the Office of the City Attorney. In its Order dated 21 March 2016, the court granted our Motion. Respondents filed their “Motion for Reconsideration (to Set Aside Order of Default and to Admit Attached Answer)” dated 6 May 2016. In its Order dated 30 June 2016, the court lifted the order of default against respondents and admitted their Answer. The court-annexed mediation and JDR in this case were terminated both parties. In view thereof, the court issued the Order dated 7 December 2016, referring this case to the Office of the Clerk of Court for re-raffle. The case was re-raffled to the court a quo. Thereafter, trial ensued and the case was submitted for decision. The RTC dismissed the case together with Civil Case No. 14-165. SOCResources filed its Motion for Reconsideration on 10 November 2017, which was denied by the RTC on 12 January 2018. Thus, SOCResources filed a Petition for Review dated 12 February 2018 before the Court of Tax Appeals.

4
ITEM 4: SUBMISSION OF MATTERS TO A VOTE OF SECURITY HOLDERS There were no matters submitted to a vote of security holders, during the fourth quarter of the calendar year covered by this report through the solicitation of proxies or otherwise.
PART II – OPERATIONAL AND FINANCIAL INFORMATION
ITEM 5: MARKET FOR ISSUER'S COMMON EQUITY AND RELATED STOCKHOLDER MATTERS
(1) Market Information The Principal Market where the Issuer's common equity is traded is in the Philippine Stock Exchange. As of the trading date, March 31, 2018, the high and low price is ₱0.83 and ₱0.81 respectively and the price closed at ₱0.81. The Corporation has no securities to be issued in connection with an acquisition, business combination or other re-organization. Furthermore, the following are the high and low sales prices for each quarter within the last two years (2017 and 2016).
Stock Prices
2017
High
Low
First Quarter 0.8600 0.8600
Second Quarter 0.9100 0.8800 Third Quarter 0.9200 0.9200 Fourth Quarter 0.8100 0.8100
2016
High
Low
First Quarter 0.8000 0.7600 Second Quarter 0.9300 0.8900 Third Quarter 1.0000 0.9400 Fourth Quarter 0.8300 0.8300
(2) Holders The number of shareholders of record as of December 31, 2017 was 362. Common shares issued and outstanding as of December 31, 2017 were 901,920,568.

5
Top Twenty (20) Stockholders As of December 31, 2017
(3) Recent Sale of Unregistered or Exempt Securities There had been no sale of unregistered or exempt securities, including recent issuance of securities constituting an exempt transaction by the Company in the last three years. (4) Public Ownership Report as March 31, 2018 In compliance with Philippine Stock Exchange Amended Rule on Minimum Public Ownership (the “Amended MPO Rule”) as announced in Memorandum CN – No. 2012-0003 dated January 3, 2012 stating that a listed company shall include in its annual report a statement on the level of its public float. The statement should be based on information that is publicly available to the listed company and within the knowledge of its directors as at the end of the fiscal year, or at the latest practicable date, prior to the issuance of the annual report. Hereunder is the computation of company’s public ownership percentage as of March 31, 2018:
NO. HOLDER NAME TOTAL SHARES % OWNED
1 CASTRO, BELEN R. 231,531,122 25.6709 %
2 REYES, EDGARDO P. 229,853,123 25.4849 %
3 REYES, WILFRIDO P. 226,853,123 25.1522 %
4 PCD NOMINEE CORP. (FILIPINO) 161,259,829 17.8796 %
5 PCD NOMINEE CORP. (NON-FILIPINO) 7,564,671 0.8387 %
6 R. COYIUTO SECURITIES, INC. 1,825,000 0.2023 %
7 DE VILLA, LUISMI GALA 808,000 0.0896 %
8 ESCALER, MICHAEL 630,000 0.0699 %
9 PEREZ, MA. GEORGINA V. 610,000 0.0676 %
10 MANGUIAT, REMEDIOS J. 580,000 0.0643 %
11 MANDARIN SECURITIES CORP. 561,000 0.0622 %
12 CRUZ, BENITO T. DELA 520,000 0.0577 %
13 CABANES, LORETO 500,000 0.0554 %
14 CHUA, ROJAS 500,000 0.0554 %
15 ESTRADA, JOSEPH 500,000 0.0554 %
16 LAYOSA, EDNA L. 500,000 0.0554 %
17 MERCADO, TERESITA P. 500,000 0.0554 %
18 MITRA, RAMON 500,000 0.0554 %
19 OSMENA, RAMON 500,000 0.0554 %
20 F. YAP SECURITIES, INC. 440,000 0.0488 %
PUBLIC OWNERSHIP PERCENTAGE
Total Number of Shares Owned by the Public
Total Issued and Outstanding Shares
213,133,200 shares = 23.63 % 76.37%
901,920,568 shares
Number of Issued and Outstanding Shares = 901,920,568
Number of Outstanding Shares = 901,920,568
Number of Treasury Shares = 4,639,000
Number of Listed Shares = 906,559,569
Number of Foreign-Owned Shares = 8,060,671
Foreign Ownership Level (%) = 0.89%
Foreign Ownership Limit (%) = 40%

6
ITEM 6: MANAGEMENT’S DISCUSSION AND ANALYSIS OR PLAN OF OPERATION
RESULTS AND PLANS OF OPERATIONS
Real Estate: SOC Land ANALA the first tandem building of ANUVA RESIDENCES project has sold 269 units as of December 2017 which corresponds to 52% of the total inventory. 229 units have been turned over to end users. Out of this, 124 units are occupied with more than 248 people currently residing in the building. AZALEA the second tandem building of ANUVA RESIDENCES is still in a pre-selling stage which is focusing on the Green Urban Living image. Azalea has sold 50 units which correspond to 10% of the total inventory. SOC Land’s horizontal residential development project, ALTHEA RESIDENCES located at Biñan City Laguna has sold a total of 156 units, a combination of lots and house & lots which correspond to 73% of the total inventory. Twenty-one (21) units were already constructed, and sixteen (16) of this has been turned over to end users. Out of this, eleven (11) units are already occupied. In addition, there are three (3) more units that are being constructed and the target completion of these units will be on January 2018. Amenities for this project have already been completed as well as the clubhouse, swimming pool & basketball court. Other Energy, Mineral and Resource Based Opportunities The Company is looking into food production. We believe in the thesis that rising incomes in the Asian region will drive greater food consumption. The Company entered into an agreement with the Palawan IP group Campong It Mapangarapan It Palawano (CAMPAL) of Rizal, Palawan to undertake agro-industrial development of their ancestral land. The National Commission for Indigenous Peoples (NCIP) handed over to the Company the Certificate of Pre-condition with FPIC (Free Prior Informed Consent) for the agreement last June 2016. The Company has completed project documentation with the LGUs (Local Government Units). SOC and CAMPAL have been conferring with the LGUs and the Palawan Council for Sustainable Development (PCSD) to secure the Strategic Environmental Plan (SEP) Clearance needed for the agro-industrial development of coffee and coconut over 3200 hectares of the IP area. The global situation in recent years presents opportunities for the Company to seek entry into mineral exploration and exploitation sector. The Company is in a favorable situation wherein its current cash position allows it to review other businesses wherein it may invest. The following are the estimated cash requirements for SOCResources’ operations in the next twelve months which are dependent on opportunity acquisition.
Agri-Business
$3MM
Other Energy, Mineral & Resources Based Opportunities
$ 200K for Assessment Studies

7
The Company’s consolidated financial statements have been prepared in compliance with Philippine Financial Reporting Standards (PFRS). CONSOLIDATED RESULTS OF OPERATIONS 2017 VS 2016 (AUDITED) (in Philippine pesos)
2017 VS 2016: RESULTS OF OPERATIONS
Revenue for the year ended 2017 consists of: (1) recognized sale on real estate for SOC Land amounting to ₱65M;(2) Interest Income on time deposits, savings account and installment sales of real estate amounting to ₱13.M;(3) Dividend Income from domestic shares of stocks amounting to ₱0.3M;(4) net foreign exchange gain amounting to ₱0.2M and (5) other income amounting to ₱5M. The decrease in the total cost and expenses is attributable to the decrease in the recognized cost of sales for real estate sales and the general and administrative expenses of the group. The provision for deferred tax liabilities pertains to the excess of deferred tax liabilities over the deferred tax assets of the group. Deferred tax liabilities consist of difference between tax and book basis of accounting for real estate transactions, Gain on repossession and Unrealized foreign exchange gain. Deferred tax liabilities are fair value changes of AFS financial assets and actuarial gains on defined benefit plan. CONSOLIDATED RESULTS OF OPERATIONS 2016 VS 2015 (in Philippine pesos)
ACCOUNTS December 31, 2017 December 31, 2016 % CHANGE
REVENUES 83,850,699 211,507,476 -60.36%
COST AND EXPENSES 106,670,361 184,369,488 -42.14%
INCOME (LOSS) BEFORE INCOME TAX (22,819,662) 27,137,988 -184.09%
PROVISION FOR INCOME TAX (Current) 1,276,648 1,373,128 -7.03%
PROVISION FOR INCOME TAX (Deferred) 2,168,161 100.00%
NET INCOME/(LOSS) (26,264,471) 25,764,860 -201.94%
NET GAINS(LOSSES) ON AFS FINANCIAL ASSETS 736,513 8,114,806 -90.92%
ACTUARIAL GAINS (LOSS) (35,236) 195,764 -118.00%
TOTAL COMPREHENSIVE INCOME/(LOSS) (25,563,194) 34,075,430 -175.02%
ACCOUNTS December 31, 2016 December 31, 2015 % CHANGE
REVENUES 211,507,476 271,787,416 -22.18%
COST AND EXPENSES 184,369,488 291,884,108 -36.83%
INCOME (LOSS) BEFORE INCOME TAX 27,137,988 (20,096,692) 235.04%
PROVISION FOR INCOME TAX 1,373,128 1,213,840 13.12%
NET INCOME/(LOSS) 25,764,860 (21,310,532) 220.90%
NET GAINS(LOSSES) ON AFS FINANCIAL ASSETS 8,114,806 4,268,083 90.13%
ACTUARIAL GAINS ON DEFINED BENEFIT PLANS 195,764 78,566 12939
TOTAL COMPREHENSIVE INCOME/(LOSS) 34,075,430 (16,963,883) 300.87%

8
2016 VS 2015: RESULTS OF OPERATIONS
Revenue for the year ended 2016 consists of: (1) recognized sale on real estate for SOC Land amounting to ₱157M;(2) Interest Income on time deposits, savings account and installment sales of real estate amounting to ₱13.21M;(3) Dividend Income from domestic shares of stocks amounting to ₱0.3M;(4) net foreign exchange gain amounting to ₱0.3M and (5) other income amounting to ₱40M. The 36% decrease in the total cost and expenses is attributable to the 51% decrease in the sales and marketing cost of the subsidiary and 16% decrease in the general and administrative expenses of the group. The significant decrease in the cost and expenses has brought a positive after tax net income despite of the 22% decrease in the total revenue of the group. There has also been an outstanding gain on the market value of the AFS financial assets currently held by the company. CONSOLIDATED FINANCIAL POSITION 2017 VS 2016 (AUDITED) (in Philippine pesos)
2017 VS 2016: FINANCIAL CONDITION
The net effect of the following has caused the slight dropped of 0.19% in the current assets of the group: (1) 4% increase in cash and cash equivalents plus the short term investments due to interest income earned from investment in treasury bills and gain in redemption of UITF;(2) Receivables decreased by 24% due to the net effect of the collection of accounts pertaining to Anala, the first tandem building of SOCLand, which were turned over last May 2015 and the recognition of sales for those units of which 20% of the total contract price was collected;(3) Real Estate for sale increase by 1% due to the recognition of the cost of units sold; and (4) other current assets decreased due to the decrease in input vat recognized as current. The increase in the current liabilities was due to the 42% increase in the customers’ deposit for real estate sales. Increase in noncurrent liabilities refers to the recognized retirement liability for the year 2017 and the deferred tax liabilities. CONSOLIDATED FINANCIAL POSITION 2016 VS 2015 (AUDITED) (in Philippine pesos)
ACCOUNTS December 31, 2017 December 31, 2016 % CHANGE
CURRENT ASSETS 1,580,418,340 1,583,484,810 -0.19%
NONCURRENT ASSETS 177,651,914 181,480,430 -2.11%
TOTAL ASSETS 1,758,070,254 1,764,965,240 -0.39%
CURRENT LIABILITIES 128,277,782 114,205,459 12.32%
NONCURRENT LIABILITIES 8,818,104 4,222,219 108.85%
TOTAL LIABILITIES 137,095,886 118,427,678 15.76%
EQUITY 1,620,974,368 1,646,537,562 -1.55%
TOTAL LIABILITIES AND EQUITY 1,758,070,254 1,764,965,240 -0.39%
ACCOUNTS December 31, 2016 December 31, 2015 % CHANGE
CURRENT ASSETS 1,583,484,810 1,642,002,434 -3.56%
NONCURRENT ASSETS 181,480,430 126,731,990 43.20%
TOTAL ASSETS 1,764,965,240 1,768,734,424 -0.21%
CURRENT LIABILITIES 114,205,459 152,415,502 -25.07%
NONCURRENT LIABILITIES 4,222,219 3,856,790 9.47%
TOTAL LIABILITIES 118,427,678 156,272,292 -24.22%
EQUITY 1,646,537,562 1,612,462,132 2.11%
TOTAL LIABILITIES AND EQUITY 1,764,965,240 1,768,734,424 -0.21%

9
2016 VS 2015: FINANCIAL CONDITION
The net effect of the following has caused the slight dropped of 3.56% in the current assets of the group: (1) 20% increase in cash and cash equivalents;(2) Receivables decreased by 57% due to the net effect of the collection of accounts pertaining to Anala, the first tandem building of SOCLand, which were turned over last May 2015 and the recognition of sales for those units of which 20% of the total contract price was collected;(3) Real Estate for sale dropped by 3% due to the recognition of the cost of units sold; and (4) other current assets increased by 26% due to the creditable taxes remitted on fully paid units and refundable deposits for office rentals. The decrease in the current liabilities was due to the payment made to contractors for Anala Building and Althea as well as offset of unit owners’ deposit against receivable upon recognition of real estate sales. Increase in noncurrent liabilities refers to the recognized retirement liability for the year 2016. The positive bottomline figure of the group has caused the increase in the total equity of the group. KEY PERFORMANCE INDICATORS
The following are the major financial ratios of the Company for the years ended December 31, 2017, 2016 and 2015:
2017 VS 2016
The 0.19% decrease in current assets coupled with the 12% increase in current liabilities for the year ended 2017 has caused the current ratio to go down by 1.55 x as against year ended 2016.
Key Financial Ratios December 31, 2017 December 31, 2016 December 31, 2015
Revenue Growth
(Total Revenues (current period) - Total
Revenues (prior period))/Total
Revenues (prior period)
-60.36% -22.18% 65.90%
Net Income (after tax) (current
period)/ Net income (prior period, after
tax)
-201.94% 220.90% 44.19%
(After Tax Net
Income+Depreciation)/Total Liabilities-17.39% 24.02% -12.14%
Income from operations plus
depreciation and amortization(P 23,842,405) P28,450,135 (P18,965,657)
Total Assets/Total Equity 1.0846 x 1.0719 x 1.0969 x
Net income/ Equity -1.62% 1.56% -1.32%
Net income/ Total Assets -1.49% 1.46% -1.20%
Current Assets/ Current Liabilities 12.32 x 13.87 x 10.77 x
Total Liabilities/ Equity 0.0846 x 0.0719 x 0.0969 x
Debt to Equity Ratio
Net income Growth/(Decline)
Solvency Ratio
EBITDA
Asset to Equity Ratio
Return on Equity (ROE)
Return on assets (ROA)
Current/Liquidity ratio

10
A slight increase on the asset to equity ratio was due to the decrease in the total assets of the group particularly receivables and a decrease also on the equity. The group was able to maintain its high debt to equity ratio. Increase on total liabilities was mostly driven by the recognition of deferred tax liabilities pertaining to difference between tax and book basis of accounting for real estate transactions, gain on repossession, unrealized foreign exchange gain and fair value changes of AFS financial assets. 2016 VS 2015
The 25% decrease in the current liabilities of the group has caused the increase in current ratio and the decline in the debt to equity ratio of the group Y/Y 2016. A slight decrease on the asset to equity ratio was due to the decrease in the real estate for sale brought about by the turnover of the units in Anala building. An outstanding net income growth of 220% has caused the solvency ratio to inched up to 24.91%. The increase in the EBITDA of the group was translated to the increase in the cash and cash equivalents.
PROSPECTS FOR THE FUTURE
The outlook for SOC in the coming years is quite optimistic. Even with the refocus in business interests, new opportunities seem to look very promising and are discussed below. (1) Prospects for SOC Land Development Corporation SOC’s investment into property development is seen as an important aspect in enhancing its shareholder value. The government estimates the country’s housing backlog at almost 4 million. There lies the opportunity to serve a basic need of Filipinos. In November 2010, SCRI diversified its business and invested into real property development through SOC Land Development Corporation (SOC Land), a wholly-owned subsidiary with the primary purpose to deal and engage in real estate business. SOC Land is developing a 2.4-hectare community, called Anuva Residences (the Project), situated near Sucat Interchange and will have four (4) tandem buildings. The first tandem building, Anala, was completed and delivered last May 16, 2015 during the turnover ceremony held on the same day SOC land officially launched in Nov. 15, 2015, its newest horizontal residential development project, Althera Residences. It is situated in Brgy. Zapote, Biñan City, Laguna and will feature modern homes with a tranquil vibe spread in 4.3 hectares of land. Homeowners can choose from three housing options and the subdivision offers a variety of first class amenities. For this project, road networks have been completed including the Entrance Gate/Guardhouse and the Model Houses. It is strategically located near schools, churches, commercial establishments and malls, hospitals and government offices. (2) Prospects for Agri-based businesses The Company entered into an agreement with the Palawan IP group Campong It Mapangarapan It Palawano (CAMPAL) of Rizal, Palawan to undertake agro-industrial development of their ancestral land. The National Commission for Indigenous Peoples (NCIP) handed over to the Company the Certificate of Pre-condition with FPIC (Free Prior Informed Consent) for the agreement last June 2016. The Company has completed project documentation with the LGUs (Local Government Units). SOC and CAMPAL have been conferring with the LGUs and the Palawan Council for Sustainable Development (PCSD) to secure the Strategic Environmental Plan (SEP) Clearance needed for the agro-industrial development of over 3200 hectares of the IP area. Coffee and coconut are envisioned to be the main crops of the area. Coffee is the second most traded commodity worldwide. The Philippines consumes about 170,000 metric tons of coffee (Phil. Coffee Board) and is a net importer of coffee. It imports almost 70% of its coffee needs at a cost of P7B. Coconut, also called the “tree of life” is an established commercial plant wherein its derived products are used domestically

11
and internationally. (3) Prospects for Other Energy, Mineral and Other Resource Based Opportunities The Company continues to review potential energy resources as it explores entry into opportunities in other conventional and renewable energy resources. The global situation in recent years presents opportunities for the Company to seek entry into the mineral resource based sector. DIVIDEND DECLARATION
The Company has no earnings yet from commercial production pertaining to the oil exploration segment of the business hence there were no dividends declared for the period ended December 31, 2017 and two years ended December 31, 2016 and December 31, 2015. KEY VARIABLE AND OTHER QUALITATIVE AND QUANTITATIVE FACTORS
There are no material trends, events or uncertainties that are reasonably expected to occur in the next twelve months that will have a material favorable or unfavorable impact on the results of the Company’s liquidity. Should there be material changes in working capital it would be advances from the management to support the Company’s operation or a sale of non-current assets. There are no significant elements of income or loss that did not arise from the Company’s continuing operations. There are no events that will trigger direct or contingent financial obligation that is material to the Company, including any default or accumulation of an obligation. There were no seasonal aspects that had a material effect on the financial condition or results of operations of the Company. The Company has no plans of changing the number of employees for the next twelve months. There are no material off-balance sheet transactions, arrangements, obligations (including contingent obligations), and other relationships of the company with unconsolidated entities or other persons during the reporting period. The material changes for this year in comparison with the prior year-end based on line items in the comparative financial statements as of December 31, 2017, 2016 and 2015 are summarized as follows:
ACCOUNTS
In Millions 2017 2016 2015 2017 vs 2016 2016 vs 2015
Statement of Financial Position
Cash & Cash Equivalents 115.03 357.16 298.81 -67.79% 19.53%
Short-term Investments 255.82 - - 100.00% -100.00%
Receivables 57.48 75.64 177.27 -24.01% -57.33%
Due from Related Parties 0.19 0.18 0.17 7.03% 7.56%
Prepayments & Other Current Assets 59.02 68.39 54.48 -13.70% 25.54%
Receivables - net of current portion 61.84 78.85 25.20 -21.57% 212.84%
Available for Sale (AFS) financial assets 53.45 40.86 32.75 30.80% 24.78%
Accounts Payable & other Liabilities 128.28 114.21 152.42 12.32% -25.07%
Retirement benefit obligation 4.80 4.22 3.76 13.58% 12.37%
Deferred Tax Liability 4.02 0.10 100.00% -100.00%
Retained Earnings - Unappropriated 116.81 143.07 362.31 -18.36% -60.51%
Statement of Comprehensive Income
REVENUES
Real estate sales 64.93 156.77 250.26 -58.58% -37.36%
Other income 5.39 40.87 16.0981 -86.82% 153.88%
COST AND EXPENSES
Cost of real estate sales 33.41 113.66 195.97 -70.60% -42.00%
Sales and marketing expenses 22.46 14.34 28.97 56.58% -50.50%
General and Administrative Expenses 50.80 56.37 66.94 -9.88% -15.79%
Provision for Income Tax 1.28 1.37 1.21 -7.03% 13.12%
Net Gains/(Losses) on AFS Financial Assets 0.74 8.11 4.27 -90.92% 90.13%
For the Period December 31 % CHANGE
12
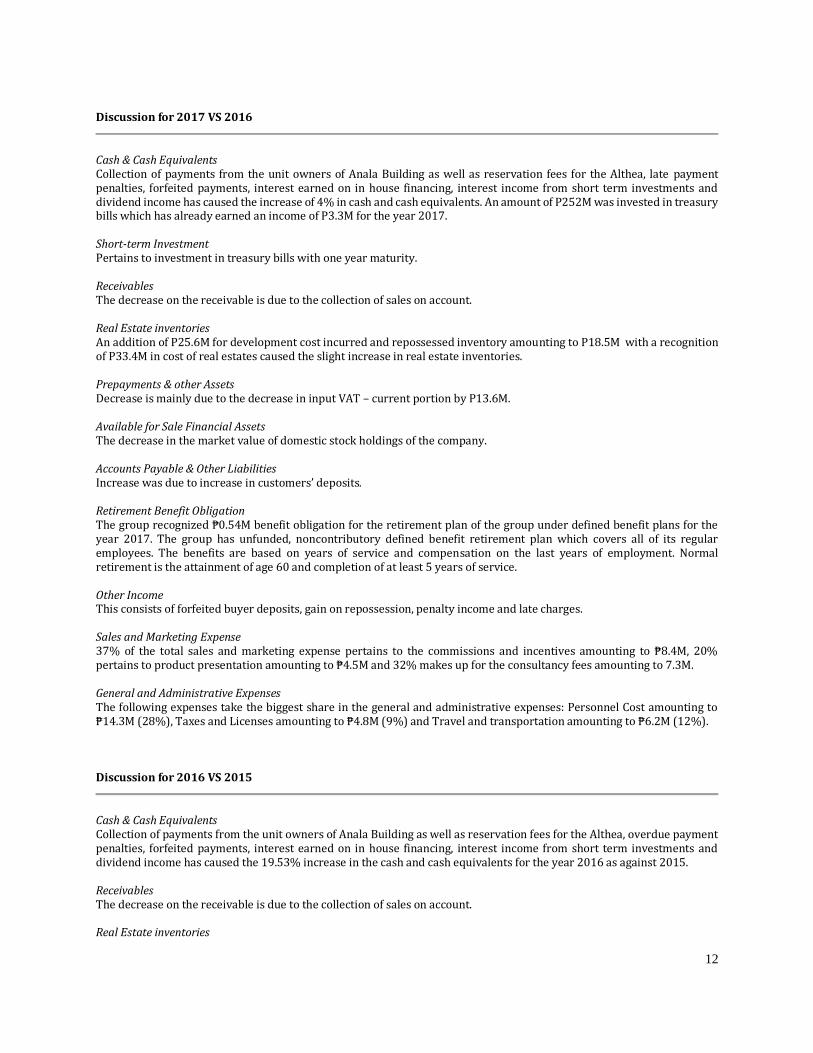
Discussion for 2017 VS 2016
Cash & Cash Equivalents Collection of payments from the unit owners of Anala Building as well as reservation fees for the Althea, late payment penalties, forfeited payments, interest earned on in house financing, interest income from short term investments and dividend income has caused the increase of 4% in cash and cash equivalents. An amount of P252M was invested in treasury bills which has already earned an income of P3.3M for the year 2017. Short-term Investment Pertains to investment in treasury bills with one year maturity. Receivables The decrease on the receivable is due to the collection of sales on account. Real Estate inventories An addition of P25.6M for development cost incurred and repossessed inventory amounting to P18.5M with a recognition of P33.4M in cost of real estates caused the slight increase in real estate inventories. Prepayments & other Assets Decrease is mainly due to the decrease in input VAT – current portion by P13.6M. Available for Sale Financial Assets The decrease in the market value of domestic stock holdings of the company. Accounts Payable & Other Liabilities Increase was due to increase in customers’ deposits. Retirement Benefit Obligation The group recognized ₱0.54M benefit obligation for the retirement plan of the group under defined benefit plans for the year 2017. The group has unfunded, noncontributory defined benefit retirement plan which covers all of its regular employees. The benefits are based on years of service and compensation on the last years of employment. Normal retirement is the attainment of age 60 and completion of at least 5 years of service. Other Income This consists of forfeited buyer deposits, gain on repossession, penalty income and late charges. Sales and Marketing Expense 37% of the total sales and marketing expense pertains to the commissions and incentives amounting to ₱8.4M, 20% pertains to product presentation amounting to ₱4.5M and 32% makes up for the consultancy fees amounting to 7.3M. General and Administrative Expenses The following expenses take the biggest share in the general and administrative expenses: Personnel Cost amounting to ₱14.3M (28%), Taxes and Licenses amounting to ₱4.8M (9%) and Travel and transportation amounting to ₱6.2M (12%). Discussion for 2016 VS 2015
Cash & Cash Equivalents Collection of payments from the unit owners of Anala Building as well as reservation fees for the Althea, overdue payment penalties, forfeited payments, interest earned on in house financing, interest income from short term investments and dividend income has caused the 19.53% increase in the cash and cash equivalents for the year 2016 as against 2015. Receivables The decrease on the receivable is due to the collection of sales on account. Real Estate inventories

13
Dropped by 2.62% due to the recognition of the cost of units sold on the Anala Building and Althea. Prepayments & other Assets Mainly due to decrease in Input VAT arising from the acquisition of its wholly owned subsidiaries of vatable goods and services for the Anuva Project. Available for Sale Financial Assets The increase in the market value of domestic stock holdings of the company. Property and Equipment The decrease is due to depreciation. Accounts Payable & Other Liabilities Decrease was due to payments to contractors (Anala Building and Althea) and offset of unit owner’s deposit against receivable upon recognition of sales. Retirement Benefit Obligation The group recognized ₱0.38M benefit obligation for the retirement plan of the group under defined benefit plans for the year 2016. The group has unfunded, noncontributory defined benefit retirement plan which covers all of its regular employees. The benefits are based on years of service and compensation on the last years of employment. Normal retirement is the attainment of age 60 and completion of at least 5 years of service. Unrealized Valuation on AFS Pertains to the increase in market value of other domestic stock holdings of the company. Interest Income The amount of ₱8.8M representing 67% of the total interest income pertains to the interest earned from installment contract receivable. Dividend Income Dividend Income earned from equity securities amounted to ₱0. 3M in 2016. Other Income This consists of forfeited buyer deposits, gain on repossession, penalty income and late charges. Sales and Marketing Expense 34% of the total sales and marketing expense pertains to the commissions and incentives amounting to ₱4.8M, 30% pertains to product presentation amounting to ₱4.4M and 21% makes up for the consultancy fees amounting to ₱2.9M. General and Administrative Expenses The following expenses take the biggest share in the general and administrative expenses: Personnel Cost amounting to ₱12.9M (23%), Taxes and Licenses amounting to ₱8.7M (15%) and Travel and transportation amounting to ₱8.3M (15%).
ITEM 7: FINANCIAL STATEMENTS
The Financial Statements and Schedules listed in the accompanying Index to Financial Statements and Supplementary Schedules are filed as part of this SEC Form 17 – A.
ITEM 8: CHANGES IN AND DISAGREEMENTS WITH ACCOUNTANTS ON ACCOUNTING AND FINANCIAL DISCLOSURE
There are no changes in and disagreements with independent accountants on accounting and financial disclosure and no change in the Company’s independent accountants during the two most recent fiscal years or any subsequent interim period.

14
INFORMATION ON INDEPENDENT PUBLIC ACCOUNTANT AND OTHER RELATED MATTERS
Information on Independent Public Accountant In compliance with SRC Rule 68 Paragraph 3(b) (iv), the engagement partner from Sycip Gorres Velayo & Co. is Mr. Kristoper S. Catalan. Sycip Gorres Velayo & Co. is the incumbent Public Accountant of the Company. The Company, through its Audit Committee, recommends the re-appointment of Sycip Gorres Velayo & Co. as the Principal Accountant of the Corporation. The Company’s Audit Committee is composed of Mr. Manuel G. Arteficio as Chairman, Mrs. Belen R. Castro, Member, and Mr. Wilfrido P. Reyes, Member. External Audit Fees and Services In compliance with SEC Memo Circular No. 14 Series of 2004, External Audit Fees, year ended 2017 audit progress billing for SOCResources, Inc. and subsidiary, SOC Land Development amounted to P296,326 and ₱403,344 respectively. External Audit Fees, year ended 2016 audit for SOCResources, Inc. and subsidiary, SOC Land Development amounted to P381,260 and ₱486,339 respectively. No other services were provided and billed for by the external auditors for the last two (2) fiscal years. PART III - CONTROL AND COMPENSATION INFORMATION
ITEM 9: DIRECTORS AND EXECUTIVE OFFICERS OF THE ISSUE
(1) Directors and Executive Officers (Information for the last five years)
EDGARDO P. REYES, 72 years of age, Filipino, has been the CHAIRMAN of the Board of Directors of the Company since 1992.; PRESIDENT of International Pipe Industries Corp., Pipe Machinery Corp., Apo Pipe Industries Corp., Reyson Realty & Development Corp., Puyat Flooring Products Inc., Proleo Realty Inc., and BenePara Realty Inc.; SENIOR VICE PRESIDENT of PFM Agro-Industrial Development Corp. and Armorply Concrete Forming Systems Inc.; and, DIRECTOR of Surigao Development Corp., and Puyat Investment & Realty for the past five (5) years. Mr. Reyes is the brother of Mr. Wilfrido P. Reyes and Ms. Belen R. Castro. WILFRIDO P. REYES, 71 years of age, Filipino, has been the PRESIDENT of the Company since 1992. CHAIRMAN/PRESIDENT of WPR Realty & Management Corp.; EXECUTIVE VICE PRESIDENT/DIRECTOR of Gonzalo Puyat & Sons Inc. and Purex Mineral Corp.; EVP/GENERAL MANAGER of Philippine Flour Mills and PFM-Agro Development Corp.; SVP/DIRECTOR of Puyat Steel Corporation; DIRECTOR of Premiere Development Bank; TREASURER/DIRECTOR of Surigao Development Corp.; SECRETARY/DIRECTOR of Surigao Marine Products, Inc.; VP/GENERAL MANAGER of Reyson Realty & Development Corp.; PRESIDENT of Proleo Realty Inc., VP/TREASURER of Bell Telecommunication Philippines Inc.; TREASURER/DIRECTOR of International Pipe Industries Corp. and Apo Pipe Industries Corp; and, DIRECTOR of Pipe Machinery Corp. for the past five (5) years. Mr. Reyes is the brother of Mr. Edgardo P. Reyes and Ms. Belen R. Castro. BELEN R. CASTRO, 70 years of age, Filipino, has been the VICE PRESIDENT, TREASURER & DIRECTOR of the Company since 1992 up to the present; DIRECTOR & ASST. TREASURER of Gonzalo Puyat & Sons, Inc.; DIRECTOR of Chamber of Thrift Banks (1990 – 2012) She was the Chairman of Premiere Development Bank (January 2007-2012). She is the sister of Mr.
NAME POSITION BIRTHDATE
Edgardo P. Reyes Chairman/CEO December 2, 1945
Wilfrido P. Reyes President January 21, 1947
Belen R. Castro VP & Treasurer April 9, 1948
Manuel G. Arteficio Director January 13, 1945
Francisco M. Bayot, Jr. Director January 29, 1954
Magilyn T. Loja Corporate Secretary May 6, 1968
David R. Baladad VP - Operations September 13, 1956
Zosimo L. Padro, Jr. VP - Finance August 3, 1959

15
Edgardo P. Reyes and Mr. Wilfrido P. Reyes. MANUEL G. ARTEFICIO, 73 years of age, Filipino, has been an INDEPENDENT DIRECTOR of the Company since 2007. He has been PRESIDENT of San Manuel Mining Corp. from 1990 to 2016; Assissi Mining Corp., Bonaventures Mining Corp., Ignatius Mining Corp., all three from 1994 to present; he is also the PRESIDENT of Egerton Gold Phils., Inc. from 2006 to present. FRANCISCO M. BAYOT, JR., 64 years of age, Filipino, has been an INDEPENDENT DIRECTOR of the Company since 2008.; He is the DIRECTOR of Alabang Commercial Corp. since 1990; PRESIDENT/DIRECTOR of Josue Corp since 1990; PRESIDENT/DIRECTOR of JM Investment Corp. since 1990; DIRECTOR of Madrigal Condominium Corp. I & Madrigal Condominium Corp. II since 1992; PRESIDENT/DIRECTOR of Susana Realty, Inc., Septimo Realty, Inc., Porep Realty Inc., and Perop Realty, Inc. since 1993; PRESIDENT/DIRECTOR of Madrigal Business Park Association, Inc. since 1994; PRESIDENT/DIRECTOR of Madrigal-Bayot Dev. Corp. since 2008; and PRESIDENT/DIRECTOR of Cebu Beacon Storage Corporation since 2015. MAGILYN T. LOJA, 49 years of age, Filipino, has been the CORPORATE SECRETARY of the Company since 2010. She is a Senior Partner of the Esguerra & Blanco Law Offices. Atty. Loja obtained her Bachelor of Science in Business Administration and Accountancy and Bachelor of Laws from the University of the Philippines. Atty. Loja, since 1996, and during the last five (5) years, has been engaged in the practice of law. DAVID R. BALADAD, 61 years of age, Filipino, has been the VICE PRESIDENT FOR OPERATIONS of the Company since 1994. He obtained his Bachelor of Science in Geology from the University of the Philippines and he is also a licensed Geologist. Prior to joining the Company, Mr. Baladad was the Chief of the Oil and Gas Division of the former Office of Energy Affairs (now DOE) and a consultant to other local exploration companies. He has been directing the operating activities of the Company since 1994 and for the last five (5) years. ZOSIMO L. PADRO, JR., 58 years of age, Filipino, has been the VICE PRESIDENT FOR FINANCE of the Company since January 2010. He obtained his Bachelor of Science in Business Administration Major in Accounting from the University of Eastern Philippines and Bachelor of Laws from Jose Rizal College. Atty. Padro is also the Vice President for Finance of International Pipe Industries Corp. Atty. Padro since 1990, and during the last five (5) years, has been engaged in the practice of law. He is also a Certified Public Accountant. Mr. Manuel G. Arteficio and Mr. Francisco M. Bayot, Jr. were elected Independent Directors during the 2016 Annual Stockholders’ Meeting. The Nomination Committee nominated Mr. Arteficio and Mr. Bayot as independent directors to be elected during the 2017 Annual Stockholders’ Meeting. Both Mr. Arteficio and Mr. Bayot are qualified to be nominated and elected as Independent Directors of the Company in accordance with the qualifications specified with SEC Circular No. 16 Series of 2002 and SEC Circular No. 16 Series of 2006. Directors elected in the annual stockholders’ meeting have a term of office of one (1) year and serve as such until their successors are elected and qualified in the succeeding annual meeting of stockholders. (2) Significant Employees While all employees are expected to make a significant contribution to the Company, there is no one particular employee, not an executive officer, expected to make a significant contribution to the business of the Company on his own. (3) Family Relationships Mr. Edgardo P. Reyes, Chairman and CEO; Mr. Wilfrido P. Reyes, President; and Ms. Belen R. Castro, Vice President, Treasurer and Director of the Company are brothers and sister. All other Directors and Executive Officers are not related to each other. Other than the ones disclosed, there are no other family relationships known to the registrant. (4) Involvement in Certain Legal Proceedings None of the directors, nominees for election as a director, executive officers or control persons of the Company have been involved in any legal proceeding required to be disclosed under Part IV paragraph (A)(4) of SRC Rule 12 (Annex C, Amended), including without limitation being the subject of any:
16
(a) bankruptcy petition filed by or against any business of which such person was a general partner or executive officer either at the time of the bankruptcy or within two years prior to that time; (b) conviction by final judgment, including the nature of the offense, in a criminal proceeding, domestic or foreign, or being subject to a pending criminal proceeding, domestic or foreign, excluding traffic violations and other minor offenses; (c) order, judgment or decree, not subsequently reversed, suspended or vacated, of any court of competent jurisdiction, domestic or foreign, permanently or temporarily enjoining barring, suspending or otherwise limiting his involvement in any type of business, securities commodities or banking activities; and (d) order or judgment of a domestic or foreign court of competent jurisdiction (in a civil action), the Commission or comparable foreign body, or a domestic or foreign Exchange or other organized trading market or self-regulatory organization finding him/her to have violated a securities or commodities law or regulation, for the past five (5) years up to the latest date, that is material to the evaluation of the ability or integrity to hold the relevant position in the Company.
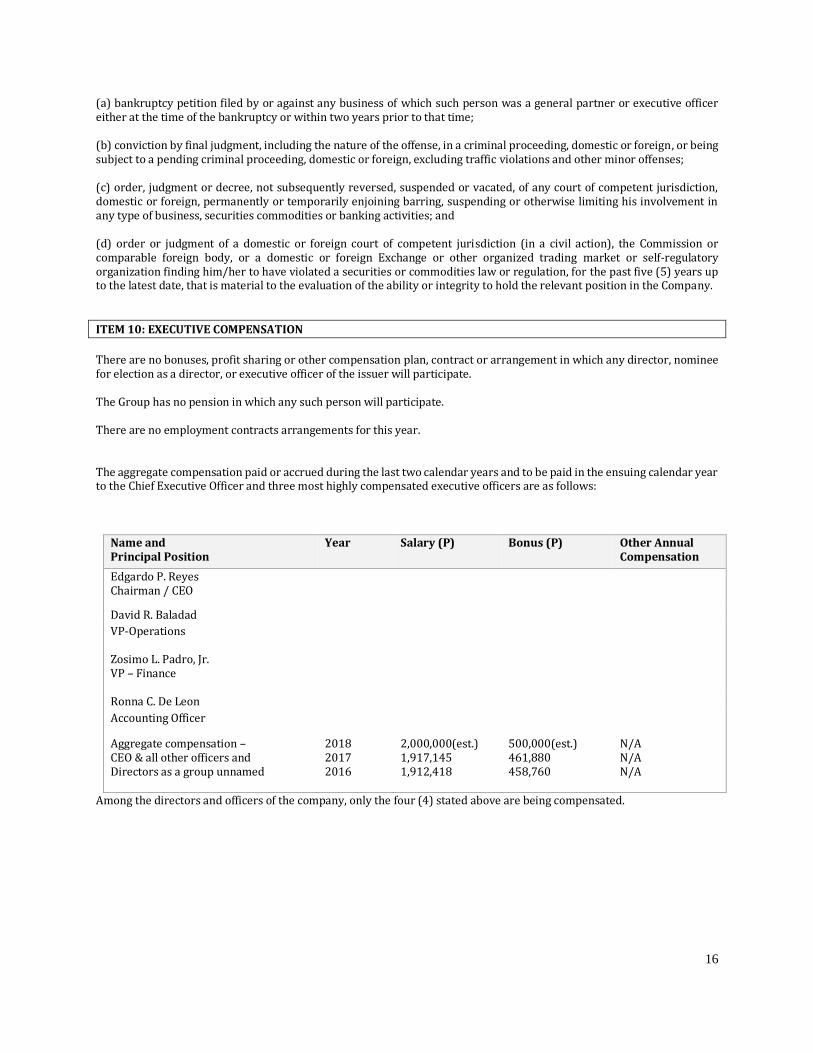
ITEM 10: EXECUTIVE COMPENSATION
There are no bonuses, profit sharing or other compensation plan, contract or arrangement in which any director, nominee for election as a director, or executive officer of the issuer will participate. The Group has no pension in which any such person will participate. There are no employment contracts arrangements for this year. The aggregate compensation paid or accrued during the last two calendar years and to be paid in the ensuing calendar year to the Chief Executive Officer and three most highly compensated executive officers are as follows:
Name and Principal Position
Year Salary (P) Bonus (P) Other Annual Compensation
Edgardo P. Reyes Chairman / CEO
David R. Baladad
VP-Operations Zosimo L. Padro, Jr. VP – Finance
Ronna C. De Leon
Accounting Officer
Aggregate compensation – CEO & all other officers and Directors as a group unnamed
2018 2017 2016
2,000,000(est.) 1,917,145 1,912,418
500,000(est.) 461,880 458,760
N/A N/A N/A
Among the directors and officers of the company, only the four (4) stated above are being compensated.

17
ITEM 11: SECURITY OWNERSHIP OF CERTAIN BENEFICIAL OWNERS AND MANAGEMENT
(a) Security Ownership of Certain Record and Beneficial Owners and Management as of December 31, 2017
(owning more than 5% of any class of voting securities)
Title of Class
Name and address of record owner and
Relationship with Issuer
Name of Beneficial ownership and relationship with record owner
Citizenship No. of Shares Held
Percent
Common
EDGARDO P. REYES 1371 Caballero St., Dasmariñas Vill., Makati
Director
EDGARDO P. REYES, same person
Filipino
229,853,123
25.4849%
Common Common
BELEN R. CASTRO 4889 Pasay Road, Dasmariñas Vill., Makati WILFRIDO P. REYES 1545 Mahogany St., Dasmariñas Vill., Makati
Director Director
BELEN R. CASTRO, same person WILFRIDO P. REYES, same person
Filipino Filipino
231,531,122 226,853,123
25.6709% 25.1522%
Common
PCD Nominee Corp. (Filipino) G/F MKSE Bldg., 6767 Ayala Ave., Makati
Stockholder
PCD Nominee Corp. (Filipino), depository agent
Filipino
161,259,829
17.8796%
There are no beneficial owners of more than 5% under the PCD Nominee Corporation (Filipino), which owns 17.8796% of the total shares of the Company. (b) Security Ownership of Management Directors
Title of Class
Name of Beneficial Owner
Amount and Nature of Beneficial Ownership
Citizenship Percent of Class
Common Shares
Edgardo P.Reyes
229,853,123
Direct, Record and Beneficial
Filipino
25.4849%
Common Shares Belen R. Castro 231,531,122 Direct, Record and Beneficial
Filipino 25.6709%
Common Shares Wilfrido P. Reyes 226,853,123 Direct, Record and Beneficial
Filipino 25.1522%
Common Shares Francisco M. Bayot, Jr.
400,000 Direct, Record and Beneficial
Filipino 00.0443%
Common Shares Manuel G. Arteficio 100,000 Direct, Record and Beneficial
Filipino 00.0111 %
Total 688,737,368 76.3634%
18
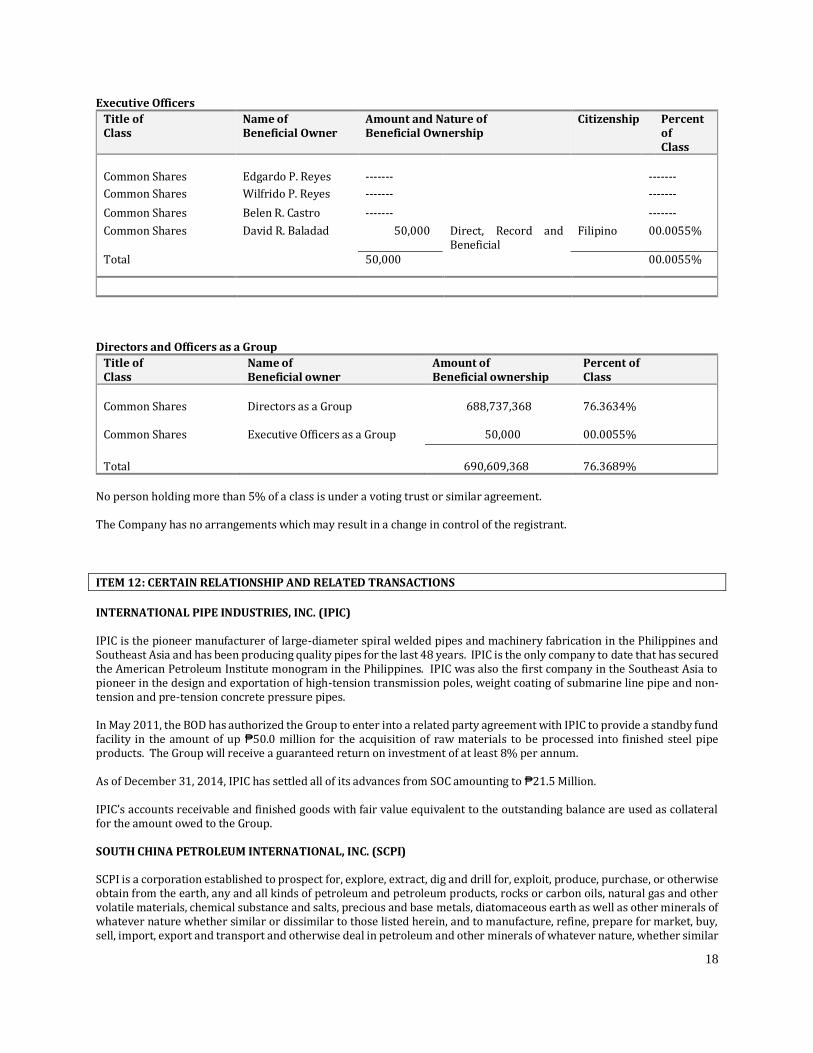
Executive Officers
Title of Class
Name of Beneficial Owner
Amount and Nature of Beneficial Ownership
Citizenship Percent of Class
Common Shares
Edgardo P. Reyes
-------
-------
Common Shares Wilfrido P. Reyes ------- -------
Common Shares Belen R. Castro ------- -------
Common Shares David R. Baladad 50,000 Direct, Record and Beneficial
Filipino 00.0055%
Total 50,000 00.0055%
Directors and Officers as a Group
Title of Class
Name of Beneficial owner
Amount of Beneficial ownership
Percent of Class
Common Shares
Directors as a Group
688,737,368
76.3634%
Common Shares
Executive Officers as a Group
50,000
00.0055%
Total
690,609,368
76.3689%
No person holding more than 5% of a class is under a voting trust or similar agreement. The Company has no arrangements which may result in a change in control of the registrant.
ITEM 12: CERTAIN RELATIONSHIP AND RELATED TRANSACTIONS
INTERNATIONAL PIPE INDUSTRIES, INC. (IPIC) IPIC is the pioneer manufacturer of large-diameter spiral welded pipes and machinery fabrication in the Philippines and Southeast Asia and has been producing quality pipes for the last 48 years. IPIC is the only company to date that has secured the American Petroleum Institute monogram in the Philippines. IPIC was also the first company in the Southeast Asia to pioneer in the design and exportation of high-tension transmission poles, weight coating of submarine line pipe and non-tension and pre-tension concrete pressure pipes. In May 2011, the BOD has authorized the Group to enter into a related party agreement with IPIC to provide a standby fund facility in the amount of up ₱50.0 million for the acquisition of raw materials to be processed into finished steel pipe products. The Group will receive a guaranteed return on investment of at least 8% per annum. As of December 31, 2014, IPIC has settled all of its advances from SOC amounting to ₱21.5 Million. IPIC’s accounts receivable and finished goods with fair value equivalent to the outstanding balance are used as collateral for the amount owed to the Group. SOUTH CHINA PETROLEUM INTERNATIONAL, INC. (SCPI) SCPI is a corporation established to prospect for, explore, extract, dig and drill for, exploit, produce, purchase, or otherwise obtain from the earth, any and all kinds of petroleum and petroleum products, rocks or carbon oils, natural gas and other volatile materials, chemical substance and salts, precious and base metals, diatomaceous earth as well as other minerals of whatever nature whether similar or dissimilar to those listed herein, and to manufacture, refine, prepare for market, buy, sell, import, export and transport and otherwise deal in petroleum and other minerals of whatever nature, whether similar
19
or dissimilar thereto, their products, compounds and derivatives and other mineral and chemical substances in crude or refined condition, and to generally engage, as may be permitted by law, in the business of, and/or investing in mining, manufacturing, contracting and servicing, in addition to oil exploration. The total amount of receivable from SCPI as of December 31, 2017 and 2016 amounted to ₱191,619 and ₱179,036 which pertains to the amount paid for the business permit and registration. The amount is due and demandable.
ITEM 13: CORPORATE GOVERNANCE
An evaluation system is being set in place in relation to the provisions of the Revised Manual on Corporate Governance to measure the level of compliance by directors and top management. Also, the Company and its directors, officers and employees complied with all the leading practices and principles on good governance as embodied in the company’s Revised Corporate Governance Manual. The Company believes that the current corporate governance of the Company is sufficient to address its needs. As per SEC Notice dated 05 April 2018, this portion has been deleted pursuant to SEC Memorandum Circular No. 5, series of 2013. SEC Integrated Annual Corporate Governance Report (I-ACGR) for the year 2017 will be due on or before 30 May 2018. PART V - EXHIBITS AND SCHEDULES
ITEM 14: EXHIBITS AND REPORTS ON SEC FORM 17-C
(a) Exhibits – None (b) Reports on SEC Form 17-C
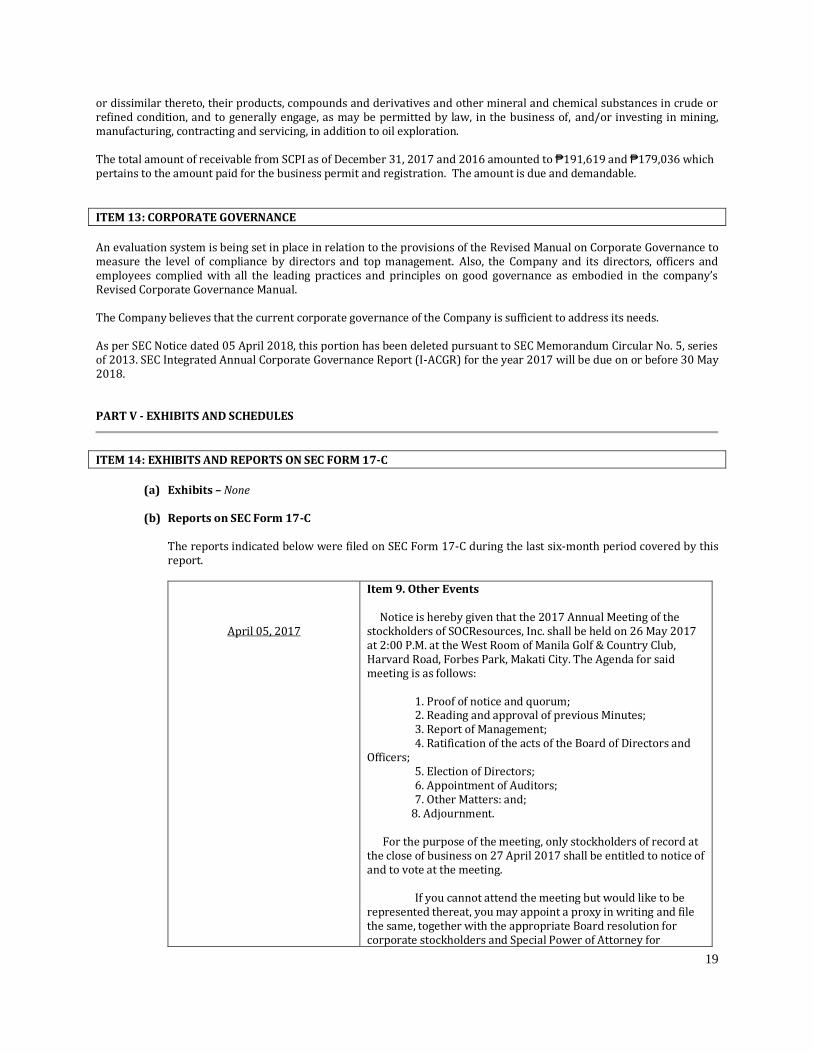
The reports indicated below were filed on SEC Form 17-C during the last six-month period covered by this report.
April 05, 2017
Item 9. Other Events Notice is hereby given that the 2017 Annual Meeting of the stockholders of SOCResources, Inc. shall be held on 26 May 2017 at 2:00 P.M. at the West Room of Manila Golf & Country Club, Harvard Road, Forbes Park, Makati City. The Agenda for said meeting is as follows: 1. Proof of notice and quorum; 2. Reading and approval of previous Minutes; 3. Report of Management; 4. Ratification of the acts of the Board of Directors and Officers; 5. Election of Directors; 6. Appointment of Auditors; 7. Other Matters: and; 8. Adjournment. For the purpose of the meeting, only stockholders of record at the close of business on 27 April 2017 shall be entitled to notice of and to vote at the meeting. If you cannot attend the meeting but would like to be represented thereat, you may appoint a proxy in writing and file the same, together with the appropriate Board resolution for corporate stockholders and Special Power of Attorney for

20
individual stockholders, with the Corporation on or before 18 May 2017. Said proxies shall be validated on 20 May 2017 at 10:00 a.m. at the Corporation’s principal offices at 4th Floor Enzo Bldg. 399 Sen. Gil Puyat Avenue Makati, City. On the day of the meeting, you or your proxy are hereby required to bring this Notice and any form of identification, e.g. driver’s license, company ID, TIN card, etc., to facilitate registration.
May 26, 2017
Item 4. Resignation, Removal or Election of Directors or Officers The stockholders of the issuer (referred herein as the “Company”) at their annual meeting held on May 26, 2017, have re-elected the following Directors for the ensuing year: Edgardo P. Reyes Wilfrido P. Reyes Belen R. Castro Francisco M. Bayot, Jr. Manuel G. Arteficio Among the directors stated above, Mr. Manuel G. Arteficio and Mr. Francisco M. Bayot, Jr. are Independent Directors. That at the same annual meeting, the accounting firm of Sycip Gorres Velayo & Co. was re-appointed as the Company’s external auditors for the fiscal year 2017 with Mr. Kristopher S. Catalan being appointed as Engagement Partner.
July 12, 2017
Item 4. Resignation, Removal or Election of Directors or
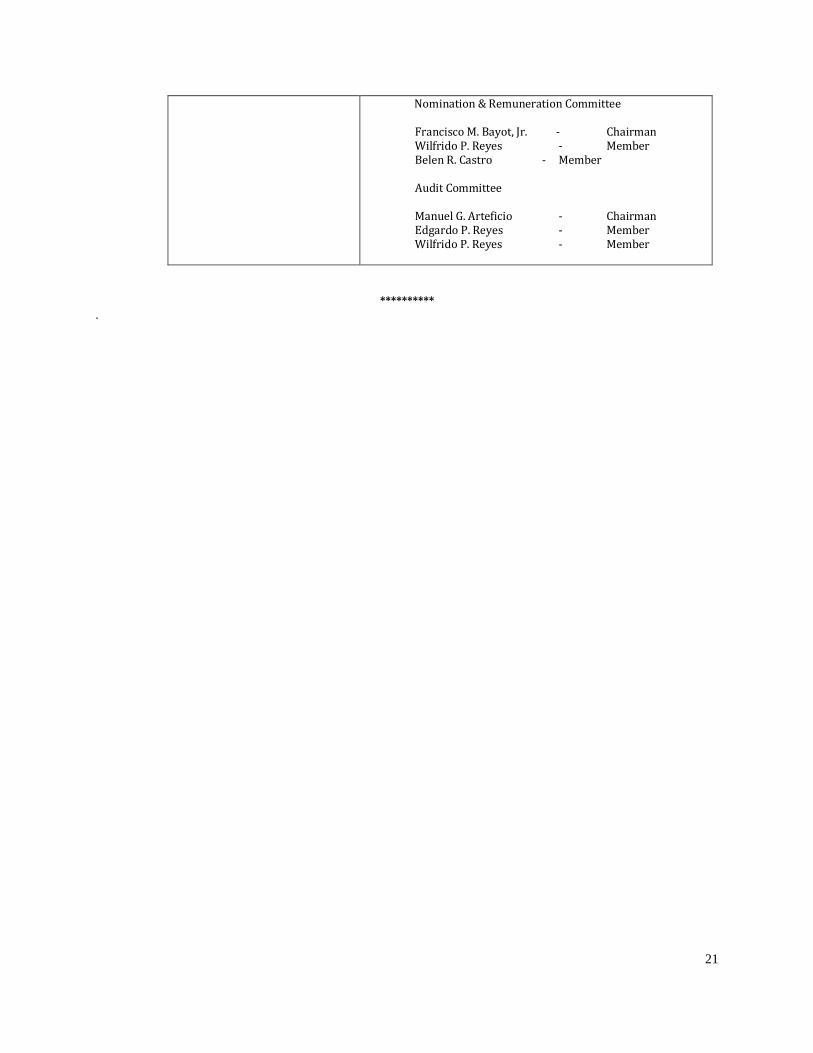
Officers The Board of Directors at their organizational meeting held on July 12, 2017, have re-elected the following Officers for the ensuing year: Edgardo P. Reyes - Chairman Wilfrido P. Reyes - President Belen R. Castro - Vice President & Treasurer Magilyn T. Loja - Corporate Secretary David R. Baladad - Vice President for Operations and Compliance Officer Zosimo L. Padro, Jr. - Vice President for Finance and that the following Directors were designated members of the following Committees: Executive Committee Edgardo P. Reyes - Chairman Wilfrido P. Reyes - Member Manuel G. Arteficio - Member
21
Nomination & Remuneration Committee Francisco M. Bayot, Jr. - Chairman Wilfrido P. Reyes - Member Belen R. Castro - Member Audit Committee Manuel G. Arteficio - Chairman Edgardo P. Reyes - Member Wilfrido P. Reyes - Member
********** .


SOCResources, Inc. and Subsidiary
Consolidated Financial StatementsDecember 31, 2017 and 2016and Years Ended December 31, 2017, 2016and 2015
and
Independent Auditor’s Report

*SGVFS029391*
INDEPENDENT AUDITOR’S REPORT
The Board of Directors and the StockholdersSOCResources, Inc.4th Floor Enzo Building399 Senator Gil Puyat AvenueMakati City 1200
Opinion
We have audited the consolidated financial statements of SOCResources, Inc. and Subsidiary (the“Group”), which comprise the consolidated statements of financial position as at December 31, 2017 and2016, and the consolidated statements of comprehensive income, consolidated statements of changes inequity and consolidated statements of cash flows for each of the three years in the period endedDecember 31, 2017, and notes to the consolidated financial statements, including a summary ofsignificant accounting policies.
In our opinion, the consolidated financial statements present fairly, in all material respects, theconsolidated financial position of the Group as at December 31, 2017 and 2016, and its consolidatedfinancial performance and its consolidated cash flows for each of the three years in the period endedDecember 31, 2017, in accordance with Philippine Financial Reporting Standards (PFRSs).
Basis for Opinion
We conducted our audits in accordance with Philippine Standards on Auditing (PSAs). Ourresponsibilities under those standards are further described in the Auditor’s Responsibilities for the Auditof the Consolidated Financial Statements section of our report. We are independent of the Group inaccordance with the Code of Ethics for Professional Accountants in the Philippines (Code of Ethics)together with the ethical requirements that are relevant to our audit of the consolidated financialstatements in the Philippines, and we have fulfilled our other ethical responsibilities in accordance withthese requirements and the Code of Ethics. We believe that the audit evidence we have obtained issufficient and appropriate to provide a basis for our opinion.
Key Audit Matters
Key audit matters are those matters that, in our professional judgment, were of most significance in ouraudit of the consolidated financial statements of the current period. These matters were addressed in thecontext of our audit of the consolidated financial statements as a whole, and in forming our opinionthereon, and we do not provide a separate opinion on these matters. For each matter below, ourdescription of how our audit addressed the matter is provided in that context.
We have fulfilled the responsibilities described in the Auditor’s Responsibilities for the Audit of theConsolidated Financial Statements section of our report, including in relation to these matters.Accordingly, our audit included the performance of procedures designed to respond to our assessment ofthe risks of material misstatement of the consolidated financial statements. The results of our auditprocedures, including the procedures performed to address the matters below, provide the basis for ouraudit opinion on the accompanying consolidated financial statements.
SyCip Gorres Velayo & Co.6760 Ayala Avenue1226 Makati CityPhilippines
Tel: (632) 891 0307Fax: (632) 819 0872ey.com/ph
BOA/PRC Reg. No. 0001, December 14, 2015, valid until December 31, 2018SEC Accreditation No. 0012-FR-4 (Group A), November 10, 2015, valid until November 9, 2018
A member firm of Ernst & Young Global Limited

*SGVFS029391*
- 2 -
Revenue and Costs Recognition
The Group applies the percentage-of-completion (POC) method in determining the real estate revenueand costs. The POC is based on the proportion of costs incurred to date over the total estimated cost ofthe real estate project. The cost of real estate sales is determined on the basis of the total estimated costsapplied with the POC of the project. The Group’s real estate revenue and costs account for 75% of thetotal consolidated revenue and 100% of the total consolidated cost of real estate sales, respectively, for theyear ended December 31, 2017. The estimation of the total cost of the real estate project requirestechnical inputs by third party project development engineers. In addition, the Group requires a certainpercentage of the buyer’s payments from the total selling price (buyer’s equity), to be collected as one ofthe criteria in order to initiate revenue recognition. It is management’s assumption that economic benefitswill flow into the Group because of the buyers’ continuing commitment to the sales agreement. Thismatter is significant to our audit because the assessment of the stage of completion and the level ofbuyer’s equity involves significant management judgment as disclosed in Note 2 to the consolidatedfinancial statements.
Audit Response
We obtained an understanding of the Group’s processes in evaluating the POC and the cost accumulationprocess, as well as in calculating and updating the total estimated costs. We also performed tests of therelevant controls on these processes, and assessed the competence, capabilities and objectivity of theproject engineers with reference to their qualifications, experience and reporting responsibilities. Forselected projects, we traced the accumulated costs to the supporting documents such as the notices ofaward to contractors, billing statements, accomplishment reports, payment vouchers and official receipts.We visited selected project sites and made relevant inquiries with project engineers. We performed a testcomputation of management’s calculation of the POC. For selected projects, we obtained the approvedtotal estimated costs and the supporting details such as the duration of the work, terms of payment andother inclusions in the contract price. We evaluated management’s basis of the buyer’s equity bycomparing this to the historical analysis of sales collections from buyers with accumulated paymentsabove the collection threshold. We also inspected supporting documents such as sales and collectionreports, and the related official receipts.
Other Information
Management is responsible for the other information. The other information comprises the informationincluded in the SEC Form 20-IS (Definitive Information Statement), SEC Form 17-A and Annual Reportfor the year ended December 31, 2017, but does not include the consolidated financial statements and ourauditor’s report thereon. The SEC Form 20-IS (Definitive Information Statement), SEC Form 17-A andAnnual Report for the year ended December 31, 2017 are expected to be made available to us after thedate of this auditor’s report.
Our opinion on the consolidated financial statements does not cover the other information and we will notexpress any form of assurance conclusion thereon.
In connection with our audits of the consolidated financial statements, our responsibility is to read theother information identified above when it becomes available and, in doing so, consider whether the otherinformation is materially inconsistent with the consolidated financial statements or our knowledgeobtained in the audits or otherwise appears to be materially misstated.
A member firm of Ernst & Young Global Limited

*SGVFS029391*
- 3 -
Responsibilities of Management and Those Charged with Governance for the ConsolidatedFinancial Statements
Management is responsible for the preparation and fair presentation of the consolidated financialstatements in accordance with PFRSs, and for such internal control as management determines isnecessary to enable the preparation of consolidated financial statements that are free from materialmisstatement, whether due to fraud or error.
In preparing the consolidated financial statements, management is responsible for assessing the Group’sability to continue as a going concern, disclosing, as applicable, matters related to going concern andusing the going concern basis of accounting unless management either intends to liquidate the Group or tocease operations, or has no realistic alternative but to do so.
Those charged with governance are responsible for overseeing the Group’s financial reporting process.
Auditor’s Responsibilities for the Audit of the Consolidated Financial Statements
Our objectives are to obtain reasonable assurance about whether the consolidated financial statements as awhole are free from material misstatement, whether due to fraud or error, and to issue an auditor’s reportthat includes our opinion. Reasonable assurance is a high level of assurance, but is not a guarantee that anaudit conducted in accordance with PSAs will always detect a material misstatement when it exists.Misstatements can arise from fraud or error and are considered material if, individually or in theaggregate, they could reasonably be expected to influence the economic decisions of users taken on thebasis of these consolidated financial statements.
As part of an audit in accordance with PSAs, we exercise professional judgment and maintainprofessional skepticism throughout the audit. We also:
· Identify and assess the risks of material misstatement of the consolidated financial statements,whether due to fraud or error, design and perform audit procedures responsive to those risks, andobtain audit evidence that is sufficient and appropriate to provide a basis for our opinion. The risk ofnot detecting a material misstatement resulting from fraud is higher than for one resulting from error,as fraud may involve collusion, forgery, intentional omissions, misrepresentations, or the override ofinternal control.
· Obtain an understanding of internal control relevant to the audit in order to design audit proceduresthat are appropriate in the circumstances, but not for the purpose of expressing an opinion on theeffectiveness of the Group’s internal control.
· Evaluate the appropriateness of accounting policies used and the reasonableness of accountingestimates and related disclosures made by management.
· Conclude on the appropriateness of management’s use of the going concern basis of accounting and,based on the audit evidence obtained, whether a material uncertainty exists related to events orconditions that may cast significant doubt on the Group’s ability to continue as a going concern. Ifwe conclude that a material uncertainty exists, we are required to draw attention in our auditor’sreport to the related disclosures in the consolidated financial statements or, if such disclosures areinadequate, to modify our opinion. Our conclusions are based on the audit evidence obtained up tothe date of our auditor’s report. However, future events or conditions may cause the Group to ceaseto continue as a going concern.
A member firm of Ernst & Young Global Limited

*SGVFS029391*
- 4 -
· Evaluate the overall presentation, structure and content of the consolidated financial statements,including the disclosures, and whether the consolidated financial statements represent the underlyingtransactions and events in a manner that achieves fair presentation.
· Obtain sufficient appropriate audit evidence regarding the financial information of the entities orbusiness activities within the Group to express an opinion on the consolidated financial statements.We are responsible for the direction, supervision and performance of the audit. We remain solelyresponsible for our audit opinion.
We communicate with those charged with governance regarding, among other matters, the planned scopeand timing of the audit and significant audit findings, including any significant deficiencies in internalcontrol that we identify during our audit.
We also provide those charged with governance with a statement that we have complied with relevantethical requirements regarding independence, and communicate with them all relationships and othermatters that may reasonably be thought to bear on our independence, and where applicable, relatedsafeguards.
From the matters communicated with those charged with governance, we determine those matters thatwere of most significance in the audit of the consolidated financial statements of the current period andare therefore the key audit matters. We describe these matters in our auditor’s report unless law orregulation precludes public disclosure about the matter or when, in extremely rare circumstances, wedetermine that a matter should not be communicated in our report because the adverse consequences ofdoing so would reasonably be expected to outweigh the public interest benefits of such communication.
The engagement partner on the audit resulting in this independent auditor’s report isKristopher S. Catalan.
SYCIP GORRES VELAYO & CO.
Kristopher S. CatalanPartnerCPA Certificate No. 109712SEC Accreditation No. 1509-A (Group A), October 1, 2015, valid until September 30, 2018Tax Identification No. 233-299-245BIR Accreditation No. 08-001998-109-2018, February 14, 2018, valid until February 13, 2021PTR No. 6621237, January 9, 2018, Makati City
April 13, 2018
A member firm of Ernst & Young Global Limited

*SGVFS029391*
SOCRESOURCES, INC. AND SUBSIDIARYCONSOLIDATED STATEMENTS OF FINANCIAL POSITION
December 312017 2016
ASSETSCurrent AssetsCash and cash equivalents (Note 4) P=115,032,410 P=357,158,066Short-term investments (Note 5) 255,823,471 –Receivables (Note 6) 57,477,913 75,635,832Real estate inventories (Note 7) 904,056,020 895,840,042Due from a related party (Note 18) 191,619 179,036Prepayments and other current assets (Note 8) 59,023,903 68,390,280Total Current Assets 1,391,605,336 1,397,203,256Noncurrent AssetsReceivables - net of current portion (Note 6) 61,841,846 78,848,862Real estate inventories - net of current portion (Note 7) 188,813,004 186,281,554Available-for-sale (AFS) financial assets (Note 9) 53,445,971 40,860,708Property and equipment (Note 10) 34,866,689 34,682,617Other noncurrent asset (Note 11) 27,497,408 27,088,243Total Noncurrent Assets 366,464,918 367,761,984TOTAL ASSETS P=1,758,070,254 P=1,764,965,240
LIABILITIES AND EQUITYCurrent LiabilitiesAccounts payable and other liabilities (Note 12) P=128,277,782 P=114,205,459Noncurrent LiabilitiesRetirement benefit obligation (Note 16) 4,795,410 4,222,219Deferred tax liability 4,022,694 –Total Noncurrent Liabilities 8,818,104 4,222,219Total Liabilities 137,095,886 118,427,678EquityCommon stock - P=1 par value (Note 19)
Authorized - 1,000,000,000 sharesIssued - 600,559,569 shares 600,559,569 600,559,569Subscribed - 306,000,000 shares in 2017 and 2016
(net of subscription receivable of P=229,500,000 in 2017 and 2016) 76,500,000 76,500,000Additional paid-in capital 72,272,140 72,272,140Retained earnings:
Appropriated (Note 19) 745,000,000 745,000,000Unappropriated 116,806,639 143,071,110
Other comprehensive income:Unrealized valuation gains on AFS financial assets (Note 9) 14,449,049 13,712,536Actuarial gains on defined benefit plan (Note 16) 348,621 383,857
Treasury stock (Note 19) (4,961,650) (4,961,650)Equity 1,620,974,368 1,646,537,562TOTAL LIABILITIES AND EQUITY P=1,758,070,254 P=1,764,965,240
See accompanying Notes to Consolidated Financial Statements.

*SGVFS029391*
SOCRESOURCES, INC. AND SUBSIDIARYCONSOLIDATED STATEMENTS OF COMPREHENSIVE INCOME
Years Ended December 312017 2016 2015
REVENUEReal estate sales P=64,931,959 P=156,770,447 P=250,260,691Interest income (Notes 4, 5 and 6) 12,896,876 13,195,736 4,867,872Dividend income (Note 9) 350,056 343,869 273,350Gain on redemption of Unit Investment Trust Fund (UITF) (Note 9) 257,841 – –Foreign exchange gains - net 25,803 328,198 287,439Other income - net (Note 15) 5,388,164 40,869,226 16,098,064
83,850,699 211,507,476 271,787,416
COSTS AND EXPENSESCost of real estate sales (Note 7) (33,411,749) (113,657,657) (195,967,763)General and administrative expenses (Note 13) (50,802,952) (56,370,938) (66,942,563)Sales and marketing expenses (Note 14) (22,455,660) (14,340,893) (28,973,782)
(106,670,361) (184,369,488) (291,884,108)
INCOME (LOSS) BEFORE INCOME TAX (22,819,662) 27,137,988 (20,096,692)
PROVISION FOR INCOME TAX (Note 17)Current 1,276,648 1,373,128 1,213,840Deferred 2,168,161 – –
3,444,809 1,373,128 1,213,840
NET INCOME (LOSS) (26,264,471) 25,764,860 (21,310,532)
OTHER COMPREHENSIVE INCOMEOther comprehensive income to be reclassified to profit
or loss in subsequent periods: Net gains on AFS financial assets, net of
deferred income tax (Note 9) 736,513 8,114,806 4,268,083Other comprehensive income (loss) not to be reclassified
to profit or loss in subsequent periods: Actuarial gains (loss) on defined benefit plan (Note 16) (35,236) 195,764 78,566
701,277 8,310,570 4,346,649
TOTAL COMPREHENSIVE INCOME (LOSS) (P=25,563,194) P=34,075,430 (P=16,963,883)
Basic/Diluted Earnings (Loss) Per Share (Note 20) (P=0.0291) P=0.0284 (P=0.0235)
See accompanying Notes to Consolidated Financial Statements.

*SGVFS029391*
SOCRESOURCES, INC. AND SUBSIDIARYCONSOLIDATED STATEMENTS OF CASH FLOWS
Years Ended December 312017 2016 2015
CASH FLOWS FROM OPERATING ACTIVITIESIncome (loss) before income tax (P=22,819,662) P=27,137,988 (P=20,096,692)Adjustments for:
Depreciation and amortization (Note 10) 2,422,066 2,685,275 2,344,875Provision for impairment loss on
AFS financial assets – – 7,835,749Gain on redemption of UITF (Note 9) (257,841) – –Unrealized foreign exchange gains (25,803) (328,198) (287,439)Dividend income (Note 9) (350,056) (343,869) (273,350)Interest income (Notes 4, 5 and 9) (12,896,876) (13,195,736) (4,867,872)Retirement benefit cost (Note 16) 543,738 561,193 507,064Gain on repossession (Note 15) (4,170,772) (15,398,166) (5,428,035)
Operating income (loss) before working capital changes (37,555,206) 1,118,487 (20,265,700)Decrease (increase) in:
Accounts receivables 35,263,823 48,007,270 (41,902,172)Real estate inventories (6,576,656) 44,560,196 162,735,641Due from a related party (12,583) (12,583) (16,052)Prepayments and other current assets 13,053,876 (9,306,128) (7,272,650)
Increase (decrease) in accounts payable and other liabilities 14,072,323 (38,210,043) (77,416,007)Cash flows generated from operations 18,245,577 46,157,199 15,863,060Interest received 9,646,610 13,174,504 4,867,872Income taxes paid (including creditable withholding taxes) (5,373,312) (1,373,128) (1,213,840)Net cash flows from operating activities 22,518,875 57,958,575 19,517,092
CASH FLOWS FROM INVESTING ACTIVITIESAcquisitions of:
Short-term investments (Note 5) (252,573,205) – –AFS financial assets (Note 9) (140,000,000) – –Property and equipment (Note 10) (2,606,138) (281,129) (4,886,443)
Proceeds from redemption of UITF (Note 9) 130,257,841 – –Dividends received (Note 9) 251,168 343,869 273,350Net cash flows from (used in) investing activities (264,670,334) 62,740 (4,613,093)
CASH FLOWS FROM FINANCING ACTIVITYProceeds from issuance of capital stock – – 52,500
EFFECT OF EXCHANGE RATE CHANGES ON CASH AND CASH EQUIVALENTS 25,803 328,198 287,439
NET INCREASE (DECREASE) IN CASH AND CASH EQUIVALENTS (242,125,656) 58,349,513 15,243,938
CASH AND CASH EQUIVALENTS AT BEGINNING OF YEAR 357,158,066 298,808,553 283,564,615
CASH AND CASH EQUIVALENTS AT END OF YEAR (Note 4) P=115,032,410 P=357,158,066 P=298,808,553
See accompanying Notes to Consolidated Financial Statements.
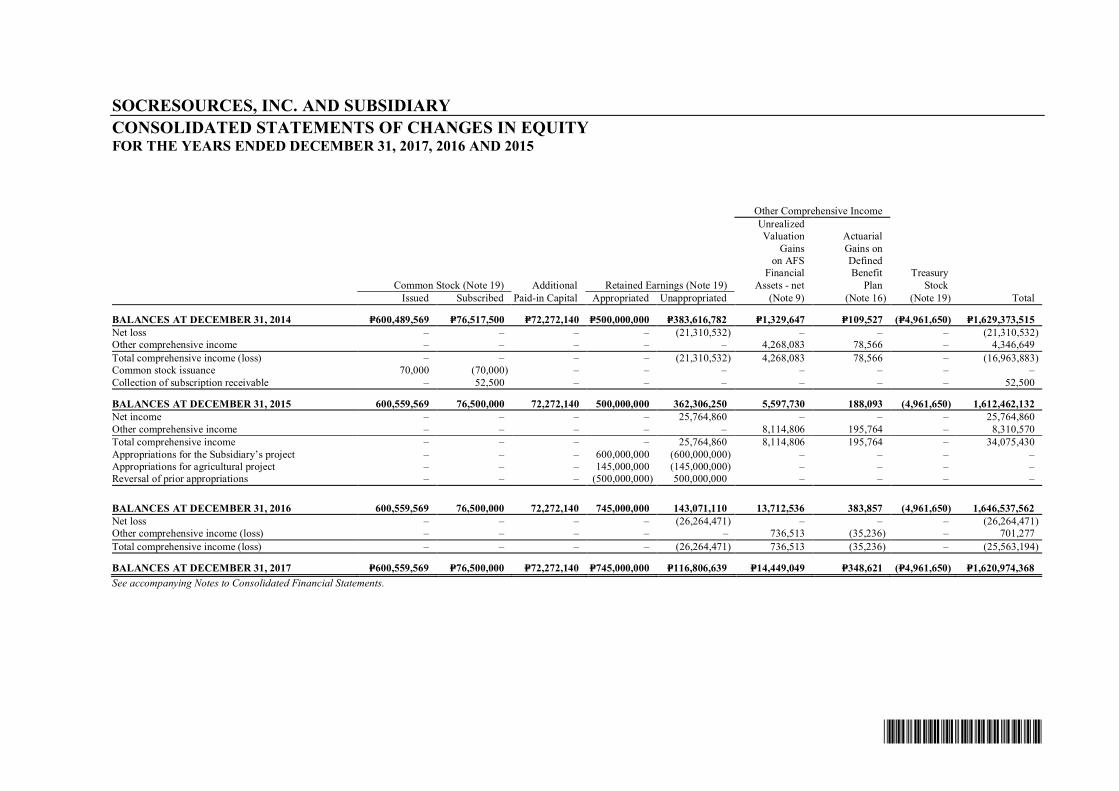
*SGVFS029391*
SOCRESOURCES, INC. AND SUBSIDIARYCONSOLIDATED STATEMENTS OF CHANGES IN EQUITYFOR THE YEARS ENDED DECEMBER 31, 2017, 2016 AND 2015
Other Comprehensive IncomeUnrealizedValuation Actuarial
Gains Gains onon AFS Defined
Financial Benefit TreasuryCommon Stock (Note 19) Additional Retained Earnings (Note 19) Assets - net Plan Stock
Issued Subscribed Paid-in Capital Appropriated Unappropriated (Note 9) (Note 16) (Note 19) Total
BALANCES AT DECEMBER 31, 2014 P=600,489,569 P=76,517,500 P=72,272,140 P=500,000,000 P=383,616,782 P=1,329,647 P=109,527 (P=4,961,650) P=1,629,373,515Net loss – – – – (21,310,532) – – – (21,310,532)Other comprehensive income – – – – – 4,268,083 78,566 – 4,346,649Total comprehensive income (loss) – – – – (21,310,532) 4,268,083 78,566 – (16,963,883)Common stock issuance 70,000 (70,000) – – – – – – –Collection of subscription receivable – 52,500 – – – – – – 52,500
BALANCES AT DECEMBER 31, 2015 600,559,569 76,500,000 72,272,140 500,000,000 362,306,250 5,597,730 188,093 (4,961,650) 1,612,462,132Net income – – – – 25,764,860 – – – 25,764,860Other comprehensive income – – – – – 8,114,806 195,764 – 8,310,570Total comprehensive income – – – – 25,764,860 8,114,806 195,764 – 34,075,430Appropriations for the Subsidiary’s project – – – 600,000,000 (600,000,000) – – – –Appropriations for agricultural project – – – 145,000,000 (145,000,000) – – – –Reversal of prior appropriations – – – (500,000,000) 500,000,000 – – – –
BALANCES AT DECEMBER 31, 2016 600,559,569 76,500,000 72,272,140 745,000,000 143,071,110 13,712,536 383,857 (4,961,650) 1,646,537,562Net loss – – – – (26,264,471) – – – (26,264,471)Other comprehensive income (loss) – – – – – 736,513 (35,236) – 701,277Total comprehensive income (loss) – – – – (26,264,471) 736,513 (35,236) – (25,563,194)
BALANCES AT DECEMBER 31, 2017 P=600,559,569 P=76,500,000 P=72,272,140 P=745,000,000 P=116,806,639 P=14,449,049 P=348,621 (P=4,961,650) P=1,620,974,368See accompanying Notes to Consolidated Financial Statements.

*SGVFS029391*
SOCRESOURCES, INC. AND SUBSIDIARYNOTES TO CONSOLIDATED FINANCIAL STATEMENTS
1. Corporate Information, Status of Operations and Approval and Authorization for Issuance ofthe Consolidated Financial Statements
Corporate InformationSOCResources, Inc., (the Parent Company) was incorporated in the Philippines and registered with thePhilippine Securities and Exchange Commission (SEC) on September 25, 1992, primarily to undertakeoil and gas exploration, development and production. The Parent Company’s shares of stock arepublicly traded in the Philippine Stock Exchange (PSE).
In October 2003, the Philippine SEC approved the amendment of the Parent Company’s articles ofincorporation, particularly the change in its primary purpose of business. The Parent Company is nowregistered primarily to invest in, purchase, or otherwise acquire and own, hold, use, sell, assign, transfer,mortgage, pledge, exchange, or otherwise dispose of real and personal property of every kind anddescription, in particular shares of stocks, voting trust certificates, bonds, debentures, notes, evidencesof indebtedness of associations and corporations, domestic or foreign, without being a stockbroker ordealer, and to issue in exchange therefore shares of the capital stock, bonds, notes, or other obligationsand/or assets of the Parent Company and while the owner thereof, to exercise all the rights, powers, andprivileges of ownership, including the right to vote any shares of stock or voting trust certificates soowned, and to do every act and thing that may generally be performed by entities known as “holdingcompanies”. The former primary purpose of oil and gas exploration was reclassified as among thesecondary purposes of the Parent Company.
On April 25, 2014, the Board of Directors (BOD) approved the amendment in the articles ofincorporation to change the name of the Parent Company from South China Resources, Inc. toSOCResources, Inc. The change was approved by the Philippine SEC on September 4, 2014.
SOC Land Development Corporation (SOC Land or the Subsidiary) was incorporated in the Philippinesand registered with the Philippine SEC on November 25, 2010.
The registered office address of the Parent Company is 4th floor Enzo Building, 399 Senator Gil PuyatAvenue, Makati City 1200.
Status of Operations Real Estate Development
In 2011, SOC Land undertook its maiden project called Anuva Residences (the Project). The Projectinvolves the development of a 2.4-hectare community situated near Sucat Interchange and will havefour tandem buildings. The total estimated cost of the Project is P=2.0 billion and is targeted forcompletion within five years from the start of its construction.
On July 12, 2011, the groundbreaking ceremony for the Project was held and construction for theProject’s Tandem Building 1 (Anala) commenced thereafter. Anala was completed in 2014, togetherwith the parking lots and the amenities facing the first building. In May 2016, the Group has startedthe turn over of Anala to its buyers.
On September 2, 2011, SOC Land’s Phase 1 project was duly registered with the Board of Investments(BOI) as a New Developer of Low-Cost Mass Housing on a Non-pioneer Status under the OmnibusInvestments Code of 1987 (Executive Order No. 226). With the registration, SOC Land is entitled toan Income Tax Holiday (ITH) for three years from October 2011 or actual start of commercialoperations or selling, whichever is earlier, but in no case earlier than the date of registration. Under the

- 2 -
*SGVFS029391*
specific terms and conditions of the registration, SOC Land shall submit proof of compliance that it hasdeveloped socialized housing project and accomplished corporate social responsibility activities thatwere duly identified by BOI in conjunction with the entitlement of ITH.
On December 14, 2011, the Housing and Land Use Regulatory Board released SOC Land’s License toSell for the Project.
On August 14, 2013, SOC Land has opted to surrender the original copy of the Certificate ofRegistration No. 2011-193 issued to SOC Land as New Developer of Low-Cost Mass Housing Projectwhich will cancel SOC Land’s entitlement to an ITH for three years.
In 2014, SOC Land launched a house and lot/lots only project that will be known as Althea Residences(Althea) which is located in Binan, Laguna with an initial offer of 214 choice lots, commercial andresidential combined.
The second tandem building of Anuva (Azalea) was formally launched in 2014 and is expected to havesales of 476 units combined of studio, 1 bedroom and 2 bedroom units.
Approval of the Consolidated Financial StatementsThe consolidated financial statements as at December 31, 2017 and 2016 and for each of the three yearsin the period ended December 31, 2017 were approved and authorized for issue by the BOD onApril 13, 2018.
2. Summary of Significant Accounting Policies
Basis of PreparationThe consolidated financial statements have been prepared on a historical cost basis except for available-for-sale (AFS) financial assets that have been measured at fair value. The consolidated financialstatements are presented in Philippine peso, which is the Parent Company and Subsidiary’s functionalcurrency. All values are rounded off to the nearest peso, except when otherwise indicated.
Statement of ComplianceThe accompanying consolidated financial statements have been prepared in accordance with PhilippineFinancial Reporting Standards (PFRSs).
Basis of ConsolidationThe consolidated financial statements include the accounts of the Parent Company and its whollyowned subsidiary, SOC Land. Subsidiaries are fully consolidated from the date of acquisition, beingthe date on which the Parent Company obtains control and continue to be consolidated until the datewhen such control ceases. The financial statements of the Subsidiary are prepared for the samereporting year as the Parent Company using consistent accounting policies.
Subsidiaries are entities over which the Parent Company has control or generally has an interest of morethan one half of the voting rights of the entities. The existence and effect of potential voting rights thatare currently exercisable or convertible are considered when assessing whether the Parent Companycontrols another entity. Control is achieved where the Parent Company has all of the following:
a. power over the investee;b. exposure, or rights, to variable returns from its involvement with the investee; andc. the ability to use its power over the investee to affect the amount of investor’s returns.
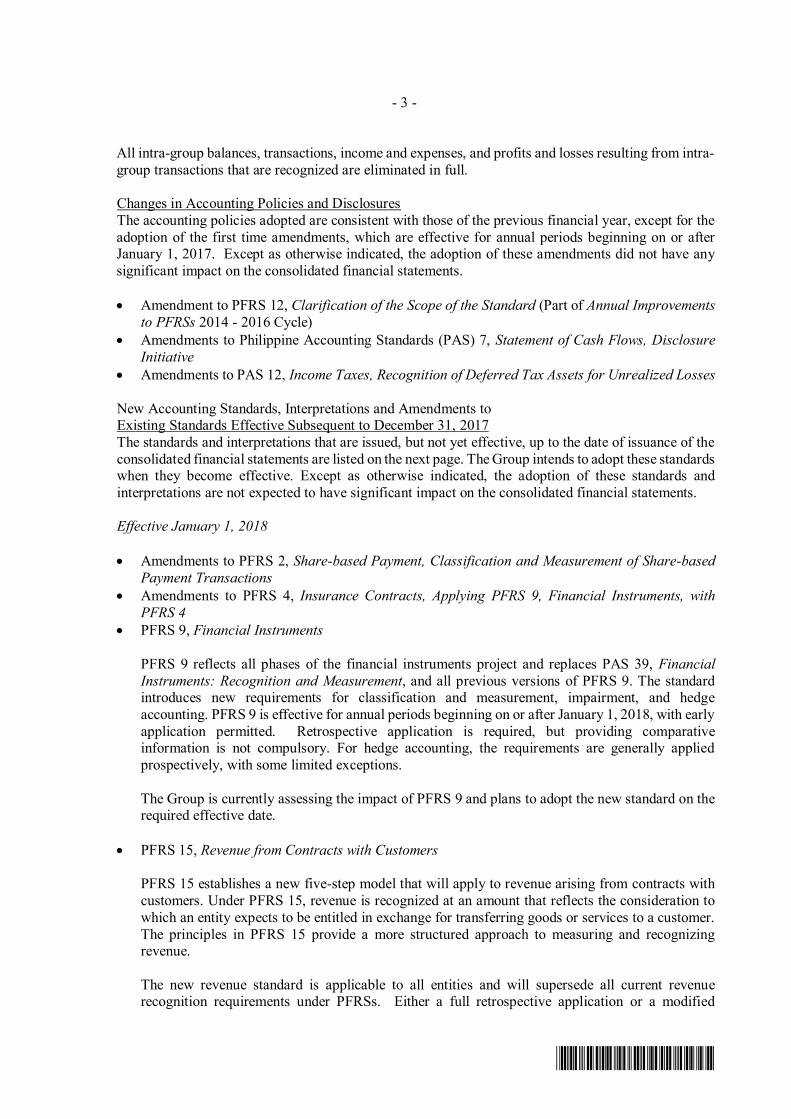
- 3 -
*SGVFS029391*
All intra-group balances, transactions, income and expenses, and profits and losses resulting from intra-group transactions that are recognized are eliminated in full.
Changes in Accounting Policies and DisclosuresThe accounting policies adopted are consistent with those of the previous financial year, except for theadoption of the first time amendments, which are effective for annual periods beginning on or afterJanuary 1, 2017. Except as otherwise indicated, the adoption of these amendments did not have anysignificant impact on the consolidated financial statements.
· Amendment to PFRS 12, Clarification of the Scope of the Standard (Part of Annual Improvementsto PFRSs 2014 - 2016 Cycle)
· Amendments to Philippine Accounting Standards (PAS) 7, Statement of Cash Flows, DisclosureInitiative
· Amendments to PAS 12, Income Taxes, Recognition of Deferred Tax Assets for Unrealized Losses
New Accounting Standards, Interpretations and Amendments toExisting Standards Effective Subsequent to December 31, 2017The standards and interpretations that are issued, but not yet effective, up to the date of issuance of theconsolidated financial statements are listed on the next page. The Group intends to adopt these standardswhen they become effective. Except as otherwise indicated, the adoption of these standards andinterpretations are not expected to have significant impact on the consolidated financial statements.
Effective January 1, 2018
· Amendments to PFRS 2, Share-based Payment, Classification and Measurement of Share-basedPayment Transactions
· Amendments to PFRS 4, Insurance Contracts, Applying PFRS 9, Financial Instruments, withPFRS 4
· PFRS 9, Financial Instruments
PFRS 9 reflects all phases of the financial instruments project and replaces PAS 39, FinancialInstruments: Recognition and Measurement, and all previous versions of PFRS 9. The standardintroduces new requirements for classification and measurement, impairment, and hedgeaccounting. PFRS 9 is effective for annual periods beginning on or after January 1, 2018, with earlyapplication permitted. Retrospective application is required, but providing comparativeinformation is not compulsory. For hedge accounting, the requirements are generally appliedprospectively, with some limited exceptions.
The Group is currently assessing the impact of PFRS 9 and plans to adopt the new standard on therequired effective date.
· PFRS 15, Revenue from Contracts with Customers
PFRS 15 establishes a new five-step model that will apply to revenue arising from contracts withcustomers. Under PFRS 15, revenue is recognized at an amount that reflects the consideration towhich an entity expects to be entitled in exchange for transferring goods or services to a customer.The principles in PFRS 15 provide a more structured approach to measuring and recognizingrevenue.
The new revenue standard is applicable to all entities and will supersede all current revenuerecognition requirements under PFRSs. Either a full retrospective application or a modified

- 4 -
*SGVFS029391*
retrospective application is required for annual periods beginning on or after January 1, 2018. Earlyadoption is permitted. The Company plans to adopt the new standard on the required effective dateusing the modified retrospective application.
In addition, as the presentation and disclosure requirements in PFRS 15 are more detailed thanunder current PFRSs, the Company is currently assessing what necessary changes it needs to make onits current systems, internal controls, policies and procedures to enable the Company to collect and disclosethe required information.
The recognition and measurement requirements in PFRS 15 also apply to gains or losses on disposalof nonfinancial assets (such as items of property and equipment), when that disposal is not in theordinary course of business.
The Company is currently assessing the impact of this standard.
· Amendments to PAS 28, Measuring an Associate or Joint Venture at Fair Value (Part of AnnualImprovements to PFRSs 2014 - 2016 Cycle)
· Amendments to PAS 40, Investment Property, Transfers of Investment Property· Philippine Interpretation on International Financial Reporting Interpretations Committee
(IFRIC)-22, Foreign Currency Transactions and Advance Consideration
Effective beginning on or after January 1, 2019
· Amendments to PFRS 9, Prepayment Features with Negative Compensation· PFRS 16, Leases
Under the new standard, lessees will no longer classify their leases as either operating or financeleases in accordance with PAS 17, Leases. Rather, lessees will apply the single-asset model. Underthis model, lessees will recognize the assets and related liabilities for most leases on their balancesheets, and subsequently, will depreciate the lease assets and recognize interest on the leaseliabilities in their profit or loss. Leases with a term of 12 months or less or for which the underlyingasset is of low value are exempted from these requirements.
The accounting by lessors is substantially unchanged as the new standard carries forward theprinciples of lessor accounting under PAS 17. Lessors, however, will be required to disclose moreinformation in their financial statements, particularly on the risk exposure to residual value.
Entities may early adopt PFRS 16 but only if they have also adopted PFRS 15. When adoptingPFRS 16, an entity is permitted to use either a full retrospective or a modified retrospectiveapproach, with options to use certain transition reliefs. The Group is currently assessing the impactof adopting PFRS 16.
· Amendments to PAS 28, Long-term Interests in Associates and Joint Ventures· Philippine Interpretation on IFRIC-23, Uncertainty over Income Tax Treatments
Deferred effectivity· Amendments to PFRS 10 and PAS 28, Sale or Contribution of Assets between an Investor and its
Associate or Joint Venture

- 5 -
*SGVFS029391*
Summary of Accounting Policies
Cash and Cash EquivalentsCash includes cash on hand and with banks.
Cash equivalents are short-term, highly liquid investments that are readily convertible to knownamounts of cash with original maturities of three months or less from date of placements and that aresubject to an insignificant risk of change in value.
Short-term InvestmentsShort-term investments includes investments that the Group has made that is expected to be convertedinto cash within one year.
Fair Value MeasurementFair value is the price that would be received to sell an asset or paid to transfer a liability in an orderlytransaction between market participants at the measurement date. The fair value measurement is basedon the presumption that the transaction to sell the asset or transfer the liability takes place either:
· In the principal market for the asset or liability, or· In the absence of a principal market, in the most advantageous market for the asset or liability
The principal or the most advantageous market must be accessible to the Group. The fair value of anasset or a liability is measured using the assumptions that market participants would use when pricingthe asset or liability, assuming that market participants act in their economic best interest.
A fair value measurement of a non-financial asset takes into account a market participant’s ability togenerate economic benefits by using the asset in its highest and best use or by selling it to anothermarket participant that would use the asset in its highest and best use.
The Group uses valuation techniques that are appropriate in the circumstances and for which sufficientdata are available to measure fair value, maximizing the use of relevant observable inputs andminimizing the use of unobservable inputs.
All assets and liabilities for which fair value is measured or disclosed in the consolidated financialstatements are categorized within the fair value hierarchy, described as follows, based on the lowestlevel input that is significant to the fair value measurement as a whole:
· Level 1 - Quoted (unadjusted) market prices in active markets for identical assets or liabilities· Level 2 - Valuation techniques for which the lowest level input that is significant to the fair
value measurement is directly or indirectly observable· Level 3 - Valuation techniques for which the lowest level input that is significant to the fair
value measurement is unobservable
For assets and liabilities that are recognized in the consolidated financial statements on a recurringbasis, the Group determines whether transfers have occurred between Levels in the hierarchy byre-assessing categorization (based on the lowest level input that is significant to the fair valuemeasurement as a whole) at the end of each reporting period.
For the purpose of fair value disclosures, the Group has determined classes of assets and liabilities onthe basis of the nature, characteristics and risks of the asset or liability and the level of the fair valuehierarchy as explained above.

- 6 -
*SGVFS029391*
Current versus Noncurrent ClassificationThe Group presents assets and liabilities in the consolidated statement of financial position based oncurrent/non-current classification. An asset is current when it is:
· expected to be realized or intended to be sold or consumed in normal operating cycle;· held primarily for the purpose of trading;· expected to be realized within 12 months after the reporting period; or· cash or cash equivalent unless restricted from being exchanged or used to settle a liability for
at least 12 months after the reporting period.
All other assets are classified as noncurrent.
A liability is current when:
· it is expected to be settled in normal operating cycle;· it is held primarily for the purpose of trading;· it is due to be settled within 12 months after the reporting period; or· there is no unconditional right to defer the settlement of the liability for at least 12 months after the
reporting period
The Group classifies all other liabilities as noncurrent.
Deferred income tax assets and liabilities are classified as noncurrent assets and liabilities.
Financial InstrumentsDate of RecognitionFinancial instruments are recognized in the consolidated statement of financial position when the Groupbecomes a party to the contractual provisions of the instrument. The Group determines theclassification of its financial assets on initial recognition and, where allowed and appropriate,re-evaluates this designation at each reporting date.
All regular way purchases and sales of financial assets are recognized on the settlement date. Regularway purchases or sales are purchases or sales of financial assets that require delivery of assets withinthe period generally established by regulation or convention in the marketplace.
Initial Recognition of Financial InstrumentsFinancial instruments are recognized initially at fair value of the consideration given (in the case of anasset) or received (in the case of a liability). Except for financial assets at fair value through profit orloss (FVPL), the initial measurement of financial assets includes transaction costs.
“Day 1” DifferenceWhere the transaction price in a non-active market is different from the fair value from other observablecurrent market transactions in the same instrument or based on a valuation technique whose variablesinclude only data from observable market, the Group recognizes the difference between the transactionprice and fair value (a “Day 1” difference) in profit or loss unless it qualifies for the recognition assome other type of asset. In cases where use is made of data which is not observable, the differencebetween the transaction price and model value is only recognized in profit or loss when the inputsbecome observable or when the instrument is derecognized. For each transaction, the Group determinesthe appropriate method of recognizing the amount of “Day 1” difference.

- 7 -
*SGVFS029391*
Classification of Financial InstrumentsFinancial instruments are classified as liabilities or equity in accordance with the substance of thecontractual arrangement. Interest, dividends, gains and losses relating to a financial instrument or acomponent that is a financial liability are reported as expense or income. Distributions to holders offinancial instruments classified as equity are charged directly to equity, net of any related income taxbenefits.
Financial assets are further classified into the following categories: financial assets at FVPL, loans andreceivables, held-to-maturity (HTM) investments and AFS financial assets. Financial liabilities areclassified as financial liabilities at FVPL or other financial liabilities.
The classification depends on the purpose for which the instruments are acquired and whether they arequoted in an active market. Management determines the classification at initial recognition and, whereallowed and appropriate, re-evaluates this classification at every reporting date.
The Group has no financial assets or liabilities at FVPL and HTM as of December 31, 2017 and 2016.
Loans and ReceivablesLoans and receivables are non-derivative financial assets with fixed or determinable payments that arenot quoted in an active market. After initial measurement, loans and receivables are subsequentlycarried at amortized cost using the effective interest rate, less any allowance for impairment. Amortizedcost is calculated taking into account any discount or premium on acquisition and includes fees that areintegral part of the effective interest and transaction costs. Gains and losses are recognized in profit orloss when the loans and receivables are derecognized or impaired, as well as through the amortizationprocess. Loans and receivables are included in current assets if maturity is within 12 months from thereporting date. Otherwise, these are classified as noncurrent assets.
The Group’s loans and receivables consist of cash and cash equivalents, receivables (excludingadvances to suppliers and contractors), due from a related party and refundable deposits.
AFS Financial AssetsAFS financial assets include equity investments and debt securities. Equity investments classified asAFS are those which are neither classified as held for trading nor designated at FVPL. Debt securitiesunder this category are those that are intended to be held for an indefinite period of time and that maybe sold in response to needs for liquidity or in response to changes in market conditions.
After initial measurement, AFS financial assets are subsequently measured at fair value with unrealizedgains or losses recognized as other comprehensive income in “Unrealized valuation gains (losses) onAFS financial assets” until the investment is derecognized, at which time the cumulative gain or loss istransferred to other income (expenses), or determined to be impaired, at which time the cumulative lossis recognized in profit or loss as other expenses. Interest earned while holding AFS financial assets isreported as interest income using the effective interest method.
The Group evaluates its AFS financial assets whether the ability and intention to sell them in the nearterm is appropriate. When the Group is unable to trade these financial assets due to inactive marketsand management’s intent to do significantly changes in the foreseeable future, the Group may elect toreclassify these financial assets. Reclassification to loans and receivables is permitted when thefinancial asset meets the definition of loans and receivables and has the intent and ability to hold theseassets for the foreseeable future or maturity. Reclassification to the HTM category is permitted onlywhen the entity has the ability and intent to hold the financial asset accordingly until maturity.
- 8 -
*SGVFS029391*
For a financial asset reclassified out of the AFS category, the fair value carrying amount at the date ofreclassification becomes its new amortized cost and any previous gain or loss on the asset that has beenrecognized in other comprehensive income is amortized to profit or loss over the remaining life of theinvestment using effective interest method. Any difference between the new amortized cost and thematurity amount is also amortized over the remaining life of the asset using the effective interestmethod. If the asset is subsequently determined to be impaired, then the amount recorded in othercomprehensive income is reclassified to profit or loss.
The Group’s AFS financial assets consist of equity shares and golf club shares.
Other Financial LiabilitiesOther financial liabilities pertain to issued financial instruments or their components that are notclassified or designated at FVPL and contain contractual obligations to deliver cash or another financialasset to the holder or to settle the obligation other than by the exchange of a fixed amount of cash oranother financial asset for a fixed number of own equity shares.
The components of issued financial instruments that contain both liability and equity elements areaccounted for separately, with the equity component being assigned the residual amount after deductingfrom the instrument as a whole the amount separately determined as the fair value of the liabilitycomponent on the date of issue.
This category includes loans and borrowings which are initially recognized at fair value of theconsideration received less directly attributable transaction costs. After initial recognition, interest-bearing loans and borrowings are subsequently measured at amortized cost using the effective interestmethod. Gains or losses are recognized in profit or loss when the liabilities are derecognized, as wellas through the amortization process.
The Group’s other financial liabilities consist of accounts payable and other liabilities, excluding taxespayable to government agencies.
Impairment of Financial AssetsAn assessment is made at each reporting date to determine whether there is objective evidence that aspecific financial asset may be impaired. A financial asset or a group of financial assets is deemed tobe impaired if, and only if, there is objective evidence of impairment as a result of one or more eventsthat occurred after the initial recognition of the asset (an incurred “loss event”) and that loss event (orevents) has an impact on the estimated future cash flows of the financial asset or the group of financialassets that can be reliably estimated.
Evidence of impairment may include indications that the contracted parties or a group of contractedparties is experiencing significant financial difficulty, default or delinquency in interest or principalpayments, the probability that they will enter bankruptcy or other financial reorganization, and whereobservable data indicate that there is measurable decrease in the estimated future cash flows such aschanges in arrears or economic conditions that correlate with defaults.
Financial Assets Carried at Amortized CostThe Group first assesses whether objective evidence of impairment exists individually for financialassets that are individually significant, and collectively for financial assets that are not individuallysignificant. If it is determined that no objective evidence of impairment exists for an individuallyassessed financial asset, whether significant or not, the asset is included in a group of financial assetswith similar credit risk characteristics and that group of financial assets is collectively assessed forimpairment. Assets that are individually assessed for impairment and for which an impairment loss isor continues to be recognized are not included in the collective assessment of impairment.

- 9 -
*SGVFS029391*
If there is objective evidence that an impairment loss on loans and receivables carried at amortized costhas been incurred, the amount of the loss is measured as the difference between the asset’s carryingamount and the present value of estimated future cash flows (excluding future credit losses that havenot been incurred) discounted at the financial asset’s original effective interest rate (the effectiveinterest rate computed at initial recognition). If a loan has a variable interest rate, the discount rate formeasuring any impairment loss is the current effective interest rate. The carrying amount of the assetshall be reduced either directly or through the use of an allowance account. The amount of the loss isrecognized in profit or loss.
If, in a subsequent period, the amount of the impairment loss decreases and the decrease can be relatedobjectively to an event occurring after the impairment was recognized, the previously recognizedimpairment loss is reversed. Any subsequent reversal of an impairment loss is recognized in profit orloss, to the extent that the carrying value of the asset does not exceed its amortized cost at the reversaldate.
AFS Financial Assets Carried at Fair ValueIn the case of equity investments, evidence of impairment would include a significant or prolongeddecline in fair value of investments below its cost. “Significant” is evaluated against the original costof the investment and “prolonged” against the period in which the fair value has been below its originalcost. Where there is evidence of impairment, the cumulative loss, measured as the difference betweenthe acquisition cost and the current fair value, less any impairment loss on that financial asset previouslyrecognized, is removed from other comprehensive income and recognized in profit or loss. Impairmentlosses on equity investments are not reversed through profit or loss. Increases in fair value afterimpairment are recognized directly in other comprehensive income.
In the case of debt instruments classified as available for sale, impairment is assessed based on the samecriteria as financial assets carried at fair value. However, the amount recorded for impairment is thecumulative loss measured as the difference between the amortized cost and the current fair value, lessany impairment loss on that investment previously recognized in profit or loss.
Future interest income continues to be accrued based on the reduced carrying amount of the asset, usingthe rate of interest used to discount the future cash flows for the purpose of measuring the impairmentloss. The interest income is recorded as part of finance income. If, in a subsequent year, the fair valueof a debt instrument increases and the increase can be objectively related to an event occurring afterthe impairment loss was recognized in profit or loss, the impairment loss is reversed through profit orloss.
Offsetting Financial InstrumentsFinancial assets and financial liabilities are offset and the net amount is reported in the consolidatedstatement of financial position if there is a currently enforceable legal right to set off the recognizedamounts and there is intention to settle on a net basis, or to realize the asset and settle the liabilitysimultaneously. The Group assesses that it has a currently enforceable right of offset if the right is notcontingent on a future event, and is legally enforceable in the normal course of business, event ofdefault, and event of insolvency or bankruptcy of the Group and all of the counterparties.
Derecognition of Financial Assets and LiabilitiesFinancial AssetsA financial asset (or, when applicable, a part of a financial asset or part of a group of similar financialassets) is derecognized when:
· the rights to receive cash flows from the asset have expired;

- 10 -
*SGVFS029391*
· the Group retains the right to receive cash flows from the asset, but has assumed an obligation topay them in full without material delay to a third party under a pass-through arrangement; or
· the Group has transferred its rights to receive cash flows from the asset and either (a) has transferredsubstantially all the risks and rewards of the asset, or (b) has neither transferred nor retainedsubstantially all the risks and rewards of the asset, but has transferred control of the asset.
When the Group has transferred its rights to receive cash flows from an asset and has neither transferrednor retained substantially all the risks and rewards of the asset nor transferred control of the asset, theasset is recognized to the extent of the Group’s continuing involvement in the asset. Continuinginvolvement that takes the form of a guarantee over the transferred asset is measured at the lower ofthe original carrying amount of the asset and the maximum amount of consideration that the Groupcould be required to pay.
Financial LiabilitiesA financial liability is derecognized when the obligation under the liability is discharged or cancelledor expired.
When an existing financial liability is replaced by another from the same lender on substantiallydifferent terms, or the terms of an existing liability are substantially modified, such an exchange ormodification is treated as a derecognition of the original liability and the recognition of a new liability,and the difference in the respective carrying amounts is recognized in profit or loss.
Real Estate InventoriesProperty acquired or being constructed for sale in the ordinary course of business, rather than to beheld for rental or capital appreciation, is held as inventory and is measured at the lower of cost and netrealizable value (NRV).
Cost includes:· Cost of land· Amounts paid to contractors for construction· Planning and design costs, costs of site preparation, professional fees, property transfer taxes,
construction overheads and other related costs
NRV is the estimated selling price in the ordinary course of the business, based on market prices at thereporting date, less estimated costs of completion and the estimated costs of sale. The amount of anywrite-down of inventories to NRV and all losses of inventories are recognized in profit or loss in theyear the write-down or loss occurs.
The cost of inventory recognized in profit or loss on disposal is determined with reference to the specificcosts incurred on the property sold and an allocation of any non-specific costs. The total costs areallocated pro-rata based on the relative size of the property sold.
Repossessed InventoriesRepossessed inventories represent the acquisition costs of properties sold but subsequently reacquiredby the Group due to buyer’s default on payment of monthly amortization. These are measured at fairvalue, which is considered as the properties’ deemed cost as at reacquisition date. Any resulting gainor loss is credited or charged to “Other income” in profit or loss.
PrepaymentsPrepayments are carried at cost and are amortized on a straight-line basis over the period of expectedusage, which is equal to or less than 12 months.

- 11 -
*SGVFS029391*
Advances to Suppliers and ContractorsAdvances to suppliers and contractors represent advance payments on services to be incurred inconnection with the Group’s operations. Advances to suppliers and contractors are recognized under“Prepayments and other current assets” account in the consolidated statement of financial position.These are charged to expense in profit or loss, or capitalized to real estate inventories in theconsolidated statement of financial position, as appropriate, when the services are rendered, which isnormally within 12 months.
Creditable Withholding taxes (CWT)CWTs are amounts withheld from income subject to expanded withholding taxes. CWTs can beutilized as payment for income taxes provided that these are properly supported by certificates ofcreditable tax withheld at source, subject to the rules on Philippine income taxation. CWTs which areexpected to be utilized as payment for income taxes within 12 months are classified as current assets.Otherwise, these are classified as other noncurrent asset. CWTs are classified in the “Prepayments andother current assets” account in the consolidated statement of financial position.
Value-added Tax (VAT)Revenues, expenses, and assets are recognized net of the amount of VAT, if applicable. When VATfrom sales of goods and/or services (output VAT) exceeds VAT passed on from purchases of goods orservices (input VAT), the excess is recognized as payable in the consolidated statement of financialposition. When VAT passed on from purchases of goods or services (input VAT) exceeds from salesof goods and/or services (output VAT), the excess is recognized as an asset in the consolidatedstatement of financial position to the extent of the recoverable amount.
The input VAT recoverable from the taxation authority is included as part of “Prepayments and othercurrent assets” or “Other noncurrent asset”, while output VAT payable to the taxation authority isincluded as part of “Accounts payable and other liabilities” accounts in the consolidated statement offinancial position.
Property and EquipmentProperty and equipment are stated at cost less accumulated depreciation and amortization and anyimpairment losses.
The initial cost of property and equipment comprises its purchase price including, import duties,nonrefundable purchase taxes and any directly attributable costs of bringing the asset to its workingcondition and location for its intended use. Such cost includes the cost of replacing part of suchequipment when the recognition criteria are met. Expenditures incurred after the property andequipment have been put into operation, such as repairs and maintenance, are normally charged toincome in the period in which the costs are incurred. In situations where it can be clearly demonstratedthat the expenditures have resulted in an increase in the future economic benefits expected to beobtained from the use of an item of property and equipment beyond its originally assessed standard ofperformance, the expenditures are capitalized as an additional cost of property and equipment.
Depreciation commences when an asset is in the location and condition capable of being operated inthe manner intended by management. Depreciation and amortization are computed on a straight-linebasis over the estimated useful lives of the assets, except for leasehold improvements which areamortized on a straight-line basis over the term of the lease or the estimated lives of the improvements,whichever is shorter, as follows:
Asset Type Number of yearsBuilding 20Office furniture and equipment 1-3Transportation equipment 5

- 12 -
*SGVFS029391*
Leasehold improvements are amortized on a straight-line basis over the term of the lease or theestimated lives of the improvements except for, whichever is shorter.
Depreciation ceases at the earlier of the date that the asset is classified as held for sale (or included ina disposal group that is classified as held for sale) in accordance with PFRS 5, Non-current Assets Heldfor Sale and Discontinued Operations, and the date that the asset is derecognized.
The estimated useful lives and depreciation and amortization methods are reviewed periodically toensure that the periods and method of depreciation and amortization are consistent with the expectedpattern of economic benefits from items of property and equipment.
An item of property and equipment is derecognized upon disposal or when no future economic benefitsare expected from its use or disposal. Any gain or loss arising on derecognition of the asset (calculatedas the difference between the net disposal proceeds and the carrying amount of the asset) is included inprofit or loss in the year the asset is derecognized. Fully depreciated items are retained as property andequipment until these are no longer in use.
Impairment of Nonfinancial AssetsThe Group assesses at each reporting date whether there is an indication that nonfinancial assets maybe impaired. If any such indication exists, or when annual impairment testing for an asset is required,the Group estimates the asset’s recoverable amount. An asset’s recoverable amount is the higher of anasset’s or cash-generating unit’s fair value less costs to sell and its value-in-use and is determined foran individual asset, unless the asset does not generate cash inflows that are largely independent of thosefrom other assets or groups of assets. Where the carrying amount of an asset exceeds its recoverableamount, the asset is considered impaired and is written down to its recoverable amount. In assessingvalue-in-use, the estimated future cash flows are discounted to their present value using a discount ratethat reflects current market assessments of the time value of money and the risks specific to the asset.In determining fair value less costs to sell, an appropriate valuation model is used. These calculationsare corroborated by valuation multiples or other available fair value indicators. Impairment losses fromcontinuing operations are recognized in profit or loss.
For nonfinancial assets excluding goodwill, an assessment is made at each reporting date as to whetherthere is any indication that previously recognized impairment losses may no longer exist or may havedecreased.
If such indication exists, the Group makes an estimate of recoverable amount. A previously recognizedimpairment loss is reversed only if there has been a change in the estimates used to determine the asset’srecoverable amount since the last impairment loss was recognized. If that is the case, the carryingamount of the asset is increased to its recoverable amount. That increased amount cannot exceed thecarrying amount that would have been determined, net of depreciation and amortization, had noimpairment loss been recognized for the asset in prior years. Such reversal is recognized in profit orloss.
Common StockThe Group has issued common stocks that are classified as equity. Common stock is measured at parvalue for all shares issued.
When the shares are sold at premium, the excess of the proceeds over the par value is credited to“Additional paid-in capital” account. Direct costs incurred related to equity issuance are chargeable to“Additional paid-in capital” account. If additional paid-in capital is not sufficient, the excess is chargedagainst retained earnings.

- 13 -
*SGVFS029391*
Subscription receivable pertains to the uncollected portion of the subscribed shares.
Retained EarningsThe amount included in retained earnings includes profit (loss) attributable to the Group’s stockholdersand reduced by dividends. Dividends are recognized as a liability and deducted from equity when theyare approved by the Group’s stockholders. Interim dividends are deducted from equity when they arepaid. Dividends for the year that are approved after the reporting date are dealt with as an event afterthe reporting date. Retained earnings may also include effect of changes in accounting policy as maybe required by the standard’s transitional provisions.
Appropriated retained earnings represent that portion which has been restricted, and therefore, notavailable for dividend declaration. Unappropriated retained earnings represent that portion which canbe declared as dividends to stockholders.
Other Comprehensive Income (OCI)OCI comprises items of income and expenses, including reclassification adjustments, which are notrecognized in profit or loss as required or permitted by other standards.
Treasury StockOwn equity instruments which are reacquired (treasury stock) are recognized at cost and deducted fromequity. No gain or loss is recognized in the consolidated statement of comprehensive income on thepurchase, sale, issue or cancellation of the Group’s own equity instruments. Any difference in thecarrying amount and the consideration, if reissued, is recognized in additional paid-in capital. Votingrights related to treasury stock are nullified for the Group and no dividends are allocated to themrespectively. When the stocks are retired, the common stock account is reduced by its par value andthe excess of cost over par value upon retirement is debited to additional paid-in capital when the shareswere issued and to retained earnings for the remaining balance.
Revenue and Cost RecognitionRevenue is recognized to the extent that it is probable that the economic benefits will flow to the Groupand the revenue can be reliably measured. The Group assesses its revenue arrangements againstspecific criteria in order to determine if it is acting as principal or agent. The Group has concluded thatit is acting as a principal in all of its revenue arrangements. The following specific revenue recognitioncriteria should also be met before revenue is recognized.
Real Estate SalesThe Group assesses whether it is probable that the economic benefits will flow to the Group when thesales prices are collectible. Collectability of the sales price is demonstrated by the buyer’s commitmentto pay, which in turn is supported by substantial initial and continuing investments that give the buyera stake in the property sufficient that the risk of loss through default motivates the buyer to honor itsobligation to the seller. Collectability is also assessed by considering factors such as the credit standingof the buyer, age and location of the property.
The percentage-of-completion (POC) method is used to recognize income from sale of projects wherethe Group has material obligations under the sales contract to complete the project after the property issold. The Group start recognizing income under POC when the equitable interest has been transferredto the buyer, construction is beyond the preliminary stage (i.e., engineering, design work, constructioncontracts execution, site clearance and preparation, excavation and the building foundation arefinished), and the costs incurred or to be incurred can be measured reliable. Under this method, revenueis recognized as the related obligations are fulfilled, measured principally on the basis of actual costsincurred to date over the estimated total costs to complete the project.
- 14 -
*SGVFS029391*
When a sale of real estate does not meet the requirements for income recognition, the sale is accountedfor under the deposit method. Under this method, revenue is not recognized and the receivable fromthe buyer is not recorded. The real estate inventory continues to be reported in the Group’s consolidatedstatement of financial position as part of real estate inventories and the deposit as part of as “Customers’deposits” included under the “Accounts payable and other liabilities” account in the consolidatedstatement of financial position.
Cost of Real Estate SalesCost of real estate sales is recognized consistent with the revenue recognition method applied. Cost ofsubdivision land and condominium units sold before the completion of the development is determinedon the basis of the acquisition cost of the land plus its full development costs, which include estimatedcosts for future development works, as determined by the Group’s in-house technical staff.
The cost of real estate sales recognized in profit or loss on disposal is determined with reference to thespecific costs incurred on the property, allocated to saleable area based on relative size and takes intoaccount the POC used for revenue recognition purposes.
Any changes in estimated development costs used in the determination of the amount of revenue andcost are recognized in profit or loss in the period in which the change is made.
Interest IncomeFor all financial instruments measured at amortized cost and interest bearing financial assets classifiedas available for sale, interest income is recorded using the effective interest rate (EIR). EIR is the ratethat exactly discounts the estimated future cash payments or receipts over the expected life of thefinancial instrument or a shorter period, where appropriate, to the net carrying amount of the financialasset or liability.
Dividend IncomeDividend income is recognized when the Group’s right to receive the payment is established, usuallyupon declaration of the dividends.
Gain on Sale of AFS Financial AssetsRealized gain or loss on sale of AFS financial assets is recognized in profit or loss when the Groupdisposes its AFS financial assets.
Other IncomeOther income pertains to the gain arising from forfeiture or cancellation of prior years’ real estate sales.
Expense RecognitionExpenses are decreases in economic benefits during the accounting period in the form of outflows ordepletions of assets or incurrences of liabilities that result in decreases in equity, other than thoserelating to distributions to equity participants.
General and Administrative ExpensesExpenses incurred in the general administration of day-to-day operation of the Group are generallyrecognized when the service is used or the expense arises.
Sales and Marketing ExpensesExpenses incurred in the direct selling and marketing activities are generally recognized when theservice is incurred or the expense arises.

- 15 -
*SGVFS029391*
Commission ExpenseCommissions paid to sales or marketing agents on the sale of pre-completed real estate units aredeferred when recovery is reasonably expected and are charged to expense in the period in which therelated revenue is recognized as earned. Accordingly, when the POC method is used, commissions arelikewise charged to expense in the period the related revenue is recognized. Commission expense isincluded in the “Sales and marketing expenses” account in the consolidated statement of comprehensiveincome. Commission expense incurred but not yet paid as of reporting date is presented as part of“Accounts payable and other liabilities” in the consolidated statement of financial position.
Retirement Benefits CostThe Group recognizes the net defined benefit liability or asset which is the aggregate of the presentvalue of the defined benefit obligation at the end of the reporting period reduced by the fair value ofplan assets (if any), adjusted for any effect of limiting a net defined benefit asset to the asset ceiling.The asset ceiling is the present value of any economic benefits available in the form of refunds fromthe plan or reductions in future contributions to the plan.
The cost of providing benefits under the defined benefit retirement plan is determined using theprojected unit credit method.
Retirement benefits cost comprise the following:· Service cost· Net interest on the net defined benefit liability or asset· Re-measurements of net defined benefit liability or asset
Service costs which include current service costs, past service costs and gains or losses on non-routinesettlements are recognized as expense in profit or loss. Past service costs are recognized when planamendment or curtailment occurs. These amounts are calculated periodically by independent qualifiedactuaries.
Net interest on the net defined benefit liability or asset is the change during the period in the net definedbenefit liability or asset that arises from the passage of time which is determined by applying thediscount rate based on government bonds to the net defined benefit liability or asset.
Net interest on the net defined benefit liability or asset is recognized as an expense or income in profitor loss.
Re-measurements comprising actuarial gains and losses, return on plan assets and any change in theeffect of the asset ceiling (excluding net interest on defined benefit liability) are recognized immediatelyin the consolidated statement of financial position with a corresponding debit or credit to retainedearnings through OCI in the period in which they occur. Re-measurements are not reclassified to theconsolidated statement in comprehensive loss in subsequent periods.
Income TaxesCurrent Income TaxCurrent income tax assets and liabilities for the current and prior periods are measured at the amountexpected to be recoverable from or paid to the taxation authorities. The tax rates and tax laws used tocompute the amount are those that are enacted or substantively enacted at the reporting date.
Current income tax for current and prior periods shall, to the extent unpaid, be recognized as a liabilityand is presented as “Income tax payable” account in the consolidated statement of financial position.If the amount already paid in respect of current and prior periods exceeds the amount due for those

- 16 -
*SGVFS029391*
periods, the excess shall be recognized as an asset and is presented as part of “Prepayments and othercurrent assets” account in the consolidated statement of financial position.
Deferred Income TaxDeferred income tax is provided, using the balance sheet liability method, on all temporary differencesat the reporting date between the tax bases of assets and liabilities and their carrying amounts forfinancial reporting purposes.
Deferred income tax liabilities are recognized for all taxable temporary differences. Deferred incometax assets are recognized for all deductible temporary differences, carryforward benefits of unused taxcredits from excess minimum corporate income tax (MCIT) over the regular corporate income tax(RCIT) and unused net operating loss carryover (NOLCO), to the extent that it is probable that sufficientfuture taxable profits will be available against which the deductible temporary differences andcarryforward benefits of unused MCIT and unused NOLCO can be utilized before their expiration.
The carrying amount of deferred tax assets is reviewed at each reporting date and reduced to the extentthat it is no longer probable that sufficient taxable profit will be available to allow all or part of thedeferred tax assets to be utilized. Unrecognized deferred tax assets are reassessed at each reportingdate and are recognized to the extent that it has become probable that future taxable profit will allowthe deferred tax assets to be recovered.
Deferred income tax assets and liabilities are measured at the tax rates that are expected to apply to theperiod when the asset is realized or the liability is settled based on tax rates (and tax laws) that havebeen enacted or substantively enacted at the reporting date.
Deferred income tax assets and deferred tax liabilities are offset, if a legally enforceable right exists toset off current tax assets against current income tax liabilities and the deferred taxes relate to the sametaxable entity and the same taxation authority.
Deferred income tax relating to items recognized directly in equity is recognized in equity and not inprofit or loss. Deferred tax items are recognized in correlation to the underlying transaction either inother comprehensive income or directly in equity.
Basic/Diluted Earnings (Loss) Per ShareBasic earnings (loss) per share is computed by dividing net income (loss) for the year attributable toequity holders of the Group by the weighted average number of common shares outstanding during theyear, after giving retroactive effect to any stock dividends or stock splits, if any, declared during theyear.
Diluted earnings (loss) per share is computed in the same manner, with the net income (loss) for theyear attributable to equity holders of the Group and the weighted average number of common sharesoutstanding during the year, adjusted for the effect of all dilutive potential common shares.
Foreign Currency-denominated TransactionsTransactions in foreign currencies are initially recorded in the functional currency rate ruling at the dateof the transaction. Outstanding monetary assets and monetary liabilities denominated in foreigncurrencies are restated using the rate of exchange at the reporting date. Foreign currency gains or lossesare recognized in profit or loss.
- 17 -
*SGVFS029391*
LeasesThe determination of whether an arrangement is, or contains a lease is based on the substance of thearrangement at inception date and requires an assessment of whether the fulfillment of the arrangementis dependent on the use of a specific asset or assets and the arrangement conveys a right to use the asset.A reassessment is made after inception of the lease only if one of the following applies:
a. there is a change in contractual terms, other than a renewal or extension of the arrangement;b. a renewal option is exercised or extension granted, unless that term of the renewal or extension was
initially included in the lease term;c. there is a change in the determination of whether fulfillment is dependent on a specified asset; ord. there is a substantial change to the asset.
Where a reassessment is made, lease accounting shall commence or cease from the date when thechange in circumstances gave rise to the reassessment for scenarios (a), (c) or (d) above, and at the dateof renewal or extension period for scenario (b).
Leases where the lessor retains substantially all the risks and rewards of ownership are classified asoperating leases. Operating lease payments are recognized as an expense in the Group’s profit or losson a straight-line basis over the lease term. When an operating lease is terminated before the leaseperiod has expired, any payment required to be made to the lessor by way of penalty is recognized.
ProvisionsProvisions are recognized when the Group has a present obligation (legal or constructive) as a result ofa past event, it is probable that an outflow of resources embodying economic benefits will be requiredto settle the obligation and a reliable estimate can be made of the amount of the obligation. If the effectof the time value of money is material, provisions are determined by discounting the expected futurecash flows at a pre-tax rate that reflects current market assessment of the time value of money and,where appropriate, the risks specific to the liability. Where discounting is used, the increase in theprovision due to the passage of time is recognized as an interest expense. Provisions are reviewed ateach reporting date and adjusted to reflect the current best estimate.
ContingenciesContingent liabilities are not recognized in the consolidated financial statements. They are disclosedunless the possibility of an outflow of resources embodying economic benefits is remote. Contingentassets are not recognized in the consolidated financial statements but are disclosed in the notes toconsolidated financial statements when an inflow of economic benefits is probable.
Events After the Reporting DatePost year-end events that provide additional information about the Group’s position at the reportingdate (adjusting events) are reflected in the consolidated financial statements when material. Post year-end events that are not adjusting events are disclosed in the notes to consolidated financial statementswhen material.
3. Significant Accounting Judgments, Estimates and Assumptions
The consolidated financial statements prepared in accordance with PFRS requires management to makejudgments, estimates and assumptions that affect amounts reported in the consolidated financialstatements and related notes. The judgments, estimates and assumptions used in the consolidatedfinancial statements are based upon management’s evaluation of relevant facts and circumstances as ofthe date of the consolidated financial statements. Actual results could differ from such estimates.

- 18 -
*SGVFS029391*
JudgmentsRevenue RecognitionSelecting the appropriate revenue recognition method for particular real estate transaction requirescertain judgments based on the following, among others:
· Buyer’s continuing commitment to the sales agreementCollectability of the sales price is demonstrated by the buyer’s commitment to pay, which in turnis supported by substantial initial and continuing investments that gives the buyer a sufficient stakein the property that risk of loss through default motivates the buyer to honor his obligation.Collectability is also assessed by considering factors such as the credit standing of the buyer, age,and location of the property.
For sale of real estate properties, in determining whether the sales prices are collectible, the Groupconsiders that initial and continuing investments by the buyer of about 25% would demonstrate thebuyer’s commitment to pay.
· Stage of completion of the projectThe Group commences the recognition of revenue from sale of uncompleted projects where thePOC method is used when the POC, as determined by project engineers employed by the Group,is already beyond the preliminary stage (i.e., engineering, design work, construction contractsexecution, site clearance and preparation, excavation and the house unit foundation are finished).
Operating Leases - The Group as LesseeThe Group has entered into a lease for its administrative office location. The Group has determinedthat all the significant risks and benefits of ownership of these properties remain with the lessors.Accordingly, these leases are accounted for as operating leases.
Estimates and AssumptionsThe key estimates concerning the future and other key sources of estimation uncertainty at reportingdate, that have a significant risk of causing a material adjustment to the carrying amounts of assets andliabilities within the next financial year are discussed below.
Revenue and Cost RecognitionThe Group’s revenue recognition policies require management to make use of estimates andassumptions that may affect the reported amounts of revenue and costs. The Group’s revenue and costfrom real estate sales recognized based on the POC is determined based on actual costs incurred to dateover the estimated total costs to complete the project reconciled with the project engineer’s judgmentand estimates on the physical portion of contract work done if the development if beyond thepreliminary stage.
Real estate sales and cost of real estate sales amounted to P=64.9 million and P=33.4 million in 2017,P=156.8 million and P=113.7 million in 2016 and P=250.3 million and P=196.0 million in 2015, respectively.
Estimation of Allowance for Impairment of Loans and ReceivablesThe level of allowance for loans and receivables is evaluated by management based on past collectionhistory and other factors which include, but are not limited to the length of the Group’s relationshipwith the customer, the customer’s payment behavior and known market factors that affect thecollectability of the accounts.
There are no allowance for impairment losses on loans and receivables as of December 31, 2017 and2016. Receivables and due from a related party amounted to P=119.5 million and P=154.7 million as ofDecember 31, 2017 and 2016, respectively (see Notes 6 and 18).

- 19 -
*SGVFS029391*
Measurement of Net Realizable Value of Real estate InventoriesThe Group adjusts the cost of its real estate inventories to NRV based on its assessment of therecoverability of the inventories. NRV in respect of real estate inventories under construction isassessed with reference to market prices at the reporting date for similar completed property, lessestimated costs to complete construction and less estimated costs to sell. The amount and timing ofrecorded expenses for any period would differ if different judgments were made or different estimateswere utilized.
Real estate inventories at cost amounted to P=1,092.9 million and P=1,082.1 million as ofDecember 31, 2017 and 2016, respectively. In 2017 and 2016, the Group assessed that the NRV of realestate inventories is higher than cost, hence the Group did not recognize any losses on write down ofreal estate inventories (see Note 7).
Recognition of Deferred Income Tax AssetsThe Group reviews the carrying amounts of deferred income tax assets at each financial reporting dateand reduces the amounts to the extent that they are no longer probable that sufficient taxable profit willbe available to allow all or part of the deferred income tax assets to be utilized. However, there is noassurance that the Group will generate sufficient taxable income to allow all or part of its deferredincome tax assets to be utilized.
The Group recognized deferred income tax asset amounting to P=5.6 million and P=11.2 million as ofDecember 31, 2017 and 2016, respectively (see Note 17).
4. Cash and Cash Equivalents
2017 2016Cash on hand and in banks P=47,512,928 P=59,792,734Cash equivalents 67,519,482 297,365,332
P=115,032,410 P=357,158,066
Cash in banks earn interest at the respective bank deposit rates. Cash equivalents are made for varyingperiods of up to three months depending on the immediate cash requirements of the Group and earninterest at the respective short-term deposit rates. Interest income earned amounted to P=1.7 million,P=2.6 million and P=2.1 million in 2017, 2016 and 2015, respectively.
5. Short-Term Investments
In 2017, the Parent Company acquired investments in government securities bearing interest rangingfrom 2.85% to 3.00%, maturing in 2018. Interest earned during the year amounted to P=3.3 million.

- 20 -
*SGVFS029391*
6. Receivables
2017 2016Installment contract receivables P=74,438,231 P=116,819,864Advances to:
Officers and employees 19,792,193 19,258,164Suppliers and contractors 6,153,014 6,201,177Agents 1,031,968 1,056,607
Other receivables 17,904,353 11,148,882119,319,759 154,484,694
Less current portion of receivables (57,477,913) (75,635,832)P=61,841,846 P=78,848,862
a. Installment contract receivables arises from sale of real estate and is collectible in monthly installmentsover a period ranging from one to 10 years which bears interest rates of 14.0% to 16.0% in 2017 and2016 computed on the diminishing balance.
Interest income earned amounted to P=7.9 million, P=10.6 million and P=2.8 in 2017, 2016 and 2015,respectively.
b. Advances to officers and employees are noninterest-bearing and will generally be settled throughliquidation and salary deduction, respectively. These receivables will be settled within the nextfinancial year.
c. Advances to suppliers and contractors are payments made to suppliers as contracts with them generallyrequire advance payment. The amount will be applied as part of the full payment of the contractedprice.
d. Other receivables consists mostly of receivables from unit owners and Condominium Corporation.
7. Real Estate Inventories
2017 2016Condominium and residential units P=592,595,104 P=577,738,822Subdivision projects for development 340,795,837 334,782,960Lot inventory 159,478,083 169,599,814
1,092,869,024 1,082,121,596Less current portion of real estate inventories 904,056,020 895,840,042
P=188,813,004 P=186,281,554
A summary of the movement in real estate inventories is set out below:
2017 2016Balances at beginning of year P=1,082,121,596 P=1,111,283,626Development costs incurred (Note 24) 25,614,877 20,561,570Repossessed inventories 18,544,300 63,934,057Disposals recognized as cost of real estate sales (33,411,749) (113,657,657)
P=1,092,869,024 P=1,082,121,596

- 21 -
*SGVFS029391*
8. Prepayments and Other Current Assets
2017 2016Input VAT - net of noncurrent portion (Note 11) P=33,215,691 P=46,813,687Prepaid taxes 22,931,918 18,835,254Refundable deposits (Note 24) 2,772,036 2,687,786Others 104,258 53,553
P=59,023,903 P=68,390,280
Refundable deposits are composed of security deposits related to the Group’s lease agreement andutility deposits to Manila Electric Corporation.
9. AFS Financial Assets
2017 2016Shares of stock P=19,090,599 P=20,200,708Golf club shares 24,250,000 20,660,000Unit investment trust funds (UITF) 10,105,372 –
P=53,445,971 P=40,860,708
The Group’s AFS financial assets pertain to investments in shares of stock of various publicly-listedcompanies, golf club shares and UITF investments.
The fair values of the shares of stock are based on the quoted market price that is readily and regularlyavailable in the Philippine Stock Exchange. The price is indicative of actual market transactions on anarm’s length basis.
The fair value of quoted club share is determined by reference to published price quotation. The priceis indicative of actual market transactions on an arm’s length basis.
Dividend income earned from equity securities classified as “AFS financial assets” amounted toP=0.4 million in 2017 and P=0.3 million in 2016 and 2015, respectively.
In 2017, P=130.3 million UITF were redeemed. Gain on redemption of UITF amounted to P=0.3 million.
The rollforward of net changes in fair value of AFS financial assets during the years endedDecember 31 are as follows:
2017 2016Balances at beginning of year P=13,712,536 P=5,597,730Fair value adjustments, net of deferred income tax 994,354 8,114,806Unrealized valuation gains recycled to profit or loss (257,841) –Balances at end of year P=14,449,049 P=13,712,536

- 22 -
*SGVFS029391*
10. Property and Equipment
December 31, 2017
Land Building
OfficeFurniture and
EquipmentTransportation
EquipmentLeasehold
Improvements TotalCost
Balances at beginning of year P=16,336,217 P=18,734,059 P=9,453,520 P=13,762,035 P=5,499,981 P=63,785,812Additions – – 1,330,345 1,275,793 – 2,606,138Disposals – – (215,446) – – (215,446)
Balances at end of year 16,336,217 18,734,059 10,568,419 15,037,828 5,499,981 66,176,504Accumulated depreciation and
amortizationBalances at beginning of year – 4,471,145 8,964,331 13,762,035 1,905,684 29,103,195Depreciation and amortization
(Notes 13 and 14) – 936,702 465,674 63,790 955,900 2,422,066Disposals – – (215,446) – – (215,446)
Balances at end of year – 5,407,847 9,214,559 13,825,825 2,861,584 31,309,815Net book values P=16,336,217 P=13,326,212 P=1,353,860 P=1,212,003 P=2,638,397 P=34,866,689
December 31, 2016
Land Building
OfficeFurniture and
EquipmentTransportation
EquipmentLeasehold
Improvements TotalCost
Balances at beginning of year P=16,336,217 P=18,734,059 P=9,288,463 P=13,762,035 P=5,383,909 P=63,504,683Additions – – 165,057 – 116,072 281,129
Balances at end of year 16,336,217 18,734,059 9,453,520 13,762,035 5,499,981 63,785,812Accumulated depreciation and
amortizationBalances at beginning of year – 3,534,442 8,254,248 13,675,577 953,653 26,417,920Depreciation and amortization
(Notes 13 and 14) – 936,703 710,083 86,458 952,031 2,685,275 Balances at end of year – 4,471,145 8,964,331 13,762,035 1,905,684 29,103,195Net book values P=16,336,217 P=14,262,914 P=489,189 P=– P=3,594,297 P=34,682,617
As of December 31, 2017 and 2016, the cost of fully depreciated property and equipment amounted toP=22.1 million and P=20.2 million, respectively. These are retained in the records and still used by theParent Company until these are disposed or the Parent Company vacate the leased premises.
11. Other Noncurrent Asset
Other noncurrent asset consist of input VAT that is expected to be offset against output VAT in morethan one year. As of December 31, 2017 and 2016 deferred input VAT amounted to P=27.5 million andP=27.1 million, respectively.
12. Accounts Payable and Other Liabilities
2017 2016Customers’ deposits and unearned income P=72,696,975 P=51,037,088Accrued contractors’ payables 38,117,214 40,003,016Retention payables (Note 24) 6,579,480 7,278,248Accrued expenses 5,881,972 4,866,227Accounts payable - trade 4,187,366 4,876,900Government payables 814,775 6,143,980
P=128,277,782 P=114,205,459
- 23 -
*SGVFS029391*
a. Customers’ deposits and unearned income include collections received from buyers which (a) havenot met the revenue recognition criteria and/or (b) have met the revenue recognition criteria but thecollections received are greater than the recognized instalment contracts receivable based on thepercentage-of-completion.
b. Accounts payable includes billings of various suppliers and contractors for liabilities incurred inrelation to the project and office administrative functions. Accounts payable are noninterest-bearingwith payment terms which are dependent on the suppliers’ or contractors’ credit terms, which isgenerally 30 to 60 days.
c. Accrued contractors’ payables represent accruals for billings of various contractors in relation to theAnuva and Althea Project. These accruals are reclassified to accounts payable once billings areactually received.
d. Retention payables represent the amount retained by the Group as security for any defects and damageson the construction of Anala arising from or due to faulty workmanship and/or defective contractor-supplied materials before the final acceptance of the Anala and the payment of the last billing.Retention payable is expected to be settled within the next financial year.
e. Government payables consist of mandatory contributions and payments to the Social Security System,Philippine Health Insurance Corporation, and the Home Development Mutual Fund, withholding taxpayables and are remitted the month following the month of withholding.
13. General and Administrative Expenses
2017 2016 2015Personnel costs P=14,332,014 P=12,927,854 P=13,216,495Travel and transportation 6,162,977 8,333,946 7,152,471Interest, penalties and charges 5,100,832 4,300,000 425,284Taxes and licenses 4,800,610 4,402,618 6,176,227Professional fees 4,539,331 4,102,886 3,816,688Research and development expenses 3,237,382 2,894,414 4,033,140Rent and utilities (Note 24) 2,672,171 3,992,098 5,519,119Outside services 2,049,722 2,688,842 6,059,891Depreciation and amortization (Note 10) 2,417,031 2,604,688 2,075,998Telecommunications and postage 1,085,619 1,133,431 981,633Supplies 792,439 849,018 770,206Dues and subscription 790,151 825,475 1,118,053Repairs and maintenance 613,383 669,447 462,000Trainings and seminars 219,595 298,897 211,871Entertainment and representation 186,617 746,425 252,580Insurance 53,957 709,652 352,723Provision for impairment loss on AFS
financial assets – – 7,835,749Property management expense – 3,446,488 4,482,147Others 1,749,121 1,444,759 2,000,288
P=50,802,952 P=56,370,938 P=66,942,563
Others include bank charges and other miscellaneous costs.

- 24 -
*SGVFS029391*
Personnel costs consist of:
2017 2016 2015Salaries and wages P=12,355,838 P=11,029,065 P=11,278,801Short term employee benefits 1,432,438 1,337,596 1,430,630Retirement benefits cost (Note 16) 543,738 561,193 507,064
P=14,332,014 P=12,927,854 P=13,216,495
14. Sales and Marketing Expenses
2017 2016 2015Commissions and incentives P=8,365,312 P=4,830,254 P=18,073,326Product presentation 4,485,533 4,350,491 910,093Consultancy fees 7,268,606 2,958,462 6,599,886Rent and utilities (Note 24) 914,643 833,708 1,615,338Advertising 805,368 861,542 1,077,541Telecommunications and postage 334,330 243,899 70,261Travel and transportation 237,899 146,761 335,621Depreciation and amortization (Note 10) 5,035 80,587 268,877Others 38,934 35,189 22,839
P=22,455,660 P=14,340,893 P=28,973,782
Others include expenses from meetings, janitorial fees and other expenses directly attributable tosales and marketing.
15. Other Income - Net
2017 2016 2015Forfeited buyer deposits P=7,312,900 P=19,163,258 P=7,911,436Gain on repossession 4,170,772 15,398,166 5,428,035Penalty income and late payment charges 477,394 602,679 2,045,693Write-off of other assets (7,473,163) – –Others - net 900,261 5,705,123 712,900
P=5,388,164 P=40,869,226 P=16,098,064
a. Forfeited buyer deposits are recognized when the deposits from potential buyers are deemednonrefundable due to prescription of the period for entering into a contracted sale.
b. Gain on repossession represents the difference between the fair value of the repossessed inventoriesand the carrying value of the ICR and any amount refundable to the buyer at the date ofrepossession.
c. Penalty are additional fees imposed on customers due to their failure to make payments on time.
d. Others pertain to the reversal of long outstanding payables as the Company assessed that these willno longer be collected by the suppliers in 2016, among others.

- 25 -
*SGVFS029391*
16. Retirement Benefit Obligation
The Group has an unfunded, noncontributory defined benefit retirement plan which covers all of itsregular employees. RA No. 7641 (“Retirement Pay Law”), an act amending article 287 of PresidentialDecree No. 442 (“Labor Code of the Philippines”), requires a provision for retirement pay to qualifiedprivate sector employees in the absence of any retirement plan in the entity, provided, however, thatthe employee’s retirement benefits under any collective bargaining and other agreements shall not beless than those provided under the law. The law does not require minimum funding of the plan. Thelatest actuarial valuation report is as at December 31, 2017.
Retirement benefits cost recognized in the consolidated statements of comprehensive income are asfollows:
2017 2016 2015Current service cost P=380,962 P=382,704 P=316,836Interest cost 162,776 178,489 190,228
P=543,738 P=561,193 P=507,064
Amounts recognized in other comprehensive income pertaining to actuarial gain (loss) amounted to(P=29,453), P=96,525 and P=78,566, in 2017, 2016 and 2015, respectively.
Changes in the present value of the retirement benefit obligation are as follows:
2017 2016Beginning P=4,222,219 P=3,757,551Current service cost 380,962 382,704Interest cost 162,776 178,489Actuarial gain (loss) due to:
Experience adjustments 183,250 (58,447)Change in demographic assumptions (15,237) –Change in assumptions (138,560) (38,078)
Ending P=4,795,410 P=4,222,219
The principal assumptions as of used to determine retirement benefit obligations for the plan are shownbelow:
2017 2016Discount rate 4.30%-5.82% 3.60%-5.34%Future salary increase 3.00%-10.00% 3.00%-10.00%
The sensitivity analysis below has been determined based on reasonably possible changes of eachsignificant assumption on the defined benefit obligation, assuming all other assumptions were heldconstant:
December 31, 2017:
Increase (decrease) inbasis points (bps)
Effect on retirementbenefit obligation
Discount rate 100 bps (P=216,058)(100 bps) 250,785
Future salary increase rate 100 bps 245,848(100 bps) (216,237)

- 26 -
*SGVFS029391*
December 31, 2016:
Increase (decrease) inbasis points (bps)
Effect on retirementbenefit obligation
Discount rate 100 bps (P=182,446)(100 bps) 211,934
Future salary increase rate 100 bps 207,367(100 bps) (182,350)
The estimated weighted average duration of benefit payment is 17 years as of December 31, 2017 and2016.
Shown below is the maturity profile of the undiscounted benefit payments:
2017 2016Less than one year P=2,394,725 P=2,293,732More than one year to 10 years 1,824,727 1,789,573More than 10 years to 30 years 14,347,825 11,589,990
17. Income Taxes
a. The Parent Company has no provision for current income tax in 2017, 2016, and 2015. TheSubsidiary’s current provision for income tax represents MCIT in 2017, 2016 and 2015.
b. The reconciliation of provision for (benefit from) income tax computed at the statutory income taxrate to provision for income tax shown in the consolidated statements of comprehensive incomefollows:
2017 2016 2015Provision for (benefit from) income tax
computed at statutory tax rate (P=6,845,899) P=8,141,396 (P=6,029,008)Additions to (reductions in) income tax
resulting from:Nondeductible expenses 5,479,081 3,580,517 3,219,028Nontaxable income (182,369) (103,161) (82,005)Interest income subjected to
final tax (1,502,417) (1,314,158) (730,889)Movements in deductible temporary differences, NOLCO and excess MCIT over RCIT for which no deferred income tax assets were recognized 6,496,413 (8,931,466) 4,836,714
Provision for income tax P=3,444,809 P=1,373,128 P=1,213,840

- 27 -
*SGVFS029391*
c. The components of the Group net deferred tax asset (liabilities) are as follows:
2017 2016Deferred income taxes recognized in profit or loss
Deferred tax assets:NOLCO P=1,397,404 P=11,199,511Excess MCIT over RCIT 3,863,616 –Retirement benefit obligation 307,699 –
5,568,719 11,199,511Deferred tax liabilities:
Difference between tax and book basis of accounting for real estate transactions (1,674,766) (6,395,370)
Gain on repossession (5,870,682) (4,619,450)Unrealized foreign exchange gain (191,432) (184,691)
(7,736,880) (11,199,511)(2,168,161) –
Deferred income tax liabilities recognized in othercomprehensive income:Fair value changes of AFS financial assets (1,848,750) –Actuarial gains on defined benefit plan (5,783) –
(1,854,533) –(P=4,022,694) P=–
d. The Group’s deductible temporary differences, carryforward benefits of NOLCO and excess MCITover RCIT for which no deferred income tax assets were recognized consists of the following:
2017 2016NOLCO P=40,049,413 P=55,653,959Accrued expenses – 4,453,774Retirement benefit obligation 3,789,023 4,222,219Excess MCIT over RCIT – 2,959,109
e. Unused NOLCO and excess MCIT over RCIT that can be claimed as deduction against futuretaxable income and RCIT due, respectively, follows:
NOLCO
YearIncurred
Balance as ofDecember 31,
2016Addition(Applied) Expired
Balance as ofDecember 31,
2017 Tax effectAvailable
Until2014 P=59,267,361 (P=13,180,441) (P=46,086,920) P=– P=– 20172015 22,969,411 – – 22,969,411 6,890,823 20182016 10,748,890 – 10,748,890 3,224,667 20192017 – 10,989,125 – 10,989,125 3,296,738 2020
P=92,985,662 (P=2,191,316) (P=46,086,920) P=44,707,426 P=13,412,228

- 28 -
*SGVFS029391*
Excess MCIT over RCIT
YearIncurred
Balance as ofDecember 31,
2016 Addition Expired
Balance as ofDecember 31,
2017 Tax effectAvailable
Until2014 P=372,141 P=– (P=372,141) P=– P=– 20172015 1,213,840 – – 1,213,840 1,213,840 20182016 1,373,128 – – 1,373,128 1,373,128 20192017 – 1,276,648 – 1,276,648 1,276,648 2020
P=2,959,109 P=1,276,648 (P=372,141) P=3,863,616 P=3,863,616
f. On December 19, 2017, RA No. 10963 or the Tax Reform for Acceleration and Inclusion Act(TRAIN) was signed into law and took effect January 1, 2018, making the new tax law enacted asof the reporting date. Although the TRAIN changes existing tax laws and includes severalprovisions that will generally affect business on a prospective basis, management assessed that thesame will not have any significant impact on the financial statement balances as of the reportingdate, except for the deferred tax liability on unrealized gain on changes in fair value of the Group’sinvestment in golf club shares which are subjected to the new capital gains tax rate of 15%.
18. Related Party Disclosures
Enterprises and individuals that directly, or indirectly through one or more intermediaries, control orare controlled by, or are under common control with the Group, including holding companies,subsidiaries and fellow subsidiaries, are related parties of the Group. Associates and individualsowning, directly or indirectly, an interest in the voting power of the Group that gives them significantinfluence over the enterprise, key management personnel, including directors and officers of the Groupand close members of the family of these individuals, and companies associated with these individualsalso constitute related parties. In considering each possible related entity relationship, attention isdirected to the substance of the relationship and not merely the legal form.
In the normal course of business, the Group has significant related party transactions as follows:
Amount/volume Outstanding balance
2017 2016 2017 2016 Terms ConditionsSouth China Petroleum
International (SCPI)Due from a relatedparty
P=12,583 P=12,583 P=191,619 P=179,036 Due anddemandable
Unsecured;No impairment
· SCPI is a corporation established to prospect for, explore, extract, dig and drill for, exploit, produce,purchase, or otherwise obtain from the earth, any and all kinds of petroleum and petroleumproducts, rocks or carbon oils, natural gas and other volatile materials, chemical substance andsalts, precious and base metals, diatomaceous earth as well as other minerals of whatever naturewhether similar or dissimilar to those listed herein, and to manufacture, refine, prepare for market,buy, sell, import, export and transport and otherwise deal in petroleum and other minerals ofwhatever nature, whether similar or dissimilar thereto, their products, compounds and derivativesand other mineral and chemical substances in crude or refined condition, and to generally engage,as may be permitted by law, in the business of, and/or investing in mining, manufacturing,contracting and servicing, in addition to oil exploration. Receivable from SCPI pertains to theamount paid for SCPI’s business permit and registration.
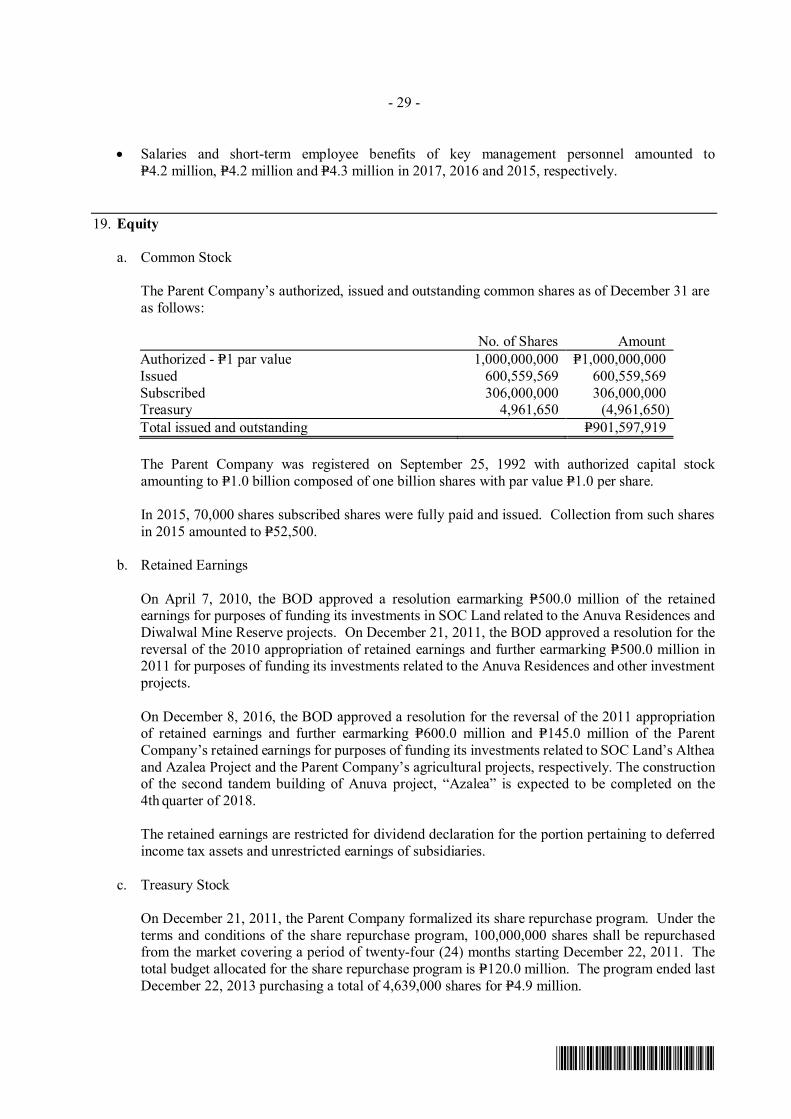
- 29 -
*SGVFS029391*
· Salaries and short-term employee benefits of key management personnel amounted toP=4.2 million, P=4.2 million and P=4.3 million in 2017, 2016 and 2015, respectively.
19. Equity
a. Common Stock
The Parent Company’s authorized, issued and outstanding common shares as of December 31 areas follows:
No. of Shares AmountAuthorized - P=1 par value 1,000,000,000 P=1,000,000,000Issued 600,559,569 600,559,569Subscribed 306,000,000 306,000,000Treasury 4,961,650 (4,961,650)Total issued and outstanding P=901,597,919
The Parent Company was registered on September 25, 1992 with authorized capital stockamounting to P=1.0 billion composed of one billion shares with par value P=1.0 per share.
In 2015, 70,000 shares subscribed shares were fully paid and issued. Collection from such sharesin 2015 amounted to P=52,500.
b. Retained Earnings
On April 7, 2010, the BOD approved a resolution earmarking P=500.0 million of the retainedearnings for purposes of funding its investments in SOC Land related to the Anuva Residences andDiwalwal Mine Reserve projects. On December 21, 2011, the BOD approved a resolution for thereversal of the 2010 appropriation of retained earnings and further earmarking P=500.0 million in2011 for purposes of funding its investments related to the Anuva Residences and other investmentprojects.
On December 8, 2016, the BOD approved a resolution for the reversal of the 2011 appropriationof retained earnings and further earmarking P=600.0 million and P=145.0 million of the ParentCompany’s retained earnings for purposes of funding its investments related to SOC Land’s Altheaand Azalea Project and the Parent Company’s agricultural projects, respectively. The constructionof the second tandem building of Anuva project, “Azalea” is expected to be completed on the4th quarter of 2018.
The retained earnings are restricted for dividend declaration for the portion pertaining to deferredincome tax assets and unrestricted earnings of subsidiaries.
c. Treasury Stock
On December 21, 2011, the Parent Company formalized its share repurchase program. Under theterms and conditions of the share repurchase program, 100,000,000 shares shall be repurchasedfrom the market covering a period of twenty-four (24) months starting December 22, 2011. Thetotal budget allocated for the share repurchase program is P=120.0 million. The program ended lastDecember 22, 2013 purchasing a total of 4,639,000 shares for P=4.9 million.

- 30 -
*SGVFS029391*
20. Basic/Diluted Earnings (Loss) Per Share
2017 2016 2015Net income (loss) (P=26,270,254) P=25,764,860 (P=21,310,532)Weighted average number of shares 901,597,919 901,597,919 905,645,387Basic/Diluted Loss per Share (P=0.0291) P=0.0286 (P=0.0235)
There are no dilutive potential common shares outstanding as of December 31, 2017, 2016 and 2015.
21. Financial Instruments
Financial Risk Management Objectives and PoliciesThe Group has various financial assets and liabilities such as cash and cash equivalents, receivables,due from related parties, refundable deposits, AFS financial assets. The main purpose of the Group’sfinancial instruments is to finance its operations. The Group has other financial instruments such asaccounts payable and other liabilities which arise directly from its operations.
The BOD has overall responsibility for the establishment and oversight of the Group’s risk managementframework. The Group’s risk management policies are established to identify and manage the Group’sexposure to financial risks, to set appropriate transaction limits and controls, and to monitor and assessrisks and compliance to internal control policies. Risk management policies and structure are reviewedregularly to reflect changes in market conditions and the Group’s activities.
The Group has exposure to credit risk, liquidity risk, equity price risk and foreign exchange risk fromthe use of its financial instruments. The BOD reviews and approves the policies for managing each ofthese risks and they are summarized below.
Credit RiskCredit risk refers to the potential loss arising from any failure by counterparties to fulfill theirobligations, as and when they fall due. It is inherent to the business as potential losses may arise dueto the failure of its counterparties to fulfill their obligations on maturity dates or due to adverse marketconditions.
The Group is exposed to credit risk primarily because of its investing and operating activities. TheGroup is exposed to credit risk arising from the counterparties to its financial assets.
Credit Risk ManagementIn managing credit risk on these investments, capital preservation is paramount. The Group trades onlywith recognized, creditworthy third parties. It is the Group’s policy that all counterparties who wish totrade on credit terms are subject to credit verification procedures. For investment in bonds, funds areinvested in highly recommended, creditworthy debt instruments that provides satisfactory interest yieldand capital appreciation. Investment in equities securities represent investments in companies withgood dividend track record, as well as capital appreciation. The investment portfolio mix between debtand equity is reviewed by management.
With respect to credit risk arising from the other financial assets of the Group, which comprise of cashand cash equivalents, receivables, due from related parties and refundable deposits, managementmonitors these financial assets on an ongoing basis with the result that the Group’s exposure toimpairment losses is not significant.
Credit Risk ExposuresThe maximum exposure to credit risk for financial assets, which is composed of cash and cashequivalents, receivables, due from related parties, AFS financial assets and refundable deposits, is
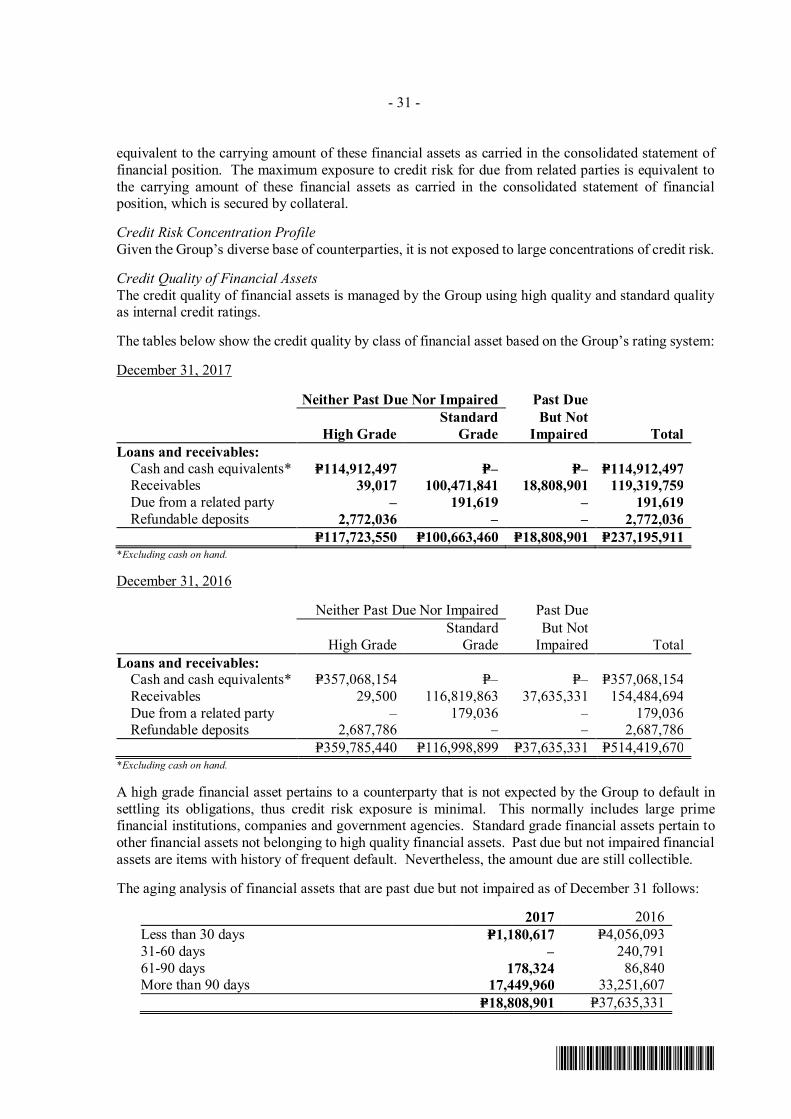
- 31 -
*SGVFS029391*
equivalent to the carrying amount of these financial assets as carried in the consolidated statement offinancial position. The maximum exposure to credit risk for due from related parties is equivalent tothe carrying amount of these financial assets as carried in the consolidated statement of financialposition, which is secured by collateral.
Credit Risk Concentration ProfileGiven the Group’s diverse base of counterparties, it is not exposed to large concentrations of credit risk.
Credit Quality of Financial AssetsThe credit quality of financial assets is managed by the Group using high quality and standard qualityas internal credit ratings.
The tables below show the credit quality by class of financial asset based on the Group’s rating system:
December 31, 2017
Neither Past Due Nor Impaired Past Due
High GradeStandard
GradeBut Not
Impaired TotalLoans and receivables:
Cash and cash equivalents* P=114,912,497 P=– P=– P=114,912,497Receivables 39,017 100,471,841 18,808,901 119,319,759Due from a related party – 191,619 – 191,619Refundable deposits 2,772,036 – – 2,772,036
P=117,723,550 P=100,663,460 P=18,808,901 P=237,195,911*Excluding cash on hand.
December 31, 2016
Neither Past Due Nor Impaired Past Due
High GradeStandard
GradeBut Not
Impaired TotalLoans and receivables:
Cash and cash equivalents* P=357,068,154 P=– P=– P=357,068,154Receivables 29,500 116,819,863 37,635,331 154,484,694Due from a related party – 179,036 – 179,036Refundable deposits 2,687,786 – – 2,687,786
P=359,785,440 P=116,998,899 P=37,635,331 P=514,419,670*Excluding cash on hand.
A high grade financial asset pertains to a counterparty that is not expected by the Group to default insettling its obligations, thus credit risk exposure is minimal. This normally includes large primefinancial institutions, companies and government agencies. Standard grade financial assets pertain toother financial assets not belonging to high quality financial assets. Past due but not impaired financialassets are items with history of frequent default. Nevertheless, the amount due are still collectible.
The aging analysis of financial assets that are past due but not impaired as of December 31 follows:
2017 2016Less than 30 days P=1,180,617 P=4,056,09331-60 days – 240,79161-90 days 178,324 86,840More than 90 days 17,449,960 33,251,607
P=18,808,901 P=37,635,331

- 32 -
*SGVFS029391*
Liquidity RiskLiquidity risk is the risk that the Group will not be able to settle or meet its obligations on time or at areasonable price. Management is responsible for liquidity, funding as well as settlementmanagement. In addition, liquidity and funding risks, related processes and policies are overseen bymanagement. The Group manages its liquidity risk based on business needs, tax, capital or regulatoryconsiderations, if applicable, through numerous sources of finance in order to maintain flexibility.
The tables below summarize the maturity profile of the Group’s financial assets used for liquiditypurposes based on contractual undiscounted cash flows, and the Group’s financial liabilities based oncontractual undiscounted payments.
December 31, 2017
OnDemand
Less than 3Months
3 to 12Months
More than 1year Total
Financial AssetsLoans and receivables: Cash and cash equivalents P=115,032,410 P=4,098,888 P=– P=– P=119,131,298 Receivables 18,808,901 25,317,940 7,198,058 61,841,846 113,166,745 Due from a related party 191,619 – – – 191,619
Refundable deposits 2,765,484 – – – 2,765,484AFS financial assets: Shares of stock – – – 20,200,708 20,200,708 Golf club shares – – – 24,250,000 24,250,000 UITF – 10,105,372 – – 10,105,372
P=136,798,414 P=39,522,200 P=7,198,058 P=106,292,554 P=289,811,226Financial LiabilityOther financial liability: Accounts payable and other liabilities* 6,603,170 45,252,692 – – 51,855,862Liquidity position (gap) P=132,234,261 (P=5,730,492) P=7,198,058 P=106,292,554 P=239,994,381*Excluding government payables and customers’ deposits and unearned income
December 31, 2016
OnDemand
Less than 3Months
3 to12
Months More than 1 year Total
Financial AssetsLoans and receivables: Cash and cash equivalents P=357,158,066 P=– P=– P=– P=357,158,066 Receivables 37,635,331 33,439,684 4,560,817 78,848,862 154,484,694 Due from a related party 179,036 – – – 179,036
Refundable deposits 2,687,786 – – – 2,687,786AFS financial assets: Shares of stock – – – 20,200,708 20,200,708 Golf club shares – – – 20,660,000 20,660,000
397,660,219 33,439,684 4,560,817 119,709,570 555,370,290Financial LiabilityOther financial liability: Accounts payable and other liabilities* 9,277,895 47,746,496 – – 57,024,391Liquidity position (gap) P=388,382,324 (P=14,306,812) P=4,560,817 P=119,709,570 P=498,345,899*Excluding government payables and customers’ deposits and unearned income
Equity Price RiskEquity price risk is the likelihood that the fair values of equities decrease as a result of changes in thelevels of the equity indices and the values of individual stocks. The equity price risk exposure arisesfrom the Group’s AFS financial assets in equity securities. The Group measures the sensitivity of itsdomestic AFS financial assets by using stock market index fluctuations and its effect to respective shareprices.
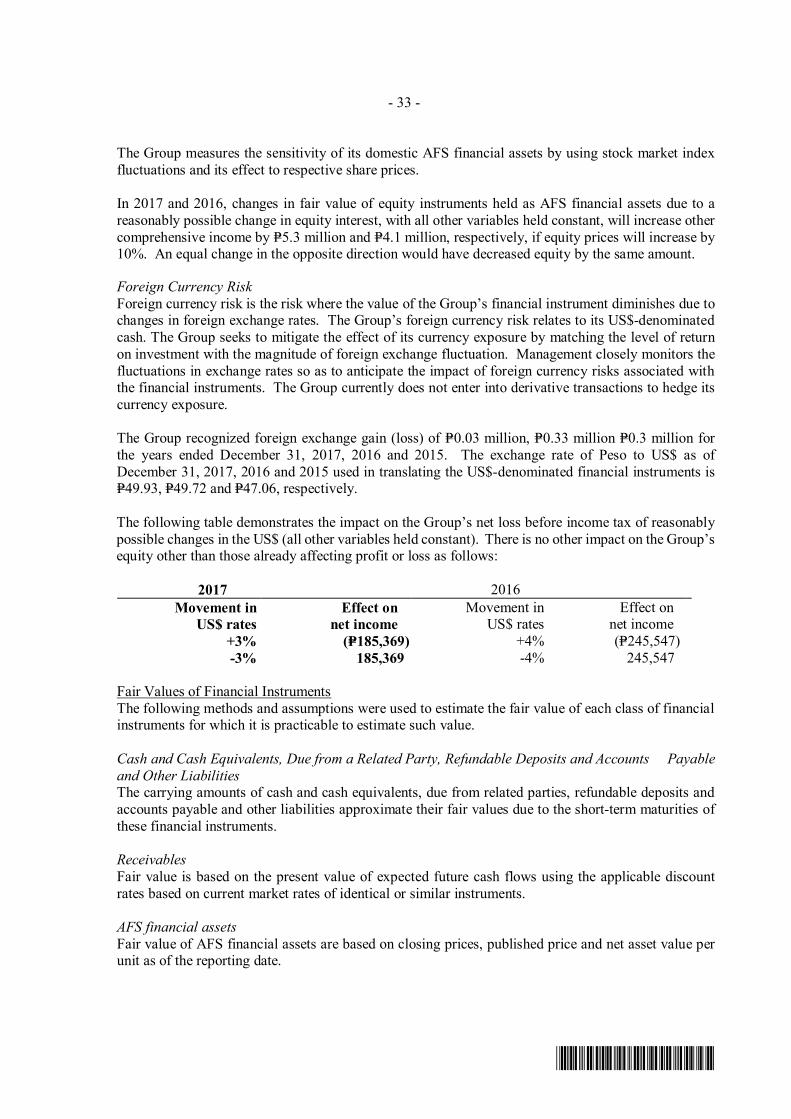
- 33 -
*SGVFS029391*
The Group measures the sensitivity of its domestic AFS financial assets by using stock market indexfluctuations and its effect to respective share prices.
In 2017 and 2016, changes in fair value of equity instruments held as AFS financial assets due to areasonably possible change in equity interest, with all other variables held constant, will increase othercomprehensive income by P=5.3 million and P=4.1 million, respectively, if equity prices will increase by10%. An equal change in the opposite direction would have decreased equity by the same amount.
Foreign Currency RiskForeign currency risk is the risk where the value of the Group’s financial instrument diminishes due tochanges in foreign exchange rates. The Group’s foreign currency risk relates to its US$-denominatedcash. The Group seeks to mitigate the effect of its currency exposure by matching the level of returnon investment with the magnitude of foreign exchange fluctuation. Management closely monitors thefluctuations in exchange rates so as to anticipate the impact of foreign currency risks associated withthe financial instruments. The Group currently does not enter into derivative transactions to hedge itscurrency exposure.
The Group recognized foreign exchange gain (loss) of P=0.03 million, P=0.33 million P=0.3 million forthe years ended December 31, 2017, 2016 and 2015. The exchange rate of Peso to US$ as ofDecember 31, 2017, 2016 and 2015 used in translating the US$-denominated financial instruments isP=49.93, P=49.72 and P=47.06, respectively.
The following table demonstrates the impact on the Group’s net loss before income tax of reasonablypossible changes in the US$ (all other variables held constant). There is no other impact on the Group’sequity other than those already affecting profit or loss as follows:
2017 2016Movement in
US$ ratesEffect on
net incomeMovement in
US$ ratesEffect on
net income+3% (P=185,369) +4% (P=245,547)-3% 185,369 -4% 245,547
Fair Values of Financial InstrumentsThe following methods and assumptions were used to estimate the fair value of each class of financialinstruments for which it is practicable to estimate such value.
Cash and Cash Equivalents, Due from a Related Party, Refundable Deposits and Accounts Payableand Other LiabilitiesThe carrying amounts of cash and cash equivalents, due from related parties, refundable deposits andaccounts payable and other liabilities approximate their fair values due to the short-term maturities ofthese financial instruments.
ReceivablesFair value is based on the present value of expected future cash flows using the applicable discountrates based on current market rates of identical or similar instruments.
AFS financial assetsFair value of AFS financial assets are based on closing prices, published price and net asset value perunit as of the reporting date.

- 34 -
*SGVFS029391*
Fair Value HierarchyThe Group uses the following hierarchy for determining and disclosing the fair value of financialinstruments by valuation technique:
· Level 1: quoted (unadjusted) prices in active markets for identical assets or liabilities;· Level 2: other techniques for which all inputs which have a significant effect on the recorded fair
value are observable, either directly or indirectly; or· Level 3: techniques which use inputs which have a significant effect on the recorded fair value that
are not based on observable market data.
The following table presents the fair value of the Group's financial instruments:
2017 2016Carrying Value Fair Value Carrying Value Fair Value
Financial AssetsShares of stock P=19,090,599 P=19,090,599 P=20,200,708 P=20,200,708Golf club shares 24,250,000 24,250,000 20,660,000 20,660,000UITF 10,105,372 10,105,372 – –Installment contract receivables 85,450,217 74,438,231 116,819,864 130,312,030Total P=138,896,188 P=127,884,202 P=157,680,572 P=171,172,738
The Group’s financial instrument carried at fair value consists of equity shares which has beendetermined by reference to the price of the most recent transaction at the end of reporting period(Level 1), golf club shares which has been determined by reference to published price quotation, andUITF which has been determined by reference to net asset value per unit at the end of reporting period.
As of December 31, 2017 and 2016, there were no transfers between Level 1 and Level 2 fair valuemeasurements, and there were no transfers into and out of Level 3 fair value measurements.
Capital ManagementThe primary objective of the Group’s capital management is to ensure that it maintains a strong creditrating and healthy capital ratios in order to support its business and maximize stockholder value.
The Group manages its capital structure and makes adjustments to it, in light of changes in economicconditions. To maintain or adjust the capital structure, the Group may adjust the dividend payment tostockholders, return capital to stockholders or issue new shares. No changes were made in theobjectives, policies or processes in 2017 and 2016.
The following table pertains to the account balances which the Group considers as its core economiccapital:
2017 2016Common stock P=600,559,569 P=600,559,569Subscribed common stock - net 76,500,000 76,500,000Additional paid-in capital 72,272,140 72,272,140Retained earnings 861,800,856 888,071,111Treasury stock (4,961,650) (4,961,650)
P=1,606,170,915 P=1,632,441,170

- 35 -
*SGVFS029391*
22. Segment Information
For management purposes, the Group is organized into business units based on its products and servicesand has two reportable segments, as follows:
· The real estate development segment, which is engaged in the real estate business.· Investment pertain to the activities of the Parent Company as a holding entity.
No operating segments have been aggregated to form the above reportable operating segments.
Management monitors the operating results of its business units separately for the purpose of makingdecisions about resource allocation and performance assessment. Segment performance is evaluatedbased on operating profit or loss which in certain respects is measured differently from operatingincome or loss in the consolidated financial statements. The Group’s identified operating segments,which are consistent with the segments reported to the BOD, which is the Group’s Chief OperatingDecision Maker.
The following tables regarding business segments present assets and liabilities, revenue and profitinformation for each of the three years in the period ended December 31, 2017.
December 31, 2017Real Estate
Development Investment Consolidated Eliminations Total
Segment resultsLoss before income tax (P=14,440,921) (P=8,378,741) (P=22,819,661) P=– (P=22,819,662)Provision for income tax 3,444,809 – 3,444,809 – 3,444,809Net loss (P=17,885,730) (P=8,378,741) (P=26,2644,471) P=– (P=26,2644,471)
AssetsSegment assets P=1,481,505,794 P=1,387,093,361 P=2,868,599,155 (P=1,110,528,901) P=1,758,070,254Investments – 322,298,000 322,298,000 (322,298,000) –
P=1,481,505,794 P=1,806,571,323 P=3,196,435,550 (P=1,432,826,901) P=1,763,608,649Other segment informationSegment liabilities P=1,240,925,460 P=6,699,327 P=1,247,624,787 (P=1,110,528,901) P=137,095,886Depreciation and
amortization 2,291,445 130,821 2,422,066 – 2,422,066Interest income 7,908,897 4,987,979 12,896,876 – 12,896,876
December 31, 2016Real Estate
Development Investment Total Eliminations Consolidated
Segment resultsIncome (loss) before
income tax P=39,875,829 (P=12,737,841) P=27,137,988 P=– P=27,137,988Provision for income tax 1,373,128 – 1,373,128 – 1,373,128Net income (loss) P=38,502,701 (P=12,737,841) P=25,764,860 P=– P=25,764,860
AssetsSegment assets P=1,514,422,594 P=1,486,419,796 P=3,000,842,390 (P=1,235,877,150) P=1,764,965,240Investments – 322,298,000 322,298,000 (322,298,000) –
P=1,514,422,594 P=1,808,717,796 P=3,323,140,390 (P=1,558,175,150) P=1,764,965,240Other segment informationSegment liabilities P=1,350,217,365 P=4,087,463 P=1,354,304,828 (P=1,235,877,150) P=118,427,678Depreciation and
amortization 2,664,760 20,515 2,685,275 – 2,685,275Interest income 10,614,167 2,582,569 13,195,736 – 13,195,736
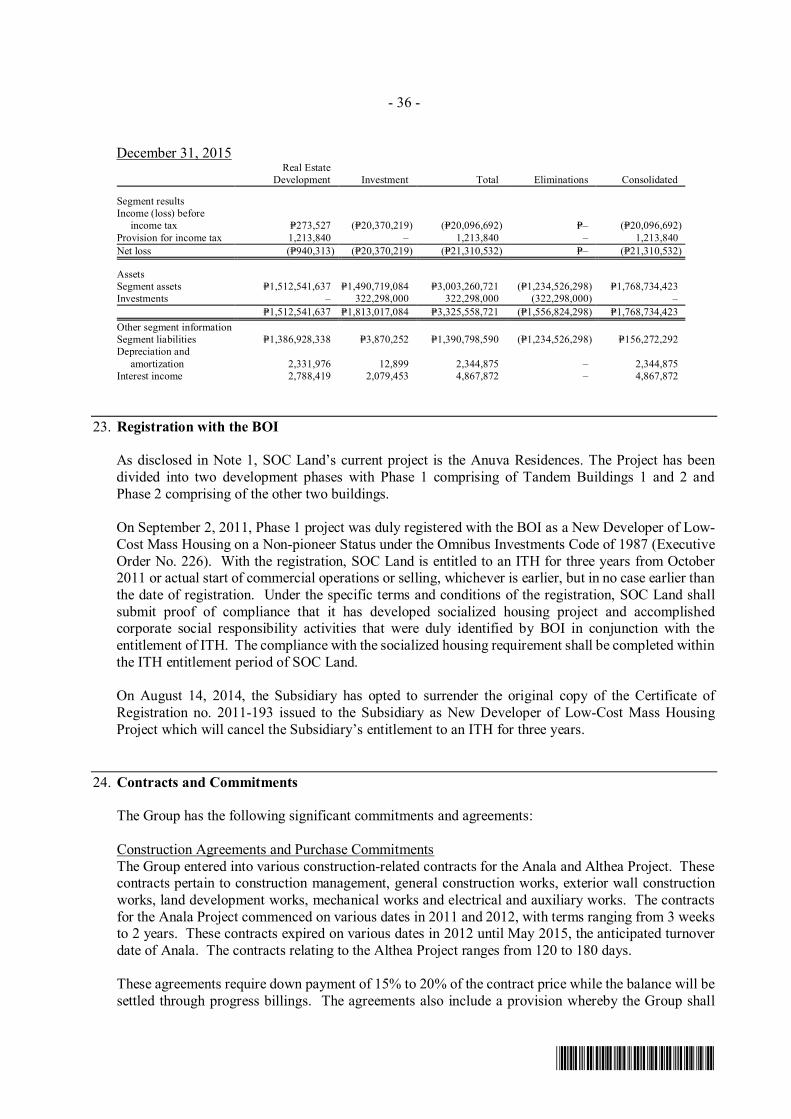
- 36 -
*SGVFS029391*
December 31, 2015Real Estate
Development Investment Total Eliminations Consolidated
Segment resultsIncome (loss) before
income tax P=273,527 (P=20,370,219) (P=20,096,692) P=– (P=20,096,692)Provision for income tax 1,213,840 – 1,213,840 – 1,213,840Net loss (P=940,313) (P=20,370,219) (P=21,310,532) P=– (P=21,310,532)
AssetsSegment assets P=1,512,541,637 P=1,490,719,084 P=3,003,260,721 (P=1,234,526,298) P=1,768,734,423Investments – 322,298,000 322,298,000 (322,298,000) –
P=1,512,541,637 P=1,813,017,084 P=3,325,558,721 (P=1,556,824,298) P=1,768,734,423Other segment informationSegment liabilities P=1,386,928,338 P=3,870,252 P=1,390,798,590 (P=1,234,526,298) P=156,272,292Depreciation and
amortization 2,331,976 12,899 2,344,875 – 2,344,875Interest income 2,788,419 2,079,453 4,867,872 – 4,867,872
23. Registration with the BOI
As disclosed in Note 1, SOC Land’s current project is the Anuva Residences. The Project has beendivided into two development phases with Phase 1 comprising of Tandem Buildings 1 and 2 andPhase 2 comprising of the other two buildings.
On September 2, 2011, Phase 1 project was duly registered with the BOI as a New Developer of Low-Cost Mass Housing on a Non-pioneer Status under the Omnibus Investments Code of 1987 (ExecutiveOrder No. 226). With the registration, SOC Land is entitled to an ITH for three years from October2011 or actual start of commercial operations or selling, whichever is earlier, but in no case earlier thanthe date of registration. Under the specific terms and conditions of the registration, SOC Land shallsubmit proof of compliance that it has developed socialized housing project and accomplishedcorporate social responsibility activities that were duly identified by BOI in conjunction with theentitlement of ITH. The compliance with the socialized housing requirement shall be completed withinthe ITH entitlement period of SOC Land.
On August 14, 2014, the Subsidiary has opted to surrender the original copy of the Certificate ofRegistration no. 2011-193 issued to the Subsidiary as New Developer of Low-Cost Mass HousingProject which will cancel the Subsidiary’s entitlement to an ITH for three years.
24. Contracts and Commitments
The Group has the following significant commitments and agreements:
Construction Agreements and Purchase CommitmentsThe Group entered into various construction-related contracts for the Anala and Althea Project. Thesecontracts pertain to construction management, general construction works, exterior wall constructionworks, land development works, mechanical works and electrical and auxiliary works. The contractsfor the Anala Project commenced on various dates in 2011 and 2012, with terms ranging from 3 weeksto 2 years. These contracts expired on various dates in 2012 until May 2015, the anticipated turnoverdate of Anala. The contracts relating to the Althea Project ranges from 120 to 180 days.
These agreements require down payment of 15% to 20% of the contract price while the balance will besettled through progress billings. The agreements also include a provision whereby the Group shall

- 37 -
*SGVFS029391*
deduct 10% retention from every progress payment until full completion of the project work. Retentionpayable related to these contracts amounted to P=6.6 million and P=7.3 million as of December 31, 2017and 2016, respectively (see Note 12). These are expected to be settled in 2018.
Lease Agreementsa. In 2012, the Parent Company entered into a renewable lease contract with Haldane Investment NV,
duly represented by E. Zobel, Inc. for the lease of the 4/F Unit of Enzo Building, located at No.399 Gil J. Puyat Avenue, Makati City. The contract is for a term of eight months commencing onMay 1, 2012 and expiring December 31, 2012. The lease is renewable every year for a period of12 months. In line with the contract, the Parent Company paid a security deposit amountingP=86,184, which is classified under “Prepayments and other current assets” (see Note 8). Minimumlease payments within a year under this contract is P=0.2 million.
b. On January 1, 2017, the Subsidiary entered into a lease contract with E. Zobel, Inc. for the lease ofoffice space at 2/F Enzo Building, 399 Sen. Gil Puyat Avenue, Makati City. The contract is for theperiod January 1, 2017 to December 31, 2017. The lease agreement is renewable on a yearly basis.The Subsidiary renewed the lease for another year.
The Group paid security deposit amounting to P=0.3 million to answer for any and all damages tothe leased premises and as security for the return of the leased premises in proper condition.Minimum lease payments within one year amounted to P=1.7 million.
The Group also entered into a lease contract with a third party contractor to provide service vehicleto Company officers. The contract is renewable every six months. Minimum lease paymentswithin one year amounted to P=0.7 million.
The related rent expense recognized by the Group amounted to P=3.6 million, P=4.8 million andP=7.1 million in 2017, 2016 and 2015, respectively (see Notes 13 and 14).


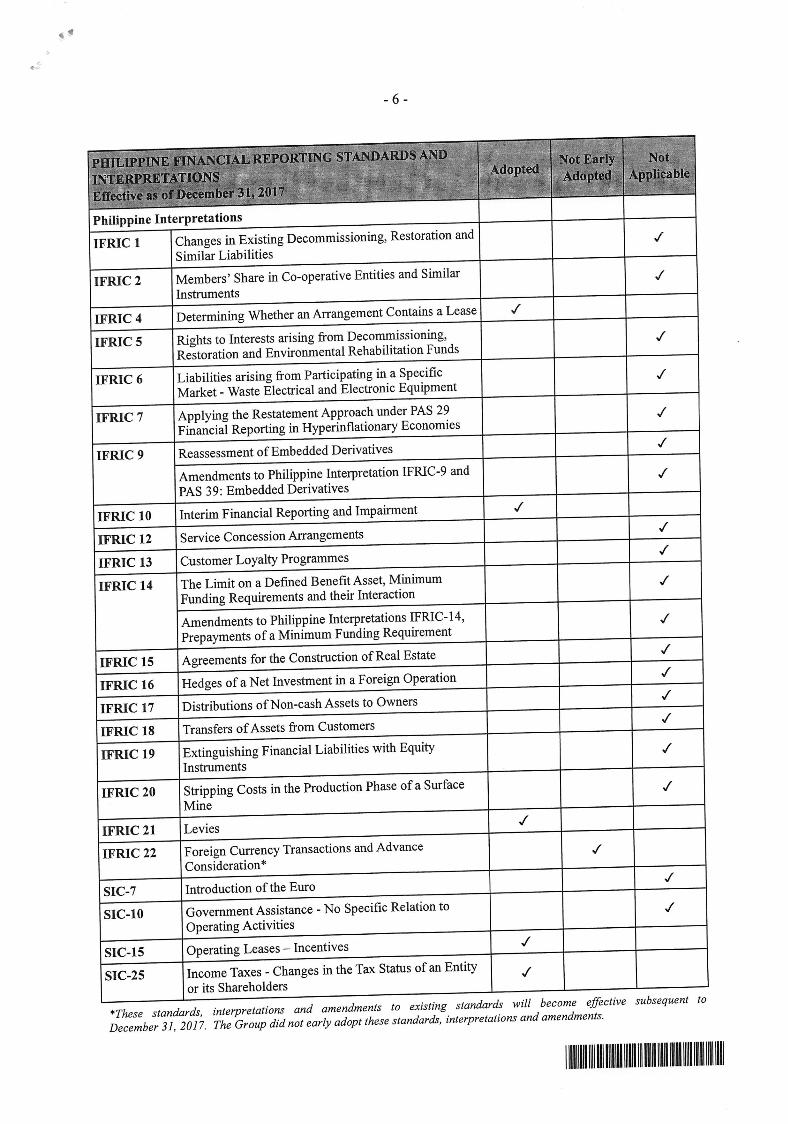


SOCRESOURCES, INC. AND SUBSIDIARYSchedule 3: Other long term investments and other Investments
Available for Sale Financial AssetsAs of December 31, 2017In Philippine Peso unless stated
Name of Issuing Entity & Description of
Investment
Number of Shares
or Principal Amount
of Bonds & Notes
Value Based on
Market Quotations at
the end of Reporting
Period
Dividends, Interest
Received from
Investments not
accounted for by the
equity Method
Investment in Shares of StocksListed - DomesticAboitiz Equity Ventures, Inc. 7,800 576,810 10,374 Lepanto Consolidated Mining Company "A" 2,078,000 311,700 Manila Mining Corporation "A" 26,480,000 246,264 Manila Water Company, Inc. 265,000 7,433,250 224,932 Petron 1,147,500 10,522,575 114,750
19,090,599 350,056
Not Listed - DomesticWackwack Golf & Country Club 1 24,000,000 Southwest Resources, Inc. 3,333,500 Mt. Malarayat Golf & Country Club 1 250,000
27,583,500 Allowance for Impairment on AFS - Unlisted (3,333,500)
24,250,000
Unit Investment Trust FundChinabank Savings 10,105,372
TOTAL AVAILABLE FOR SALE FINANCIAL ASSETS 53,445,971

SOCResources, Inc. and SubsidiarySchedule 4: Aging of Consolidated Accounts ReceivableAs of December 31,2017
7 Mos. To 5 Years - Past due accounts
Accounts Receivable Total 1 Month 2-3 Mos. 4-6 Mos. 1 Year 1-2 Years 3-5 Years Above & Items in Litigation
1 Installment Contract Receivable 74,438,231 65,297,170 446,765 363,909 3,162,086 5,168,301 - -
2 Advances to Suppliers & Contractors 6,153,014 647,771 - 203,835 283,388 5,018,021 - -
3 Officers and employees 19,792,193 698,921 63,022 29,371 880 15,000,000 - 4,000,000
4 Dividends 90,488 10,374 - - 8,268 2,660 69,186 -
5 SSS 8,400 - - - - - - 8,400
6 Unit Owners 6,611,114 6,611,114 - - - - - -
7 Others 12,226,319 4,464,763 1,612,548 2,126,998 3,260,374 611,236 40,955 109,445
Subtotal 119,319,759 77,730,113 2,122,335 2,724,112 6,714,995 25,800,217 110,141 4,117,845
Less: Allow. For
Impairment losses on receivables - - - - - - - - -
A/R - net 119,319,759 77,730,113 2,122,335 2,724,112 6,714,995 25,800,217 110,141 4,117,845 NONE
Net Receivables 119,319,759 77,730,113 2,122,335 2,724,112 6,714,995 25,800,217 110,141 4,117,845 NONE
Notes: If the Company's collection period does not match with the above schedule and revision is necessary to make the schedule not misleading,
the proposed collection period in this schedule may be changed to appropriately reflect the Company's actual collection period.
Accounts Receivable Description :
Type of A/R :
monthly payment of interest &
1) Amount owed by a related party Receivable from third party IPI Industries, Inc. (Principal & Interest) quarterly payment of principal
2) Officers and employees Advances to employees for emergency purpose on a 1 year term payable monthly monthly
3) Others Receivable from third party past due yet collectible
Notes : Indicate a brief description of the nature and collection period of each receivable accounts with major balances
or separate receivable captions, both for trade and non-trade accounts.
Normal Operating Cycle: 1 (one) year
CURRENT PAST DUE
Nature/Description Collection Period

SOCRESOURCES, INC. AND SUBSIDIARY
Schedule 5: Amounts Receivable from Related Parties which are eliminated during the
consolidation of Financial Statements
As of December 31, 2017
Beginning Balance Deductions Ending Balance
December 31, 2016 December 31, 2017
SOC Land Development, Corp. 1,235,877,150 (125,348,249) 1,110,528,901

SOCRESOURCES, INC. AND SUBSIDIARY
Schedule 7: Key Performance Indicator
KEY FINANCIAL RATIOS December 31, 2017 December 31, 2016 December 31, 2015
I. Current/Liquidity Ratios 12.32 x 13.87 x 10.77 x
II. Solvency Ratio -17.39% 24.02% -12.14%
III. Debt-to-equity ratio (in x) 0.0846 x 0.0719 x 0.0969 x
IV. Asset to Equity Ratio 1.0846 x 1.0719 x 1.0969 x
V. Interest Rate Coverage Ratio N/A N/A N/A
VI. Profitability Ratio
Return on Equity (ROE) -1.62% 1.56% -1.32%
Return on Assets (ROA) -1.49% 1.46% -1.20%
VII. Other Relevant Ratios
Revenue Growth/ (Decline) -60.36% -22.18% 65.90%
Net Income Growth/ (Decline) -201.94% 220.90% 44.19%
EBITDA (23,842,405) 28,450,135Php (18,965,657)

SOCRESOURCES, INC. AND SUBSIDIARY
Schedule 8: Map of the Relationships of the Companies within the Group
As of December 31, 2017 and December 31,2016
SOCRESOURCES, INC. (PARENT)
SOC LAND DEVELOPMENT CORP.
(SUBSIDIARY 100% OWNED)