credit suisse first boston 2002 asian investment conference · credit suisse first boston 2002...
TRANSCRIPT
Credit Suisse First Boston
2002 Asian Investment Conference
Stuart Grimshaw
Group General Manager Financial and Risk Management
21 March 2002
www.commbank.com.au
2
The material that follows is a presentation of general
background information about the Bank‟s activities
current at the date of the presentation, 21 March
2002. It is information given in summary form and
does not purport to be complete. It is not intended to
be relied upon as advice to investors or potential
investors and does not take into account the
investment objectives, financial situation or needs of
any particular investor. These should be considered,
with or without professional advice when deciding if
an investment is appropriate.
Disclaimer
3
Speaker’s Notes
Speaker‟s notes for this presentation are
attached below each slide.
To access them, you may need to save
the slides in PowerPoint and view/print
in “notes view.”
4
Agenda
Australian Economy
Commonwealth Bank Performance
Strategic Imperatives
Competitive Advantage
Summary
5
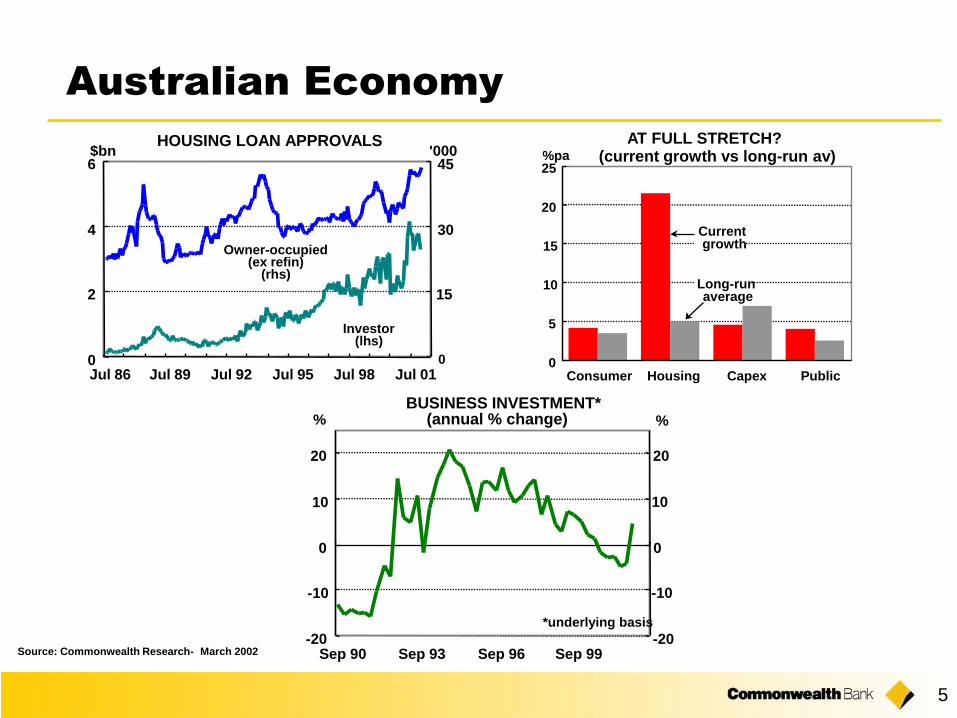
Australian Economy
Source: Commonwealth Research- March 2002
Consumer Housing Capex Public
AT FULL STRETCH?(current growth vs long-run av)
0
5
10
15
20
25%pa
Currentgrowth
Long-runaverage
HOUSING LOAN APPROVALS
0
2
4
6
Jul 86 Jul 89 Jul 92 Jul 95 Jul 98 Jul 010
15
30
45$bn '000
Owner-occupied(ex refin)
(rhs)
Investor(lhs)
BUSINESS INVESTMENT*(annual % change)
-20
-10
0
10
20
Sep 90 Sep 93 Sep 96 Sep 99-20
-10
0
10
20
% %
*underlying basis
Commonwealth Bank Performance
7
Financial Performance :
Half Year to 31 December 2001
Underlying Group performance up 14%
Reflects a strong banking result up 16% (before bad debts) driven by a
steady net interest margin and growth in other banking income
Funds under management result is up 23% with strong momentum
in funds inflow maintained through September 11
Australian life insurance operating margin up 22% offset by a weak offshore
life insurance result
Increase in bad and doubtful debt expense, driven by two large impaired
corporate exposures
Organisational restructure announced in December 2001 complementing
the Bank‟s strategic focus on wealth management
8
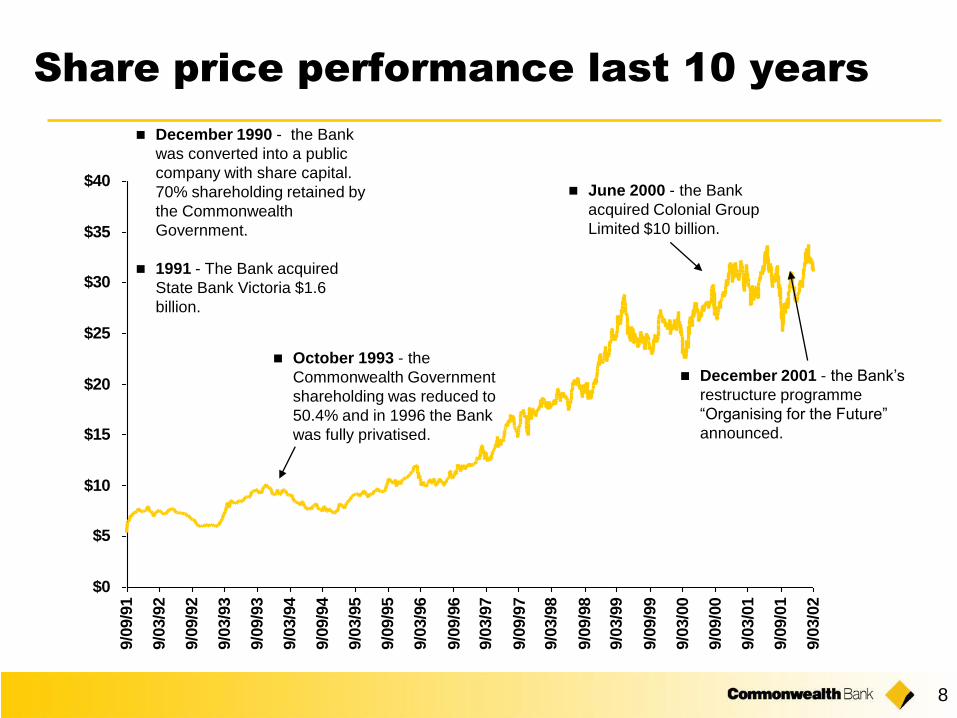
Share price performance last 10 years
$0
$5
$10
$15
$20
$25
$30
$35
$40
9/0
9/9
1
9/0
3/9
2
9/0
9/9
2
9/0
3/9
3
9/0
9/9
3
9/0
3/9
4
9/0
9/9
4
9/0
3/9
5
9/0
9/9
5
9/0
3/9
6
9/0
9/9
6
9/0
3/9
7
9/0
9/9
7
9/0
3/9
8
9/0
9/9
8
9/0
3/9
9
9/0
9/9
9
9/0
3/0
0
9/0
9/0
0
9/0
3/0
1
9/0
9/0
1
9/0
3/0
2
December 2001 - the Bank‟s
restructure programme
“Organising for the Future”
announced.
December 1990 - the Bank
was converted into a public
company with share capital.
70% shareholding retained by
the Commonwealth
Government.
1991 - The Bank acquired
State Bank Victoria $1.6
billion.
October 1993 - the
Commonwealth Government
shareholding was reduced to
50.4% and in 1996 the Bank
was fully privatised.
June 2000 - the Bank
acquired Colonial Group
Limited $10 billion.

Strategic Imperatives
Segmentation
Productivity
10
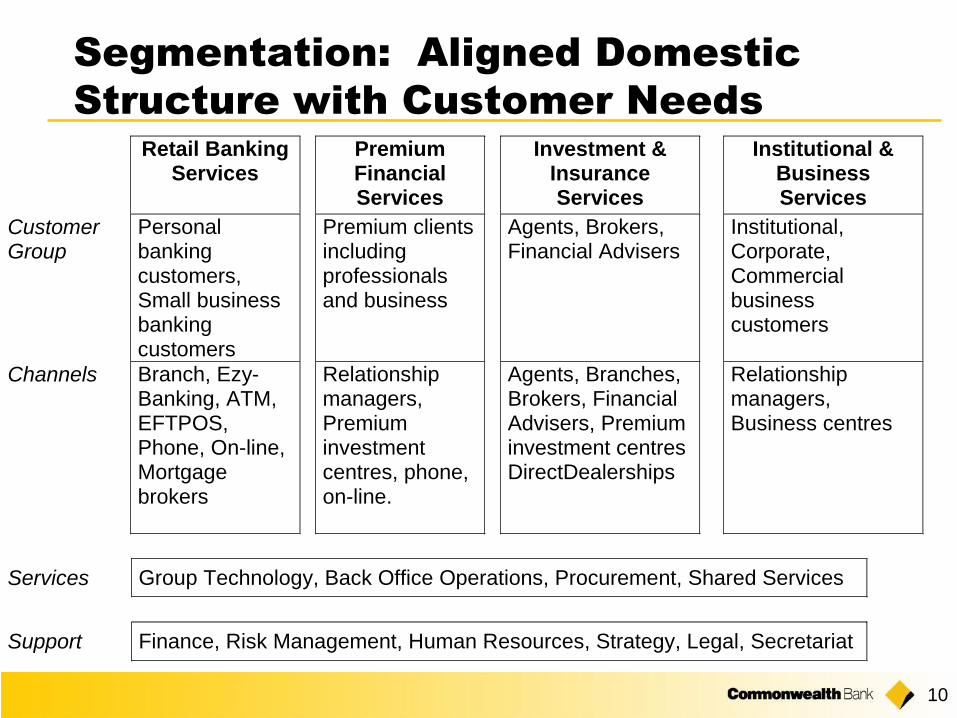
Segmentation: Aligned Domestic
Structure with Customer Needs
Retail BankingServices
PremiumFinancialServices
Investment &InsuranceServices
Institutional &BusinessServices
CustomerGroup
Personalbankingcustomers,Small businessbankingcustomers
Premium clientsincludingprofessionalsand business
Agents, Brokers,Financial Advisers
Institutional,Corporate,Commercialbusinesscustomers
Channels Branch, Ezy-Banking, ATM,EFTPOS,Phone, On-line,Mortgagebrokers
Relationshipmanagers,Premiuminvestmentcentres, phone,on-line.
Agents, Branches,Brokers, FinancialAdvisers, Premiuminvestment centresDirectDealerships
Relationshipmanagers,Business centres
Services Group Technology, Back Office Operations, Procurement, Shared Services
Support Finance, Risk Management, Human Resources, Strategy, Legal, Secretariat
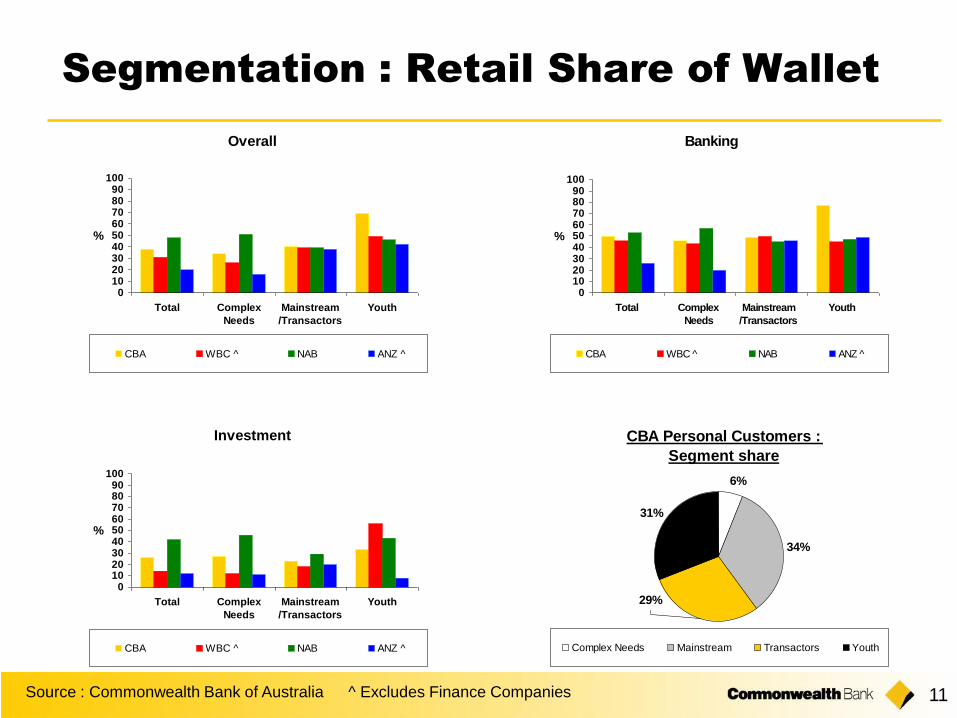
11
Banking
0102030405060708090
100
Total Complex
Needs
Mainstream
/Transactors
Youth
%
CBA WBC ^ NAB ANZ ^
Segmentation : Retail Share of Wallet
Investment
0102030405060708090
100
Total Complex
Needs
Mainstream
/Transactors
Youth
%
CBA WBC ^ NAB ANZ ^
CBA Personal Customers :
Segment share
6%
34%
31%
29%
Complex Needs Mainstream Transactors Youth
Overall
0102030405060708090
100
Total Complex
Needs
Mainstream
/Transactors
Youth
%
CBA WBC ^ NAB ANZ ^
Source : Commonwealth Bank of Australia ^ Excludes Finance Companies

12
Premium and Business Opportunity
Business (Middle Market)Premium Customers
Source : Commonwealth Bank illustration
Current number of premium customers
Potential number of premium customers
Current market share
Natural market share
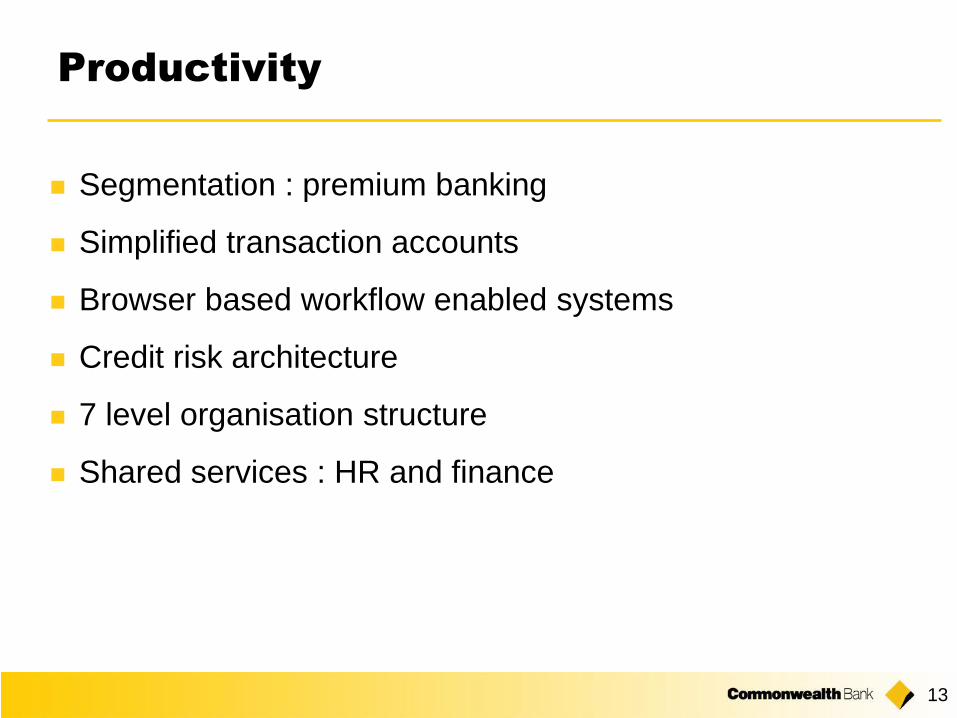
13
Segmentation : premium banking
Simplified transaction accounts
Browser based workflow enabled systems
Credit risk architecture
7 level organisation structure
Shared services : HR and finance
Productivity
Competitive Advantage
Scale
Brand
Risk Profile
Products and Businesses
Distribution
Innovation
People
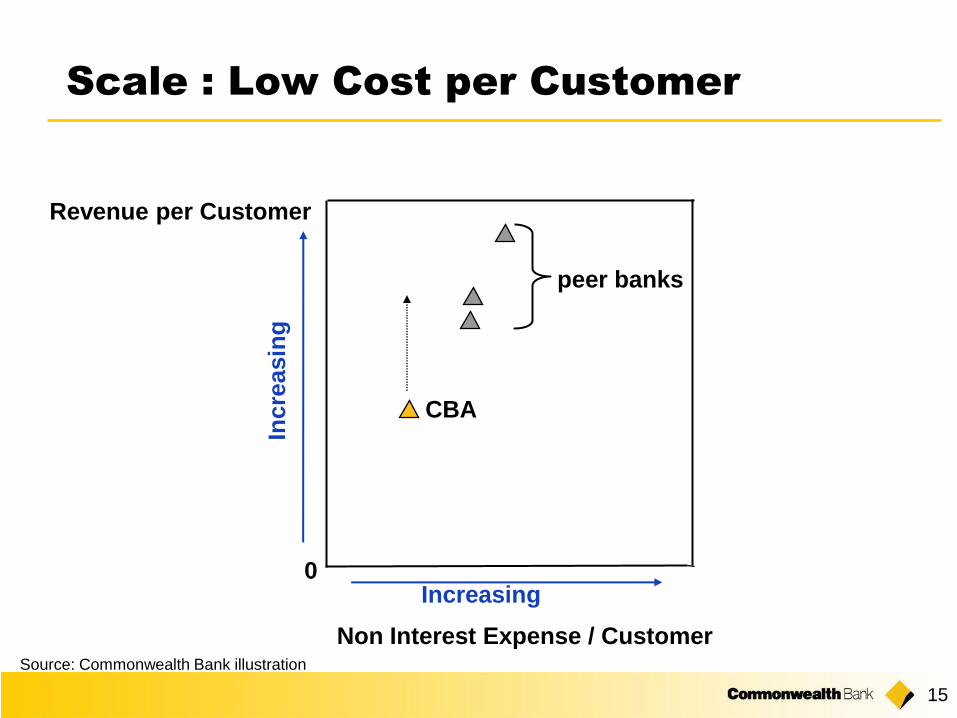
15
Scale : Low Cost per Customer
Non Interest Expense / CustomerSource: Commonwealth Bank illustration
Revenue per Customer
0
CBA
Increasing
Incre
asin
gpeer banks

16
Brand : Commonwealth Bank
Share of Mind*
68 71 6863
7065 63 66 65 64
68 6965 63 66
0
25
50
75
Sept Nov Jan
'01
Mar May Jul Sep Nov
(%)
CBA
Westpac
ANZ
NAB
• CBA’s share of mind remains at a consistent level, leading the Big Four.
• Share of mind for Westpac, ANZ and NAB continue to measure at similar
levels.
* Research International November 2001
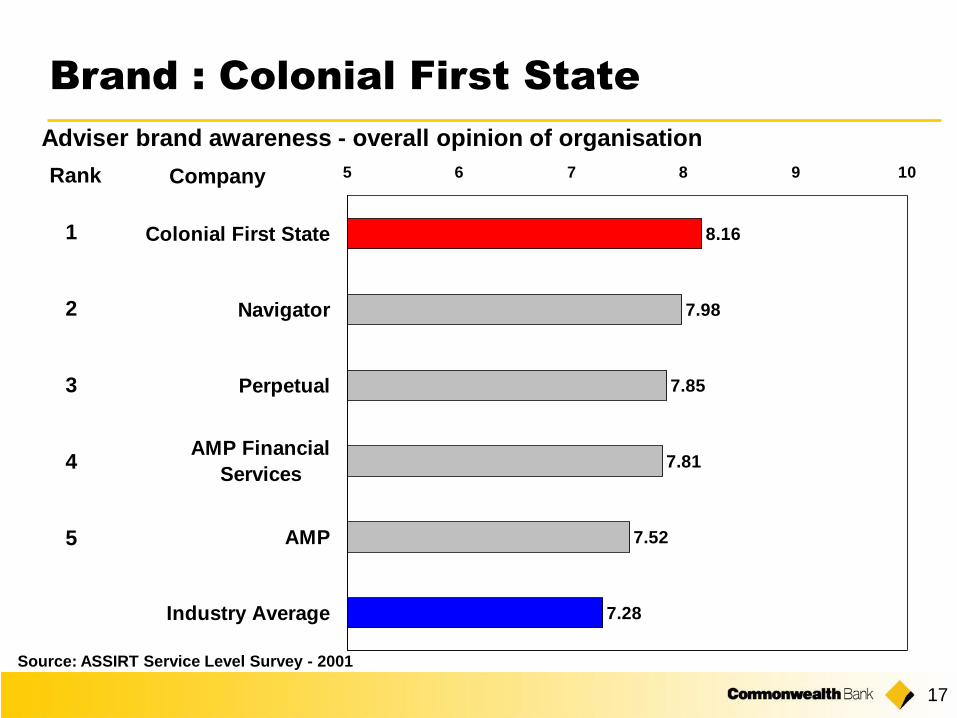
17
7.28
7.52
7.81
7.85
7.98
8.16
5 6 7 8 9 10
Industry Average
AMP
AMP Financial
Services
Perpetual
Navigator
Colonial First State
Rank Company
1
2
3
4
5
Source: ASSIRT Service Level Survey - 2001
Adviser brand awareness - overall opinion of organisation
Brand : Colonial First State

18
*Housing loan balances net of securitisation and includes Colonial
and home equity and similar facilities.
Housing Loan Portfolio
1997 1998 1999 2000 2001
Gross Loans 91,547 101,000 112,933 145,000 152,970
Home Loans Balances ($m) 43,383 47,410 52,646 70,738 73,511
As % of Gross Loans 47.4% 46.9% 46.6% 48.8% 48.1%
Housing Loan Arrears Rate
30/06/1999 30/06/2000* 31/12/2000* 30/06/2001 31/12/2001
Housing Loans Accruing Past
90 Days or More 182 211 247 218 168
Housing Loan Balances ($m) 52,646 70,738 71505 73,511 79,746
Arrears Rate % 0.35% 0.30% 0.35% 0.30% 0.21%
Risk Profile :
Proportion of Housing Loans
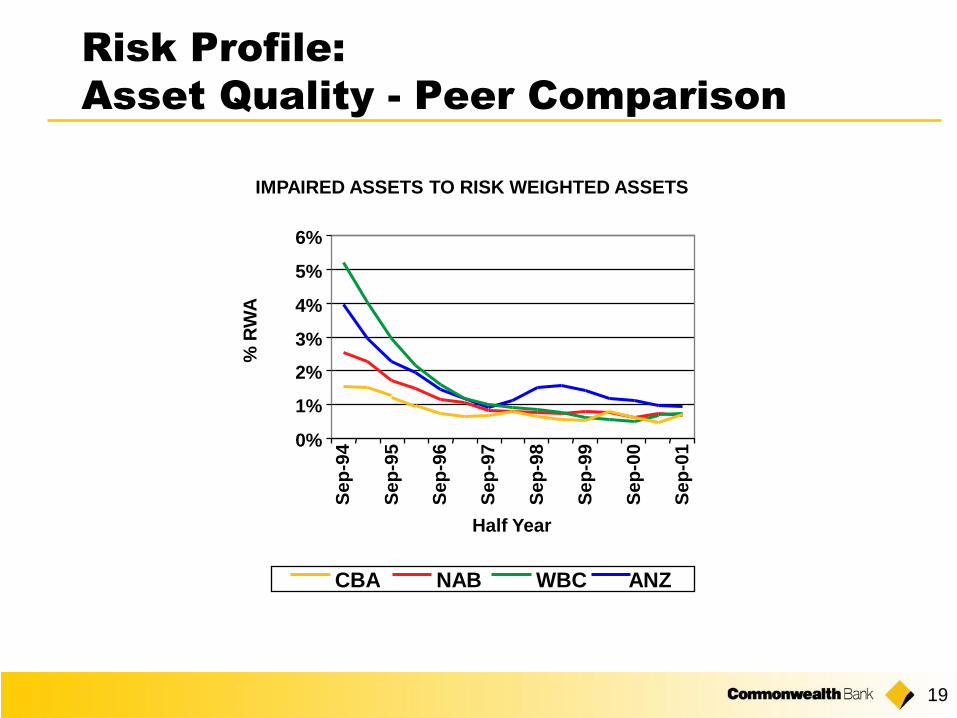
19
Risk Profile:
Asset Quality - Peer Comparison
IMPAIRED ASSETS TO RISK WEIGHTED ASSETS
0%
1%
2%
3%
4%
5%
6%
Sep
-94
Sep
-95
Sep
-96
Sep
-97
Sep
-98
Sep
-99
Sep
-00
Sep
-01
Half Year
% R
WA
ANZNAB WBCCBA
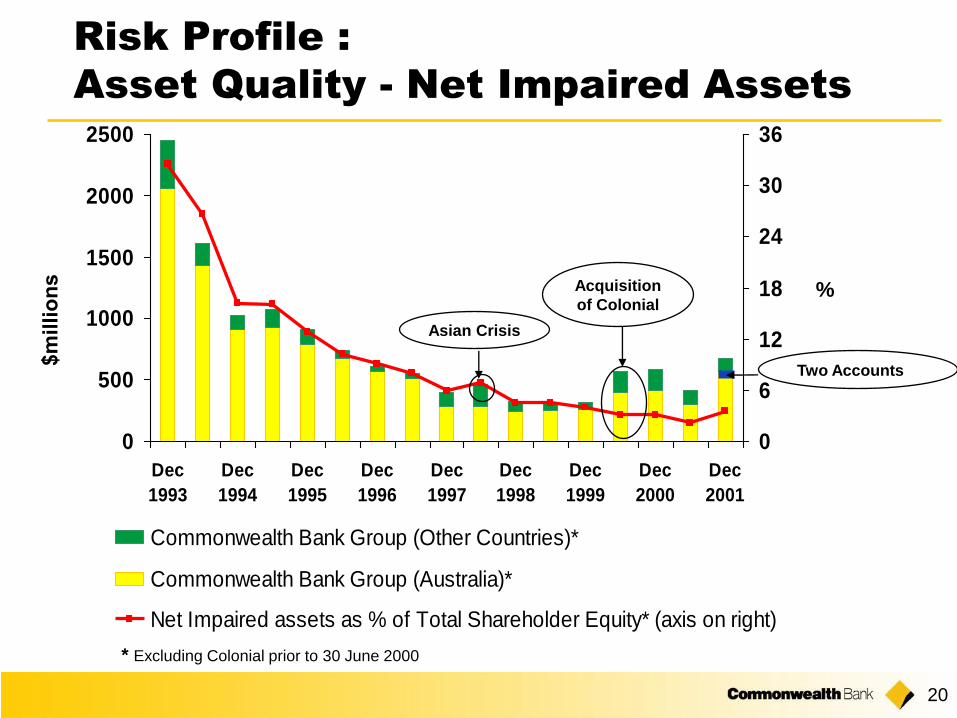
20
0
500
1000
1500
2000
2500
Dec
1993
Dec
1994
Dec
1995
Dec
1996
Dec
1997
Dec
1998
Dec
1999
Dec
2000
Dec
2001
0
6
12
18
24
30
36
%
Commonwealth Bank Group (Other Countries)*
Commonwealth Bank Group (Australia)*
Net Impaired assets as % of Total Shareholder Equity* (axis on right)
Risk Profile :
Asset Quality - Net Impaired Assets
* Excluding Colonial prior to 30 June 2000
Asian Crisis
Acquisition
of Colonial
Two Accounts
%
21
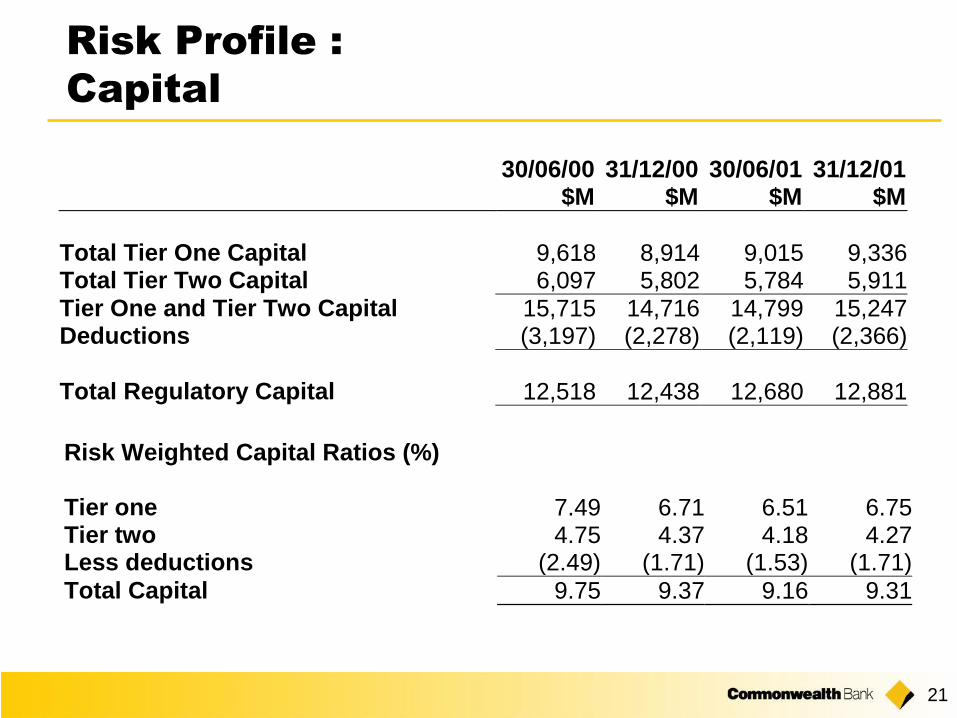
Risk Profile :
Capital
30/06/00 31/12/00 30/06/01 31/12/01$M $M $M $M
Total Tier One Capital 9,618 8,914 9,015 9,336Total Tier Two Capital 6,097 5,802 5,784 5,911Tier One and Tier Two Capital 15,715 14,716 14,799 15,247Deductions (3,197) (2,278) (2,119) (2,366)
Total Regulatory Capital 12,518 12,438 12,680 12,881
Risk Weighted Capital Ratios (%)
Tier one 7.49 6.71 6.51 6.75Tier two 4.75 4.37 4.18 4.27Less deductions (2.49) (1.71) (1.53) (1.71)
Total Capital 9.75 9.37 9.16 9.31
22
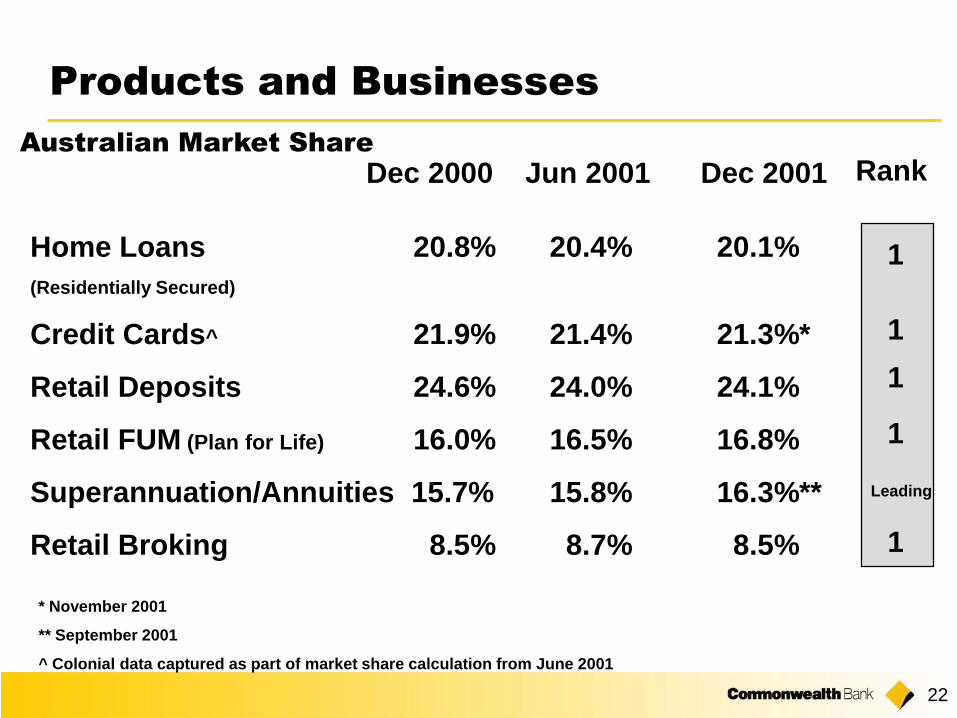
Dec 2000 Jun 2001 Dec 2001
Home Loans 20.8% 20.4% 20.1%
(Residentially Secured)
Credit Cards^ 21.9% 21.4% 21.3%*
Retail Deposits 24.6% 24.0% 24.1%
Retail FUM (Plan for Life) 16.0% 16.5% 16.8%
Superannuation/Annuities 15.7% 15.8% 16.3%**
Retail Broking 8.5% 8.7% 8.5%
* November 2001
** September 2001
^ Colonial data captured as part of market share calculation from June 2001
Australian Market Share
Products and Businesses
Rank
1
1
1
1
1
Leading
23
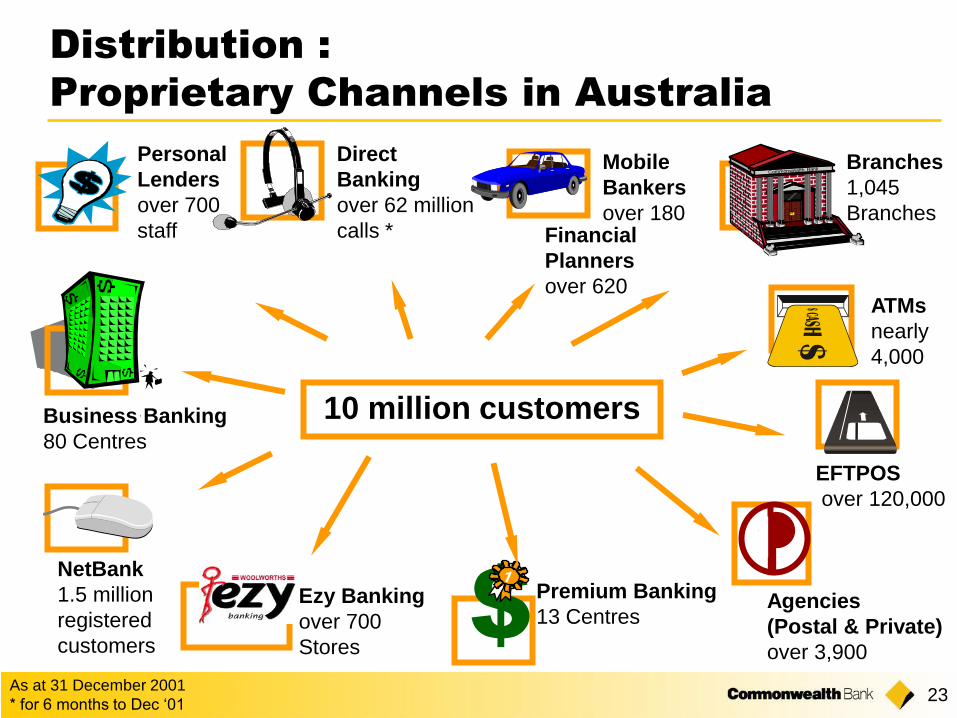
Distribution :
Proprietary Channels in Australia
10 million customers
$
Personal
Lenders
over 700
staff
Direct
Banking
over 62 million
calls *
Branches
1,045
Branches
ATMs
nearly
4,000
Premium Banking
13 CentresEzy Banking
over 700
Stores
NetBank
1.5 million
registered
customers
Business Banking
80 Centres
Agencies
(Postal & Private)
over 3,900
Mobile
Bankers
over 180
As at 31 December 2001
* for 6 months to Dec „01
EFTPOS
over 120,000
Financial
Planners
over 620
24
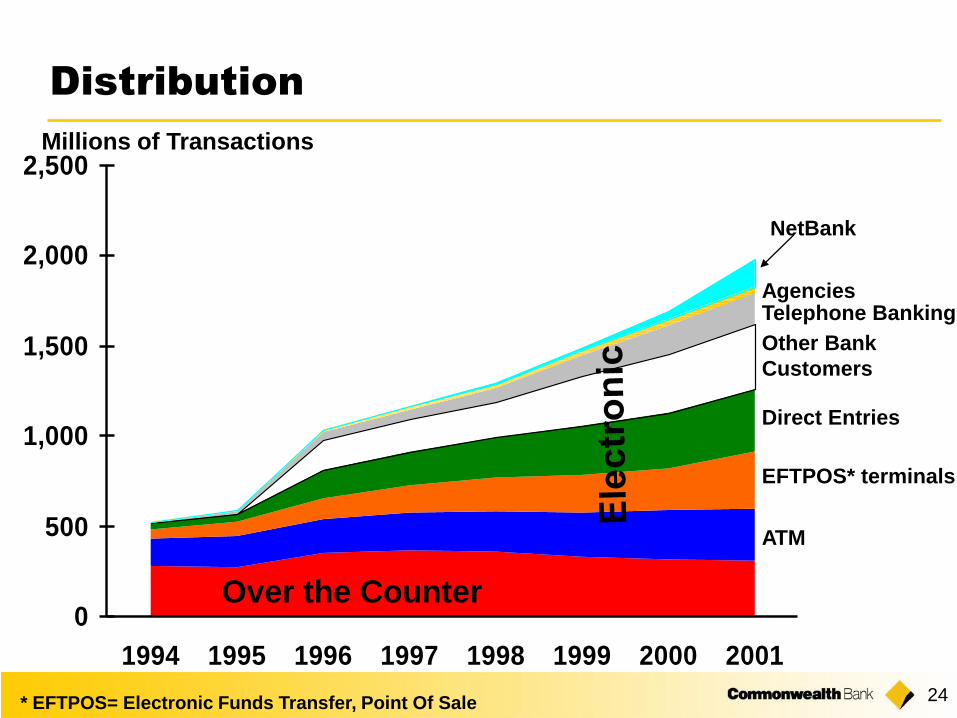
Distribution
0
500
1,000
1,500
2,000
2,500
1994 1995 1996 1997 1998 1999 2000 2001
Over the Counter
Millions of Transactions
ATM
NetBank
Direct Entries
Telephone Banking
EFTPOS* terminals
Agencies
Other Bank
Customers
* EFTPOS= Electronic Funds Transfer, Point Of Sale
25
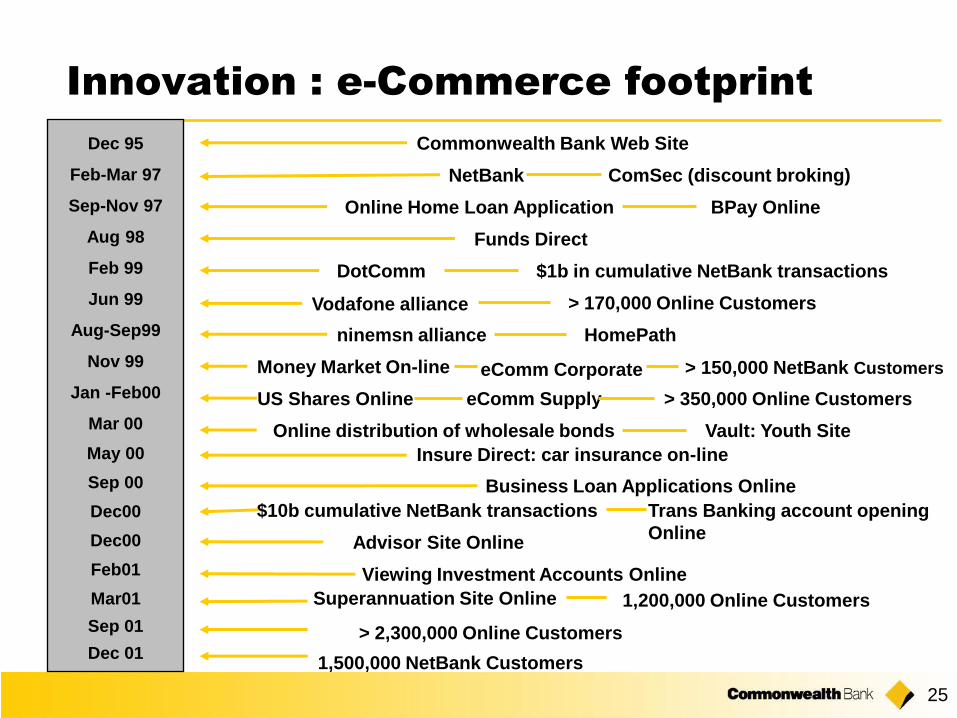
Innovation : e-Commerce footprint
NetBank ComSec (discount broking)
Online Home Loan Application BPay Online
Commonwealth Bank Web Site
Funds Direct
$1b in cumulative NetBank transactionsDotComm
> 170,000 Online CustomersVodafone alliance
ninemsn alliance HomePath
Dec 95
Feb-Mar 97
Sep-Nov 97
Aug 98
Feb 99
Jun 99
Aug-Sep99
Nov 99
Jan -Feb00
Mar 00
May 00
Sep 00
Dec00
Dec00
Feb01
Mar01
Sep 01
Dec 01
eComm CorporateMoney Market On-line
US Shares Online eComm Supply > 350,000 Online Customers
Online distribution of wholesale bonds Vault: Youth Site
Business Loan Applications Online
Insure Direct: car insurance on-line
$10b cumulative NetBank transactions Trans Banking account opening
Online
Viewing Investment Accounts Online
Advisor Site Online
Superannuation Site Online 1,200,000 Online Customers
> 2,300,000 Online Customers
1,500,000 NetBank Customers
> 150,000 NetBank Customers
26
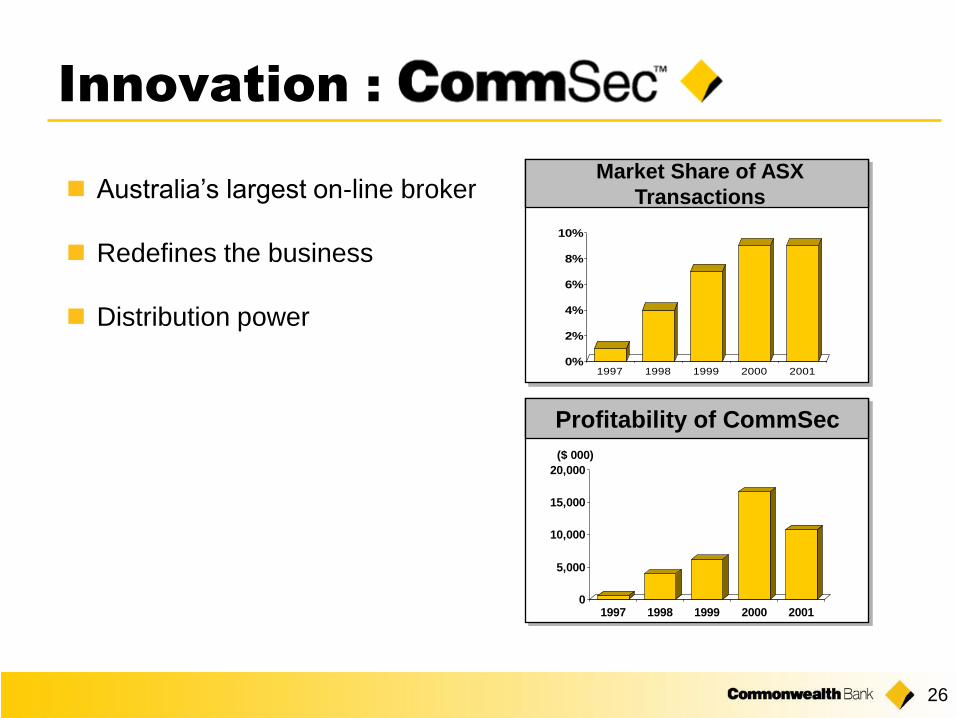
Innovation :
Market Share of ASX
Transactions
0%
2%
4%
6%
8%
10%
1997 1998 1999 2000 2001
0
5,000
10,000
15,000
20,000
($ 000)
1997 1998 1999 2000 2001
Profitability of CommSec
Australia‟s largest on-line broker
Redefines the business
Distribution power
27
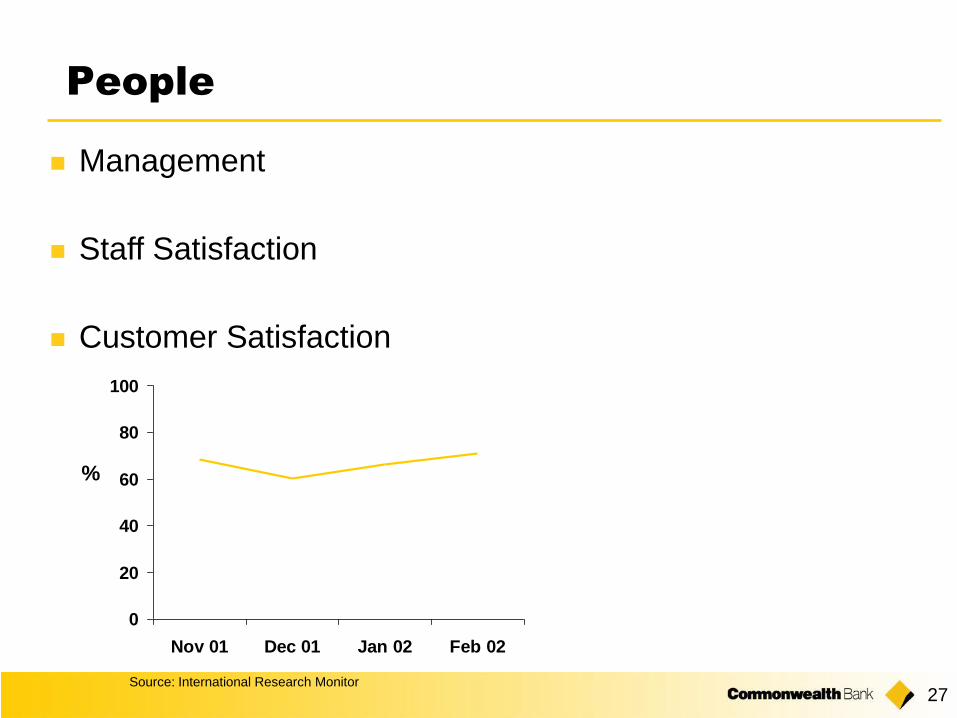
People
Management
Staff Satisfaction
Customer Satisfaction
0
20
40
60
80
100
Nov 01 Dec 01 Jan 02 Feb 02
Source: International Research Monitor
%
Summary
29
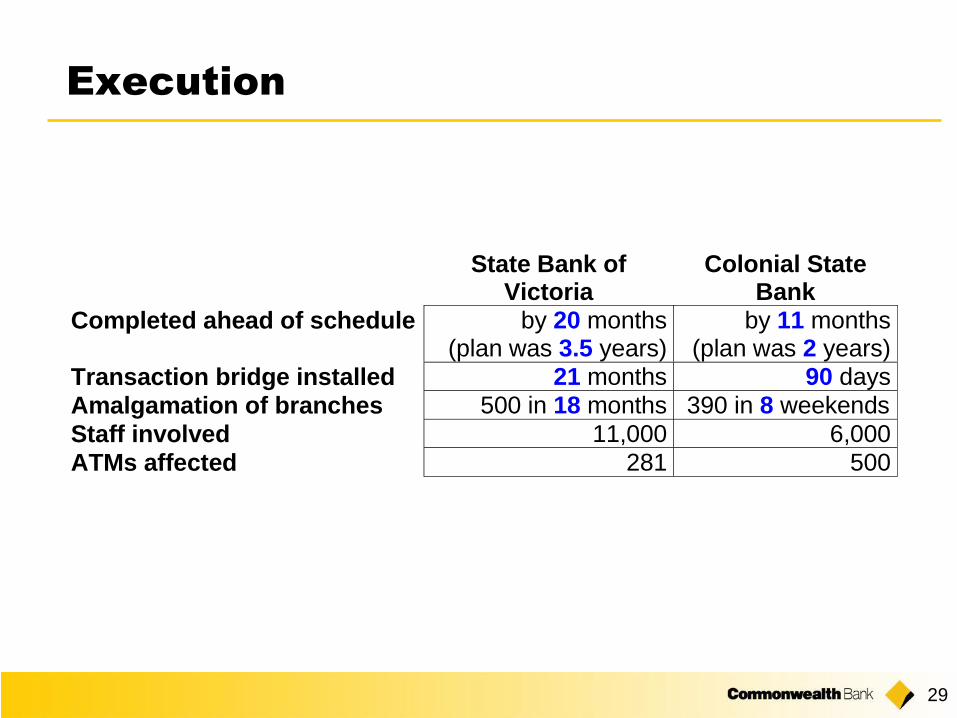
Execution
State Bank ofVictoria
Colonial StateBank
Completed ahead of schedule by 20 months(plan was 3.5 years)
by 11 months(plan was 2 years)
Transaction bridge installed 21 months 90 days
Amalgamation of branches 500 in 18 months 390 in 8 weekends
Staff involved 11,000 6,000
ATMs affected 281 500

30
Summary
Where to ?
– Segmentation
– Productivity
From What Base?– Scale
– Brand
– Risk Profile
– Products and Businesses
– Distribution
– Innovation
– People
How?
– Execution

Credit Suisse First Boston
2002 Asian Investment Conference
Stuart Grimshaw
Group General Manager Financial and Risk Management
21 March 2002
www.commbank.com.au