cruise report - eprints.uni-kiel.deeprints.uni-kiel.de/14384/1/al240_report.pdfchapter 2 scientic...
TRANSCRIPT

Cruise ReportF.S. ALKOR Cruise No. 240
Dates of Cruise: 29.06. to 02.07.2004
Projects:BASEWECS
andStudent course in phys. oceanogr.
Areas of Research: Physical oceanographyPort Calls: Warnemunde (29.06.; 01.07) and Sassnitz (30.06.)Institute: IFM-GEOMAR Leibniz-Institut fur Meereswissenschaften an derUniversitat KielChief Scientist: Dr. Johannes KarstensenNumber of Scientists: 16
1
Contents
1 Scientific peronal 3
2 Scientific Background 4
3 Cruise Narrative 5
4 Preliminary results 84.1 Mooring V431: seventh deployment period . . . . . . . . . . . . . . . . . . . . 84.2 Meteorological observations . . . . . . . . . . . . . . . . . . . . . . . . . . . . 104.3 Hydrographic conditions along section C and L . . . . . . . . . . . . . . . . . . 11
4.3.1 CTD - Measurements . . . . . . . . . . . . . . . . . . . . . . . . . . . . 114.3.2 ADCP - current profiles . . . . . . . . . . . . . . . . . . . . . . . . . . 14
5 Equipment/instruments 155.1 CTD/Rosette and Salinometer . . . . . . . . . . . . . . . . . . . . . . . . . . . 155.2 Underway Measurements . . . . . . . . . . . . . . . . . . . . . . . . . . . . . . 17
5.2.1 Datadis . . . . . . . . . . . . . . . . . . . . . . . . . . . . . . . . . . . 175.2.2 Navigation . . . . . . . . . . . . . . . . . . . . . . . . . . . . . . . . . 185.2.3 Meteorological Data . . . . . . . . . . . . . . . . . . . . . . . . . . . . 185.2.4 Echo sounder . . . . . . . . . . . . . . . . . . . . . . . . . . . . . . . . 185.2.5 Thermosalinograph . . . . . . . . . . . . . . . . . . . . . . . . . . . . . 185.2.6 Vessel mounted ADCP . . . . . . . . . . . . . . . . . . . . . . . . . . . 18
6 Acknowledgment 19
7 Appendix 20
2
Chapter 1
Scientific peronal
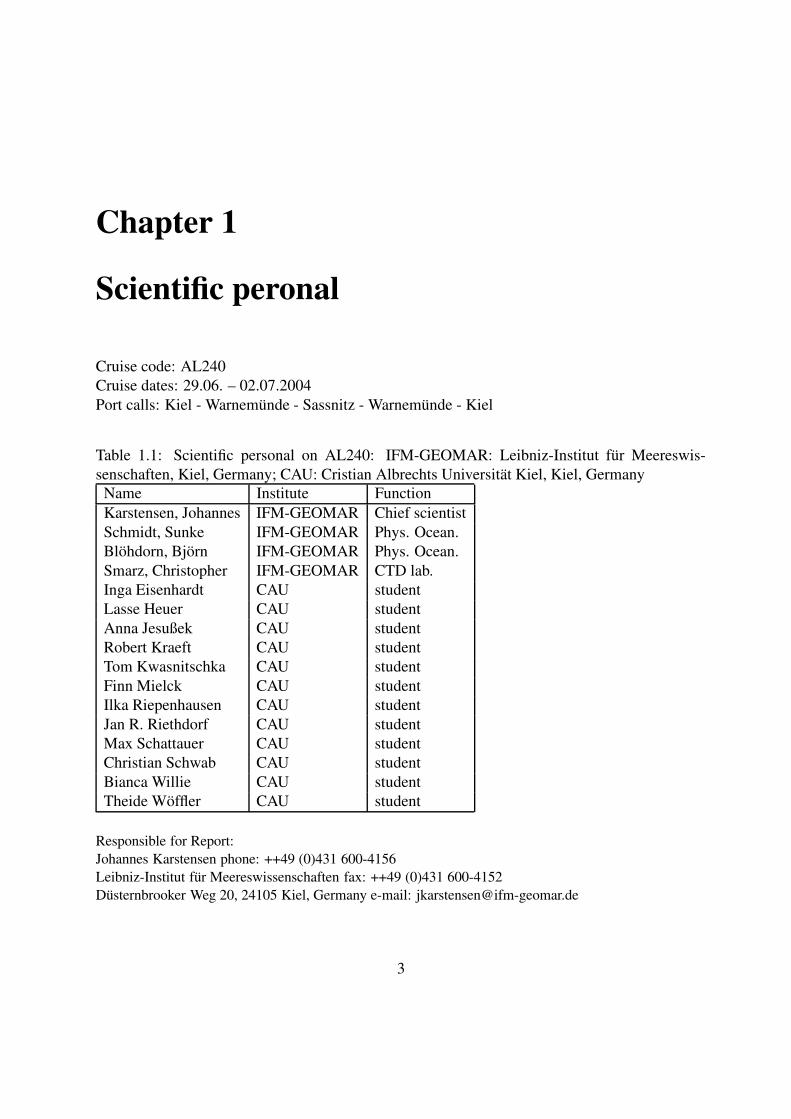
Cruise code: AL240Cruise dates: 29.06. – 02.07.2004Port calls: Kiel - Warnemunde - Sassnitz - Warnemunde - Kiel
Table 1.1: Scientific personal on AL240: IFM-GEOMAR: Leibniz-Institut fur Meereswis-senschaften, Kiel, Germany; CAU: Cristian Albrechts Universitat Kiel, Kiel, Germany
Name Institute FunctionKarstensen, Johannes IFM-GEOMAR Chief scientistSchmidt, Sunke IFM-GEOMAR Phys. Ocean.Blohdorn, Bjorn IFM-GEOMAR Phys. Ocean.Smarz, Christopher IFM-GEOMAR CTD lab.Inga Eisenhardt CAU studentLasse Heuer CAU studentAnna Jesußek CAU studentRobert Kraeft CAU studentTom Kwasnitschka CAU studentFinn Mielck CAU studentIlka Riepenhausen CAU studentJan R. Riethdorf CAU studentMax Schattauer CAU studentChristian Schwab CAU studentBianca Willie CAU studentTheide Woffler CAU student
Responsible for Report:Johannes Karstensen phone: ++49 (0)431 600-4156Leibniz-Institut fur Meereswissenschaften fax: ++49 (0)431 600-4152Dusternbrooker Weg 20, 24105 Kiel, Germany e-mail: [email protected]
3
Chapter 2
Scientific Background
ALKOR cruise AL240 was four day cruise. It was the second of three cruises in 2004 in theframework of the BMBF project Baltic Sea Water and Energy Cycle Study (BASEWECS), sub-project C (grant#. 01LD0025). The purpose of the cruises is to obtain a rather synoptic pictureof the property distribution and velocities in the western Baltic and to maintain a mooring site atthe southeastern opening of the Fehmarn Belt.
In general two section are occupied: one section crossing the Fehmarnbelt (section ’C’) andone section following the deepest topography from about 10
�40 E to 14
�21 E (section ’L’). Along
both sections CTD/rosette sampling is performed as well as continuously recording of currentvelocities using a vessel mounted ADCP. Mooring site (V431) is maintained, located at the south-eastern opening of the Fehmarn Belt. The mooring consists of a Workhorse-ADCP (300 kHz),and a self containing CTD (Type MicoCat) mounted in a commercial shield (Flotation Technol-ogy). During AL240 an additional meridional section (although occupied during AL 229) wasoccupied in the eastern Mecklenburger Bucht.
Besides the scientific motivation, the cruises are utilized for educational purposes. Under-graduate students are introduced into modern observational techniques of physical oceanogra-phy, basics in instrument calibration and interpretation of the observations. In addition it shouldgive the students to experience the work and life at sea in general and last but not least to ex-plore/investigate the Baltic Sea, the ’ocean’ at their back-yard. As 16 scientists (including 12students) where on board during the cruise, a port call every night was necessary to allow fourpersons to sleep a shore.
4
Chapter 3
Cruise Narrative
10°00’E 10°30’ 11°00’ 11°30’ 12°00’ 12°30’ 13°00’ 13°30’ 14°00’ 14°30’E
54°00’N
54°30’
55°00’
55°30’N
CTD−Stations 29.Jun−02.Jul 2004
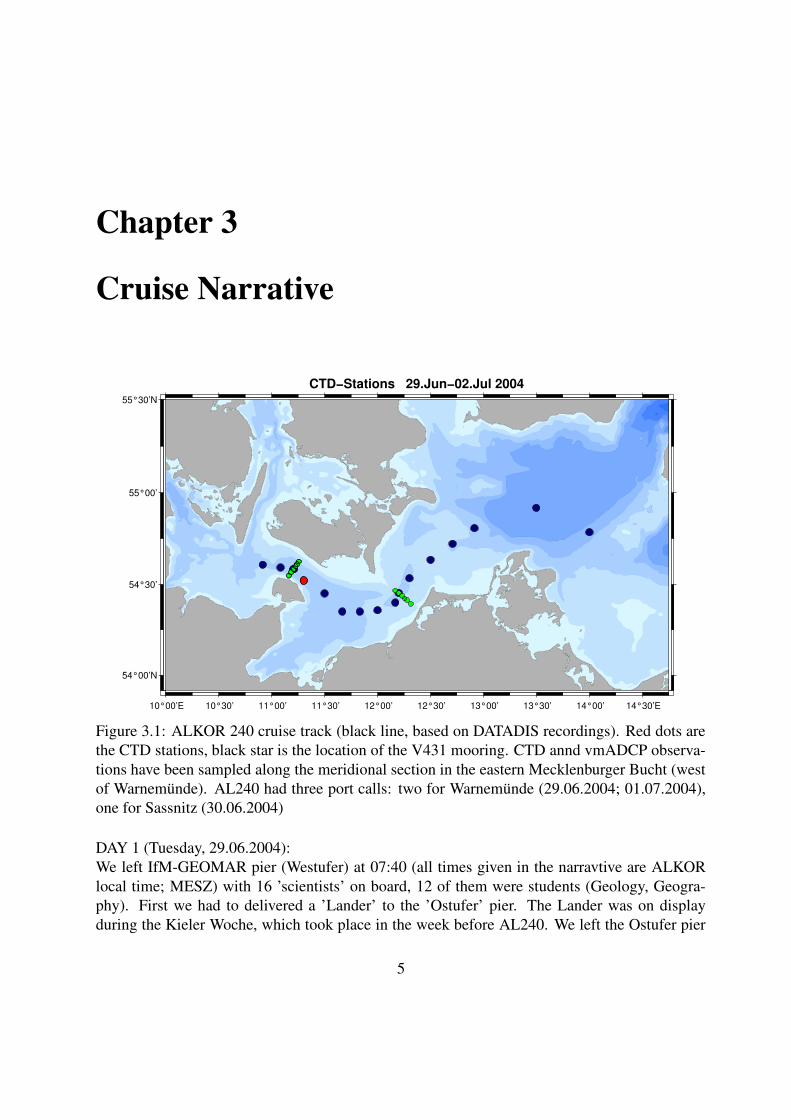
Figure 3.1: ALKOR 240 cruise track (black line, based on DATADIS recordings). Red dots arethe CTD stations, black star is the location of the V431 mooring. CTD annd vmADCP observa-tions have been sampled along the meridional section in the eastern Mecklenburger Bucht (westof Warnemunde). AL240 had three port calls: two for Warnemunde (29.06.2004; 01.07.2004),one for Sassnitz (30.06.2004)
DAY 1 (Tuesday, 29.06.2004):We left IfM-GEOMAR pier (Westufer) at 07:40 (all times given in the narravtive are ALKORlocal time; MESZ) with 16 ’scientists’ on board, 12 of them were students (Geology, Geogra-phy). First we had to delivered a ’Lander’ to the ’Ostufer’ pier. The Lander was on displayduring the Kieler Woche, which took place in the week before AL240. We left the Ostufer pier
5

at 08:15 and headed for the first station which is also the western most station of the ’L’ section.The equipment was set-up on the day before the cruise (hull mounting of ADCP, intallation ofcomputer). The first officer (Andreas Pooker) gave an introduction into savetey on board to the12 students. Then a brief introduction into the program for the next 4 days was given by the chiefscientist. After sampling two CTD stations along ’L’ we reached the southern most station onthe ’C’ section, crossing the Fehmarnbelt. The CTD section to the north was followed from aADCP section to the south. Finishing the section, we headed for the V431 mooring at the south-eastern opening of the Fehmarnbelt. At 16:30 and about 0.2 nm away from the nominal positionof the mooring the release code was transmitted but the mooring did not appear on the surfaceimmediately. Several trial with the hydrophone in different depth weren’t successful either. Un-fortunately, the releaser used in the mooring is not able to send a respond signal. Finally thehydrophone was lowered immediately under the surface and the mooring appeared. A final CTDcast was performed at the mooring site as part of the L-section and for calibration purposes. Weleft immediately for port call at Warnemunde. Warnemunde Passagierkai was reached at about21:00 and after customs clearance four students left for the Jugendherberge as not enough cabinsare available for the 16 persons of the scientific crew (ALKOR has only space for 12 scientists).
DAY 2 (Wednesday, 30.06.2004):At 06:40 the students who slept in the Jugendherberge were back on board the ALKOR and weleft Warnemunde heading to complete the ’L’ section. The first station was order 12 nm away.The weather cleared and it was was a sunny day with virtually no wind. During the whole day wemade CTD cast, recordings of meteorological parameters, and analyzing bottle samples from thefirst day using the Beckman salinometer. We reached Sassnitz at 18:00 and after costume clear-ance 4 students again left for a hotel. The nightlife in Sassnitz was dominated by the quarter-finalof the European championship in soccer Portugal:Netherlands (2:1). It was a nice celebration inparticular as one of the seaman was Portuguese.
DAY 3 (Thursday, 01.07.2004):We left again Sassnitz relatively early (06:50) and headed for the Kadett-Ridge to start a sectionthere at 13:00. During transit meteorological observations were made every half hour and furthersalinometer work on the bottle samples were conducted. At Kadett-Ridge we made 6 stationscrossing the ridge. The captain and the officers did a great job during the probing as traffic isquite heavy. After the CTD section crossing the Kadett-Ridge we made a repeat section acquir-ing ADCP data with constant 8 kn speed. Than we headed for our second visit at Warnemundeport. At 18:30 we reached the Industrial port of Warnemunde as the Passagierkai was occupiedby cruise ships. Four student left for a hotel (Jugendherberge was too far away from the pier).
DAY 4 (Friday, 02.07.2004):The last day of the cruise. At 6:30 the four students which had to sleep on land were back onthe vessel and we left port Warnemunde at 7:00 heading for the Praktikumsstation 14 (part ofthe ’L’ section). After occupying a number of CTD stations we completed the ’L’ section andapproached the military zone of Marienleuchte at 11:50. The assembled shield mooring wasre-deployed at 10:38 at position 54
�31.343’ N/ 11
�18.223’ E for the 8th deployment period. A
6
calibration CTD cast was performed after deployment. A second hydrographic and vmADCPoccupation of the Fehmarn Belt section (’C’) followed. This was the end of the scientific pro-gram. During transit to Kiel the equipment was packed for demobilization and some administra-tive matters were cleared. We reached IfM Pier (Westufer) at 18:00 immediately unloading theequipment.
7

Chapter 4
Preliminary results
4.1 Mooring V431: seventh deployment periodTemperature and conductivity (salinity) near the bottom are variable and follow the warmingtrend of the spring season summer (with a certain time lag). A noticeable feature is the suddenincrease in salinity at the end of April 2004.
Jul Sep Nov Jan Mar May Jul Sep Nov Jan Mar May Jul0
5
10
15
20
2002 2003 2004| |
tem
pera
ture
V 435 mooring MicroCat
1st deploy.
2nd deploy.
3rd deploy. 4th deploy. 5th deploy.6th deploy.
7th deploy.
Jul Sep Nov Jan Mar May Jul Sep Nov Jan Mar May Jul
15
20
25
30
salin
ity
2002 2003 2004| |
Figure 4.1: Mooring V431: Temperature (upper) and salinity (lower) at 28m depth for all V431deployment periods.
8
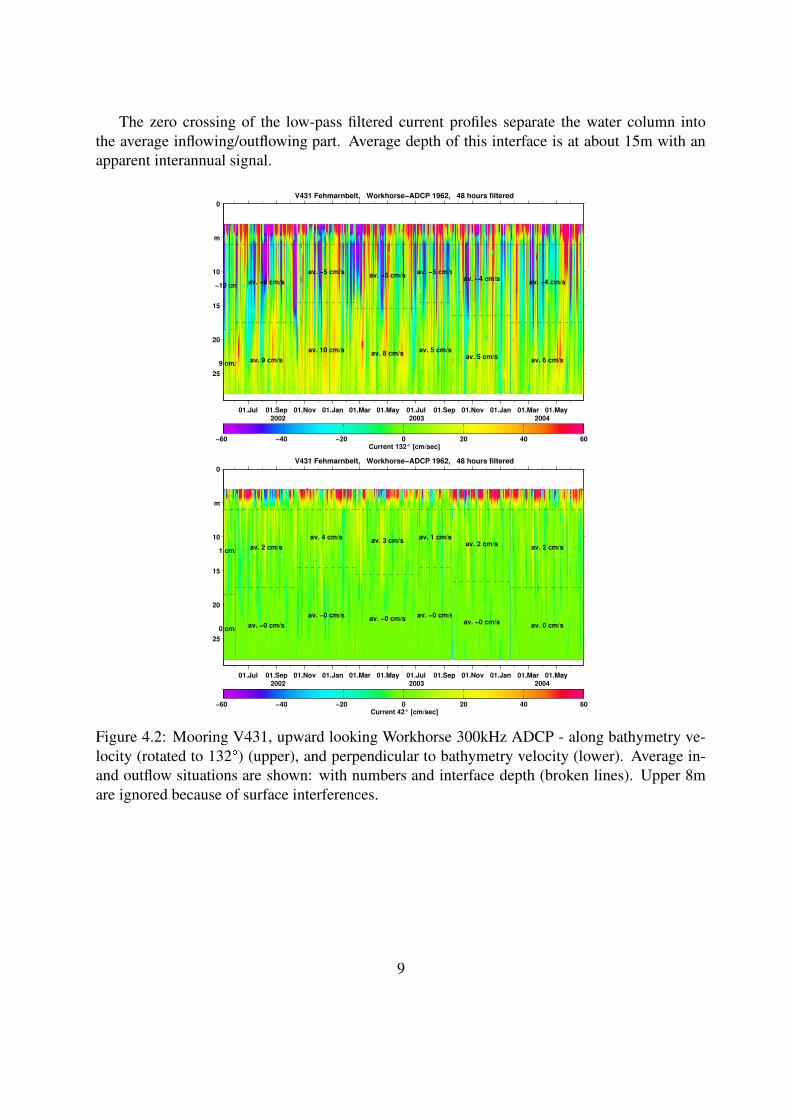
The zero crossing of the low-pass filtered current profiles separate the water column intothe average inflowing/outflowing part. Average depth of this interface is at about 15m with anapparent interannual signal.
01.Jul 01.Sep 01.Nov 01.Jan 01.Mar 01.May 01.Jul 01.Sep 01.Nov 01.Jan 01.Mar 01.May2002 2003 2004
V431 Fehmarnbelt, Workhorse−ADCP 1962, 48 hours filtered
9 cm/s
−10 cm/s
av. 9 cm/s
av. −8 cm/s
av. 10 cm/s
av. −5 cm/s
av. 8 cm/s
av. −5 cm/s
av. 5 cm/s
av. −5 cm/s
av. 5 cm/s
av. −4 cm/s
av. 6 cm/s
av. −4 cm/s
0
m
10
15
20
25
Current 132° [cm/sec]−60 −40 −20 0 20 40 60
01.Jul 01.Sep 01.Nov 01.Jan 01.Mar 01.May 01.Jul 01.Sep 01.Nov 01.Jan 01.Mar 01.May2002 2003 2004
V431 Fehmarnbelt, Workhorse−ADCP 1962, 48 hours filtered
0 cm/s
1 cm/s
av. −0 cm/s
av. 2 cm/s
av. −0 cm/s
av. 4 cm/s
av. −0 cm/s
av. 3 cm/s
av. −0 cm/s
av. 1 cm/s
av. −0 cm/s
av. 2 cm/s
av. 0 cm/s
av. 2 cm/s
0
m
10
15
20
25
Current 42° [cm/sec]−60 −40 −20 0 20 40 60
Figure 4.2: Mooring V431, upward looking Workhorse 300kHz ADCP - along bathymetry ve-locity (rotated to 132
�) (upper), and perpendicular to bathymetry velocity (lower). Average in-
and outflow situations are shown: with numbers and interface depth (broken lines). Upper 8mare ignored because of surface interferences.
9

4.2 Meteorological observationsThe weather situation during the four days of our cruise (figure 4.3) was dominated by weakwesterly wind. A low pressure system developed east of Island and moved westward. Air tem-perature was around 20
�C.
Figure 4.3: Air pressure distribution over Europe from 29. June to 2. July 2004 (figures fromUK Met Office).
10
4.3 Hydrographic conditions along section C and L
4.3.1 CTD - MeasurementsC section (Fehmarnbelt)
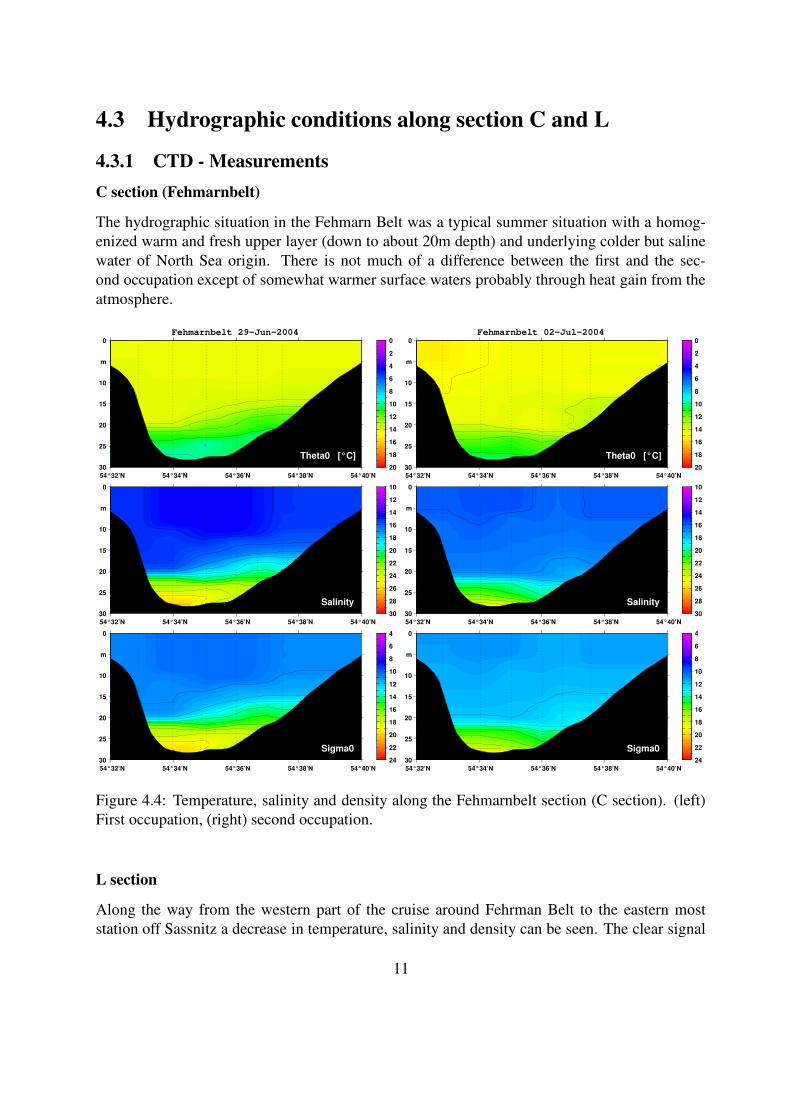
The hydrographic situation in the Fehmarn Belt was a typical summer situation with a homog-enized warm and fresh upper layer (down to about 20m depth) and underlying colder but salinewater of North Sea origin. There is not much of a difference between the first and the sec-ond occupation except of somewhat warmer surface waters probably through heat gain from theatmosphere.
Theta0 [°C]
Fehmarnbelt 29−Jun−2004
54°32’N 54°34’N 54°36’N 54°38’N 54°40’N
0
m
10
15
20
25
30
0
2
4
6
8
10
12
14
16
18
20
Salinity
54°32’N 54°34’N 54°36’N 54°38’N 54°40’N
0
m
10
15
20
25
30
10
12
14
16
18
20
22
24
26
28
30
Sigma0
54°32’N 54°34’N 54°36’N 54°38’N 54°40’N
0
m
10
15
20
25
30
4
6
8
10
12
14
16
18
20
22
24
Theta0 [°C]
Fehmarnbelt 02−Jul−2004
54°32’N 54°34’N 54°36’N 54°38’N 54°40’N
0
m
10
15
20
25
30
0
2
4
6
8
10
12
14
16
18
20
Salinity
54°32’N 54°34’N 54°36’N 54°38’N 54°40’N
0
m
10
15
20
25
30
10
12
14
16
18
20
22
24
26
28
30
Sigma0
54°32’N 54°34’N 54°36’N 54°38’N 54°40’N
0
m
10
15
20
25
30
4
6
8
10
12
14
16
18
20
22
24
Figure 4.4: Temperature, salinity and density along the Fehmarnbelt section (C section). (left)First occupation, (right) second occupation.
L section
Along the way from the western part of the cruise around Fehrman Belt to the eastern moststation off Sassnitz a decrease in temperature, salinity and density can be seen. The clear signal
11

of water with North Sea origin can be identified all along the bottom. An intrusion of colderwater at mid-depth (order 20 to 30m) can be see in the Arkona Basin.
Theta0 [°C]
Fehmarnbelt − ArkonaBasin, 29.Jun−02.Jul 2004
11°00’N 11°30’N 12°00’N 12°30’N 13°00’N 13°30’N
0
m
20
30
40
50
0
2
4
6
8
10
12
14
16
18
20
Salinity
11°00’N 11°30’N 12°00’N 12°30’N 13°00’N 13°30’N
0
m
20
30
40
50
6
8
10
12
14
16
18
20
22
24
Sigma0
11°00’N 11°30’N 12°00’N 12°30’N 13°00’N 13°30’N
0
m
20
30
40
50
4
6
8
10
12
14
16
18
20
22
24
Figure 4.5: Temperature, salinity and density along the zonal section (L section).
12

Kadett Ridge section
Crossing the Kadett Ridge quite one can identify the North Sea Water signal from the salin-ity stratification. However, the vertical gradients are diminished compared to the Fehmarnbeltsection. Overall the salinity is much lower than in the Fehrmanbelt section.
Theta0 [°C]
KadettRinne 01−Jul−2004
54°23’N 54°24’N 54°25’N 54°26’N 54°27’N 54°28’N 54°29’N
0
m
10
15
20
25
30
0
2
4
6
8
10
12
14
16
18
20
Salinity
54°23’N 54°24’N 54°25’N 54°26’N 54°27’N 54°28’N 54°29’N
0
m
10
15
20
25
30
10
12
14
16
18
20
22
24
26
28
30
Sigma0
54°23’N 54°24’N 54°25’N 54°26’N 54°27’N 54°28’N 54°29’N
0
m
10
15
20
25
30
4
6
8
10
12
14
16
18
20
22
24
Figure 4.6: Temperature, salinity and density section Fehmarnbelt (C section). (left) First occu-pation, (right) second occupation.
13

4.3.2 ADCP - current profilesDuring the cruise there were no heading information recorded in the appropriate files and headinginformation which is needed to process the data have been retrieved form the DATADIS data.However, allocating the right heading to the ADCP sample was tricky as there where in additioncertain synchronization problem between the ADCP clock and the DATADIS clock.
Both occupation of the Fehmarnbelt (C section) showed outflowing water more or less overthe whole section. No core of the inflowing water at the bottom , which is typically found, canbe seen.
54.55°N 54.57°N 54.59°N 54.61°N
0
5
10
15
20
25
30
Dep
th (m
)
Current 145° degree rotated
curr
ent [
cm/s
ec]
−50
−40
−30
−20
−10
0
10
20
30
40
50
54.55°N 54.57°N 54.59°N 54.61°N
0
5
10
15
20
25
30
Dep
th (m
)
Current 145° degree rotated
curr
ent [
cm/s
ec]
−50
−40
−30
−20
−10
0
10
20
30
40
50
Figure 4.7: Currents (roatated to align with the bathymetry (145�) in Fehmarnbelt (C section).
(left) First occupation, (right) second occupation.
The Kadett ridge section shows eastward flow at depth, probably associated with the spread-ing of high salinity water of North Sea origin.
54.4°N 54.42°N 54.44°N 54.46°N
0
5
10
15
20
25
30
Dep
th (m
)
Eastward current
curr
ent [
cm/s
ec]
−50
−40
−30
−20
−10
0
10
20
30
40
50
Figure 4.8: Eastward currents for Kadett Ridge section.
14
Chapter 5
Equipment/instruments
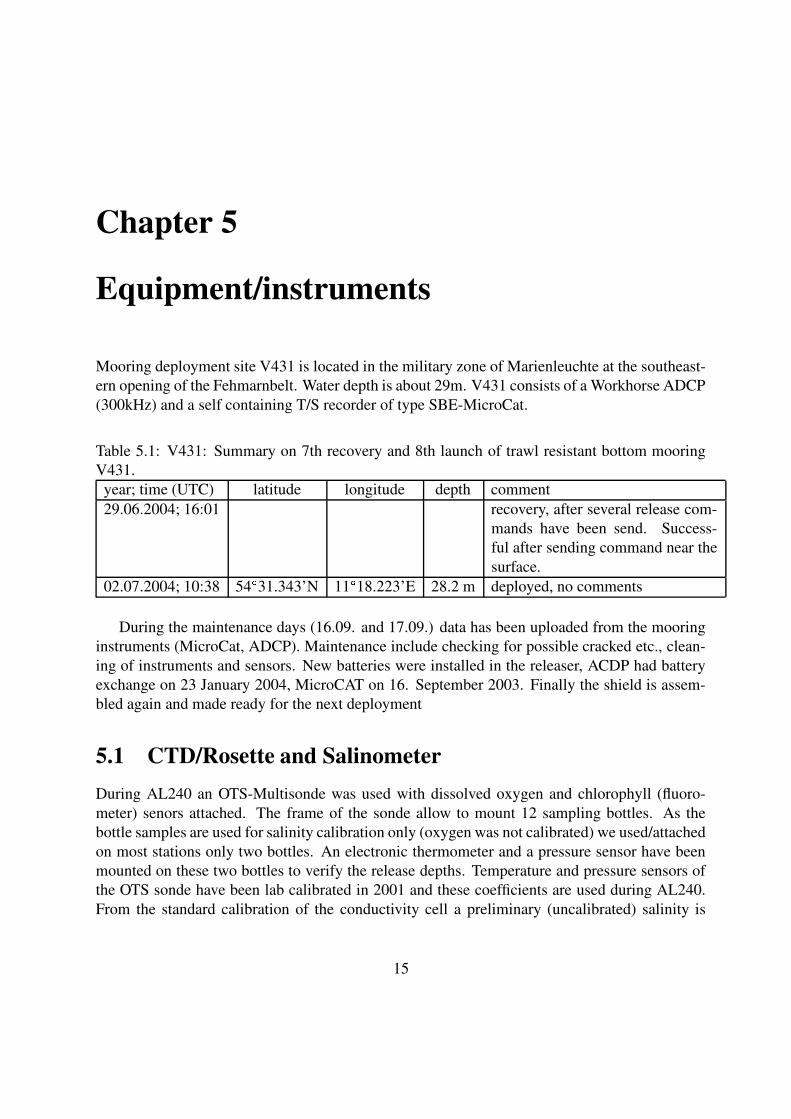
Mooring deployment site V431 is located in the military zone of Marienleuchte at the southeast-ern opening of the Fehmarnbelt. Water depth is about 29m. V431 consists of a Workhorse ADCP(300kHz) and a self containing T/S recorder of type SBE-MicroCat.
Table 5.1: V431: Summary on 7th recovery and 8th launch of trawl resistant bottom mooringV431.
year; time (UTC) latitude longitude depth comment29.06.2004; 16:01 recovery, after several release com-
mands have been send. Success-ful after sending command near thesurface.
02.07.2004; 10:38 54�31.343’N 11
�18.223’E 28.2 m deployed, no comments
During the maintenance days (16.09. and 17.09.) data has been uploaded from the mooringinstruments (MicroCat, ADCP). Maintenance include checking for possible cracked etc., clean-ing of instruments and sensors. New batteries were installed in the releaser, ACDP had batteryexchange on 23 January 2004, MicroCAT on 16. September 2003. Finally the shield is assem-bled again and made ready for the next deployment
5.1 CTD/Rosette and SalinometerDuring AL240 an OTS-Multisonde was used with dissolved oxygen and chlorophyll (fluoro-meter) senors attached. The frame of the sonde allow to mount 12 sampling bottles. As thebottle samples are used for salinity calibration only (oxygen was not calibrated) we used/attachedon most stations only two bottles. An electronic thermometer and a pressure sensor have beenmounted on these two bottles to verify the release depths. Temperature and pressure sensors ofthe OTS sonde have been lab calibrated in 2001 and these coefficients are used during AL240.From the standard calibration of the conductivity cell a preliminary (uncalibrated) salinity is
15

calculated. The salinity is later calibrated using the bottle samples salinities measure with aBeckman type salinometer.
The thermosalinograph is an automated sea surface temperature and salinity measurementsystem. The measurements are made on board and the ship uses a water intake. A conductivitycell and a thermistor cell provide conductivity and temperature measurements. Salinity is derivedfrom these two parameters conductivity and temperature. The ship’s position is given by a GPS.A computer makes the data acquisition, data processing, recording, and controls the real-timetransmission of the data. The thermosalinograph (TSG) on ALKOR is a Salzgitter Elektronikand permanently installed. It measures the water temperature and salinity from about 4m depth.The data is streamed into DATADIS. For the calibration of the thermosalinograph water sampleshave been taken for each CTD station. This revealed an offset of about 0.1 in salinity betweenTSG and samples. A temperature offset could not be detected.
We started to measure the water samples with the Beckmann-Salinometer on the secondcruise day in order to adapt the samples to lab-temperature. But before starting with the measure-ments of the sea water samples the salinometer was calibrated with IAPSO Standard Seawaterwhich has an precisely known electrical conductivity ratio. Possible trends in the conductivitysensor of the Beckman salinometer is estimated from a number of measurements of a referencewater. We used a volume of Baltic Sea water which was drawn on the first day. This sample iscalled ’substandard’ as it is used like a standard. Then the first substandard measurement wasdone. After measuring a few bottle samples the substandard is measured again. This has to berepeated periodically after five measurements. Plotting substandard salinity versus the time of
2.2 2.4 2.6 2.8 3 3.2 3.4 3.6 3.823.82
23.84
23.86
23.88
23.9
23.92
23.94
23.96
23.98
24
subs
tand
ard
salin
ity
day (July 2004)23.82 23.84 23.86 23.88 23.9 23.92 23.94 23.96 23.98 24
20.5
21
21.5
22
22.5
23
23.5
subs
tand
ard
sam
ple
tem
pera
ture
(in
lab)
substandard salinity
Figure 5.1: (left) Substandard salinities versus time of measurement in lab. (right) Substandardsalinity versus temperature of the sample in lab. A best linear fit (broken line) and the regressionequation is given.
the measurement (Figure 5.1, left) reveals a ’jump’ in the salinity between the two days of themeasurements. A possibility for the ’jump’ might be different temperatures of the samples onday 2 and day 3. However, a clear linear dependency between the samples temperature and themeasured salinity can not be seen (Figure 5.1, right). The overall average value for the sub-standard was 23.8979
�0.033 (median 23.8995) and we see the 0.033 as the uncertainty in the
salinities measure with the salinometer.
16
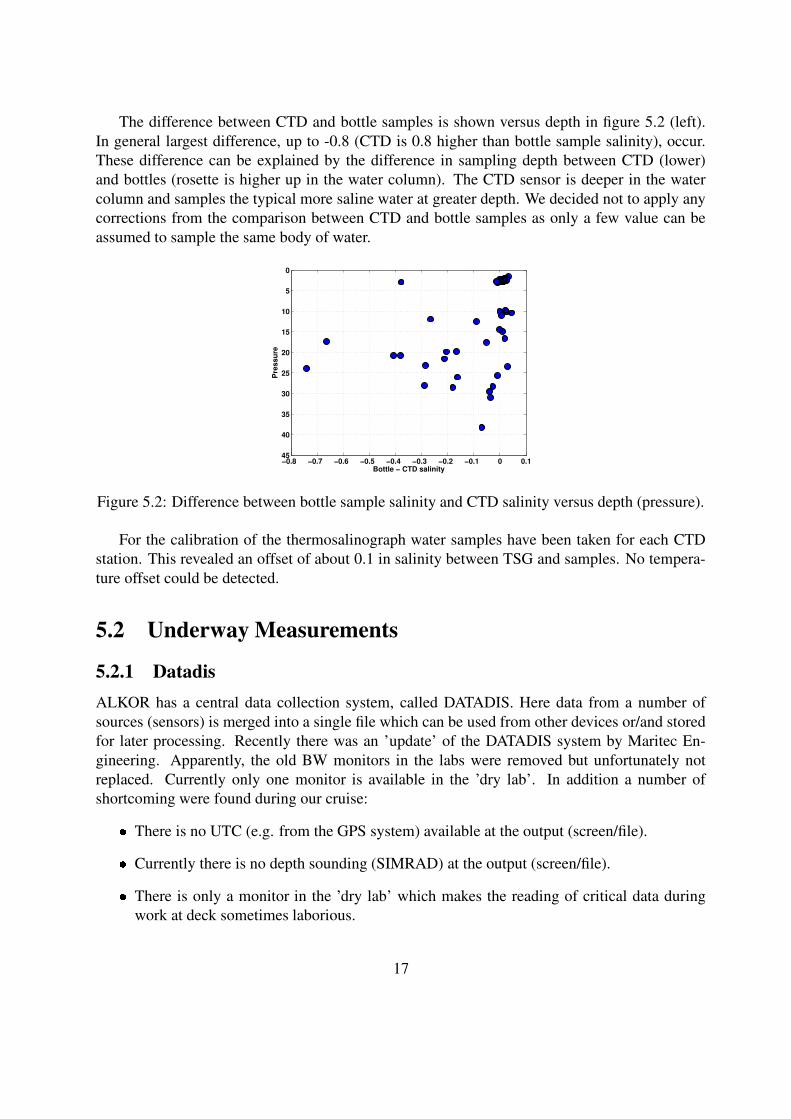
The difference between CTD and bottle samples is shown versus depth in figure 5.2 (left).In general largest difference, up to -0.8 (CTD is 0.8 higher than bottle sample salinity), occur.These difference can be explained by the difference in sampling depth between CTD (lower)and bottles (rosette is higher up in the water column). The CTD sensor is deeper in the watercolumn and samples the typical more saline water at greater depth. We decided not to apply anycorrections from the comparison between CTD and bottle samples as only a few value can beassumed to sample the same body of water.
−0.8 −0.7 −0.6 −0.5 −0.4 −0.3 −0.2 −0.1 0 0.1
0
5
10
15
20
25
30
35
40
45
Pre
ssur
e
Bottle − CTD salinity
Figure 5.2: Difference between bottle sample salinity and CTD salinity versus depth (pressure).
For the calibration of the thermosalinograph water samples have been taken for each CTDstation. This revealed an offset of about 0.1 in salinity between TSG and samples. No tempera-ture offset could be detected.
5.2 Underway Measurements
5.2.1 DatadisALKOR has a central data collection system, called DATADIS. Here data from a number ofsources (sensors) is merged into a single file which can be used from other devices or/and storedfor later processing. Recently there was an ’update’ of the DATADIS system by Maritec En-gineering. Apparently, the old BW monitors in the labs were removed but unfortunately notreplaced. Currently only one monitor is available in the ’dry lab’. In addition a number ofshortcoming were found during our cruise:
� There is no UTC (e.g. from the GPS system) available at the output (screen/file).
� Currently there is no depth sounding (SIMRAD) at the output (screen/file).
� There is only a monitor in the ’dry lab’ which makes the reading of critical data duringwork at deck sometimes laborious.
17
5.2.2 NavigationALKOR has a GPS navigational system as well as a gyro compass available. Unfortunately thedata is only in part fed into the DATADIS system and therefore the informations are not readilyavailable for other devices (see DATADIS section).
5.2.3 Meteorological DataALKOR is well equipped with meteorological sensors measuring air temperature, wind (speedand direction), wet-temperature, air-pressure, shortwave radiation. However, the longwave radi-ation sensor does not deliver any data at all. Radiation sensors are cleaned at the beginning ofthe cruise.
5.2.4 Echo sounderDuring AL 240 ER 60 SIMRAD echo sounder measured the depth. Unfortunately the instrumentis yet not implemented into the DATADIS system and besides its display in the drylab, the datais stored at an instrument own hard disc. Measured depth are based on the sound speed of 1453m ������ as calculated from a temperature (8
�C) and salinity (11)
5.2.5 ThermosalinographThe thermosalinograph (TSG) on ALKOR is permanently installed at about 4m depth and aS/MT 148 type of Salzgitter Elektronik GmbH. TSG data is directly fed into the DATADIS.Calibration was done after the cruise through bottle samples.
5.2.6 Vessel mounted ADCPA 300 kHz workhorse ADCP from RD Instruments was mounted in the ships hull. After anumber of recent improvement in terms mounting the instrument (ALKOR cruise AL04/03) thedata was still questionable, in particular a number of large data gaps near the bottom occurred.The vmADCP is used with bottom tracking mode. At AL240 no heading data was recorded andthe heading was retrieved after the cruise from the recorded navigational data. However, thereis a problem in allocating the exact time of the heading to the sample number of the ADCP andsubstantial errors are possible.
18
Chapter 6
Acknowledgment
Herzlichen Dank an Kapitan Jan Lass und die Offiziere Andreas Pooker, Rainer Nannen undPeter Strehlow sowie der gesamten Besatzung der ALKOR fur ihre professionelle Unterstutzungund die nette Atmosphare an Bord. BASEWECS ist ein BMBF Projekt das zum DEKLIM Pro-gramm gehort und die Fordernummer 01LD0025 besitzt.
19

Chapter 7
Appendix
FileName = ifmk_2004_06_info.ctdCruise = NF SS 2004Instrument = OTSStartDate = 2004/06/29EndDate = 2004/07/02Columns = NR:LAT:LON:D:YY:MM:DD:HH:lg:fb:mr:rg:kd1 54.6074 10.9173 24 2004 06 29 9.53 1 0 0 0 02 54.5925 11.0848 32 2004 06 29 10.43 1 0 0 0 03 54.5483 11.1639 13 2004 06 29 11.17 0 1 0 0 04 54.5660 11.1832 27 2004 06 29 11.53 0 1 0 0 05 54.5841 11.2063 27 2004 06 29 11.88 1 1 0 0 06 54.6002 11.2247 27 2004 06 29 12.25 0 1 0 0 07 54.6112 11.2418 24 2004 06 29 12.65 0 1 0 0 08 54.6249 11.2576 20 2004 06 29 12.95 0 1 0 0 09 54.5202 11.3052 27 2004 06 29 14.35 0 0 1 0 0
10 54.3999 12.1670 20 2004 06 30 6.42 1 0 0 0 011 54.5342 12.3008 22 2004 06 30 7.50 1 0 0 0 012 54.6338 12.5008 17 2004 06 30 8.50 1 0 0 0 013 54.7213 12.7087 21 2004 06 30 9.48 1 0 0 0 014 54.8077 12.9142 21 2004 06 30 10.55 1 0 0 0 015 54.9172 13.4973 46 2004 06 30 12.70 1 0 0 0 016 54.7854 13.9986 39 2004 06 30 14.67 1 0 0 0 017 54.3933 12.3153 13 2004 07 01 9.07 0 0 0 0 118 54.4134 12.2794 17 2004 07 01 11.50 0 0 0 0 119 54.4236 12.2563 18 2004 07 01 11.83 0 0 0 0 120 54.4367 12.2310 26 2004 07 01 12.18 0 0 0 0 121 54.4528 12.1997 26 2004 07 01 12.52 1 0 0 0 122 54.4659 12.1665 12 2004 07 01 13.00 0 0 0 0 123 54.3586 12.0003 18 2004 07 02 6.33 1 0 0 0 024 54.3502 11.8336 22 2004 07 02 7.05 1 0 0 0 025 54.3507 11.6670 25 2004 07 02 7.75 1 0 0 0 026 54.4505 11.5000 26 2004 07 02 8.67 1 0 0 0 0
20

27 54.5223 11.3038 28 2004 07 02 9.78 0 0 1 0 028 54.5474 11.1639 12 2004 07 02 10.57 0 1 0 0 029 54.5672 11.1835 28 2004 07 02 10.83 0 1 0 0 030 54.5838 11.2089 28 2004 07 02 11.17 1 1 0 0 031 54.6004 11.2248 28 2004 07 02 11.43 0 1 0 0 032 54.6111 11.2392 24 2004 07 02 11.73 0 1 0 0 033 54.6257 11.2583 20 2004 07 02 12.08 0 1 0 0 0
21