cse lab cognitive systems engineering laboratory sweden, swedes, and energy erik hollnagel
TRANSCRIPT

CSELAB
COGNITIVE SYSTEMS ENGINEERING LABORATORY
Sweden, Swedes, and Energy
Erik Hollnagel
CSELAB
COGNITIVE SYSTEMS ENGINEERING LABORATORY
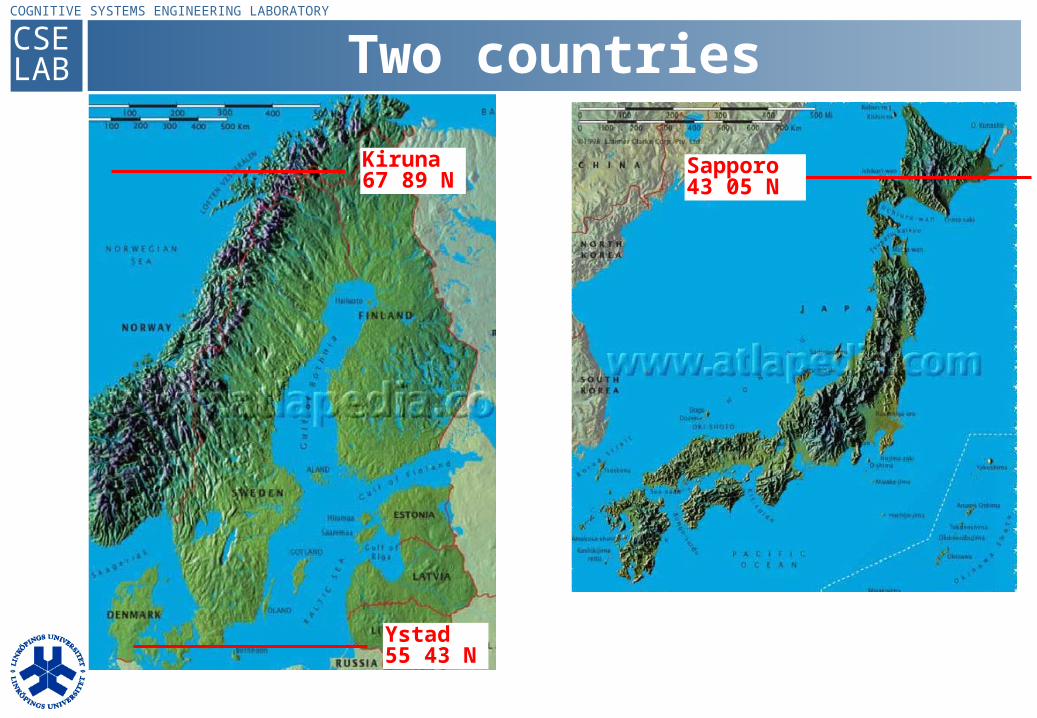
Two countries
Sapporo 43 05 N
Kiruna 67 89 N
Ystad 55 43 N
CSELAB
COGNITIVE SYSTEMS ENGINEERING LABORATORY
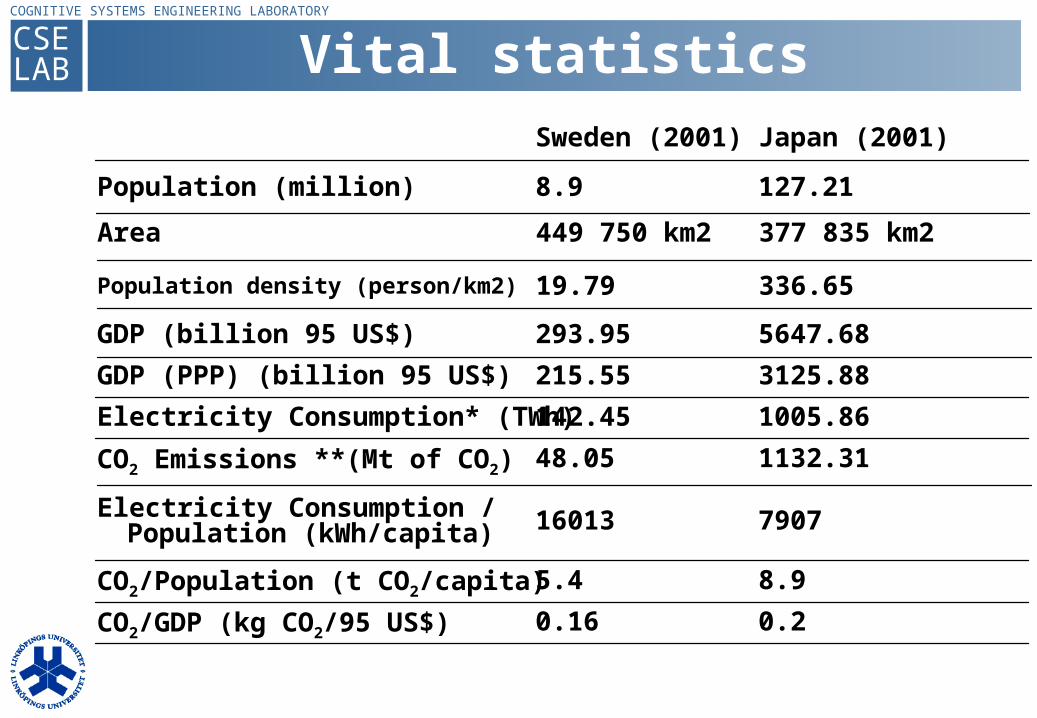
Area
Vital statistics
0.20.16CO2/GDP (kg CO2/95 US$)
8.95.4CO2/Population (t CO2/capita)
790716013Electricity Consumption / Population (kWh/capita)
1132.3148.05CO2 Emissions **(Mt of CO2)
1005.86142.45Electricity Consumption* (TWh)
3125.88 215.55 GDP (PPP) (billion 95 US$)
5647.68 293.95 GDP (billion 95 US$)
127.218.9Population (million)
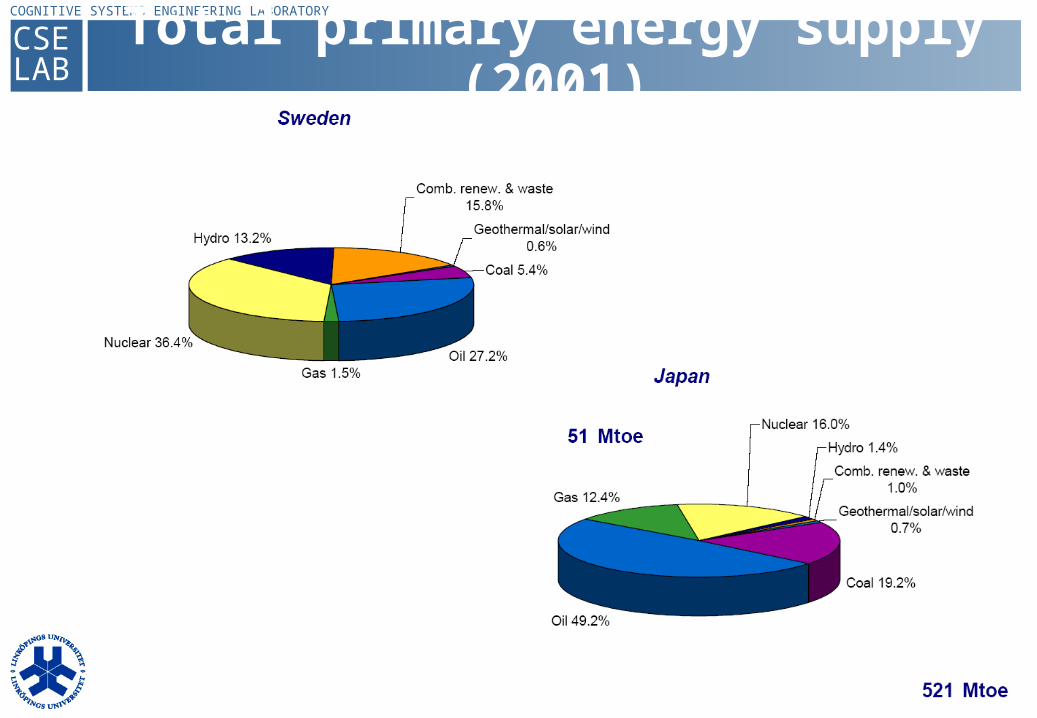
Japan (2001)Sweden (2001)
336.6519.79 Population density (person/km2)
377 835 km2 449 750 km2
CSELAB
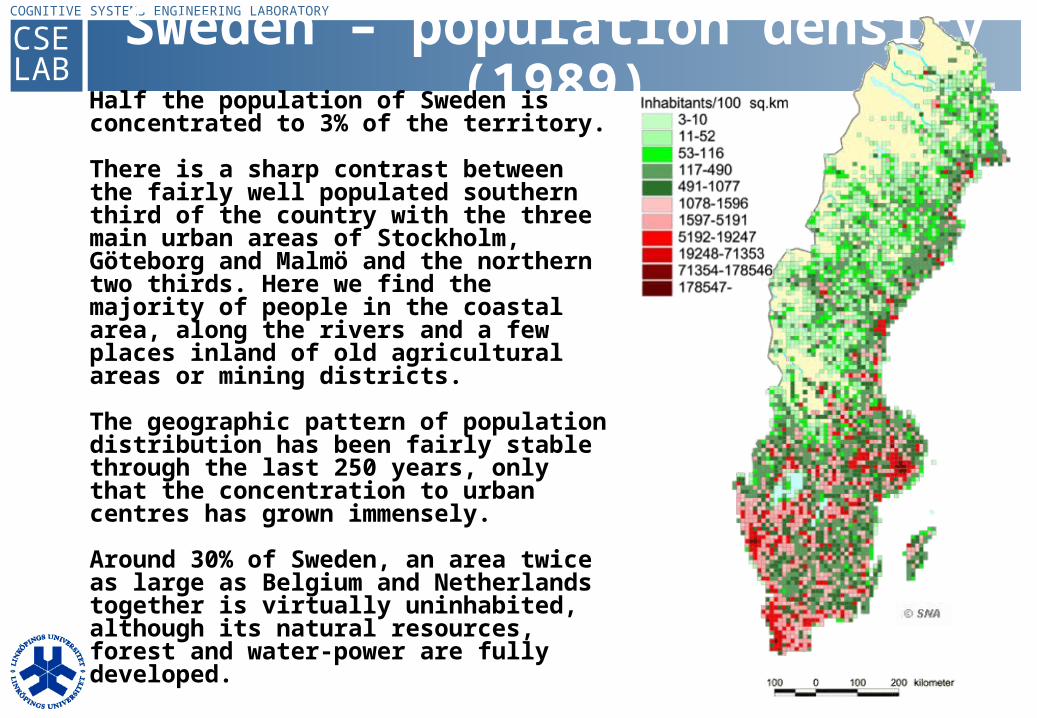
COGNITIVE SYSTEMS ENGINEERING LABORATORYSweden – population density (1989)
Half the population of Sweden is concentrated to 3% of the territory.
There is a sharp contrast between the fairly well populated southern third of the country with the three main urban areas of Stockholm, Göteborg and Malmö and the northern two thirds. Here we find the majority of people in the coastal area, along the rivers and a few places inland of old agricultural areas or mining districts.
The geographic pattern of population distribution has been fairly stable through the last 250 years, only that the concentration to urban centres has grown immensely.
Around 30% of Sweden, an area twice as large as Belgium and Netherlands together is virtually uninhabited, although its natural resources, forest and water-power are fully developed.
CSELAB
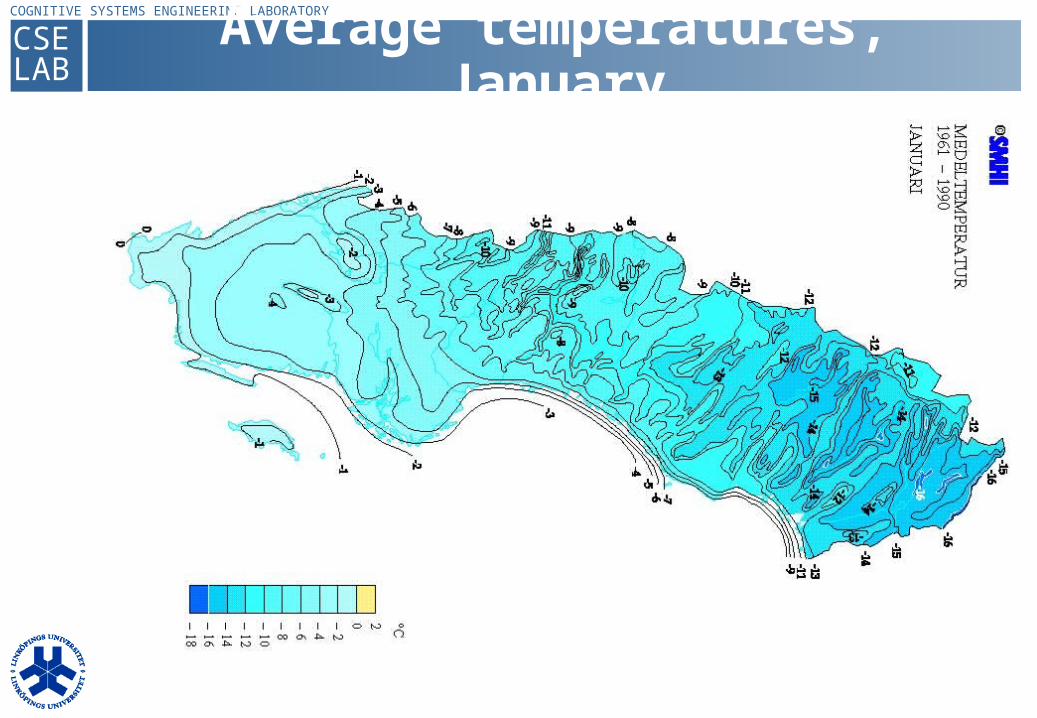
COGNITIVE SYSTEMS ENGINEERING LABORATORYAverage temperatures, January
CSELAB
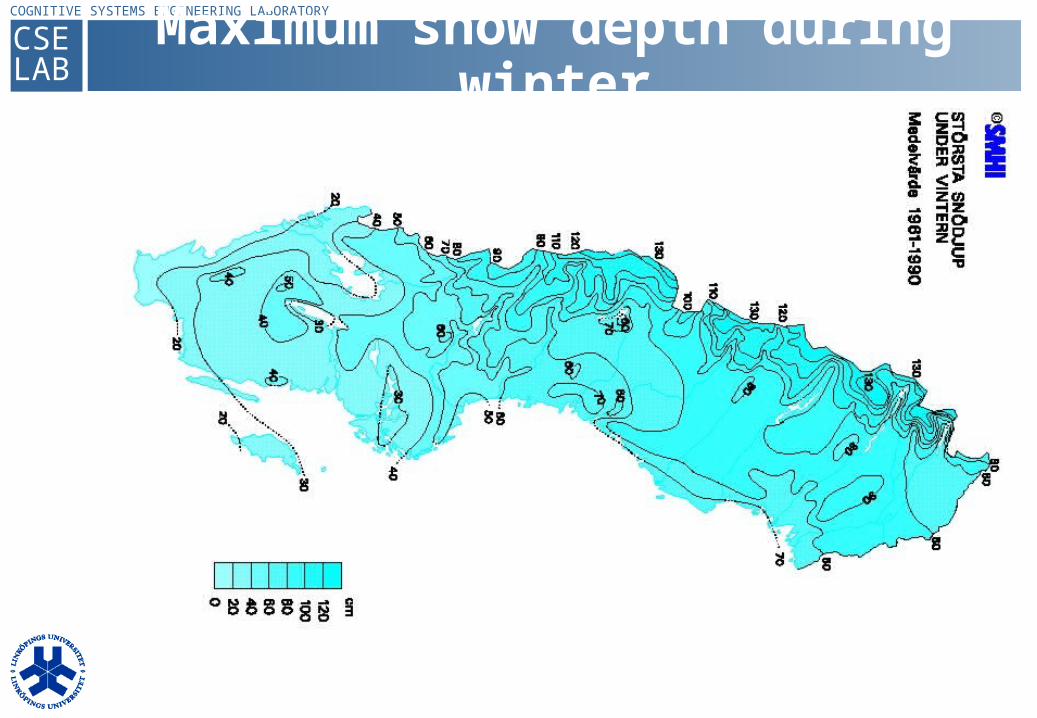
COGNITIVE SYSTEMS ENGINEERING LABORATORYMaximum snow depth during winter
CSELAB
COGNITIVE SYSTEMS ENGINEERING LABORATORY
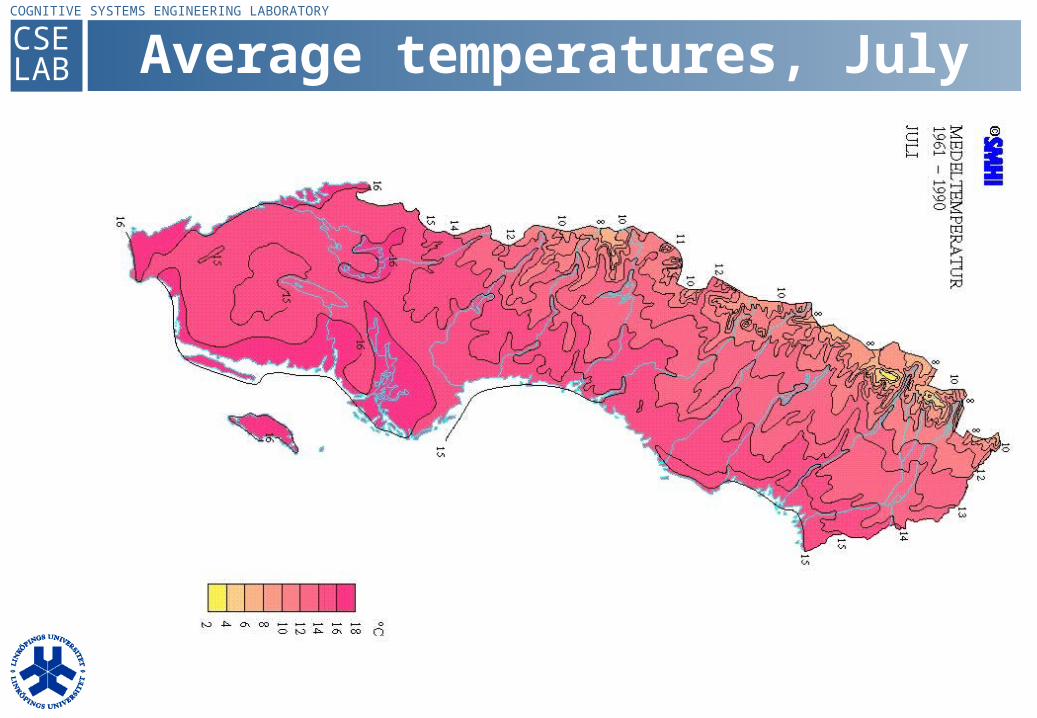
Average temperatures, July
CSELAB
COGNITIVE SYSTEMS ENGINEERING LABORATORY
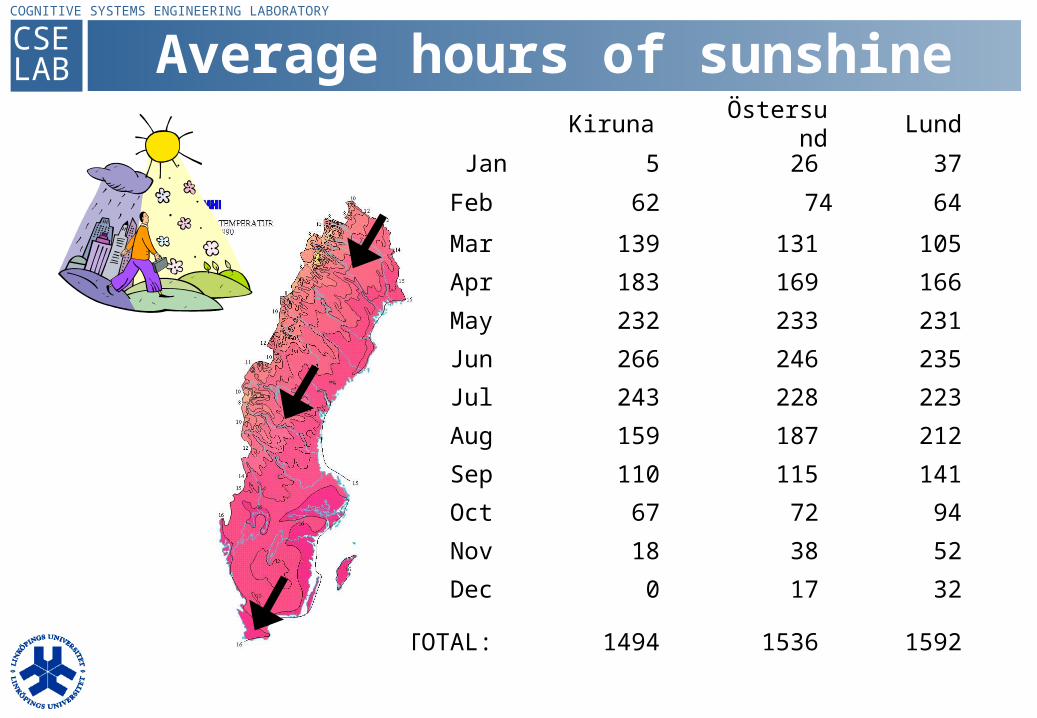
Average hours of sunshine
15921536 1494 TOTAL:
3217 0 Dec
5238 18 Nov
9472 67 Oct
141115 110 Sep
212187 159 Aug
223228 243 Jul
235246 266 Jun
231233 232 May
166169 183 Apr
105131 139 Mar
647462 Feb
3726 5 Jan
LundÖstersundKiruna
CSELAB
COGNITIVE SYSTEMS ENGINEERING LABORATORY
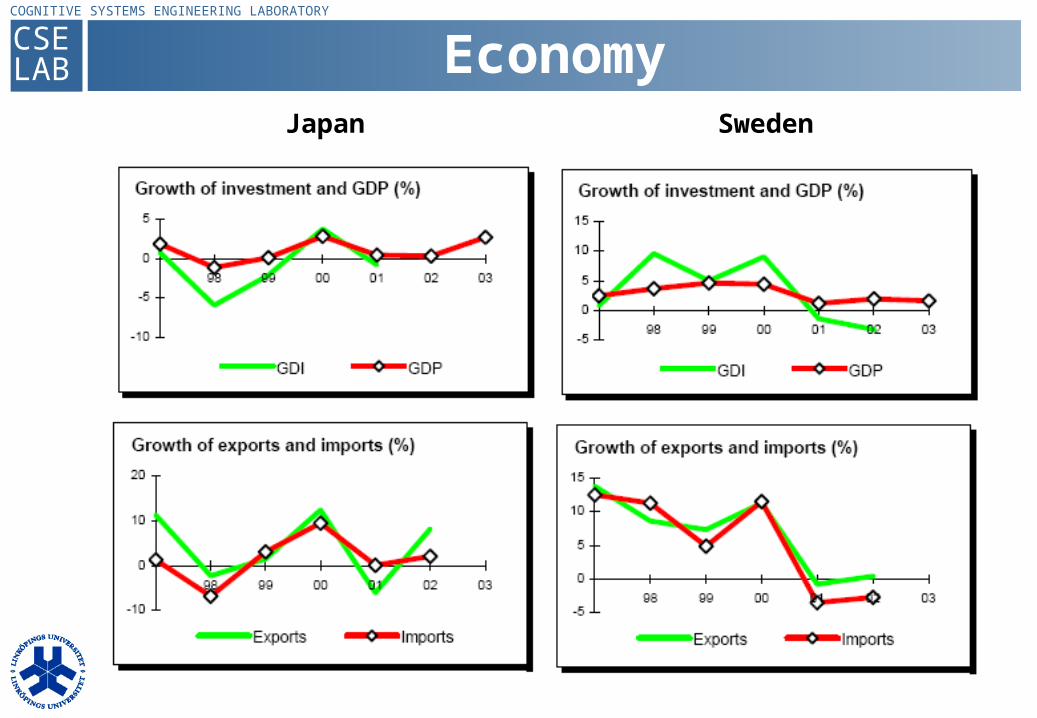
EconomyJapan Sweden
CSELAB
COGNITIVE SYSTEMS ENGINEERING LABORATORYTotal primary energy supply (2001)
CSELAB
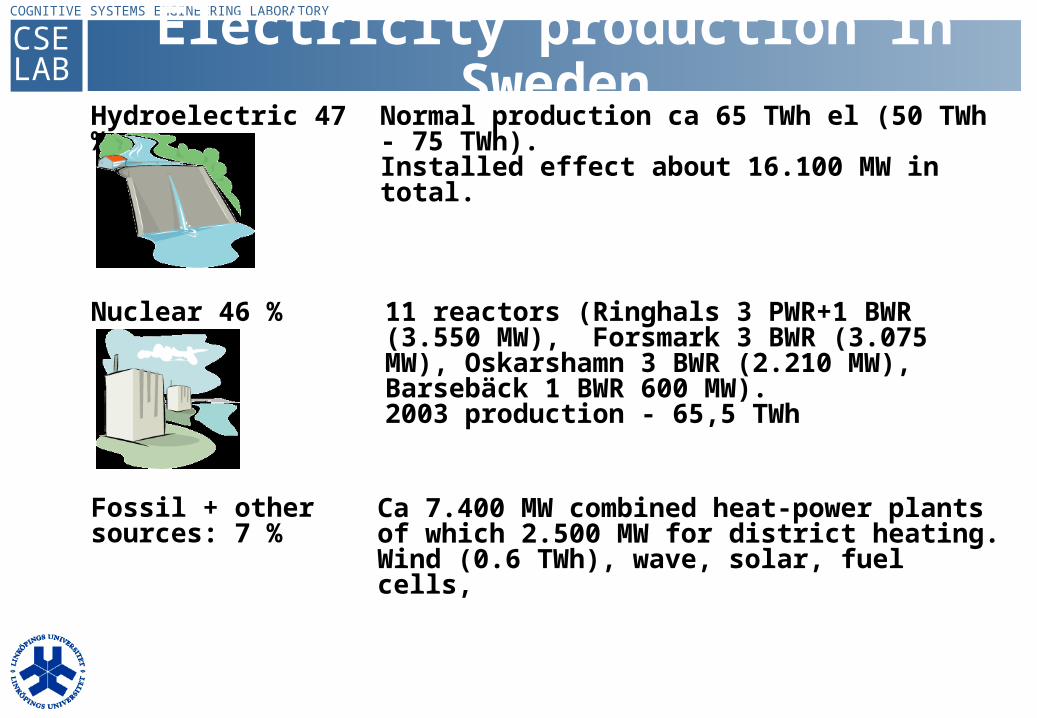
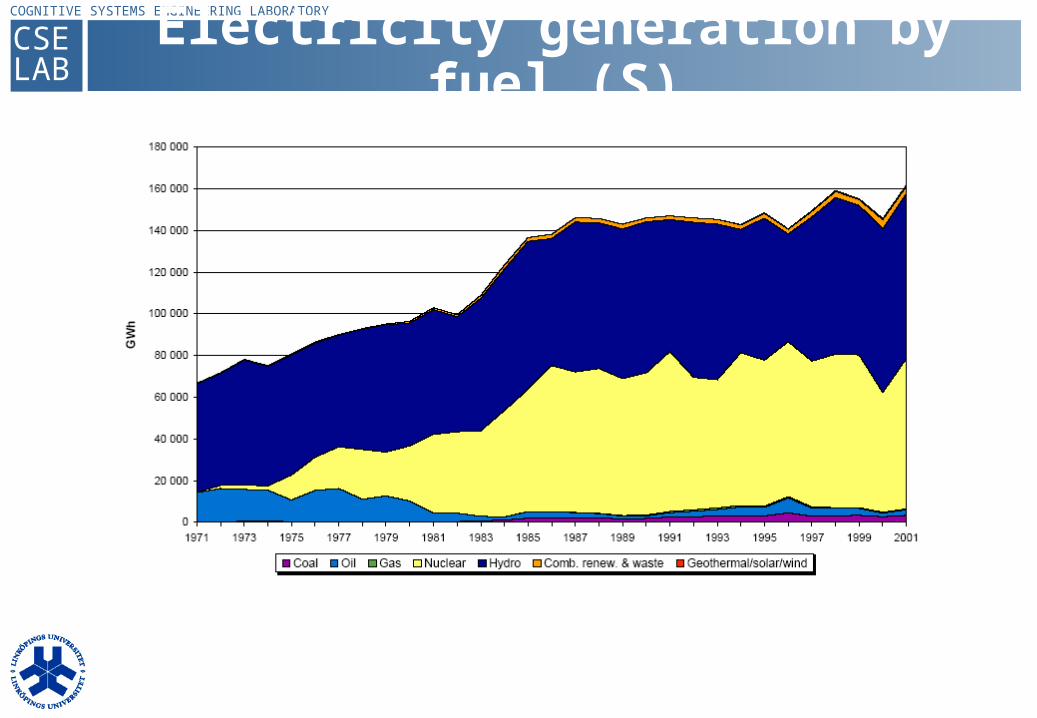
COGNITIVE SYSTEMS ENGINEERING LABORATORYElectricity production in Sweden
Hydroelectric 47 %
Ca 7.400 MW combined heat-power plants of which 2.500 MW for district heating.Wind (0.6 TWh), wave, solar, fuel cells,
Normal production ca 65 TWh el (50 TWh - 75 TWh). Installed effect about 16.100 MW in total.
Nuclear 46 %
Fossil + other sources: 7 %
11 reactors (Ringhals 3 PWR+1 BWR (3.550 MW), Forsmark 3 BWR (3.075 MW), Oskarshamn 3 BWR (2.210 MW), Barsebäck 1 BWR 600 MW). 2003 production - 65,5 TWh
CSELAB
COGNITIVE SYSTEMS ENGINEERING LABORATORY
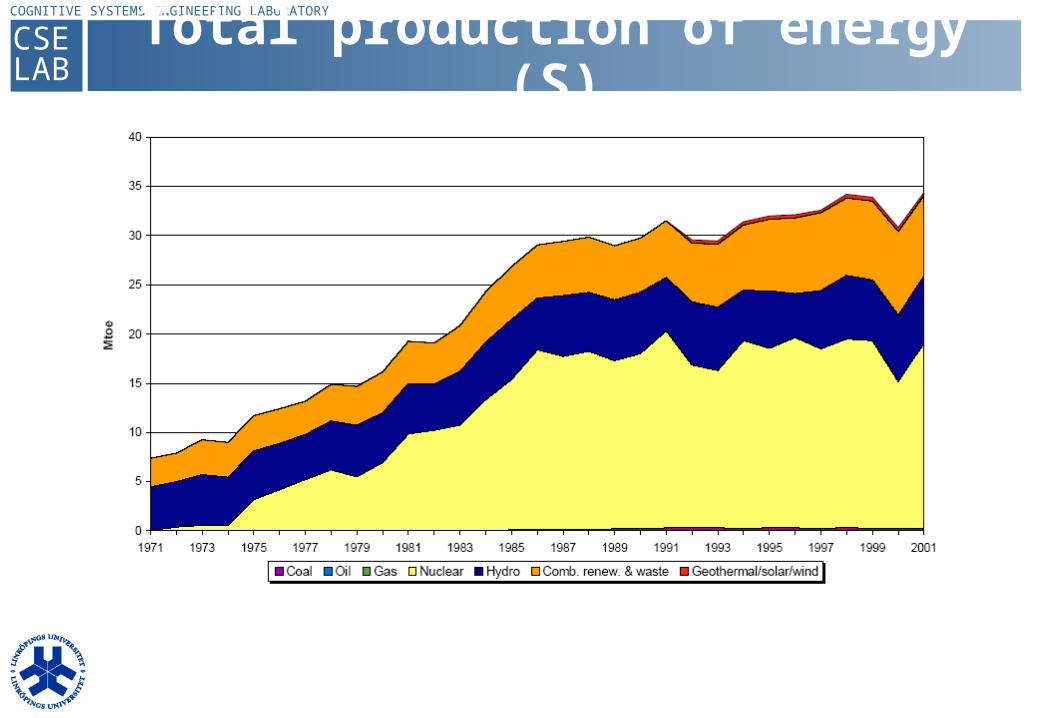
Total production of energy (S)
CSELAB
COGNITIVE SYSTEMS ENGINEERING LABORATORY
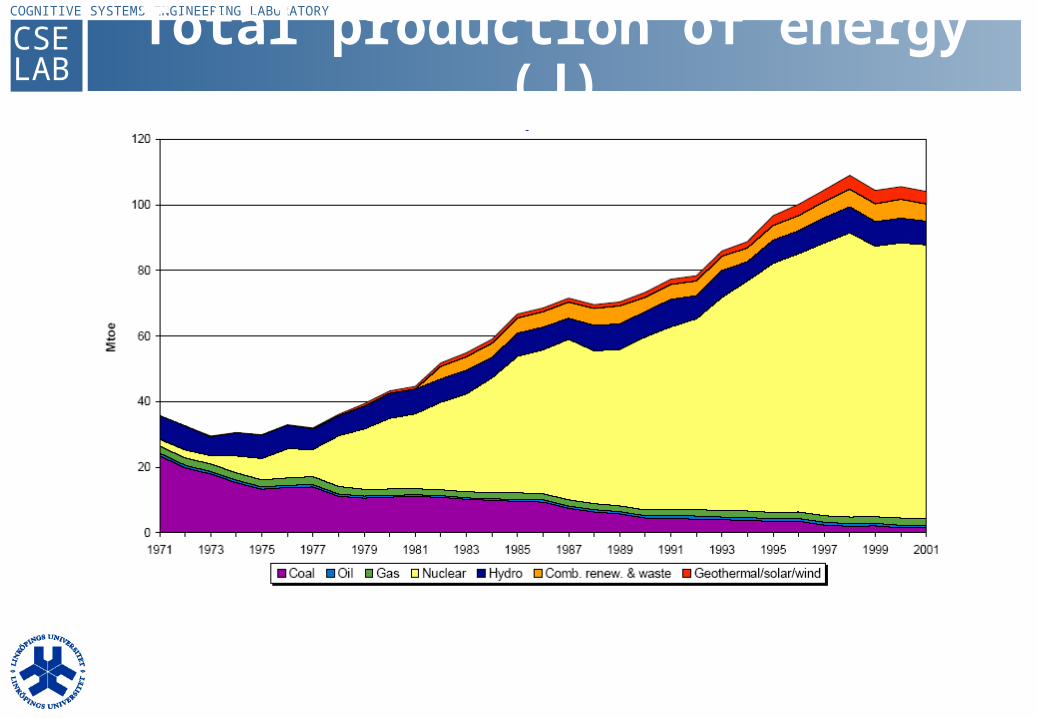
Total production of energy (J)
CSELAB
COGNITIVE SYSTEMS ENGINEERING LABORATORYElectricity generation by fuel (S)
CSELAB
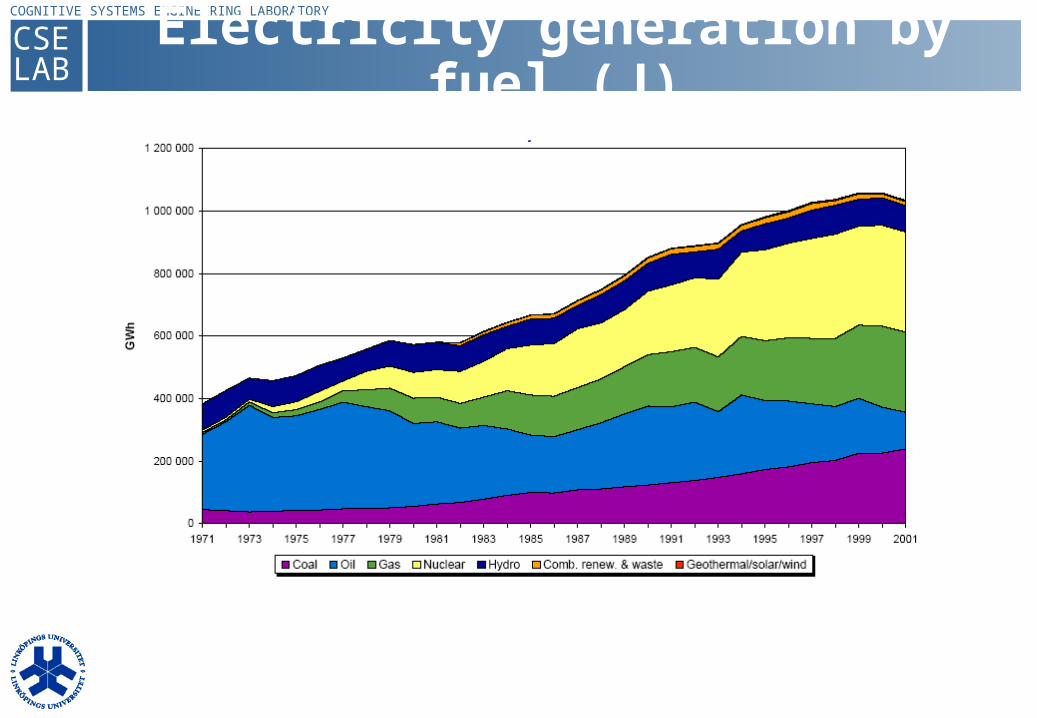
COGNITIVE SYSTEMS ENGINEERING LABORATORYElectricity generation by fuel (J)
CSELAB
COGNITIVE SYSTEMS ENGINEERING LABORATORYNuclear power referendum (1980)
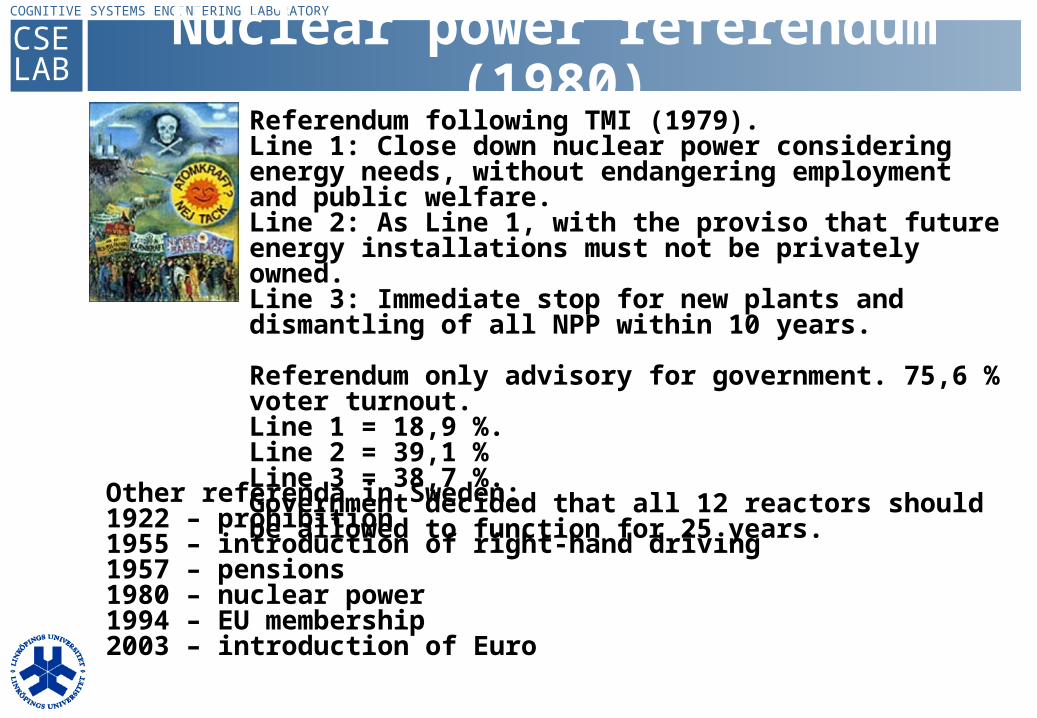
Referendum following TMI (1979). Line 1: Close down nuclear power considering energy needs, without endangering employment and public welfare.Line 2: As Line 1, with the proviso that future energy installations must not be privately owned.Line 3: Immediate stop for new plants and dismantling of all NPP within 10 years.
Referendum only advisory for government. 75,6 % voter turnout.Line 1 = 18,9 %.Line 2 = 39,1 %Line 3 = 38,7 %.Government decided that all 12 reactors should be allowed to function for 25 years.Other referenda in Sweden:
1922 – prohibition1955 – introduction of right-hand driving1957 – pensions1980 – nuclear power1994 – EU membership2003 – introduction of Euro
CSELAB
COGNITIVE SYSTEMS ENGINEERING LABORATORY
Attitudes to nuclear power
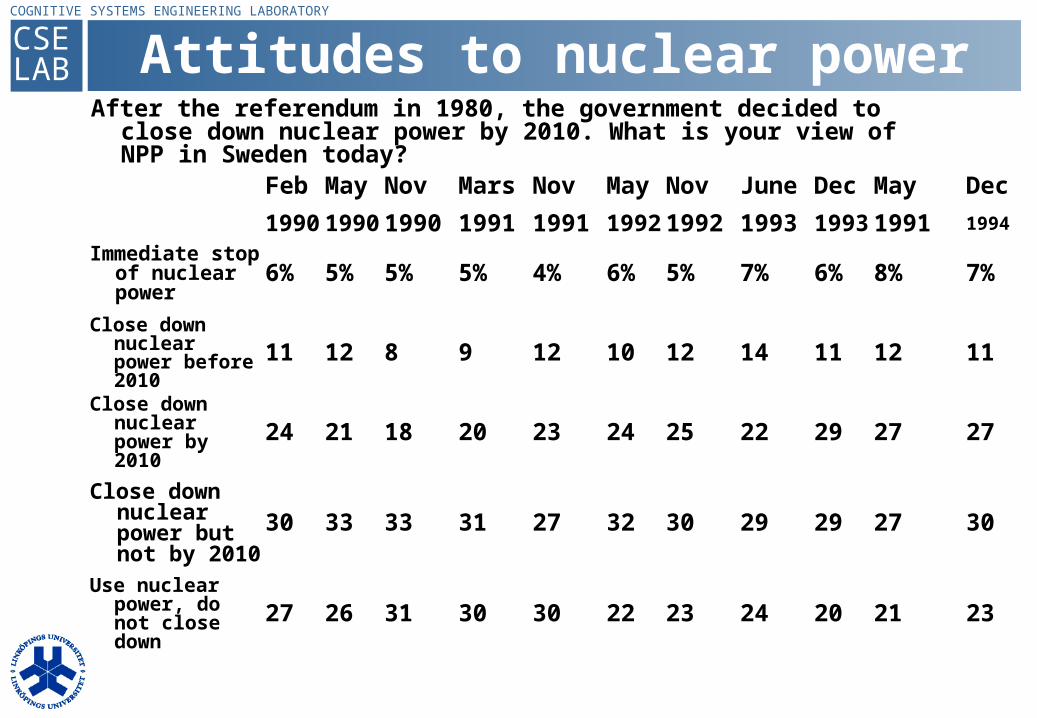
2321202423 223030312627Use nuclear
power, do not close down
3027292930 322731333330Close down
nuclear power but not by 2010
2727292225 242320182124Close down
nuclear power by 2010
1112111412 1012981211Close down
nuclear power before 2010
7% 8%6%7% 5%6%4%5%5%5%6% Immediate
stop of nuclear power
1994 199119931993 199219921991 199119901990 1990
Dec MayDecJuneNovMayNovMarsNovMayFeb
After the referendum in 1980, the government decided to close down nuclear power by 2010. What is your view of NPP in Sweden today?
CSELAB
COGNITIVE SYSTEMS ENGINEERING LABORATORY
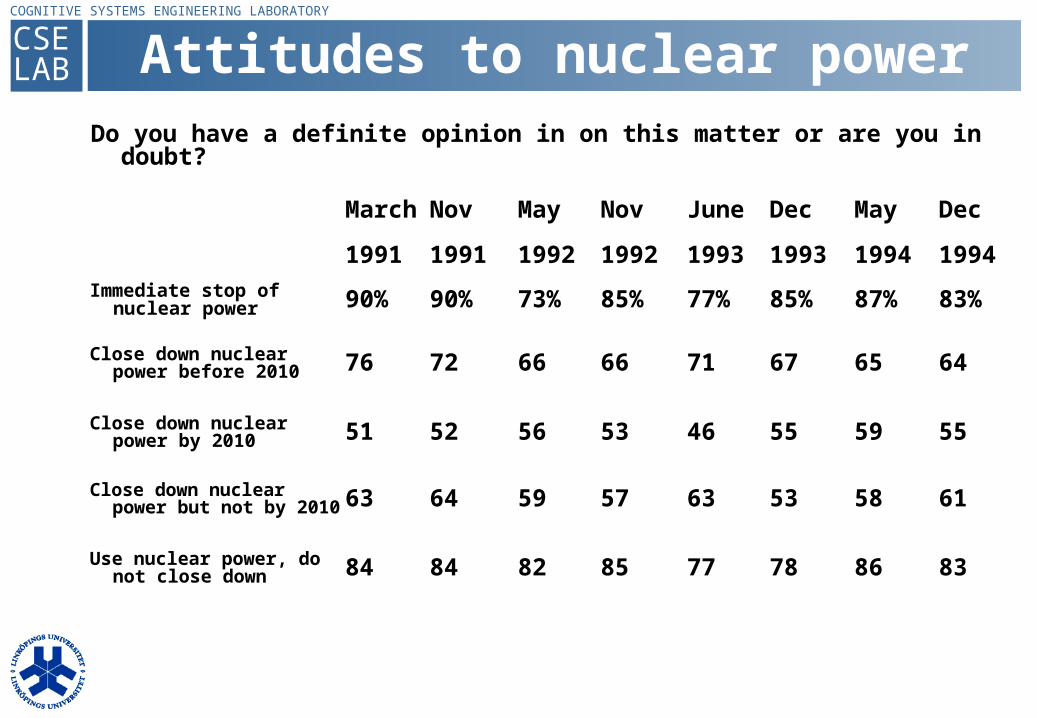
Attitudes to nuclear power
8386 787785828484Use nuclear power, do not close down
6158 536357596463Close down nuclear
power but not by 2010
5559 554653565251Close down nuclear power by 2010
6465 677166667276Close down nuclear power before 2010
83%87% 85%77%85% 73%90%90% Immediate stop of nuclear power
1994 199419931993 199219921991 1991
Dec MayDecJune NovMayNov March
Do you have a definite opinion in on this matter or are you in doubt?
CSELAB
COGNITIVE SYSTEMS ENGINEERING LABORATORY
Attitudes to nuclear power
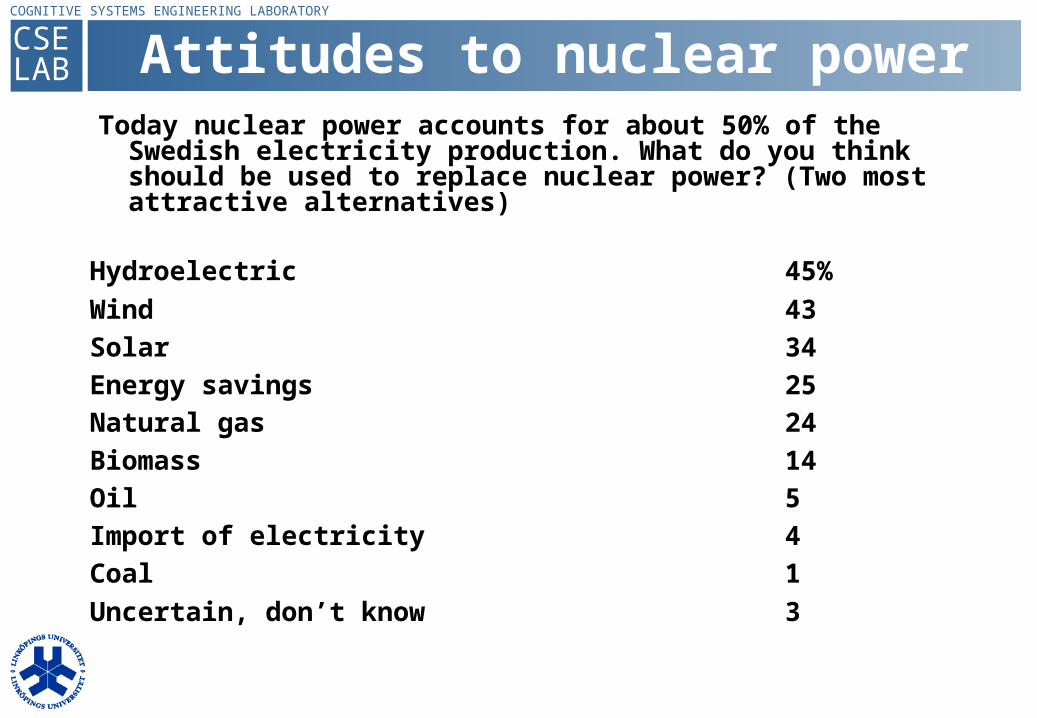
3Uncertain, don’t know1Coal4Import of electricity5Oil14Biomass24Natural gas25Energy savings34Solar43Wind45%Hydroelectric
Today nuclear power accounts for about 50% of the Swedish electricity production. What do you think should be used to replace nuclear power? (Two most attractive alternatives)
CSELAB
COGNITIVE SYSTEMS ENGINEERING LABORATORY
Global warming
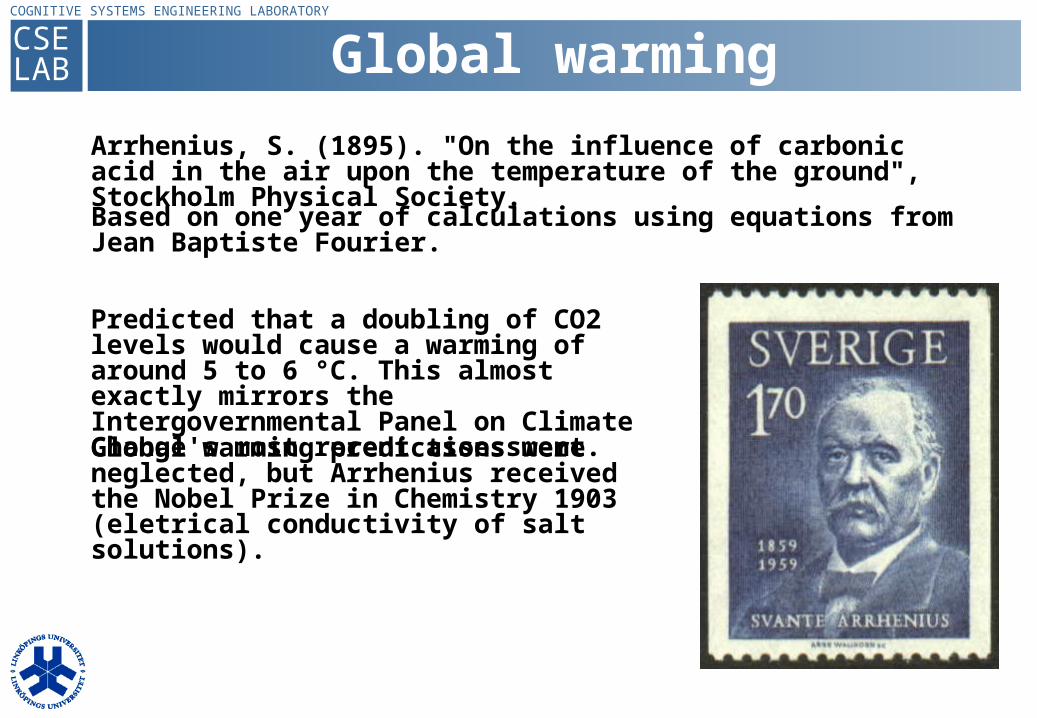
Arrhenius, S. (1895). "On the influence of carbonic acid in the air upon the temperature of the ground", Stockholm Physical Society. Based on one year of calculations using equations from Jean Baptiste Fourier.
Predicted that a doubling of CO2 levels would cause a warming of around 5 to 6 °C. This almost exactly mirrors the Intergovernmental Panel on Climate Change's most recent assessment.Global warming predictions were neglected, but Arrhenius received the Nobel Prize in Chemistry 1903 (eletrical conductivity of salt solutions).
CSELAB
COGNITIVE SYSTEMS ENGINEERING LABORATORY
District heatingOrigin can be traced to Roman inventions. By the 16th and 17th centuries, fuel conservation, smoke abatement, and safety were large factors in design of heating apparatus, as seen by a 1623 proposal to install district heating in London. Separate boiler plants and underground piping were used by English factories in the 1790s and by 1820 was fairly common. Waste heat from factories was used to warm public baths by the 1830s. The Crystal Palace in London had district heating in 1851, at least two steam district heating systems were built in the USA in 1853.
District heating on a commercial basis came into use in 1877 in New York.
In Sweden, the first municipal district heating system was started at Karlstad in 1948. Further district heating systems were started at Norrköping and Malmö in l95l, Göteborg, Sundbyberg, and Stockholm in 1953, Linköping and Västerås in 1954, Örebro in 1956, and Borås in 1959.
All these district heating systems were planned and built for the purpose of utilizing heat from future CHP-plants. In these 10 pioneer towns, oil-fired CHP-plants were also built during the 50's and the 60's.
In order to promote and discuss issues of common interest, the Swedish District Heating Association was founded in 1949.
CSELAB
COGNITIVE SYSTEMS ENGINEERING LABORATORY
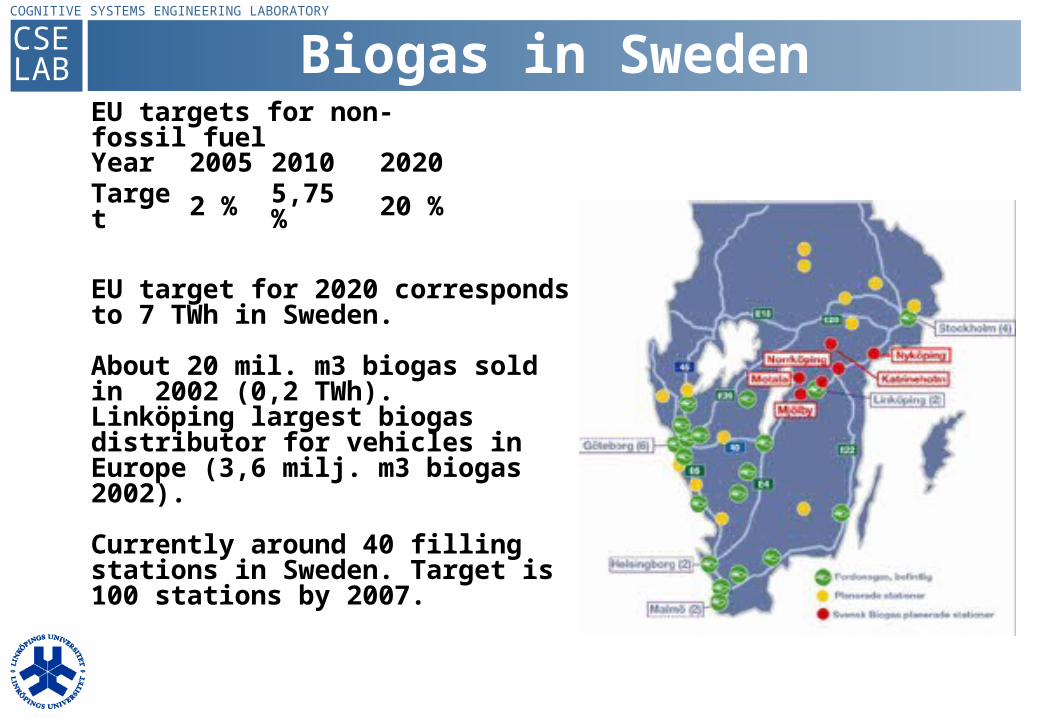
Biogas in Sweden
EU target for 2020 corresponds to 7 TWh in Sweden.
About 20 mil. m3 biogas sold in 2002 (0,2 TWh). Linköping largest biogas distributor for vehicles in Europe (3,6 milj. m3 biogas 2002).
Currently around 40 filling stations in Sweden. Target is 100 stations by 2007.
EU targets for non-fossil fuelYear 200
5 2010 2020
Target 2 % 5,75
% 20 %
CSELAB
COGNITIVE SYSTEMS ENGINEERING LABORATORYDeregulation (Nordic countries)
Selling electricity:More than 450 companies (of which 130 in Sweden). The five largest (Vattenfall, E.ON/Sydkraft, Fortum, Hafslund and Statkraft) has a 36% market share.
Producing electricityMore than 350 producing companies. The five largest (Vattenfall, E.ON/Sydkraft, Fortum, Statkraft and PVO) have a 57 % market share.
Distribution gridsA total of almost 550 companies. The five largest (Vattenfall, E.ON /Sydkraft, Fortum, Nesa and Hafslund) have a 35% market share. Deregulation began in 1996. It coincided with five years with sufficient water supplies (= RAIN). As a consequence prices dropped to around 10-12 öre/kWh. The following years (2002 and 2003) were very dry, and the effects of that are still tangible. In consequence, the base price of electricity rose to around 30 öre/kWh (spot market)
CSELAB
COGNITIVE SYSTEMS ENGINEERING LABORATORY
-35
-25
-15
-5
5
15
25
35
jan
-00
jul-
00
jan
-01
jul-
01
jan
-02
jul-
02
jan
-03
jul-
03
jan
-04
jul-
04
TWh
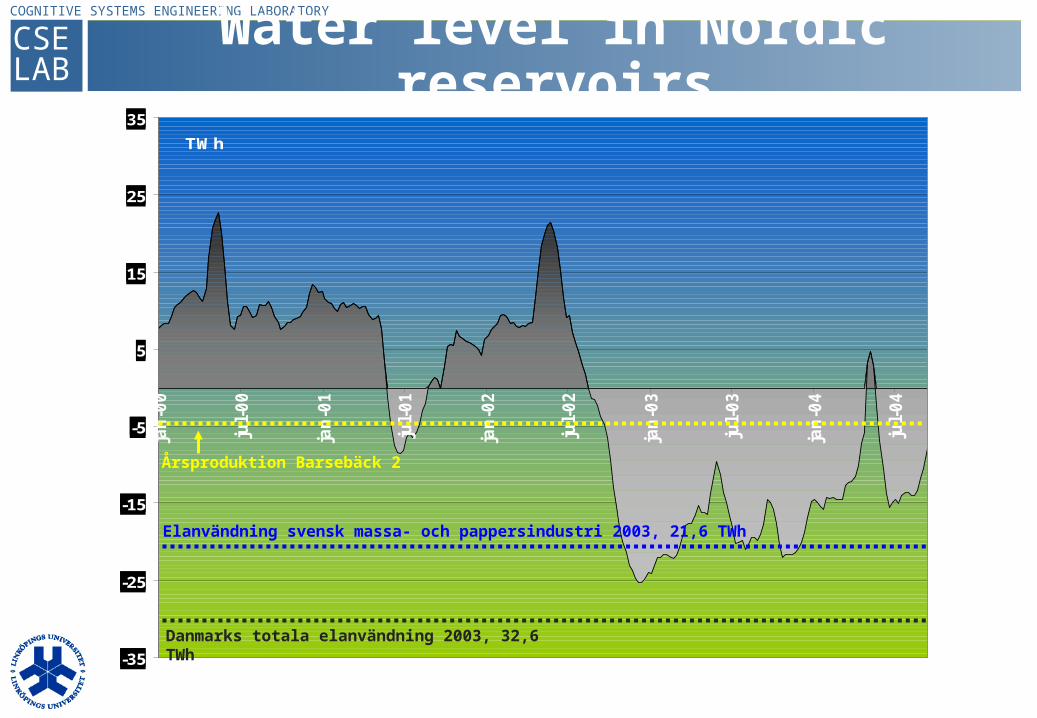
Årsproduktion Barsebäck 2
Elanvändning svensk massa- och pappersindustri 2003, 21,6 TWh
Danmarks totala elanvändning 2003, 32,6 TWh
Water level in Nordic reservoirs
CSELAB
COGNITIVE SYSTEMS ENGINEERING LABORATORY
0
20
40
60
80
100
1201
97
0
19
72
19
74
19
76
19
78
19
80
19
82
19
84
19
86
19
88
19
90
19
92
19
94
19
96
19
98
20
00
20
02
20
04
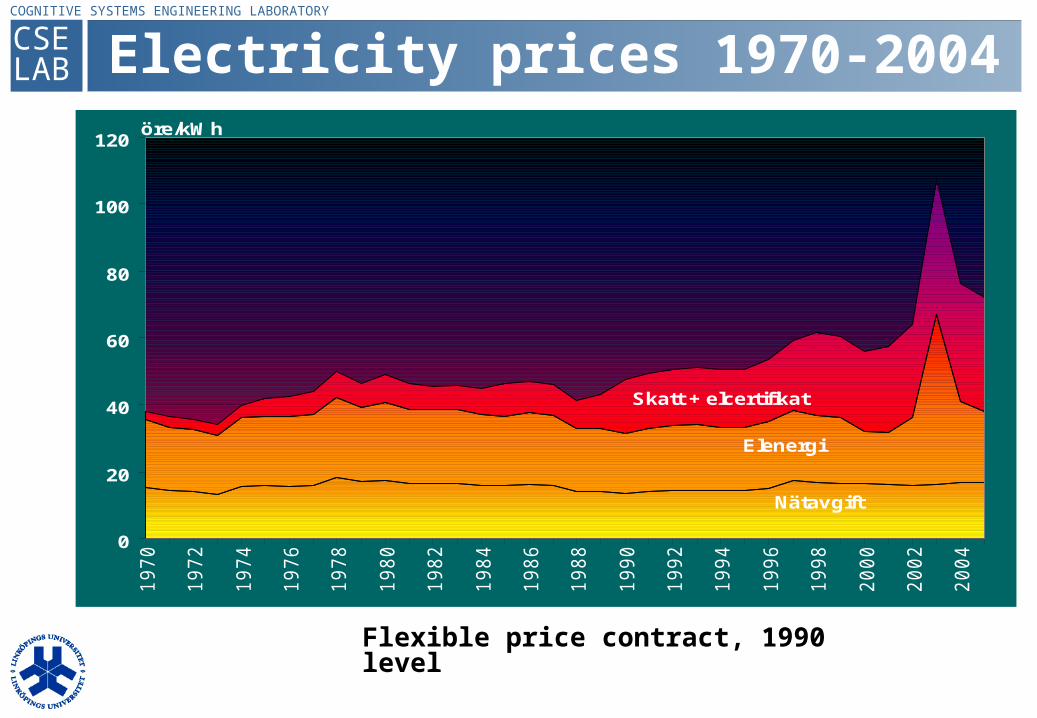
Elenergi
Nätavgift
Skatt + elcertifikat
öre/kWh
Flexible price contract, 1990 level
Electricity prices 1970-2004
CSELAB
COGNITIVE SYSTEMS ENGINEERING LABORATORY
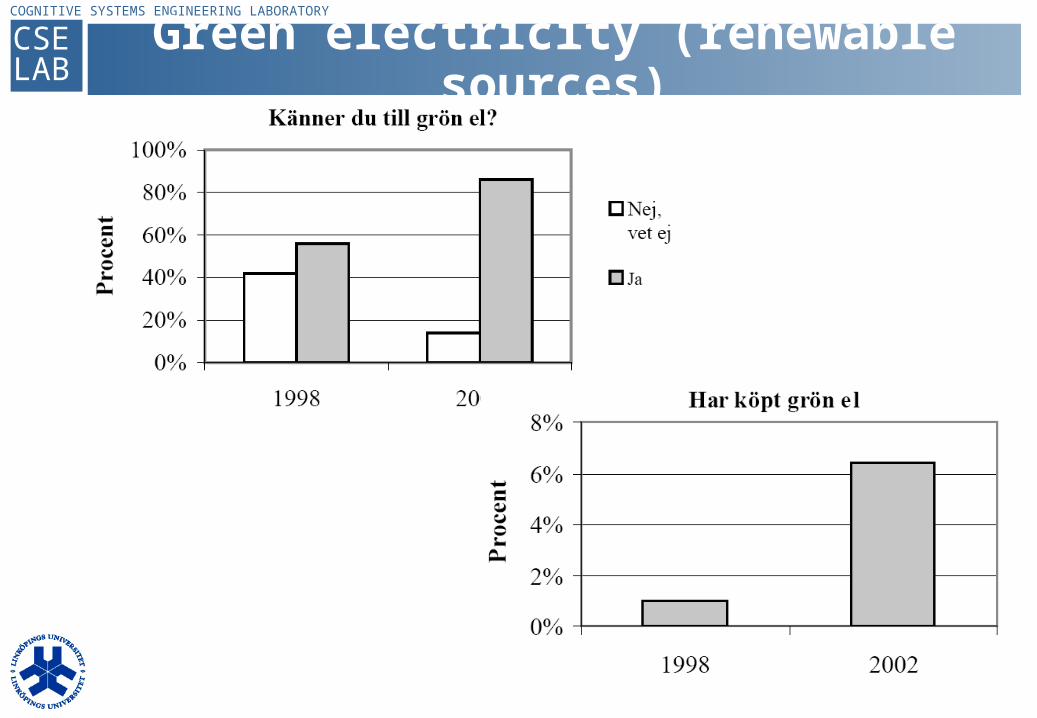
Green electricity (renewable sources)
CSELAB
COGNITIVE SYSTEMS ENGINEERING LABORATORY
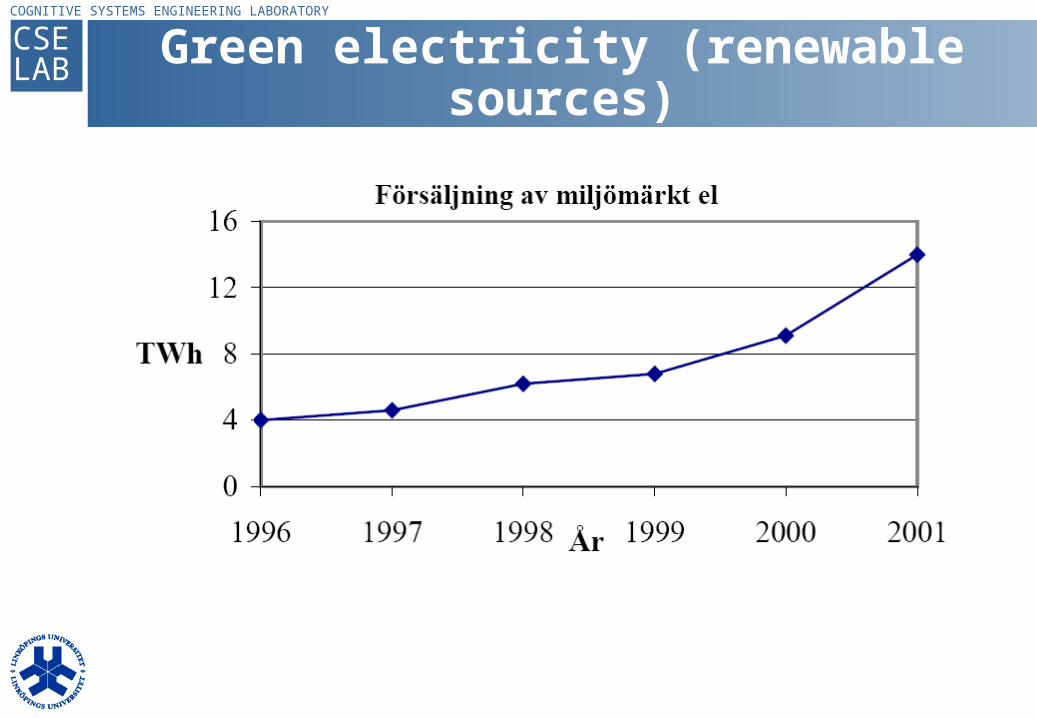
Green electricity (renewable sources)