current and emerging trends in natural health · current and emerging trends in natural health. ......
TRANSCRIPT

Hayley Turner
Account Director - IRI NZ
Natural Products NZ Summit
March 2017
Current and emerging trends in Natural Health

Copyright © 2017 Information Resources, Inc. (IRI). Confidential and Proprietary. 2
Who are IRI?
• 11 North America offices
• 12 Europe offices
• 3 Asia-Pacific offices
• 1 Africa office
• ISO-Certified Global
Analytics Center of
Excellence serving clients in
over 60 countries
• Global Operations Center in
India IRI offices
CCR and Intage partnerships
Analytics and Global panel coverage via Worldpanel

Copyright © 2017 Information Resources, Inc. (IRI). Confidential and Proprietary. 3
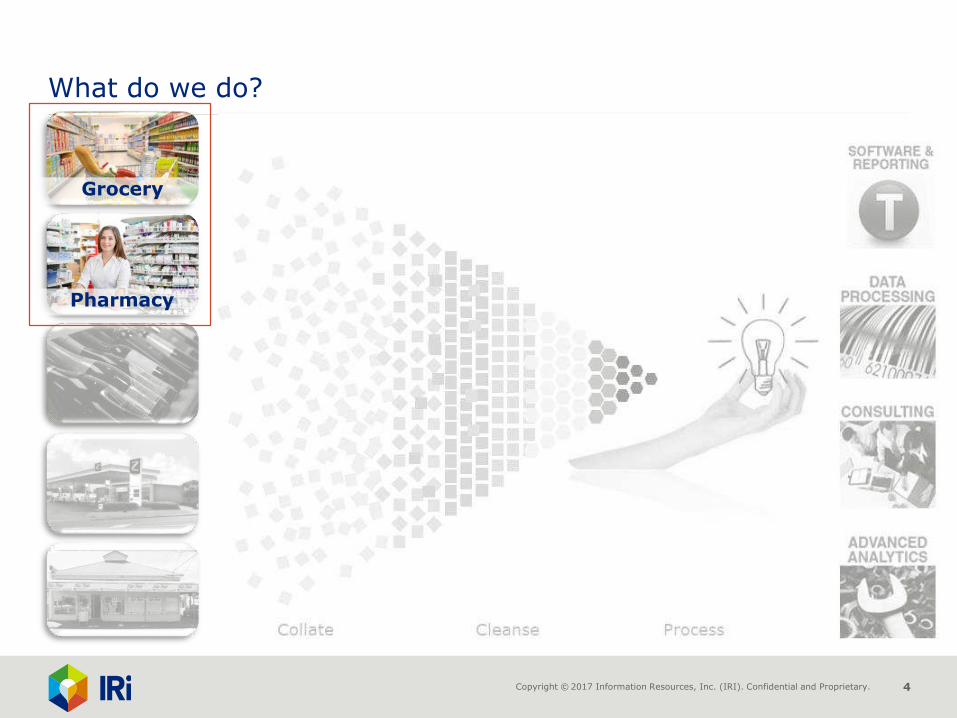
What do we do?
Collate Cleanse Process
Grocery
Pharmacy
Liquor
Petrol
Route
Copyright © 2017 Information Resources, Inc. (IRI). Confidential and Proprietary. 4
What do we do?
Collate Cleanse Process
Grocery
Pharmacy

Copyright © 2017 Information Resources, Inc. (IRI). Confidential and Proprietary. 5
Today
Landscape The Market Trends

Copyright © 2017 Information Resources, Inc. (IRI). Confidential and Proprietary. 6
Today
Landscape The Market Trends

77
Total Retail
$81.1b +4.8%
Grocery Pharmacy
$13.0b +3.0% $588m +0.03%
Stats NZ June 2016

88
-5% 0% 5% 10% 15% 20% 25% 30% 35% 40%
Non-store and commission-based retailing (2%)
Specialised food (3%)
Liquor (3%)
Recreational goods (3%)
Furniture, floor coverings, houseware, textiles (4%)
Electrical and electronic goods (5%)
Accommodation (6%)
Clothing, footwear, and accessories (6%)
Department stores (7%)
Pharmaceutical and other store-based retailing (8%)
Hardware, building, and garden supplies (11%)
Food and beverage services (15%)
Supermarket and grocery stores (29%)
Retail Total Sales by Industry, Growth vs YA
4.8%
Stats NZ June 2016

99
-5% 0% 5% 10% 15% 20% 25% 30% 35% 40%
Non-store and commission-based retailing (2%)
Specialised food (3%)
Liquor (3%)
Recreational goods (3%)
Furniture, floor coverings, houseware, textiles (4%)
Electrical and electronic goods (5%)
Accommodation (6%)
Clothing, footwear, and accessories (6%)
Department stores (7%)
Pharmaceutical and other store-based retailing (8%)
Hardware, building, and garden supplies (11%)
Food and beverage services (15%)
Supermarket and grocery stores (29%)
Retail Total Sales by Industry, Growth vs YA
4.8%
Holiday Spending
$6.4b
Visitor Arrivals
3.5m
+11.8%
Data to year ending Dec 16
#1
1.4m
+6.2%
Holiday Visitors
1.8m
+16.2%
+10%
Stats NZ June 2016

1010
Online Retail Spending – 2016 vs LY
42%
+12%
+29%
58%
Split Growth
Vs.
56p
Copyright © 2017 Information Resources, Inc. (IRI). Confidential and Proprietary. 11
Today
Landscape The Market Trends

1212
Non-Food TOP 5 | Grocery
T Gcy
$13.0B+3.0%
1 2 3 54
Natural Health
-1.8%+4.3%
$ G
ro
wth
%MAT to 01.01.17
MAT to 03.01.16
+10.0%
MAT to 01.01.17
$ G
ro
wth
%

1313
TOP 5 | Pharmacy
1 2 3 54
T Pmcy
$588M+0.03%
Natural Health
+2.1%
$ G
ro
wth
% MAT to 01.01.17
MAT to 03.01.16
+19.5%
+2.8%
MAT to 01.01.17

1414
Total Defined ScannedNatural Health
Combined Grocery + Pharmacy
63%
62% 63%
38%
+
+2.9%
+2.1%
+4.3%
+$5.9M
+$2.7M
+$3.2M
Combined Pharmacy Grocery
Natural Health Growth
% $ Growth Actual Growth $(M)
+2.9%
$ G
ro
wth
%
MAT to 01.01.17
MAT to 03.01.16
+15.7%
1515
$1.72M
$0.11M
$3.80M
$0.89M $0.85M
-$1.39M
$1.38M
$0.48M
-$0.09M -$0.04M
-2.0M
-1.0M
0.0M
1.0M
2.0M
3.0M
4.0M
5.0M
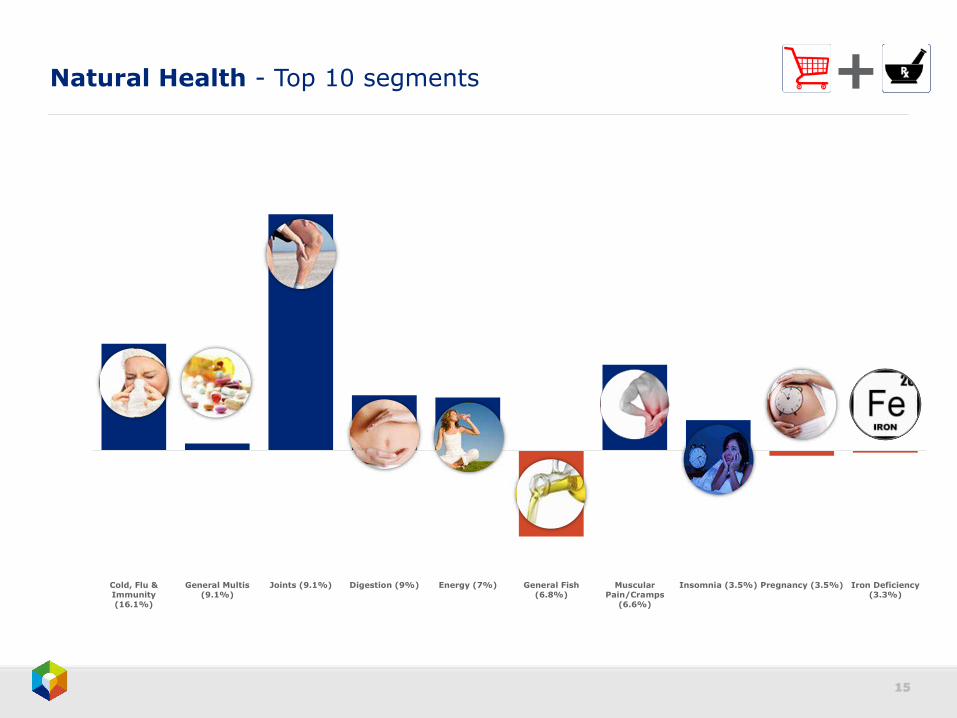
Cold, Flu &Immunity(16.1%)
General Multis(9.1%)
Joints (9.1%) Digestion (9%) Energy (7%) General Fish(6.8%)
MuscularPain/Cramps
(6.6%)
Insomnia (3.5%) Pregnancy (3.5%) Iron Deficiency(3.3%)
Natural Health - Top 10 segments +

1616
Natural Health – Joints +
#3 largest Natural Health segment
Clinic trial based evidence
DistributionPR
+24.9%value growth
63.3%of T. Natural Health
growth21%Share of T. Joints

1717
Natural Health – Cold, Flu & Immunity +
#1 largest Natural Health segment
38% of segment
84% of growth
+5.6%value growth
29.8%of T. Natural Health
growth

1818
Natural Health – General Fish Oil +
-$1,388k
-$627k
-$395k-$259k
-$70k -$37k
-1600000
-1400000
-1200000
-1000000
-800000
-600000
-400000
-200000
0
TotalGeneral
FishKrill Oil(17%)
Fish Oil(78%)
Salmon Oil(1.3%)
Krill Oil +Fish Oil(0.2%)
Cod LiverOil (4%)
$ Decline | National
#6 largest Natural Health segment
20.00
25.00
30.00
35.00
40.00
45.00
50.00
55.00
60.00
65.00
70.00
0.0
500000.0
1000000.0
1500000.0
2000000.0
2500000.0
3000000.0
3500000.0
4000000.0
4500000.0
5000000.0
Krill Oil decline
Dollars Price ($/Unit) Num Dist %
Contributing
to 45%of segment
decline

Copyright © 2017 Information Resources, Inc. (IRI). Confidential and Proprietary. 19
Today
Landscape The Market Trends

2020
Trends

2121
Trends

Copyright © 2017 Information Resources, Inc. (IRI). Confidential and Proprietary. 22
321
Turmeric - Natural Health
0
20000
40000
60000
80000
100000
120000
140000
160000
180000
2014 2015 2016 2017
Total Turmeric Supplements $ sales
+
3
6
7
13
SKU count
Turmeric Spices Segment
+25%Growth

2323
Trends

2424
Personal Care
Beverages
Organic Growth
T. Defined*
ORGANIC
+ 23.5%
14%
6%
Other12%
Chilled44%
Baby Needs15%
Baking & Cooking
9%

2525
Personal Care
Beverages14%
6%
Other12%
Chilled44%
Baby Needs15%
Baking & Cooking
9%
+ 77.4%Organic Fresh White Milk
Organic
- 8.7%Rest
Chilled44%
*price $/litre
5.6%
Organic Growth

2626
Personal Care
Beverages14%
6%
Other12%
Chilled44%
Baby Needs15%
Baking & Cooking
9%
Baby Needs15%
Organic Baby Food
40%
+ 14.9%Organic
+5.2%Rest
Organic Growth

2727
Personal Care
Beverages14%
6%
Other12%
Chilled44%
Baby Needs15%
Baking & Cooking
9%
Beverages14%
UHT Milk & Cream
Tea Coffee
Organic Growth
$3
1k
$1
94
k
$5
16
k
0
100000
200000
300000
400000
500000
600000
Kombucha | Dollars Sales Grocery | 2016 - 2017
Exponential growth

2828
Trends

2929
3030
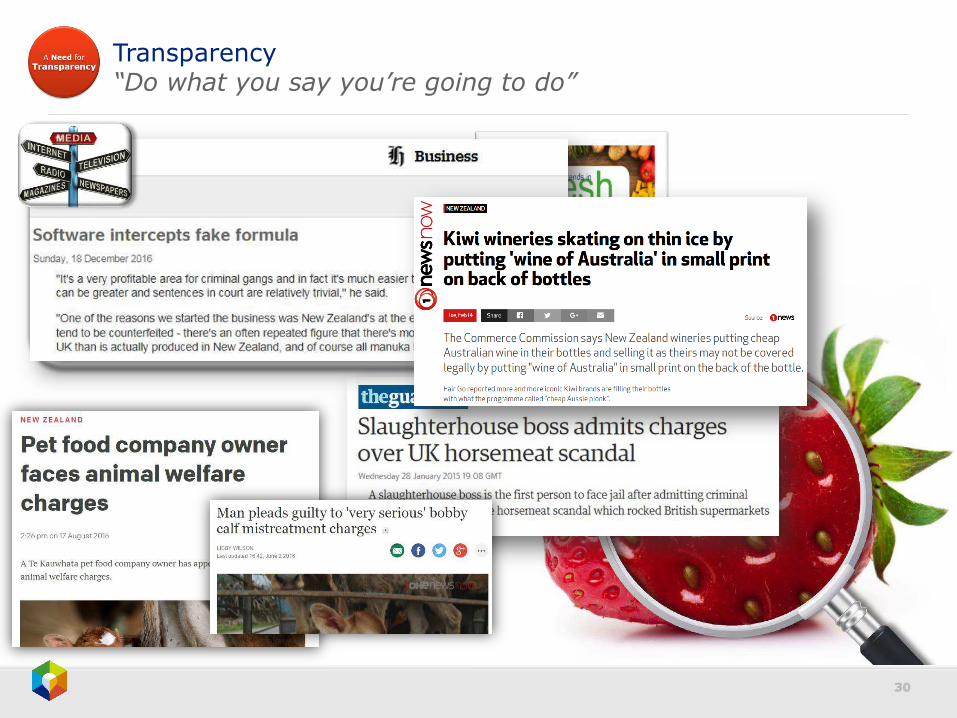
Transparency“Do what you say you’re going to do”
“The consumer desire to know how and where food was grown or made.
The consumer expectation for clarity, accuracy and usefulness of information from the companies that produce and sell it. ”
3131
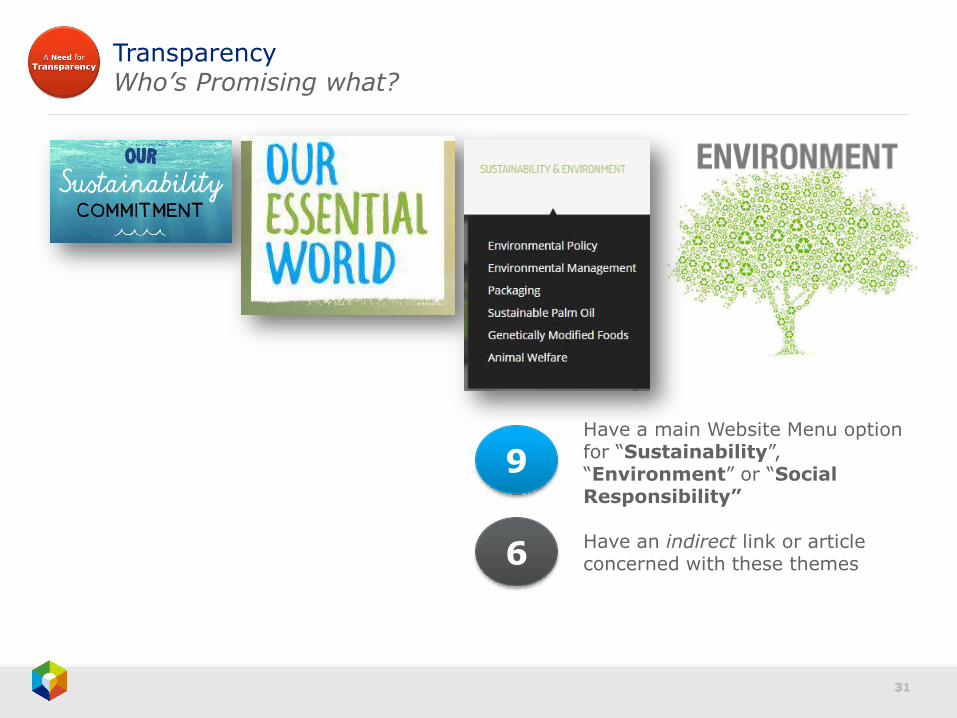
TransparencyWho’s Promising what?
9
6
Have a main Website Menu option for “Sustainability”, “Environment” or “Social Responsibility”
Have an indirect link or article concerned with these themes

3232
TransparencyWho’s Delivered?
“Brand transparency is directly related to industry trust, company loyalty and
long-term revenue”
+ 28%
+ 20%

3333
Landscape The Market Trends

34