current technology trends in public safetygo.eagleview.com/rs/226-jyl-231/images/current...
TRANSCRIPT
Current Technology Trends in Public Safety 1© 2008-2017 EagleView Technologies
An EagleView Report
Current Technology Trends in Public Safety
Current Technology Trends in Public Safety 2© 2008-2017 EagleView Technologies
Table of Contents
Overview Who We Are Part One: Challenges in Public Safety
Mass Killings & Gun Violence
Workplace Fatalities
9-1-1 Response Times
Challenges: Conclusion
Part Two: Solutions for Public Safety
Computer-Aided Dispatch & NG9-1-1
Geographic Information Systems
Interior Maps & Models
Solutions: Conclusion
Conclusion
Current Technology Trends in Public Safety 3© 2008-2017 EagleView Technologies
With high stakes, razor-thin margins for error, and high expectations from stakeholders, public safety has always been a
challenging field.
Pair that reality with tumultuous political and social landscapes and the need to keep up with an ever-changing mix of
technologies necessary to accomplish mission-critical objectives, and it’s no surprise that public safety and emergency
management consistently rank among the most complex fields of the 21st century.
As the landscape of public safety complexities evolves, so should the technology behind it.
From fusion centers and 9-1-1 public safety access points (PSAPs) to fire houses and police precincts, public safety has been
tasked with finding ways to better leverage the latest technology to reduce response times, enhance core capabilities,
improve personnel safety and accountability, and address the challenges of the Information Age.
The pressure is overwhelming, but it doesn’t have to be. Current Technology Trends in Public Safety explores the
prevalent issues at hand and outlines three key solutions to help prepare for, respond to, and recover from today’s public
safety challenges. The public safety experts at EagleView compiled this report using information from scholarly publications,
industry and market research, coverage from mainstream news outlets, and reports from public sector agencies.
Overview
3© 2008-2016 EagleView Technologies
Current Technology Trends in Public Safety
Current Technology Trends in Public Safety 4© 2008-2017 EagleView Technologies
EagleView is the leading provider of high-resolution Pictometry®
imagery and data capture for government and commercial industries.
With products ranging from oblique aerial imagery and GIS solutions
to three-dimensional building models and indoor mapping services,
EagleView serves public safety, assessment, GIS, infrastructure, insurance,
construction, solar, and facilities management markets throughout the
world. EagleView allows customers to view patented Pictometry imagery
through desktop applications, cloud-based solutions, and partner and
software integrations. For more information on the way EagleView is
transforming industries through imagery, go to www.eagleview.com.
Who We Are
Current Technology Trends in Public Safety 5© 2008-2017 EagleView Technologies
An EagleView Report
Part 1: Challenges in Public Safety
Current Technology Trends in Public Safety 6© 2008-2017 EagleView Technologies
Although day-to-day policing in North America may revolve around petty crime,
domestic disputes, and other minor incidents, it’s no secret that law enforcement
agencies have steadily increased their anti-terrorism efforts in recent years. Locations of
mass shootings and bombings often include “soft targets,” such as schools, universities,
churches, temples, restaurants, shopping malls, movie theaters, night clubs, post
offices, and high-profile planned events such as the Boston Marathon in 2013.
The Federal Bureau of Investigation (FBI) traditionally defined a mass murder as a
number of murders — typically four or more — that occur during the same incident.1
These crimes target victims indiscriminately and do not typically involve domestic or
gang-related disputes. More recently, the federal government has defined a mass killing
(regardless of weapon) as just three or more people killed in a single incident.2
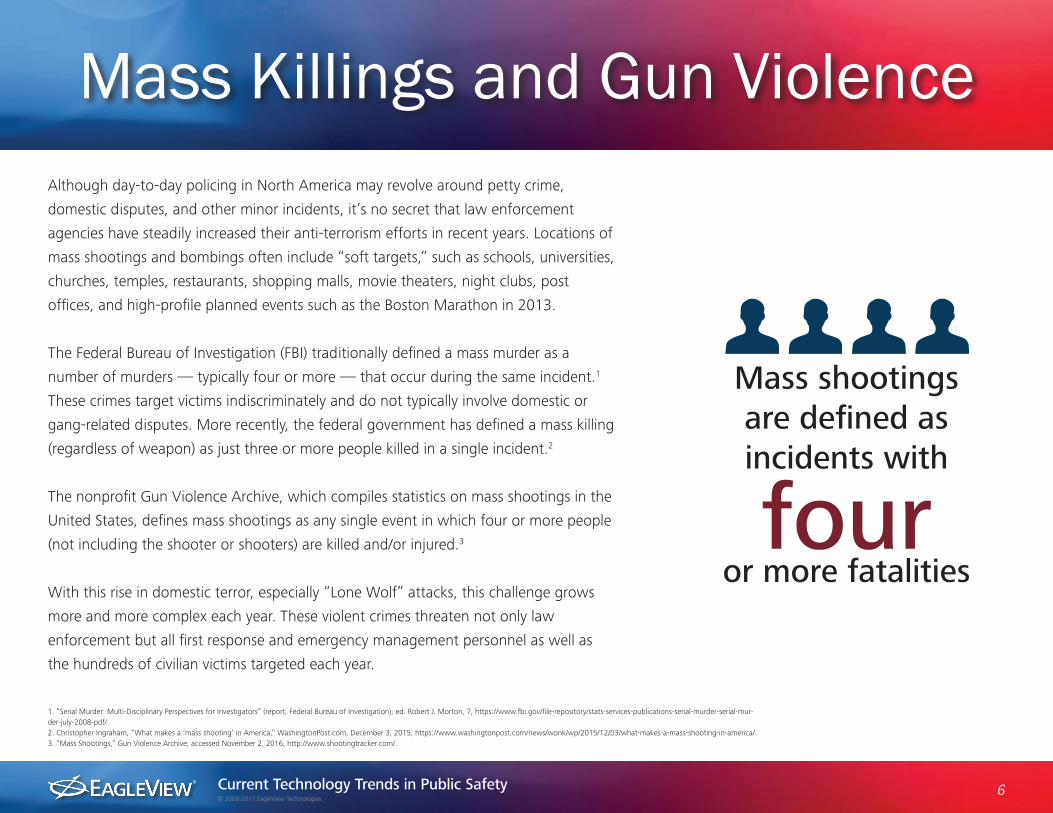
The nonprofit Gun Violence Archive, which compiles statistics on mass shootings in the
United States, defines mass shootings as any single event in which four or more people
(not including the shooter or shooters) are killed and/or injured.3
With this rise in domestic terror, especially “Lone Wolf” attacks, this challenge grows
more and more complex each year. These violent crimes threaten not only law
enforcement but all first response and emergency management personnel as well as
the hundreds of civilian victims targeted each year.
Mass Killings and Gun Violence
1. “Serial Murder: Multi-Disciplinary Perspectives for Investigators” (report, Federal Bureau of Investigation), ed. Robert J. Morton, 7, https://www.fbi.gov/file-repository/stats-services-publications-serial-murder-serial-mur-der-july-2008-pdf/.2. Christopher Ingraham, “What makes a ‘mass shooting’ in America,” WashingtonPost.com, December 3, 2015, https://www.washingtonpost.com/news/wonk/wp/2015/12/03/what-makes-a-mass-shooting-in-america/.3. “Mass Shootings,” Gun Violence Archive, accessed November 2, 2016, http://www.shootingtracker.com/.
Mass shootings are defined as incidents with
or more fatalitiesfour
Current Technology Trends in Public Safety 7© 2008-2017 EagleView Technologies
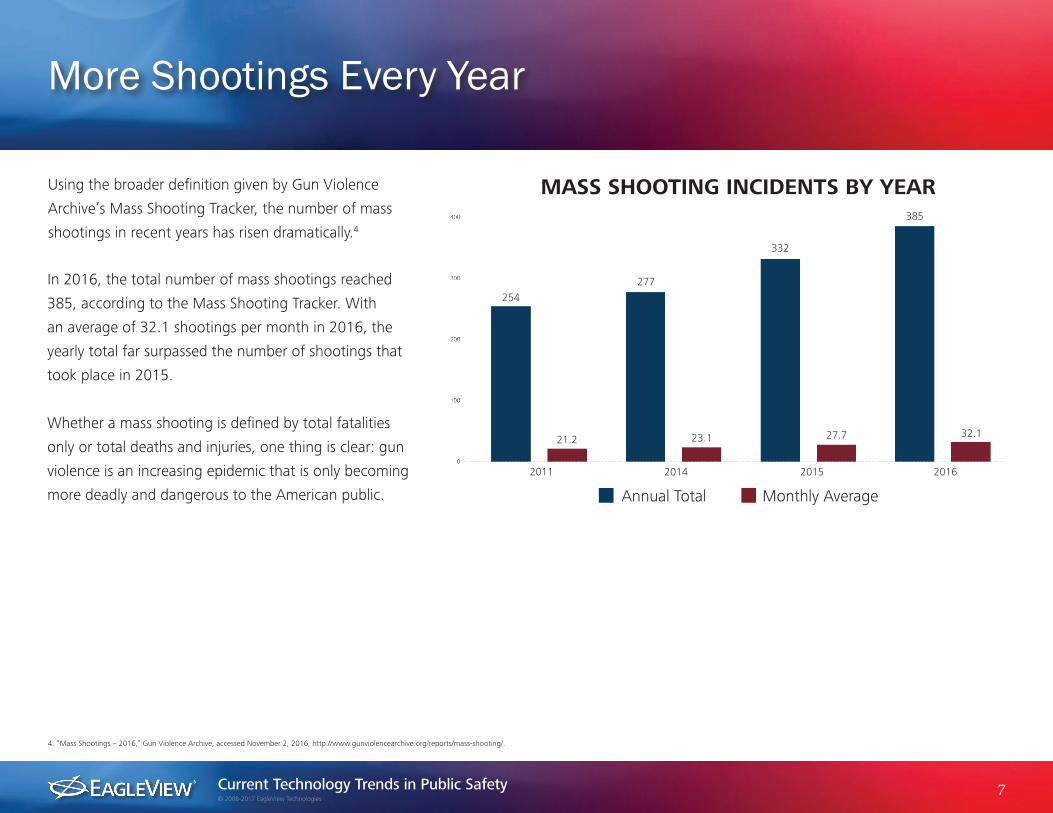
Using the broader definition given by Gun Violence
Archive’s Mass Shooting Tracker, the number of mass
shootings in recent years has risen dramatically.4
More Shootings Every Year
4. “Mass Shootings – 2016,” Gun Violence Archive, accessed November 2, 2016, http://www.gunviolencearchive.org/reports/mass-shooting/.
In 2016, the total number of mass shootings reached
385, according to the Mass Shooting Tracker. With
an average of 32.1 shootings per month in 2016, the
yearly total far surpassed the number of shootings that
took place in 2015.
Whether a mass shooting is defined by total fatalities
only or total deaths and injuries, one thing is clear: gun
violence is an increasing epidemic that is only becoming
more deadly and dangerous to the American public. Annual Total Monthly Average
MASS SHOOTING INCIDENTS BY YEAR
254
21.2
277
23.1
332
27.7
385
32.1
2011 2014 2015 2016
Current Technology Trends in Public Safety 8© 2008-2017 EagleView Technologies
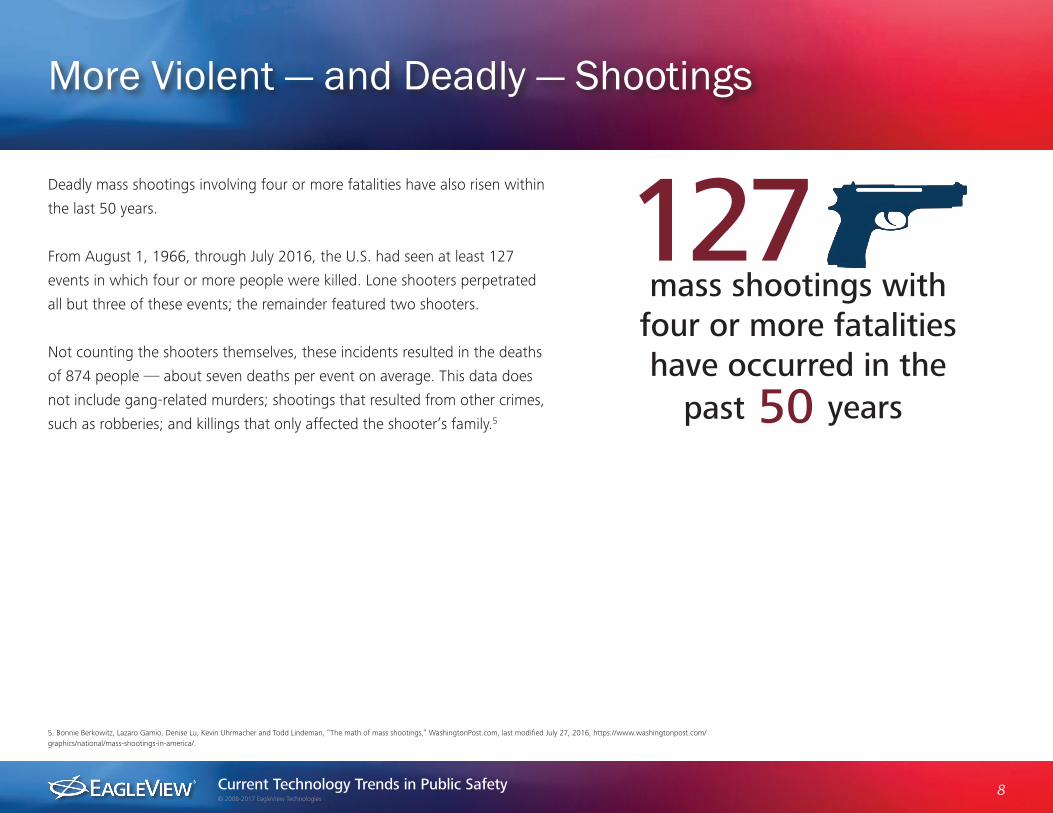
Deadly mass shootings involving four or more fatalities have also risen within
the last 50 years.
From August 1, 1966, through July 2016, the U.S. had seen at least 127
events in which four or more people were killed. Lone shooters perpetrated
all but three of these events; the remainder featured two shooters.
Not counting the shooters themselves, these incidents resulted in the deaths
of 874 people — about seven deaths per event on average. This data does
not include gang-related murders; shootings that resulted from other crimes,
such as robberies; and killings that only affected the shooter’s family.5
More Violent — and Deadly — Shootings
5. Bonnie Berkowitz, Lazaro Gamio, Denise Lu, Kevin Uhrmacher and Todd Lindeman, “The math of mass shootings,” WashingtonPost.com, last modified July 27, 2016, https://www.washingtonpost.com/graphics/national/mass-shootings-in-america/.
127past years50
mass shootings with four or more fatalities have occurred in the

Current Technology Trends in Public Safety 9© 2008-2017 EagleView Technologies
At least 43 mass shootings with three or more fatalities
have taken place since 2007. These deadly incidents
more than doubled from the decade prior (1997 to
2006) when 19 such shootings occurred. In fact, it’s
almost equal to the number of shootings spanning 20
years from 1987 to 2006, when 46 shootings with three
or more fatalities occurred.
The past decade alone has seen 375 fatalities, compared
to 249 total mass shooting fatalities from 1987 to 2006.
Injuries resulting from mass shootings between 2007
and 2016 totaled 364; between 1987 and 2006, there
were 280 people injured in mass shootings.
Mass Shootings on the Rise
6. Mark Follman, Gavin Aronsen and Deanna Pan, “US Mass Shootings, 1982-2016: Data From Mother Jones’ Investigation,” MotherJones.com, last modified July 17, 2016, http://www.motherjones.com/politics/2012/12/mass-shoot-ings-mother-jones-full-data/.
Shootings between 2007 and 2016 saw 739 total victims compared to 529 total victims between 1987 and 2006.6
In short, the most violent mass shootings in the U.S. have resulted in more deaths and injuries in the past 10 years than
they did in the 20 years prior to 2007. No doubt, the increase in mass shootings presents major challenges for public
safety departments across the United States, who now must plan for and respond to such emergencies.
MASS SHOOTINGS WITH 4 OR MORE FATALITIES BY DECADE
17
1987-1996
122157
1997-2006 2007-2016
19
127
279
123
250
43
375 364
739
Shootings Fatalities Injuries Total Victims
Current Technology Trends in Public Safety 10© 2008-2017 EagleView Technologies
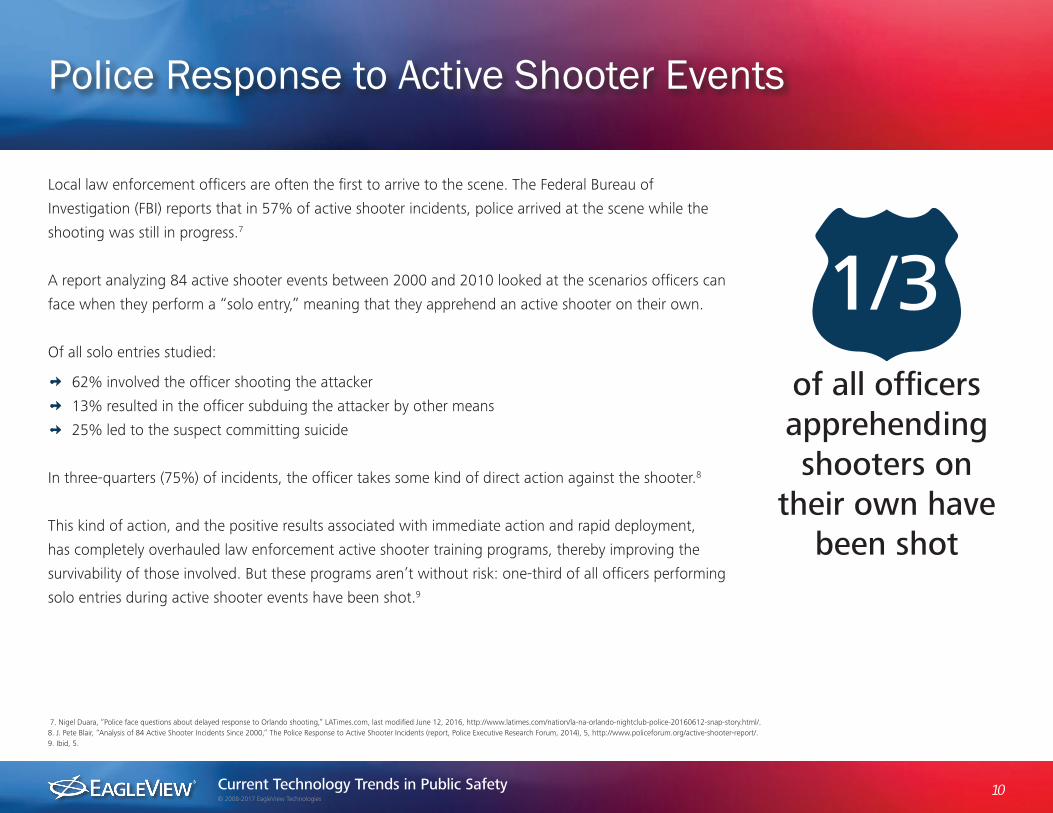
Local law enforcement officers are often the first to arrive to the scene. The Federal Bureau of
Investigation (FBI) reports that in 57% of active shooter incidents, police arrived at the scene while the
shooting was still in progress.7
A report analyzing 84 active shooter events between 2000 and 2010 looked at the scenarios officers can
face when they perform a “solo entry,” meaning that they apprehend an active shooter on their own.
Of all solo entries studied:
• 62% involved the officer shooting the attacker
• 13% resulted in the officer subduing the attacker by other means
• 25% led to the suspect committing suicide
In three-quarters (75%) of incidents, the officer takes some kind of direct action against the shooter.8
This kind of action, and the positive results associated with immediate action and rapid deployment,
has completely overhauled law enforcement active shooter training programs, thereby improving the
survivability of those involved. But these programs aren’t without risk: one-third of all officers performing
solo entries during active shooter events have been shot.9
Police Response to Active Shooter Events
7. Nigel Duara, “Police face questions about delayed response to Orlando shooting,” LATimes.com, last modified June 12, 2016, http://www.latimes.com/nation/la-na-orlando-nightclub-police-20160612-snap-story.html/.8. J. Pete Blair, “Analysis of 84 Active Shooter Incidents Since 2000,” The Police Response to Active Shooter Incidents (report, Police Executive Research Forum, 2014), 5, http://www.policeforum.org/active-shooter-report/.9. Ibid, 5.
of all officers apprehending shooters on
their own have been shot
1/3
Current Technology Trends in Public Safety 11© 2008-2017 EagleView Technologies
Gun violence isn’t just on the rise — it’s become far deadlier in recent years. Law enforcement officers and other emergency responders
need as much intelligence about a scene before they enter to subdue an attacker and treat gunshot wound victims. The faster police
arrive, the more quickly they can stop shootings in progress and secure the area for other emergency personnel. This, in turn, allows
firefighters and emergency medical services (EMS) to reach victims sooner and begin administering care to those injured.
In addition to civilian lives, however, this epidemic poses a threat to the emergency personnel who respond to crimes of violence.
Mass Shootings and Gun Violence Wrap-Up
Current Technology Trends in Public Safety 12© 2008-2017 EagleView Technologies
Violent crimes and catastrophic disasters don’t only place members of the public at risk. Members of law enforcement, fire departments, and
emergency medical personnel who respond to these events face considerable danger.
Some prevailing workplace risks:
• Police officers represent the majority of job-related fatalities each year among public safety personnel. They are also most at risk for assault.
• Firefighters report the most injuries, nearly half of which occur on the scene.
• Emergency medical personnel have the lowest fatality rates, but the nature of their work makes them most susceptible to injuries and illnesses.
With these threats, public safety personnel need to arrive on the scene informed, so they know the locations of the assailants and can administer
quick and efficient care to the victims. Emergency responders also need to know the risks present in critical situations. From potential hiding places
for active shooters to the locations of hazardous and explosive materials, emergency personnel face numerous threats when entering a scene and
need all the intelligence about a location that dispatchers have at their disposal.
Workplace Fatalities and Injuries
Police officers represent the majority of job-related fatalities each year
Current Technology Trends in Public Safety 13© 2008-2017 EagleView Technologies
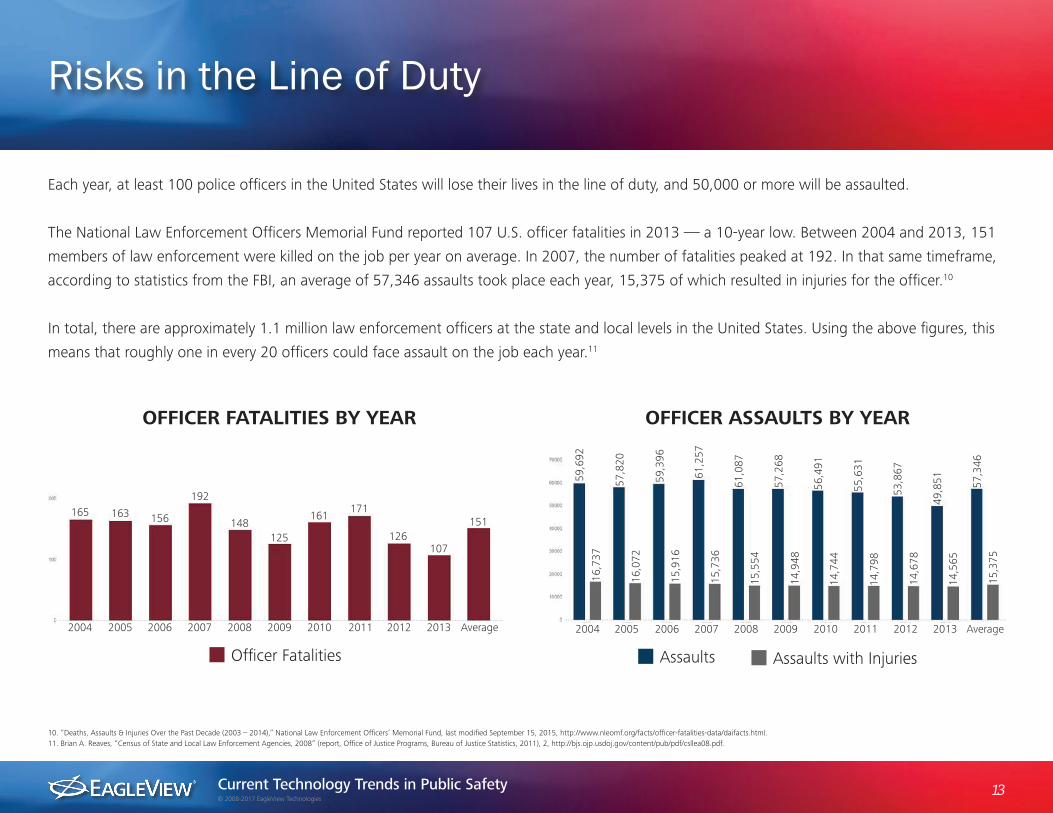
Each year, at least 100 police officers in the United States will lose their lives in the line of duty, and 50,000 or more will be assaulted.
The National Law Enforcement Officers Memorial Fund reported 107 U.S. officer fatalities in 2013 — a 10-year low. Between 2004 and 2013, 151
members of law enforcement were killed on the job per year on average. In 2007, the number of fatalities peaked at 192. In that same timeframe,
according to statistics from the FBI, an average of 57,346 assaults took place each year, 15,375 of which resulted in injuries for the officer.10
In total, there are approximately 1.1 million law enforcement officers at the state and local levels in the United States. Using the above figures, this
means that roughly one in every 20 officers could face assault on the job each year.11
Risks in the Line of Duty
10. “Deaths, Assaults & Injuries Over the Past Decade (2003 – 2014),” National Law Enforcement Officers’ Memorial Fund, last modified September 15, 2015, http://www.nleomf.org/facts/officer-fatalities-data/daifacts.html.11. Brian A. Reaves, “Census of State and Local Law Enforcement Agencies, 2008” (report, Office of Justice Programs, Bureau of Justice Statistics, 2011), 2, http://bjs.ojp.usdoj.gov/content/pub/pdf/csllea08.pdf.
Officer Fatalities
2004 2005 2006 2007 2008 2009 2010 2011 2012 2013 Average
165 163 156
192
148125
161171
126107
151
OFFICER FATALITIES BY YEAR OFFICER ASSAULTS BY YEAR
Assaults
2004 2005 2006 2007 2008 2009 2010 2011 2012 2013 Average
Assaults with Injuries
59,6
92
16,7
37
57,8
2016
,072
15,9
1659
,396
15,7
36
61,2
57
15,5
5461
,087
14,9
4857
,268
14,7
4456
,491
14,7
9855
,631
14,6
7853
,867
49,8
5114
,565
15,3
7557
,346
Current Technology Trends in Public Safety 14© 2008-2017 EagleView Technologies
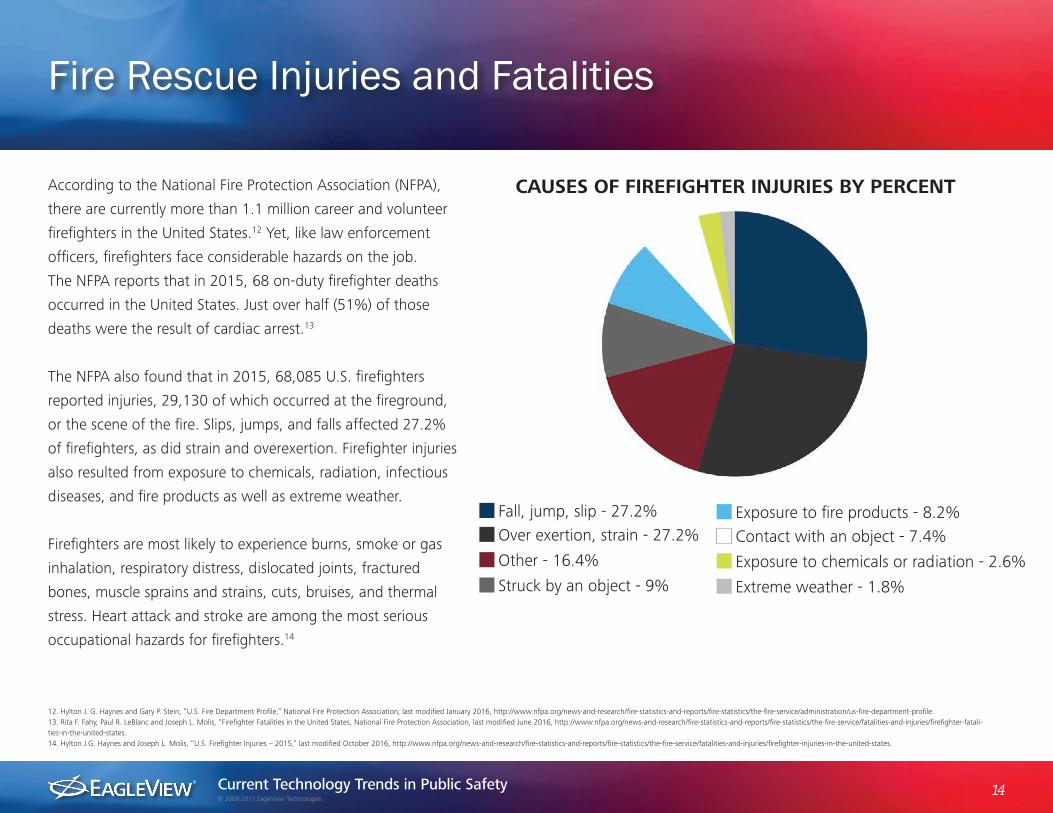
According to the National Fire Protection Association (NFPA),
there are currently more than 1.1 million career and volunteer
firefighters in the United States.12 Yet, like law enforcement
officers, firefighters face considerable hazards on the job.
The NFPA reports that in 2015, 68 on-duty firefighter deaths
occurred in the United States. Just over half (51%) of those
deaths were the result of cardiac arrest.13
The NFPA also found that in 2015, 68,085 U.S. firefighters
reported injuries, 29,130 of which occurred at the fireground,
or the scene of the fire. Slips, jumps, and falls affected 27.2%
of firefighters, as did strain and overexertion. Firefighter injuries
also resulted from exposure to chemicals, radiation, infectious
diseases, and fire products as well as extreme weather.
Firefighters are most likely to experience burns, smoke or gas
inhalation, respiratory distress, dislocated joints, fractured
bones, muscle sprains and strains, cuts, bruises, and thermal
stress. Heart attack and stroke are among the most serious
occupational hazards for firefighters.14
12. Hylton J. G. Haynes and Gary P. Stein, “U.S. Fire Department Profile,” National Fire Protection Association, last modified January 2016, http://www.nfpa.org/news-and-research/fire-statistics-and-reports/fire-statistics/the-fire-service/administration/us-fire-department-profile.13. Rita F. Fahy, Paul R. LeBlanc and Joseph L. Molis, “Firefighter Fatalities in the United States, National Fire Protection Association, last modified June 2016, http://www.nfpa.org/news-and-research/fire-statistics-and-reports/fire-statistics/the-fire-service/fatalities-and-injuries/firefighter-fatali-ties-in-the-united-states.14. Hylton J.G. Haynes and Joseph L. Molis, “U.S. Firefighter Injuries – 2015,” last modified October 2016, http://www.nfpa.org/news-and-research/fire-statistics-and-reports/fire-statistics/the-fire-service/fatalities-and-injuries/firefighter-injuries-in-the-united-states.
Fire Rescue Injuries and Fatalities
CAUSES OF FIREFIGHTER INJURIES BY PERCENT
Fall, jump, slip - 27.2%Over exertion, strain - 27.2%
Other - 16.4%
Struck by an object - 9%
Exposure to fire products - 8.2%Contact with an object - 7.4%
Exposure to chemicals or radiation - 2.6%
Extreme weather - 1.8%
Current Technology Trends in Public Safety 15© 2008-2017 EagleView Technologies
As of 2011, an estimated 826,000 licensed and credentialed emergency medical
services professionals worked in the United States, including both paid and
volunteer workers. In addition to EMTs and paramedics, firefighters and hospital
nurses may also administer life-saving care at the scene of an accident.15
Due to the nature of their jobs, all EMS workers face are susceptible to injuries
and illnesses. EMS workers often treat patients with infectious diseases and handle
various hazardous chemical and bodily substances. They also frequently suffer from
back injuries and other strains caused by lifting patients and equipment.
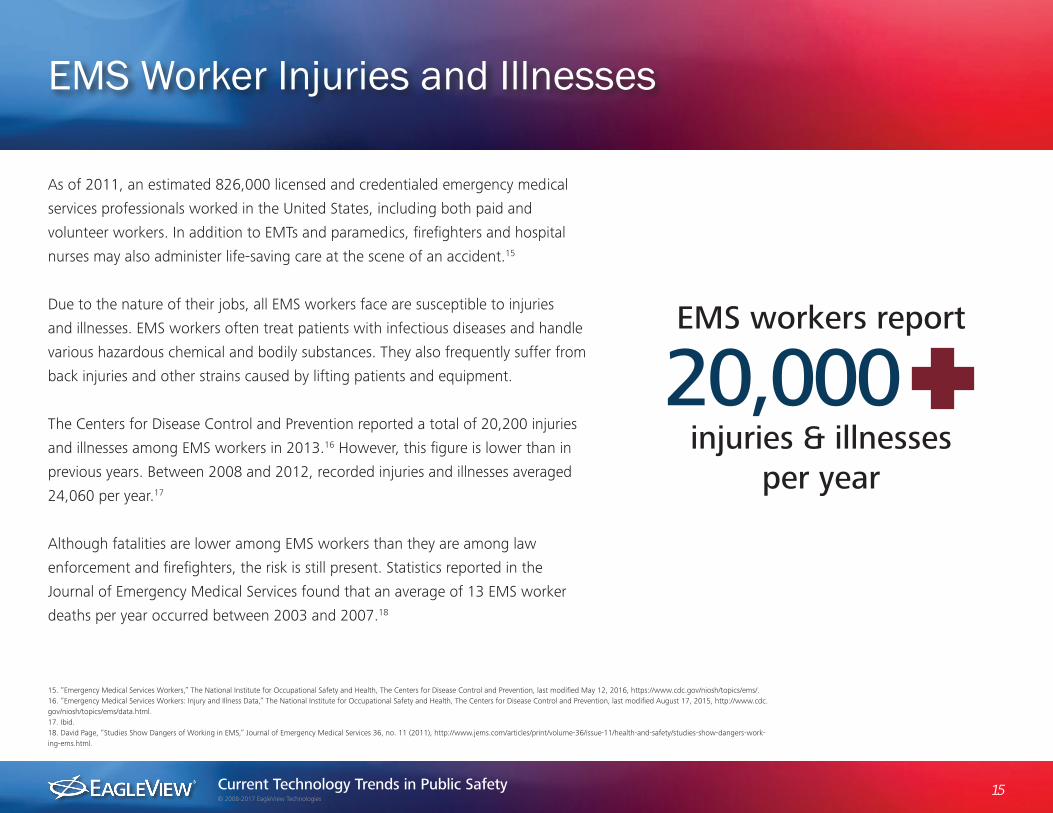
The Centers for Disease Control and Prevention reported a total of 20,200 injuries
and illnesses among EMS workers in 2013.16 However, this figure is lower than in
previous years. Between 2008 and 2012, recorded injuries and illnesses averaged
24,060 per year.17
Although fatalities are lower among EMS workers than they are among law
enforcement and firefighters, the risk is still present. Statistics reported in the
Journal of Emergency Medical Services found that an average of 13 EMS worker
deaths per year occurred between 2003 and 2007.18
EMS Worker Injuries and Illnesses
15. “Emergency Medical Services Workers,” The National Institute for Occupational Safety and Health, The Centers for Disease Control and Prevention, last modified May 12, 2016, https://www.cdc.gov/niosh/topics/ems/.16. “Emergency Medical Services Workers: Injury and Illness Data,” The National Institute for Occupational Safety and Health, The Centers for Disease Control and Prevention, last modified August 17, 2015, http://www.cdc.gov/niosh/topics/ems/data.html.17. Ibid.18. David Page, “Studies Show Dangers of Working in EMS,” Journal of Emergency Medical Services 36, no. 11 (2011), http://www.jems.com/articles/print/volume-36/issue-11/health-and-safety/studies-show-dangers-work-ing-ems.html.
EMS workers report
injuries & illnesses per year
20,000+
Current Technology Trends in Public Safety 16© 2008-2017 EagleView Technologies
First responders face on-the-job threats that are wholly unique to their line of work. Members of law enforcement are most likely to be assaulted
or killed while on duty. Firefighters and EMS workers, meanwhile, are also susceptible to injuries, illnesses, and fatalities.
Public safety personnel need to know as much about an emergency beforehand, so they can anticipate threats and take necessary precautions.
Knowing the potential location of a sniper, a building layout in the midst of a bomb threat, or the safest route to injured civilians can improve
safety for all men and women who put their lives on the line. Greater security for public safety personnel increases their ability to protect civilian
lives and administer life-saving treatment in a timely manner.
Workplace Fatalities and Injuries Wrap-Up
Current Technology Trends in Public Safety 17© 2008-2017 EagleView Technologies
In public safety, a “total response time” spans from the time of a 9-1-1 call all the way to
the scene of an emergency.19
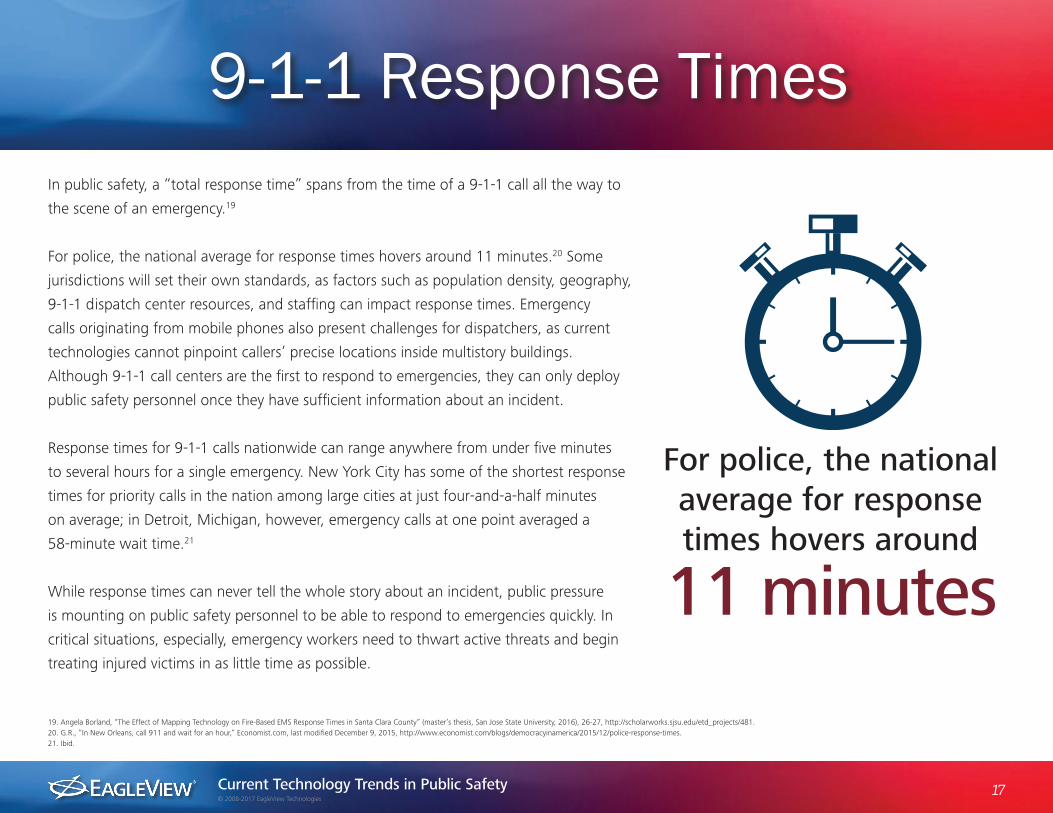
For police, the national average for response times hovers around 11 minutes.20 Some
jurisdictions will set their own standards, as factors such as population density, geography,
9-1-1 dispatch center resources, and staffing can impact response times. Emergency
calls originating from mobile phones also present challenges for dispatchers, as current
technologies cannot pinpoint callers’ precise locations inside multistory buildings.
Although 9-1-1 call centers are the first to respond to emergencies, they can only deploy
public safety personnel once they have sufficient information about an incident.
Response times for 9-1-1 calls nationwide can range anywhere from under five minutes
to several hours for a single emergency. New York City has some of the shortest response
times for priority calls in the nation among large cities at just four-and-a-half minutes
on average; in Detroit, Michigan, however, emergency calls at one point averaged a
58-minute wait time.21
While response times can never tell the whole story about an incident, public pressure
is mounting on public safety personnel to be able to respond to emergencies quickly. In
critical situations, especially, emergency workers need to thwart active threats and begin
treating injured victims in as little time as possible.
9-1-1 Response Times
19. Angela Borland, “The Effect of Mapping Technology on Fire-Based EMS Response Times in Santa Clara County” (master’s thesis, San Jose State University, 2016), 26-27, http://scholarworks.sjsu.edu/etd_projects/481.20. G.R., “In New Orleans, call 911 and wait for an hour,” Economist.com, last modified December 9, 2015, http://www.economist.com/blogs/democracyinamerica/2015/12/police-response-times.21. Ibid.
For police, the national average for response times hovers around
11 minutes
Current Technology Trends in Public Safety 18© 2008-2017 EagleView Technologies
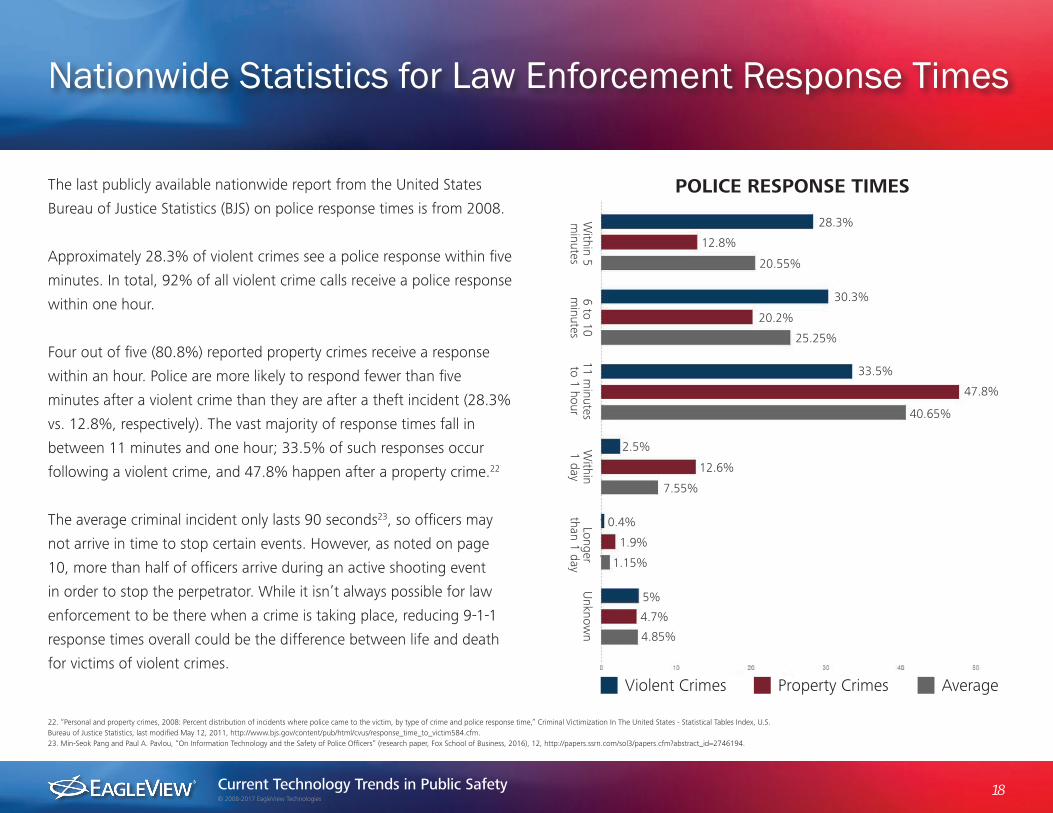
The last publicly available nationwide report from the United States
Bureau of Justice Statistics (BJS) on police response times is from 2008.
Approximately 28.3% of violent crimes see a police response within five
minutes. In total, 92% of all violent crime calls receive a police response
within one hour.
Four out of five (80.8%) reported property crimes receive a response
within an hour. Police are more likely to respond fewer than five
minutes after a violent crime than they are after a theft incident (28.3%
vs. 12.8%, respectively). The vast majority of response times fall in
between 11 minutes and one hour; 33.5% of such responses occur
following a violent crime, and 47.8% happen after a property crime.22
The average criminal incident only lasts 90 seconds23, so officers may
not arrive in time to stop certain events. However, as noted on page
10, more than half of officers arrive during an active shooting event
in order to stop the perpetrator. While it isn’t always possible for law
enforcement to be there when a crime is taking place, reducing 9-1-1
response times overall could be the difference between life and death
for victims of violent crimes.
Nationwide Statistics for Law Enforcement Response Times
22. “Personal and property crimes, 2008: Percent distribution of incidents where police came to the victim, by type of crime and police response time,” Criminal Victimization In The United States - Statistical Tables Index, U.S. Bureau of Justice Statistics, last modified May 12, 2011, http://www.bjs.gov/content/pub/html/cvus/response_time_to_victim584.cfm.23. Min-Seok Pang and Paul A. Pavlou, “On Information Technology and the Safety of Police Officers” (research paper, Fox School of Business, 2016), 12, http://papers.ssrn.com/sol3/papers.cfm?abstract_id=2746194.
POLICE RESPONSE TIMES
Violent Crimes AverageProperty Crimes
Within 5
minutes
6 to 10 m
inutes11 m
inutes to 1 hour
Within
1 dayLonger
than 1 dayU
nknown
28.3%
12.8%
20.55%
30.3%
20.2%
25.25%
33.5%
47.8%
40.65%
2.5%
12.6%
7.55%
0.4%
1.9%
1.15%
5%
4.7%
4.85%
Current Technology Trends in Public Safety 19© 2008-2017 EagleView Technologies
The National Fire Protection Association (NFPA) outlines the ideal timeframe for fire departments to respond to at least 90% of all emergencies
in its NFPA 1710: Standard for the Organization and Deployment of Fire Suppression Operations, Emergency Medical Operations, and Special
Operations to the Public by Career Fire Departments. The standard gives 80 seconds to turnout, four minutes for the arrival of the first engine
company, and eight minutes for the full first-alarm assignment.24
But despite the NFPA’s stringent standards, many fire departments are unable to mobilize and travel to the scene in that time. A report from the
Fire Protection Research Foundation, part of the NFPA, found that firefighters completed turnout in 80 seconds or under for just 60% of fire calls.
At night, the percentage fell even further: only 21% could complete turnout in 80 or fewer seconds for emergencies in the evening.25
Beyond the standards set by the NFPA, individual departments can also set their own targets for response based on their region’s layout,
population, and available resources. For instance, the response times for fire departments in Santa Clara County, California, vary depending upon
the location of the incident and type of assistance it requires. Times range from about eight to 13 minutes in urban response zones and from
about 10 to 15 minutes in suburban response zones. In rural or “wilderness” areas, fire departments should reach the scene in fewer than 12
minutes for higher priority emergencies and under 22 minutes for less urgent incidents.26
24. Borland, “The Effect of Mapping Technology on Fire-Based EMS Response Times in Santa Clara County,” 18.25. Robert Upson and Kathy Notarianni, “Quantitative Evaluation of Fire and EMS Mobilization Times” (report, Fire Protection Research Foundation, 2010), 1-2, http://www.nfpa.org/news-and-research/fire-statistics-and-re-ports/research-reports/for-emergency-responders/fireground-operations/quantitative-evaluation-of-fire-and-ems-mobilization-times. 26. Borland, “The Effect of Mapping Technology on Fire-Based EMS Response Times in Santa Clara County,” 15-17.
Fire Department Response Times
For at least
of emergency responses, firefighters should only take to turnout90% 80 seconds
Current Technology Trends in Public Safety 20© 2008-2017 EagleView Technologies
In the 1950s, Dr. R Adams Cowley developed the concept of the “Golden Hour.” According to this theory, a trauma patient has the
best chance of survival if cared for within 60 minutes of a critical injury.
The Golden Hour has since evolved into another theory in trauma care — the “Platinum Ten.” This gives EMS providers just 10 minutes
to arrive on the scene, assess the patient, administer treatment at the scene, and begin transporting the patient to the hospital.
Population density, size of the region, hospital locations, and available specialty resources can all factor into response times. For
example, the Rural/Metro ambulance service for Santa Clara County, California, is required to respond to EMS requests in just under 13
minutes of dispatch for at least 92% of the calls received.27 Other jurisdictions, however, may set their own standards.
Emergency Medical Services Response Times
27. Borland, “The Effect of Mapping Technology on Fire-Based EMS Response Times in Santa Clara County,” 14.
10 minutesEMS providers have justto arrive on the scene, assess the patient, administer treatment at the scene, and begin transporting the patient to the hospital

Current Technology Trends in Public Safety 21© 2008-2017 EagleView Technologies
Response times can’t tell the whole story, but they can provide a gauge for public safety to ensure that 9-1-1 calls are answered as soon as
possible. The sooner that emergency responders can reach a scene, the faster injured victims can receive life-saving treatments. Arriving on
the scene even a minute sooner could stop an active shooting event, decrease overall damage to a burning building, or even save a life.
9-1-1 Response Times Wrap-Up
Arriving on the scene even a minute sooner could stop an active shooting event, decrease overall damage to a burning building, or even save a life
Current Technology Trends in Public Safety 22© 2008-2017 EagleView Technologies
Incidents of violent crimes, domestic terror acts, and other emergencies present new challenges for public safety each year, and those events
show no signs of slowing down. As these violent crimes increase, they impact not only civilian victims but the officers, firefighters, and
emergency medical professionals who respond to such events.
Such life-threatening emergencies highlight the most crucial needs of public safety personnel. Before first responders arrive on the scene, 9-1-1
dispatchers must be able to give them information about a location and, if possible, help them navigate the inside of a building.
For instance, if officers know the locations of shooting suspects, explosive devices, and hazardous chemicals during an emergency, the number
of lives lost each year to violent crimes and other catastrophic events could significantly decrease. Mapping technology for 9-1-1 dispatchers
could help firefighters more easily locate a fire hydrant on a busy urban street or more efficiently lead paramedics to an injured person in a
large public building.
Reduced response times and greater location intelligence combined are vital when it comes to saving civilian lives and keeping
emergency response teams safe on the job.
The solutions featured in Part 2 of this report aren’t only designed to keep civilians and emergency personnel safe; they are also instrumental in
planning for — and preventing — such tragedies from occurring.
Challenges: Conclusion
Reduced response times and greater location intelligence are vital when it comes to saving civilian lives and keeping emergency response teams safe
Current Technology Trends in Public Safety 23© 2008-2017 EagleView Technologies
An EagleView Report
Part 2: Solutions for Public Safety
Current Technology Trends in Public Safety 24© 2008-2017 EagleView Technologies
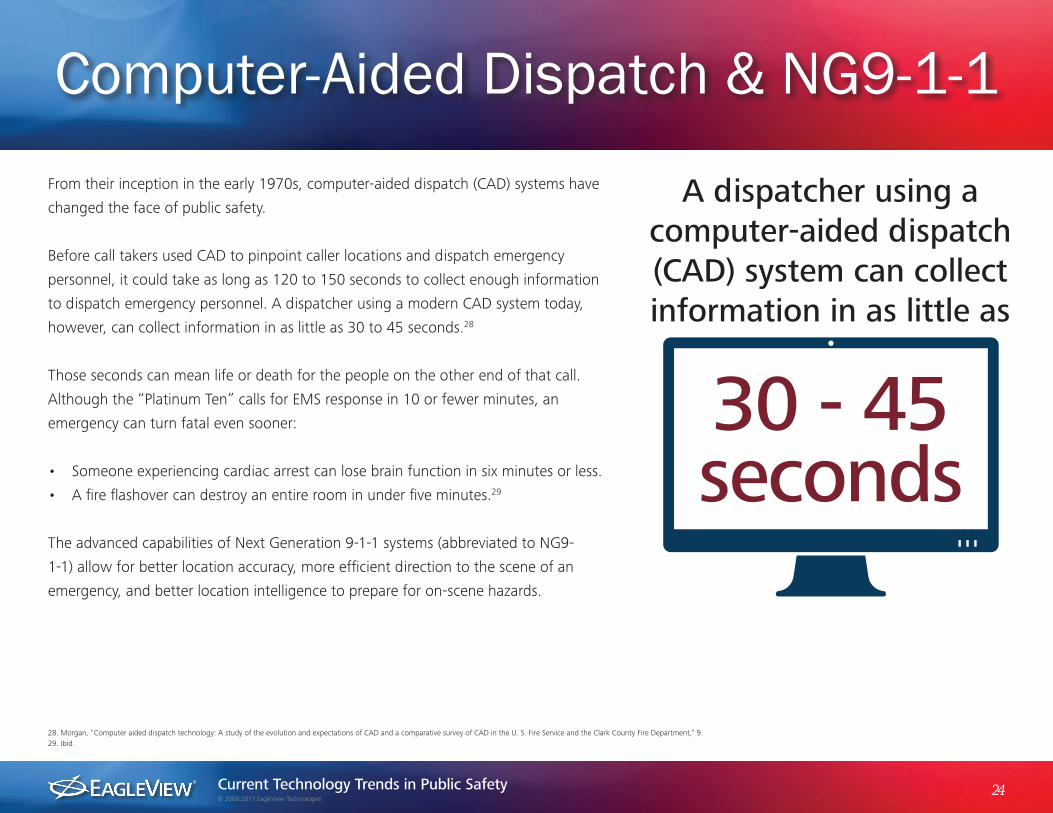
From their inception in the early 1970s, computer-aided dispatch (CAD) systems have
changed the face of public safety.
Before call takers used CAD to pinpoint caller locations and dispatch emergency
personnel, it could take as long as 120 to 150 seconds to collect enough information
to dispatch emergency personnel. A dispatcher using a modern CAD system today,
however, can collect information in as little as 30 to 45 seconds.28
Those seconds can mean life or death for the people on the other end of that call.
Although the “Platinum Ten” calls for EMS response in 10 or fewer minutes, an
emergency can turn fatal even sooner:
• Someone experiencing cardiac arrest can lose brain function in six minutes or less.
• A fire flashover can destroy an entire room in under five minutes.29
The advanced capabilities of Next Generation 9-1-1 systems (abbreviated to NG9-
1-1) allow for better location accuracy, more efficient direction to the scene of an
emergency, and better location intelligence to prepare for on-scene hazards.
Computer-Aided Dispatch & NG9-1-1
28. Morgan, “Computer aided dispatch technology: A study of the evolution and expectations of CAD and a comparative survey of CAD in the U. S. Fire Service and the Clark County Fire Department,” 9. 29. Ibid.
30 - 45 seconds
A dispatcher using a computer-aided dispatch (CAD) system can collect information in as little as
Current Technology Trends in Public Safety 25© 2008-2017 EagleView Technologies
The origins of computer-aided dispatch technology date back to 1972, when the Los Angeles Police Department worked with the Jet Propulsion
Laboratory to develop the first known CAD system to include Mobile Data Terminals (MDTs) in vehicles. They named their system the Emergency
Command and Control Communications System. Larger fire departments began using CAD systems in the early 1980s.30
Since the technology was so new and sophisticated for its time, the costs associated with the systems were prohibitive for all but the largest cities in
the United States. The Fire Department of New York was among the early adopters of CAD systems in 1980. At the time, their CAD system cost $15
million and connected 14 computers, 12 microcomputers, and 500 terminals – and it only covered one of the five boroughs.31
Today, virtually all 9-1-1 centers across the United States have modern CAD systems. Newer systems are equipped with a number of programs that
help identify callers from both landlines and cellular phones to pinpoint the location of the emergency. These systems also provide the dispatcher
and responders with any pertinent information about the incident or scene.
Uniformity between CAD systems is important when it comes to response times, in particular, especially among departments in the same county or
region.32 As a result, more regions are upgrading their dispatch systems to better communicate between jurisdictions and departments.
The most advanced CAD systems will use geographic information system (GIS) data to find the shortest and quickest routes for emergency vehicles
to the location of the incident. CAD systems can record calls for service and export them to a record or resource management system (RMS) for
further case management and analysis.33
The History of CAD
30. Kenneth E. Morgan, “Computer aided dispatch technology: A study of the evolution and expectations of CAD and a comparative survey of CAD in the U. S. Fire Service and the Clark County Fire Department” (master’s thesis, University of Nevada, Las Vegas, 2003), 8, http://digitalscholarship.unlv.edu/thesesdissertations/573/.31. Ibid, 13-14.32. Borland, “The Effect of Mapping Technology on Fire-Based EMS Response Times in Santa Clara County,” 55.33. “Geospatial Considerations for Emergency Call-Taking, Computer-Aided Dispatch, and Record Management Systems” (white paper, Esri, 2016), 4-5, http://www.esri.com/library/whitepapers/pdfs/geospatial-considerations-for-emergency-call-taking.pdf.
Current Technology Trends in Public Safety 26© 2008-2017 EagleView Technologies
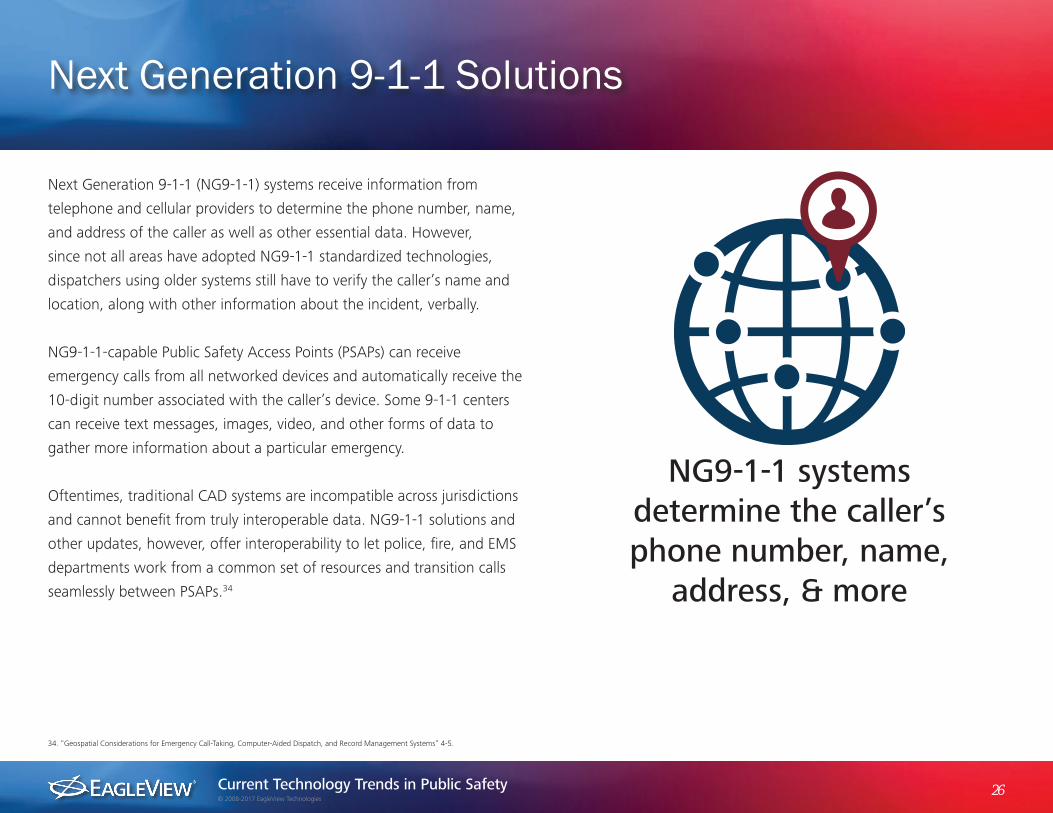
Next Generation 9-1-1 (NG9-1-1) systems receive information from
telephone and cellular providers to determine the phone number, name,
and address of the caller as well as other essential data. However,
since not all areas have adopted NG9-1-1 standardized technologies,
dispatchers using older systems still have to verify the caller’s name and
location, along with other information about the incident, verbally.
NG9-1-1-capable Public Safety Access Points (PSAPs) can receive
emergency calls from all networked devices and automatically receive the
10-digit number associated with the caller’s device. Some 9-1-1 centers
can receive text messages, images, video, and other forms of data to
gather more information about a particular emergency.
Oftentimes, traditional CAD systems are incompatible across jurisdictions
and cannot benefit from truly interoperable data. NG9-1-1 solutions and
other updates, however, offer interoperability to let police, fire, and EMS
departments work from a common set of resources and transition calls
seamlessly between PSAPs.34
Next Generation 9-1-1 Solutions
34. “Geospatial Considerations for Emergency Call-Taking, Computer-Aided Dispatch, and Record Management Systems” 4-5.
NG9-1-1 systems determine the caller’s phone number, name,
address, & more

Current Technology Trends in Public Safety 27© 2008-2017 EagleView Technologies
Through integration with other datasets and standardized interfaces, NG9-1-1 systems can give first responders comprehensive information on:
• The owners, occupants, and contents of a building: Firefighters may need to know information on potential occupants/evacuees or what
hazardous materials may be on the premises before they arrive on the scene.
• Building imagery: Aerial images of a building can help identify access points and proximity to other buildings in the area. Interior maps and
imagery, meanwhile, can direct personnel to specific rooms in large or multi-tenant buildings. In addition to using such images to respond to
emergencies, these images are useful in planning for and mitigating emergencies.
• Multimedia: Dispatchers and first responders can send 9-1-1 recordings, video clips, and other media through the CAD system and support
incident operations included in future operational periods.
Together, all of this information can help first responders stay safe at the scene of an incident, while informing and supporting larger operations
resource or emergency management coordination needs.35
Additional NG9-1-1 Capabilities
35. Jim Peterson, “Computer-Aided Dispatch: Why ‘Good Enough’ Isn’t Good Enough,” Fire Apparatus & Emergency Equipment, March 14, 2016, http://www.fireapparatusmagazine.com/articles/print/volume-21/issue-3/features/computer-aided-dispatch-why-good-enough-isn-t-good-enough.html.
Additional information can help first responders stay safe at the scene of an incident
Current Technology Trends in Public Safety 28© 2008-2017 EagleView Technologies
In an effort to improve response times, the U.S. Federal Communications Commission (FCC) has ordered wireless carriers to provide 9-1-1 call
centers with more accurate location information for calls that originate from mobile phones. The regulations, adopted in January 2015, apply
especially to multistory buildings and larger single-story buildings, with the focus moving from an ability to provide a caller’s street address, to
latitude/longitude coordinates and actual geolocation.
Due to a variety of factors, most current dispatch technology cannot pinpoint exact unit numbers or locations within multistory or multiunit
buildings. The FCC’s ruling asks wireless carriers to improve both horizontal and vertical location accuracy for an increasing percentage of wireless
9-1-1 calls within the next six to eight years.36
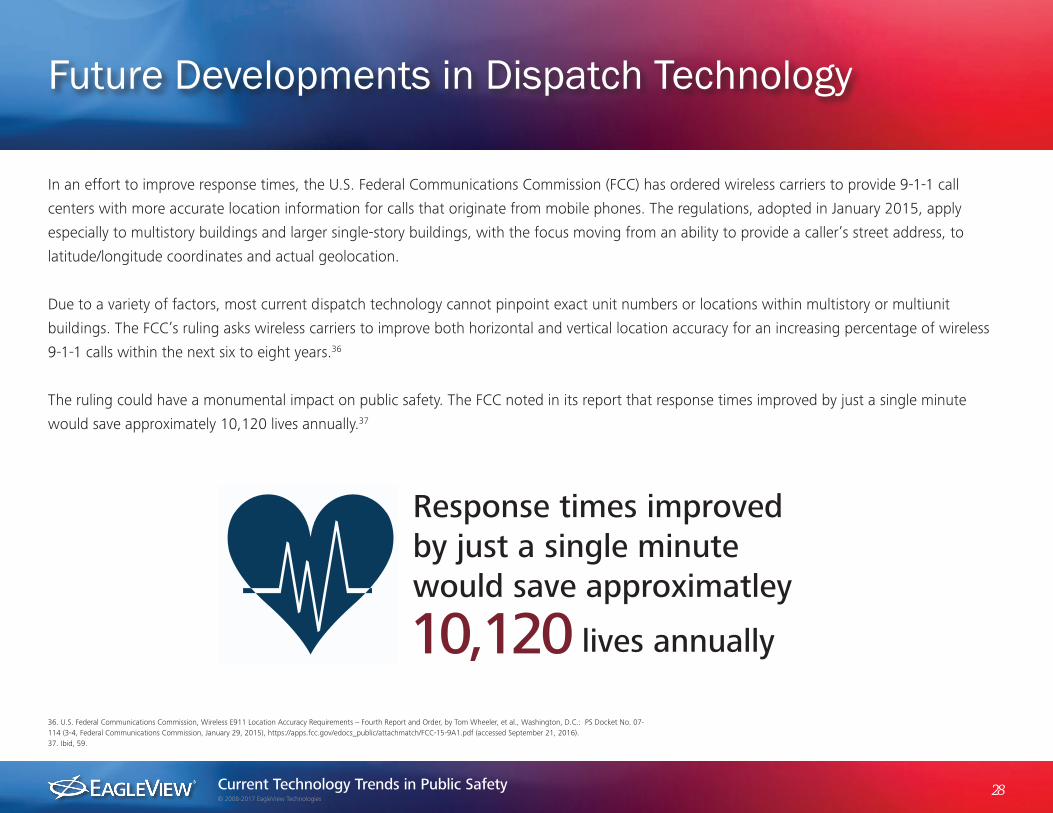
The ruling could have a monumental impact on public safety. The FCC noted in its report that response times improved by just a single minute
would save approximately 10,120 lives annually.37
Future Developments in Dispatch Technology
36. U.S. Federal Communications Commission, Wireless E911 Location Accuracy Requirements – Fourth Report and Order, by Tom Wheeler, et al., Washington, D.C.: PS Docket No. 07-114 (3-4, Federal Communications Commission, January 29, 2015), https://apps.fcc.gov/edocs_public/attachmatch/FCC-15-9A1.pdf (accessed September 21, 2016).37. Ibid, 59.
Response times improved by just a single minute would save approximatley
10,120 lives annually
Current Technology Trends in Public Safety 29© 2008-2017 EagleView Technologies
As public safety personnel respond to increasingly complex events, they need technology
that supports their efforts in the most critical moments. Today’s CAD and NG9-1-1 systems
facilitate information sharing between departments and jurisdictions and include advanced
capabilities that give call-takers and dispatchers comprehensive information about an
incident before emergency responders arrive on-scene.
However, these systems are not without their limitations. Public Safety Access Points still
encounter difficulties triangulating calls from mobile devices and cannot integrate GIS
imagery or multimedia reliably; they will need to meet new FCC standards in the coming
years to allow responders safe and efficient access to emergency scenes.
Computer-Aided Dispatch & NG9-1-1 Wrap-Up
34. Morgan, “Computer aided dispatch technology: A study of the evolution and expectations of CAD and a comparative survey of CAD in the U. S. Fire Service and the Clark County Fire Department,” 9. 35. Ibid.
Current Technology Trends in Public Safety 30© 2008-2017 EagleView Technologies
Mapping technology not only gets emergency vehicles from Point A to Point B, but it is also vital for public safety officials
who want to establish emergency protocols before an incident occurs.
Geographic information systems (GIS) can combine layers of disparate datasets into a computerized map that gives users
a fuller understanding of an area. GIS incorporates location data, aerial imagery, land features, building information,
topography, and more. Any collection of data plotted on a map is GIS.
Police, fire, emergency management, public works, planning, engineering, agriculture, and other government
departments all benefit from enterprise GIS and interdepartmental or multijurisdictional GIS exchange.
Geographic Information Systems
Current Technology Trends in Public Safety 31© 2008-2017 EagleView Technologies
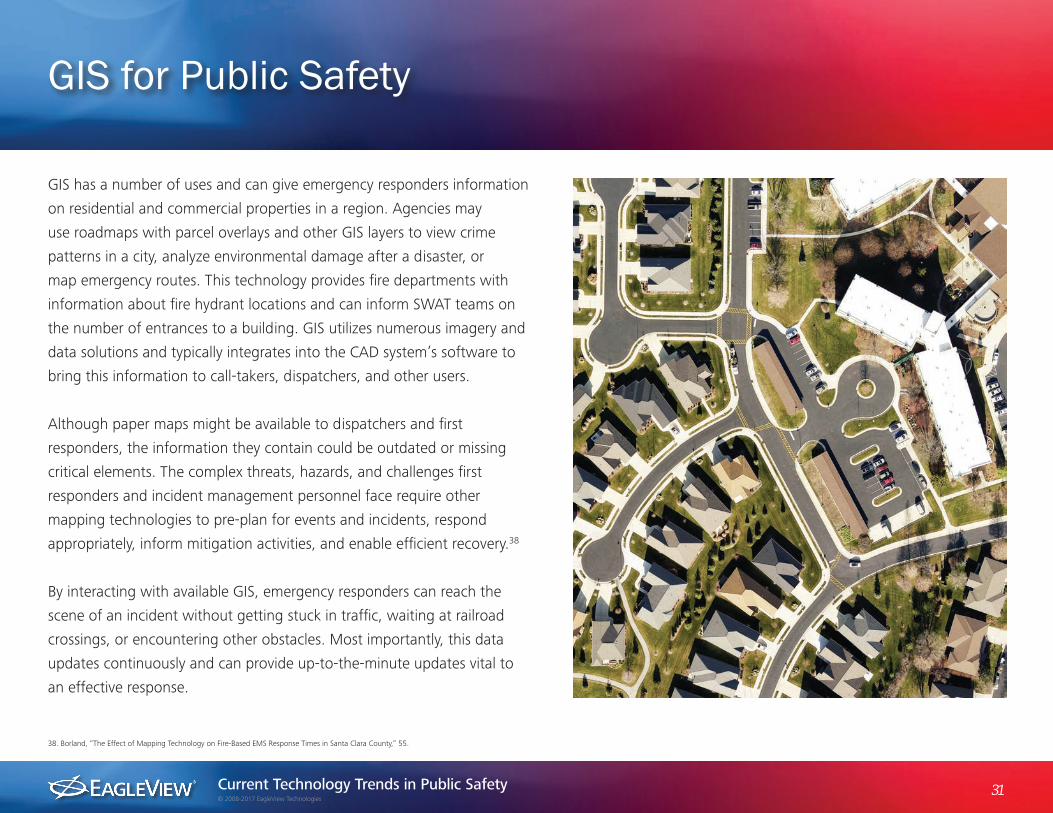
GIS has a number of uses and can give emergency responders information
on residential and commercial properties in a region. Agencies may
use roadmaps with parcel overlays and other GIS layers to view crime
patterns in a city, analyze environmental damage after a disaster, or
map emergency routes. This technology provides fire departments with
information about fire hydrant locations and can inform SWAT teams on
the number of entrances to a building. GIS utilizes numerous imagery and
data solutions and typically integrates into the CAD system’s software to
bring this information to call-takers, dispatchers, and other users.
Although paper maps might be available to dispatchers and first
responders, the information they contain could be outdated or missing
critical elements. The complex threats, hazards, and challenges first
responders and incident management personnel face require other
mapping technologies to pre-plan for events and incidents, respond
appropriately, inform mitigation activities, and enable efficient recovery.38
By interacting with available GIS, emergency responders can reach the
scene of an incident without getting stuck in traffic, waiting at railroad
crossings, or encountering other obstacles. Most importantly, this data
updates continuously and can provide up-to-the-minute updates vital to
an effective response.
GIS for Public Safety
38. Borland, “The Effect of Mapping Technology on Fire-Based EMS Response Times in Santa Clara County,” 55.
Current Technology Trends in Public Safety 32© 2008-2017 EagleView Technologies
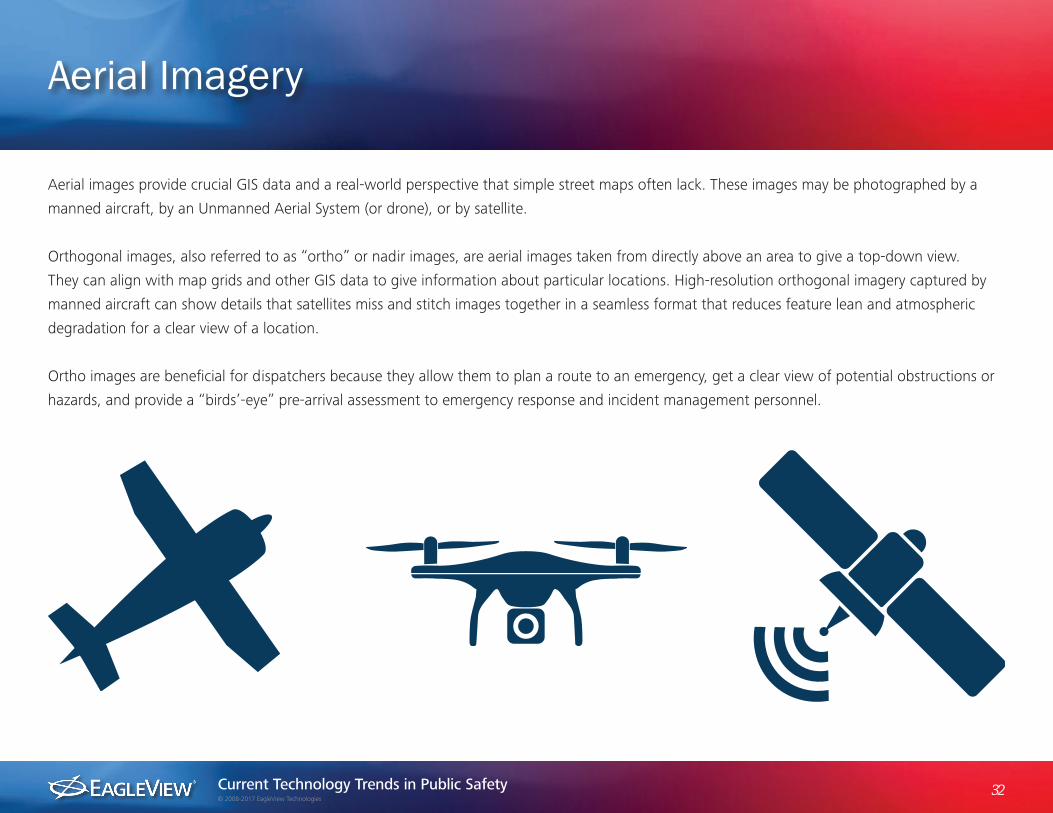
Aerial images provide crucial GIS data and a real-world perspective that simple street maps often lack. These images may be photographed by a
manned aircraft, by an Unmanned Aerial System (or drone), or by satellite.
Orthogonal images, also referred to as “ortho” or nadir images, are aerial images taken from directly above an area to give a top-down view.
They can align with map grids and other GIS data to give information about particular locations. High-resolution orthogonal imagery captured by
manned aircraft can show details that satellites miss and stitch images together in a seamless format that reduces feature lean and atmospheric
degradation for a clear view of a location.
Ortho images are beneficial for dispatchers because they allow them to plan a route to an emergency, get a clear view of potential obstructions or
hazards, and provide a “birds’-eye” pre-arrival assessment to emergency response and incident management personnel.
Aerial Imagery
Current Technology Trends in Public Safety 33© 2008-2017 EagleView Technologies
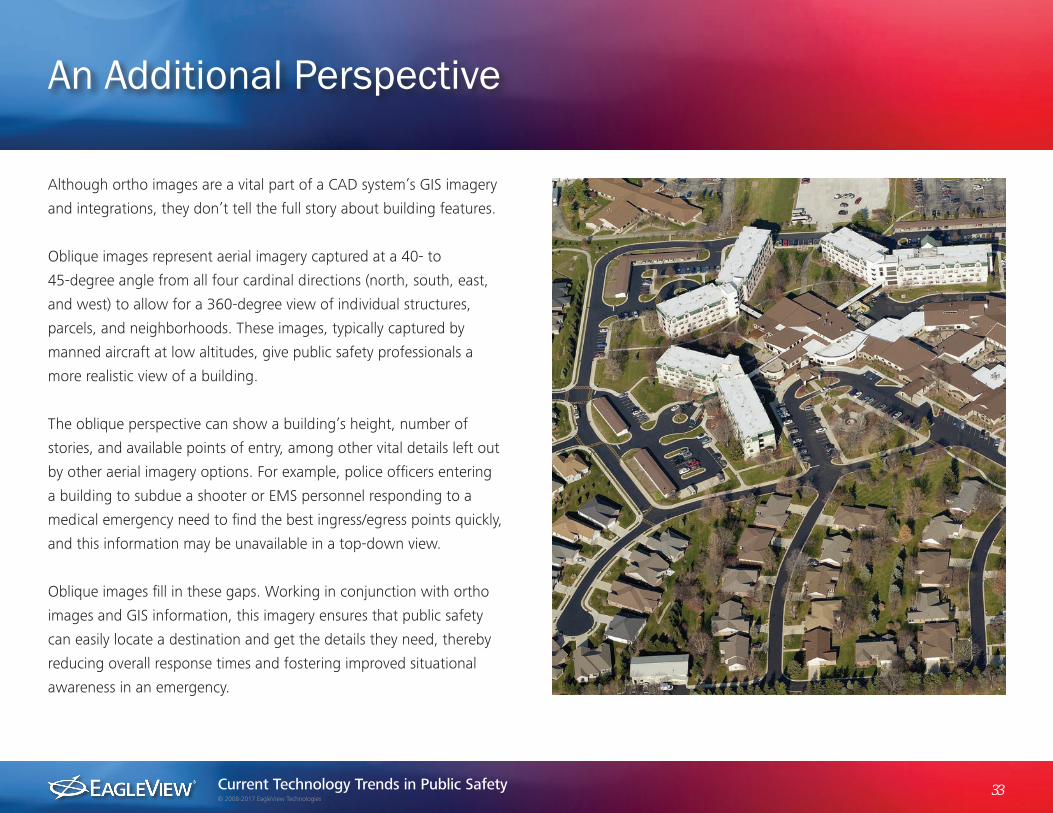
Although ortho images are a vital part of a CAD system’s GIS imagery
and integrations, they don’t tell the full story about building features.
Oblique images represent aerial imagery captured at a 40- to
45-degree angle from all four cardinal directions (north, south, east,
and west) to allow for a 360-degree view of individual structures,
parcels, and neighborhoods. These images, typically captured by
manned aircraft at low altitudes, give public safety professionals a
more realistic view of a building.
The oblique perspective can show a building’s height, number of
stories, and available points of entry, among other vital details left out
by other aerial imagery options. For example, police officers entering
a building to subdue a shooter or EMS personnel responding to a
medical emergency need to find the best ingress/egress points quickly,
and this information may be unavailable in a top-down view.
Oblique images fill in these gaps. Working in conjunction with ortho
images and GIS information, this imagery ensures that public safety
can easily locate a destination and get the details they need, thereby
reducing overall response times and fostering improved situational
awareness in an emergency.
An Additional Perspective
Current Technology Trends in Public Safety 34© 2008-2017 EagleView Technologies
Emergency response
Many jurisdictions use street-level imagery to see details of a building up close, but such
resources only allow them to view what is captured from public roadways. In an event
where emergency responders must navigate a large rural property, a college campus, or
an apartment complex, street-view images may lack the desired details for the job. With
comprehensive GIS data and aerial imagery, however, dispatchers can better direct first
responders through difficult-to-navigate locations, while responders utilize these images
for more granular information that assist their initial responsibilities on-scene.
Crime mapping and analytics
In addition to responding to incidents reactively, public safety personnel can use
analytics and mapping technologies to proactively identify hotspots for crime, fire and
incident reports, traffic collisions, or other events. With this data, police can create
visual representations of past crime occurrences, gang behavior, or weapons and drug
trades; fire departments can better understand location and complainant history; and
other partners – such as the departments of transportation (DOT) and public works
(DPW) – can better understand behaviors and trends in an area.
Future integrations with artificial intelligence and machine learning provide
opportunities for predictive policing, proactive fire protection, risk-based community
education, and other unique solutions to both local and regional problems.
How Public Safety Personnel Use GIS
Current Technology Trends in Public Safety 35© 2008-2017 EagleView Technologies
A CAD or NG9-1-1 system is incomplete without comprehensive location intelligence. Geographic information systems support public safety in
emergency response, emergency planning, crime analysis, and other responsibilities. GIS data and imagery integrate into existing public safety
software, so the information that dispatchers, law enforcement, and other personnel need fits seamlessly into a daily workflow.
High-resolution aerial imagery gives public safety professionals instant access to a location even before they’re on the scene. By knowing
potential access points, hazards, and other information about a structure, officers responding to violent crimes can safely mitigate threats and
hazards and reach victims faster.
By using GIS to respond to events, analyze hot spots for crime, or develop disaster response protocols, public safety officials can better serve
their communities and make informed decisions.
Geographic Information Systems Wrap-Up
By using GIS to respond to events, public safety officials can better serve their communities
Current Technology Trends in Public Safety 36© 2008-2017 EagleView Technologies
Street maps and aerial images aren’t the only vital resources integrating with CAD systems and mobile data terminals
these days. As buildings and campuses grow more complex, indoor mapping and imagery are emerging as necessities
in the field of public safety; indoor, 360-degree imagery provides critical intelligence where other tools fall short.
Interior building maps can give public safety professionals a detailed view of a building and offer a more lifelike
rendition of a property than blueprints and simple two-dimensional maps can display. This data can aid in all phases
of emergency response and management, from pre-planning to evacuation and crisis response.
Interior Maps and Models
360-degree imagery for interior building maps can give public safety professionals a more lifelike view of a building
Current Technology Trends in Public Safety 37© 2008-2017 EagleView Technologies
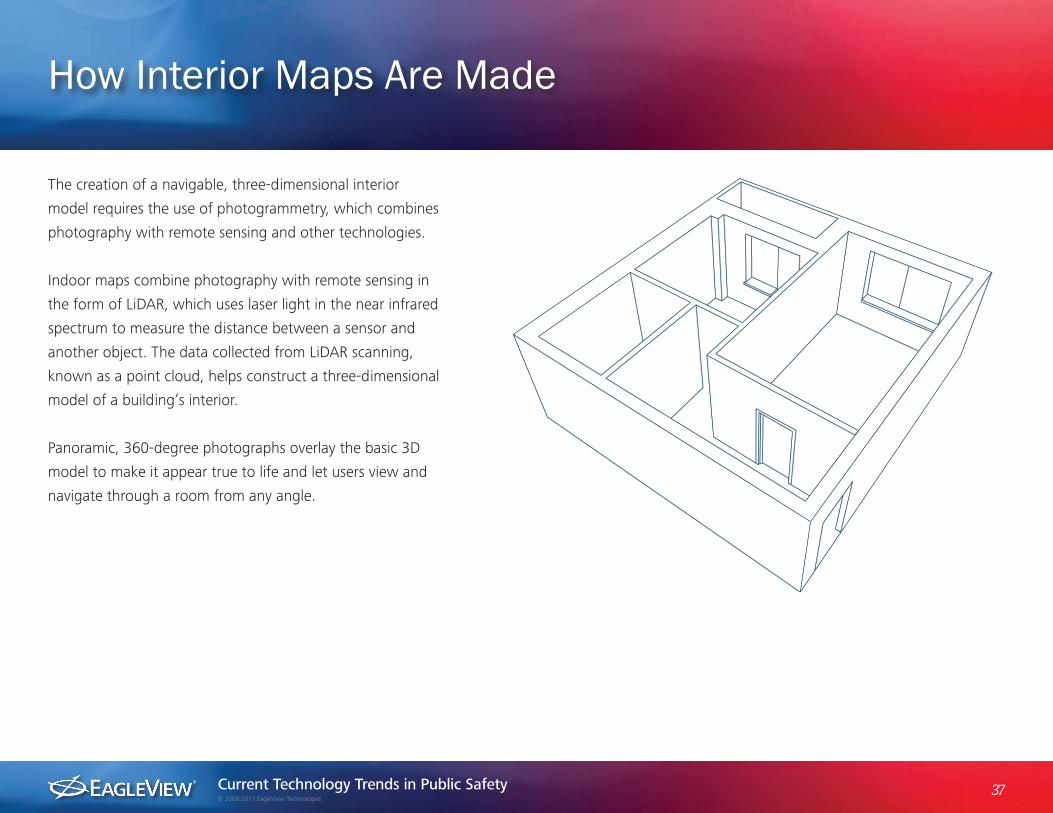
The creation of a navigable, three-dimensional interior
model requires the use of photogrammetry, which combines
photography with remote sensing and other technologies.
Indoor maps combine photography with remote sensing in
the form of LiDAR, which uses laser light in the near infrared
spectrum to measure the distance between a sensor and
another object. The data collected from LiDAR scanning,
known as a point cloud, helps construct a three-dimensional
model of a building’s interior.
Panoramic, 360-degree photographs overlay the basic 3D
model to make it appear true to life and let users view and
navigate through a room from any angle.
How Interior Maps Are Made
Current Technology Trends in Public Safety 38© 2008-2017 EagleView Technologies
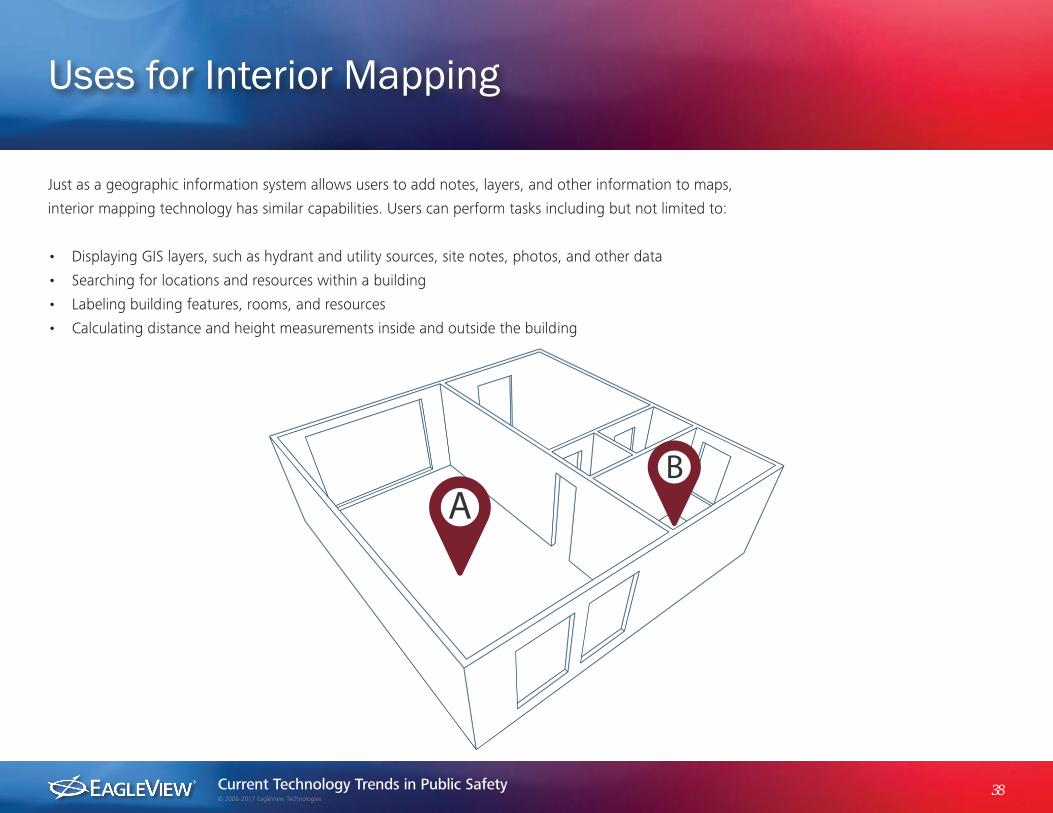
Just as a geographic information system allows users to add notes, layers, and other information to maps,
interior mapping technology has similar capabilities. Users can perform tasks including but not limited to:
• Displaying GIS layers, such as hydrant and utility sources, site notes, photos, and other data
• Searching for locations and resources within a building
• Labeling building features, rooms, and resources
• Calculating distance and height measurements inside and outside the building
Uses for Interior Mapping
Current Technology Trends in Public Safety 39© 2008-2017 EagleView Technologies
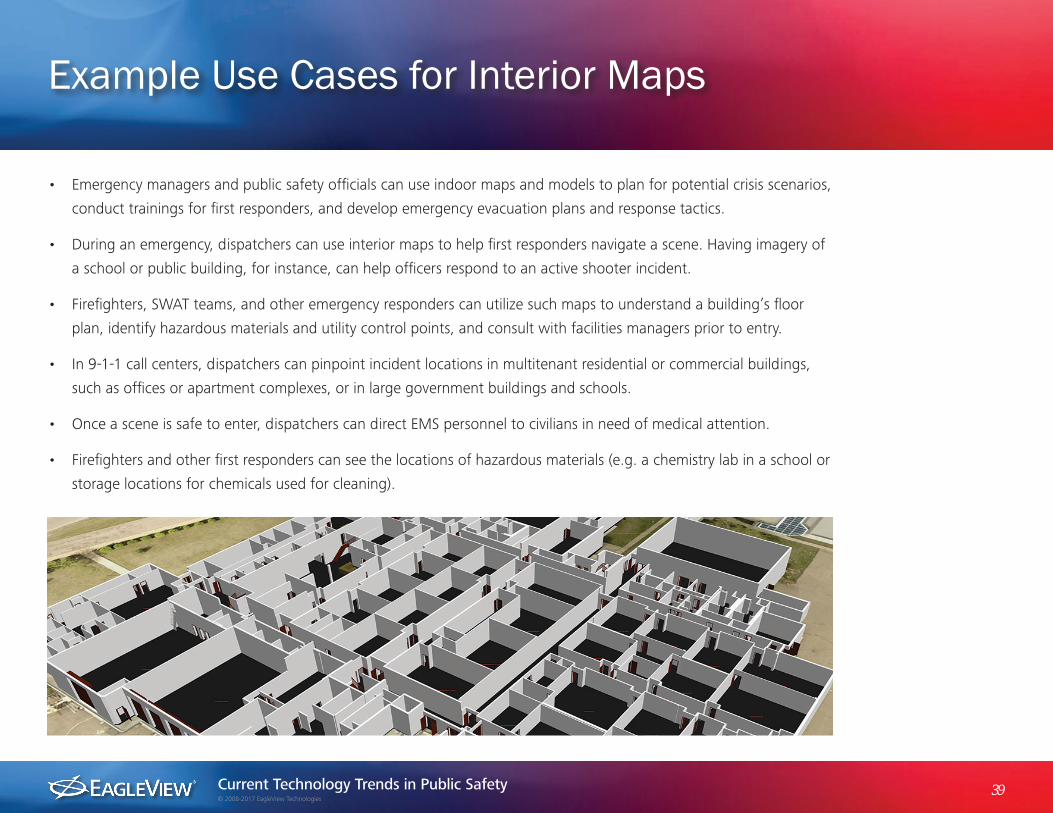
• Emergency managers and public safety officials can use indoor maps and models to plan for potential crisis scenarios,
conduct trainings for first responders, and develop emergency evacuation plans and response tactics.
• During an emergency, dispatchers can use interior maps to help first responders navigate a scene. Having imagery of
a school or public building, for instance, can help officers respond to an active shooter incident.
• Firefighters, SWAT teams, and other emergency responders can utilize such maps to understand a building’s floor
plan, identify hazardous materials and utility control points, and consult with facilities managers prior to entry.
• In 9-1-1 call centers, dispatchers can pinpoint incident locations in multitenant residential or commercial buildings,
such as offices or apartment complexes, or in large government buildings and schools.
• Once a scene is safe to enter, dispatchers can direct EMS personnel to civilians in need of medical attention.
• Firefighters and other first responders can see the locations of hazardous materials (e.g. a chemistry lab in a school or
storage locations for chemicals used for cleaning).
Example Use Cases for Interior Maps
Current Technology Trends in Public Safety 40© 2008-2017 EagleView Technologies
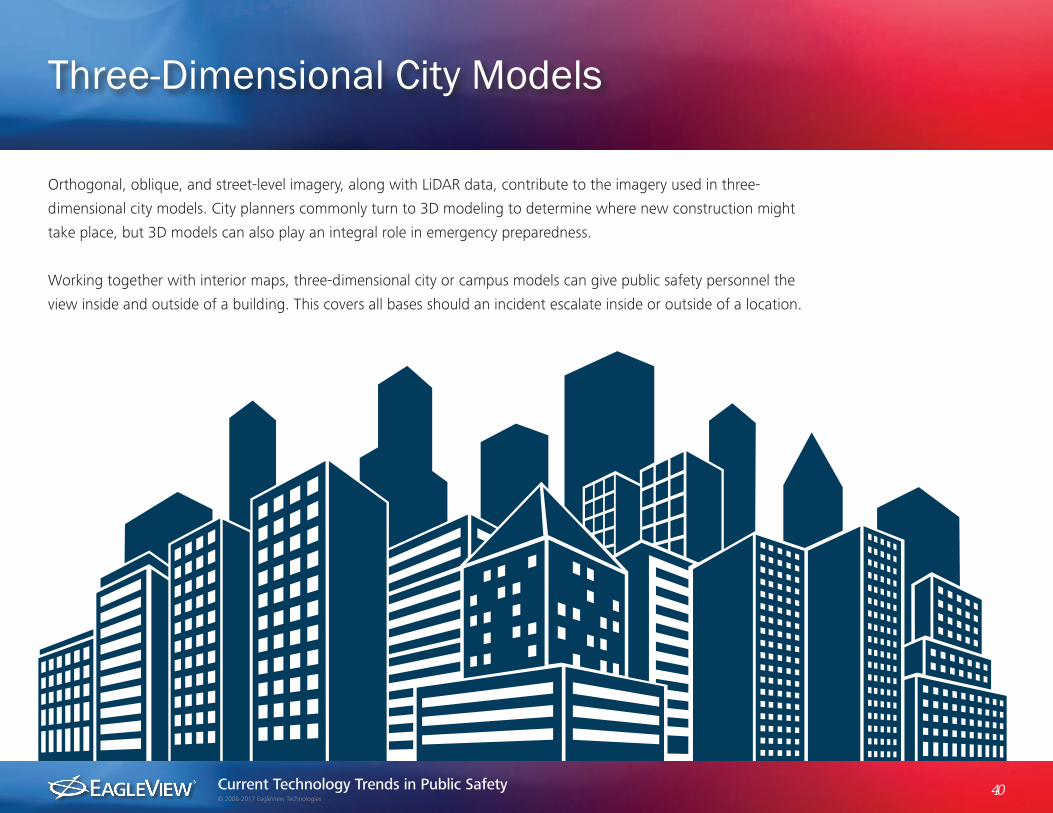
Orthogonal, oblique, and street-level imagery, along with LiDAR data, contribute to the imagery used in three-
dimensional city models. City planners commonly turn to 3D modeling to determine where new construction might
take place, but 3D models can also play an integral role in emergency preparedness.
Working together with interior maps, three-dimensional city or campus models can give public safety personnel the
view inside and outside of a building. This covers all bases should an incident escalate inside or outside of a location.
Three-Dimensional City Models
Current Technology Trends in Public Safety 41© 2008-2017 EagleView Technologies
• Public safety professionals may use this imagery to determine surrounding exposures or hydrant locations near a particular address, and the
models can assist with pre-planning ahead of fires and other incidents.
• Emergency planners and city managers can use such models to plan for high-profile events; for instance, they may need to allocate public safety
resources for a sporting event or visit from a world leader.
• More advanced 3D models may superimpose aerial imagery onto geographic features as well as geo-reference the 3D models to actual latitude
and longitude coordinates. This gives first responders information about a building’s height, number of stories, and access points.
• Public safety personnel can also use the building information to measure distances, such as a ballistics trajectory in a shooting incident.
Example Use Cases for 3D Models
Public safety professionals may use this imagery to determine surrounding exposures or hydrant locations near a particular address
Current Technology Trends in Public Safety 42© 2008-2017 EagleView Technologies
When an emergency takes place or disaster strikes, public
safety personnel need to know more than how to reach the
scene. While comprehensive GIS data and imagery are vital
in public safety, knowing how to navigate large buildings is
another key component of emergency response.
Interior building imagery and data can help emergency
personnel mitigate threats, seek out injured civilians, or handle
other emergencies. Public safety professionals can add GIS
layers and notations to these maps to denote the presence of
hazardous materials, emergency supplies, entry points, and
other building features and resources.
Finally, managing high-profile events and allocating public
safety resources is possible right from a desktop or mobile
device through the combined use of three-dimensional
models, maps, and interior building imagery.
Interior Maps and Models Wrap-Up
When an emergency takes place or disaster strikes, public
safety personnel need to know what stands between
them and the outcome
Current Technology Trends in Public Safety 43© 2008-2017 EagleView Technologies
Today’s technology is providing answers to some of the most difficult problems that public safety
professionals encounter. With the right imagery and data, first responders and emergency management
personnel can improve safety for everyone involved in an incident.
The technology response personnel employ needs to evolve along with the hazards they face.
Aerial imagery needs to offer more than a top-down view. Oblique images, taken from about a
45-degree angle, capture all sides of a building and allow users to measure heights and distances, as
well as see critical access points. Interior building maps and three-dimensional models give public safety
access to schools, government facilities, and other properties before an incident can occur. The imagery
and data found in these three-dimensional, comprehensive solutions give dispatchers crucial details, so
officers apprehending active shooters and medical personnel attending to victims can stay safe.
Improvements in computer-aided dispatch systems allow for increased capabilities both online and
offline. With government regulations pertaining to mobile phone triangulation putting pressure on
jurisdictions, resources like Next Generation 9-1-1, interior mapping technology, and oblique aerial
photography can lead to more precise call location in an emergency. Because integrations for NG9-1-1
can include aerial imagery, 3D city models, interior building maps, dispatchers and first responders can
find locations and analyze information when timing is critical.
Solutions: Conclusion
Current Technology Trends in Public Safety 44© 2008-2017 EagleView Technologies
Public safety organizations require solutions that will give their personnel all the information they need to reach emergencies more efficiently,
handle critical situations, communicate with partners, and promote safety among stakeholders.
Law enforcement, fire rescue, and emergency medical services officials should consider the possibilities new technologies bring in order to better
serve and protect the public. These solutions include:
• Orthogonal and oblique aerial imagery that gives public safety professionals a clear look at a location before, during, or after an emergency or
large-scale disaster
• Interior building maps and three-dimensional models that allow users to have a comprehensive and realistic view of a property
• CAD and NG9-1-1 systems that incorporate aerial imagery and GIS data, as well as interior maps to better locate civilians in need during a crisis
GIS not only gives public safety a clear route to a traffic accident but also allows emergency personnel to analyze traffic patterns, map criminal
incidents, and obtain comprehensive building data before arriving on scene. While public safety agencies aim to reach civilians in a timely manner,
they also need to make informed decisions about every incident and ensure the safety of everyone involved.
With a combination of these technologies, public safety personnel have the resources needed to plan for and respond to emergencies and better
serve their communities.
Conclusion

Current Technology Trends in Public Safety 45© 2008-2017 EagleView Technologies
An EagleView Report
To learn more about how interior mapping and other public safety
solutions can be integrated together to best serve your
organization or jurisdiction, visit www.eagleview.com.