cvrd - expertune · belo horizonte vitória porto tubarão ... the level of the silo vary...
TRANSCRIPT
1
Use of Performance Supervision Software at an Iron Ore Processing
PlantBernardo Soares Torres, M.Sc. (ATAN)
Lívia Camargos Rodrigues de Oliveira (ATAN)Leonardo Antônio da Silva (CVRD)
Roberto Dias Aquino (CVRD)Felipe Novaes Caldas (CVRD)
Vicentino Rodrigues, M.Sc. (CVRD)
CVRD

2
CVRD – A broad presence around the globe
New Business
Geology
Commercial representatives
Manganese
California Steel Industries
GIIC
CVRD Location in Brazil
South System
Carajás
São Luis
Belo HorizonteVitória
Porto Tubarão
Porto Itaguai
Itabira
North System

3
Conceição Mine
Location:Itabira – MG Brazil
CVRD Iron Ore Production
CVRD iron ore production grew 15% per year from 2001 to 2005. With the new investments, it is expected to reach 300 Mtpy* in 2007.
300.0
264.4
233.8
211.3
188.3
167.8
133.8 2001
2002
2003
2004
2005
2006E
2007E
* Under US GAAP

4
Market shareAmérica
do Sul2,2% África
1,3%
Oriente Médio3,3%
América Norte3,6%
Brasil17,8%
Europa30,8%
Asia41,7%
Human Resources are Limited!
How to assess hundreds of control loops simultaneously?

5
Empowerment
Corporate KPIsWhat is necessary to have meaningful global grades?
• Appropriate choice of KPIs, which can be distinct for different types of loops and control objectives
• Proper configuration of status bit for each loop and unit• Normalized configuration of Baselines & Thresholds between similar
groups of loops at similiar plants• Periodic review of B&Ts• Limit %T grades to a max value (CVRD Vision)
By following these steps carefully, the global grade for each loop, unit operation and plant will be representative of the process performance.

6
Treemap at CVRD Control Room
Dashboards - Operational View
After the operator choose the loop in the treemap, they
can do a detailed
analysis of it.

7
Treemap – Plant Comparison –Management approach
Comparison among the plants’ grades

8
Operational Intelligence Center
The Importance of Comunication:Change Management
GROWTH CYCLE
RESISTANCE CYCLE
The unknown leads to
Threats and fears Defensive behavior
Increases the resistance
CHANGE
Involves and informs
Brings opportunities personal benefits
Creativity andeveryone’s participation
Increases the opening for

9
Control Loop Optimization Examples: Actions taken• Standardization and correction of the PIDs’ implementation
in the PLCs;• Addition of filters in the loops that exhibit excessive noise;• Identification of the loops having saturation of the actuator
and measurement problems, which limit the controller action;• Discussion and review of the control strategies being used;• Experimental implementation of the proposed control
strategy for pulp sumps;• Analysis of the tuning of all loops audited;• Quantification of stiction and/or histeresis in the actuators of
loops presenting oscillation due to valve non-linearities.
1 - Implementation of regulatory control in the crushing feed
Source: Automation team – Conceição Mine
...
...
Primary crusher pile
Mass
Level
A B
Upper and lower limits for the level of the silo vary
frequently
Great Mass Variations
The limits of the sieves’ current are
often achieved
10
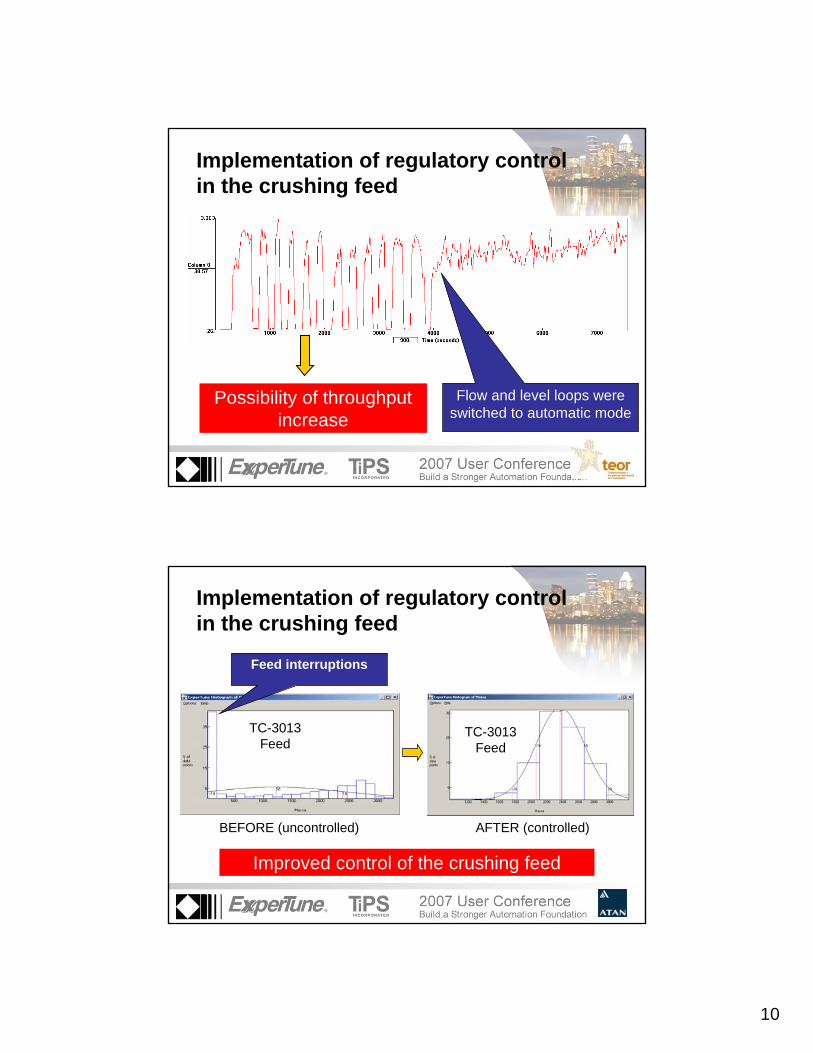
Implementation of regulatory control in the crushing feed
Flow and level loops were switched to automatic mode
Possibility of throughput increase
Implementation of regulatory control in the crushing feed
BEFORE (uncontrolled) AFTER (controlled)
TC-3013 Feed
TC-3013 Feed
Improved control of the crushing feed
Feed interruptions

11
Implementation of regulatory control in the crushing feed
BEFORE (uncontrolled) AFTER (controlled)
Increase in the average mass fed
TC-3013 TC-3013
Implementation of regulatory control in the crushing feed
Improvements:
• Increase in the crushing throughput;
• Reduction of the cost per ton produced;
• Increase in the flexibility of the operation, maintenance
and mine;
• Maximization of the asset’s use.
12
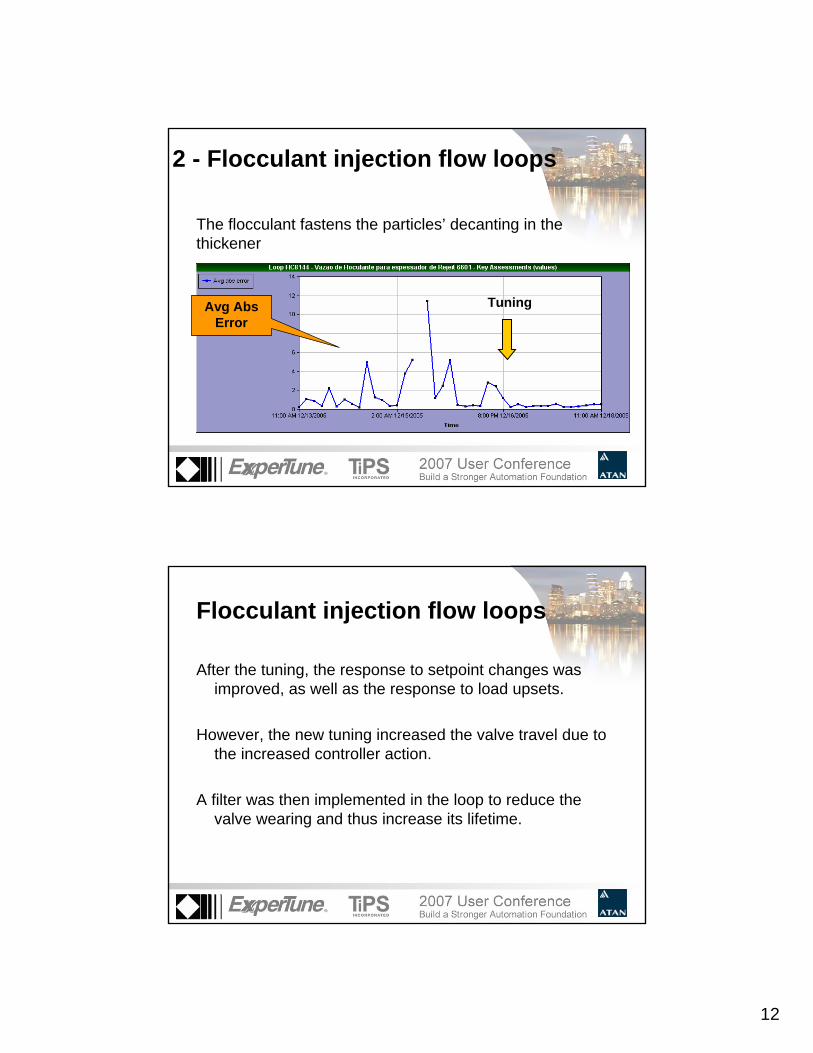
2 - Flocculant injection flow loops
The flocculant fastens the particles’ decanting in the thickener
Avg Abs Error
Tuning
Flocculant injection flow loops
After the tuning, the response to setpoint changes was improved, as well as the response to load upsets.
However, the new tuning increased the valve travel due to the increased controller action.
A filter was then implemented in the loop to reduce the valve wearing and thus increase its lifetime.

13
Flocculant injection flow loops
Improved response to setpoint changes
BEFORE AFTER
3 - Foam level of a flotation column loop
This loop had a satisfactory performance (low global grade), but the valve travel was high.
Valve travel
Global grade

14
Foam level of a flotation column loopThe cause of the high valve travel can be histeresis or
stiction in the valve. PlantTriage identified oscillation due to valve in this loop.
The valve had 4% of stiction.Oscillating
Osc - valve
4 - Reagent’s flow in a flotation column
The loop was in manual and the setpoint was not well adjustedThe problem was identified in the Treemap
Problem
Actions taken
Improvements
There was a 25% reduction in the reagent consumption.
The loop was tuned and then switched to automatic mode;The logic implemented in the PLC to define the setpoint was altered;

15
Reagent’s flow in a flotation column
BEFORE AFTER
5 - Material feed
Desired value
BEFORE AFTER

16
Material feed
The maximum material flow in the conveyor belt was exceeding the setpoint
Problem
Actions takenThe fuzzy control was adjusted
Improvements
The operational safety was increased
Measurement of the improvements
Avg Abs Error
Average
The gains were measured according to the reduction in the average value of the error.
Loop LIC6346:The error decreased 28% due to the PID tuning.
Similarly, other loops had performance improvement.
17
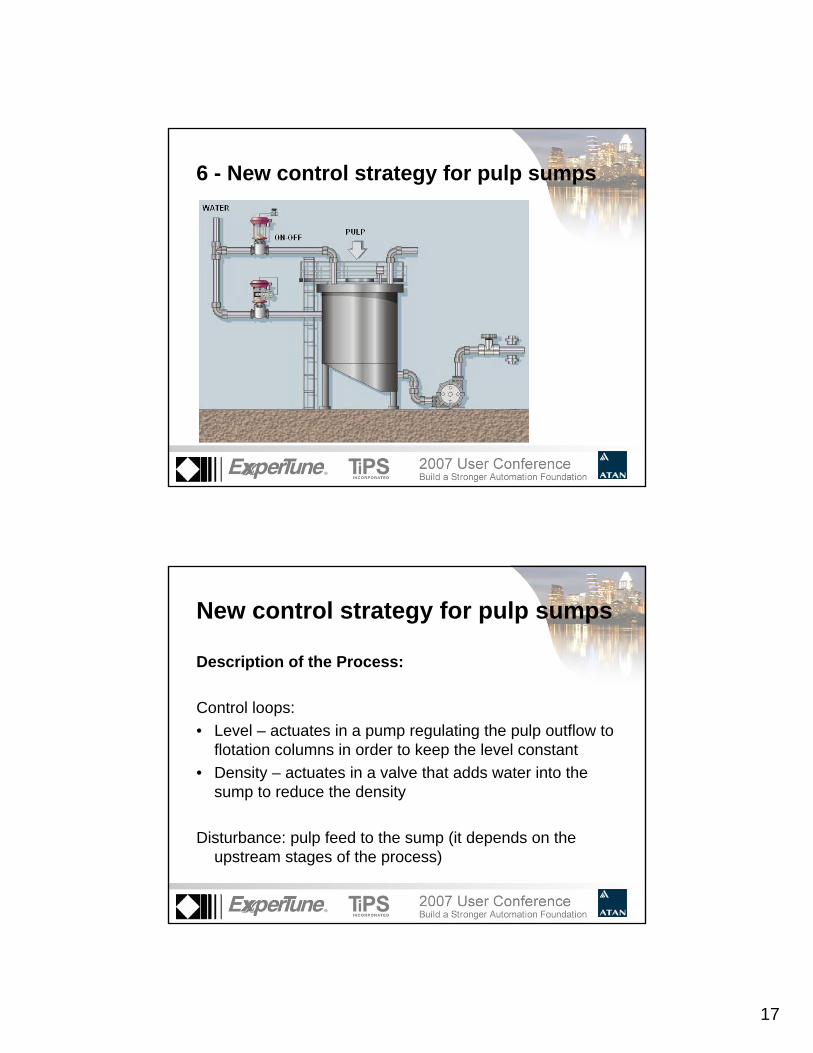
6 - New control strategy for pulp sumps
New control strategy for pulp sumps
Description of the Process:
Control loops:• Level – actuates in a pump regulating the pulp outflow to
flotation columns in order to keep the level constant • Density – actuates in a valve that adds water into the
sump to reduce the density
Disturbance: pulp feed to the sump (it depends on the upstream stages of the process)

18
Previous control strategy’s P&I diagram
Process behavior with previous strategy
Disturbance in the foam level of the flotation column downstream
Level of the pulp sump
Foam level of the flotation column
19
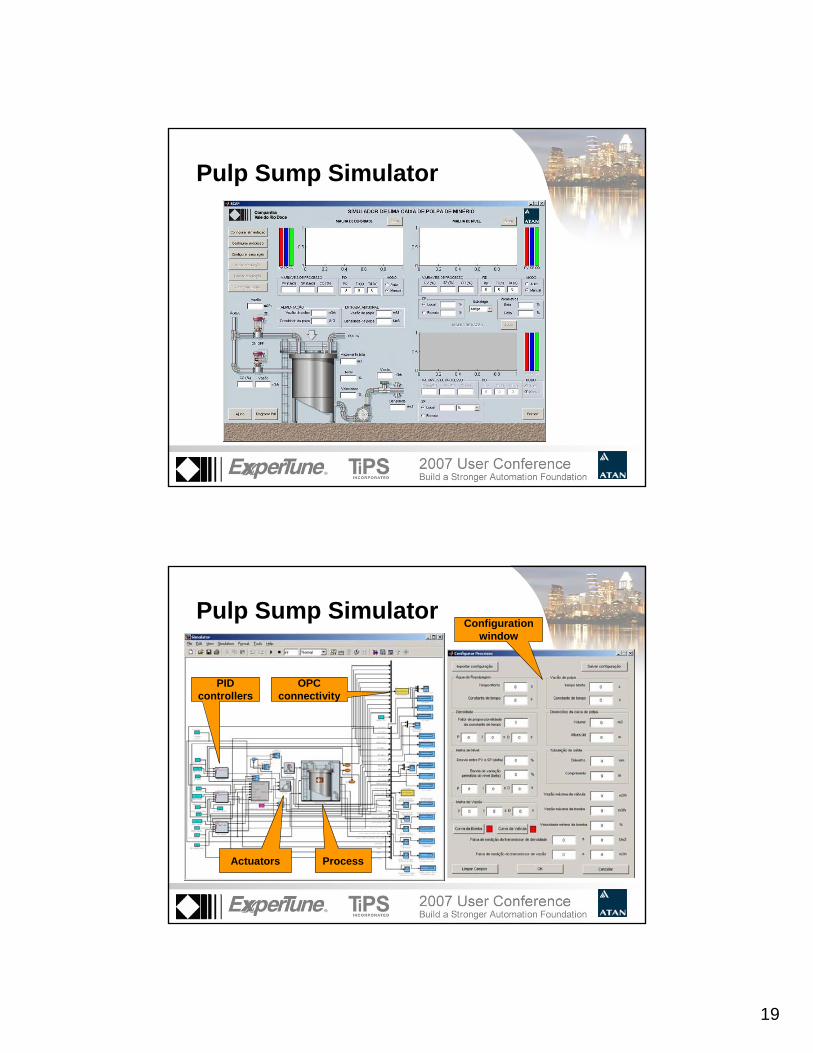
Pulp Sump Simulator
Pulp Sump Simulator
PID controllers
ProcessActuators
OPC connectivity
Configuration window
20
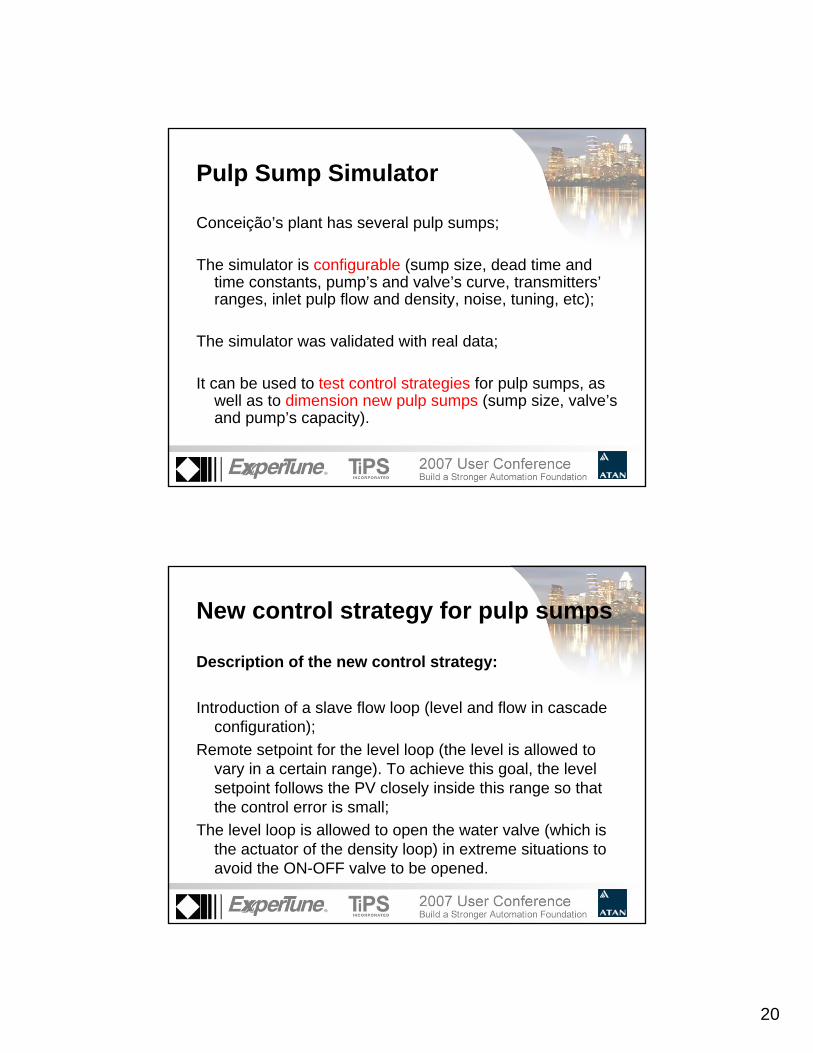
Pulp Sump Simulator
Conceição’s plant has several pulp sumps;
The simulator is configurable (sump size, dead time and time constants, pump’s and valve’s curve, transmitters’ranges, inlet pulp flow and density, noise, tuning, etc);
The simulator was validated with real data;
It can be used to test control strategies for pulp sumps, as well as to dimension new pulp sumps (sump size, valve’s and pump’s capacity).
New control strategy for pulp sumps
Description of the new control strategy:
Introduction of a slave flow loop (level and flow in cascade configuration);
Remote setpoint for the level loop (the level is allowed to vary in a certain range). To achieve this goal, the level setpoint follows the PV closely inside this range so that the control error is small;
The level loop is allowed to open the water valve (which is the actuator of the density loop) in extreme situations to avoid the ON-OFF valve to be opened.

21
New control strategy for pulp sumps
Remote setpoint for the level loop:
New control strategy’s P&I diagram

22
New control strategy for pulp sumps
Advantages of the new strategy:
The output pulp flow is more stable, thus reducing the disturbance in the flotation columns;
Non-linearities in the level loop are compensated:- Non-linearities in the actuator (pump) curve- Dependence of the outflow on the level (and not only on
the pump speed)
The ON-OFF valve does not open very often.
Results of the change in the control strategy
Level of the pulp sump
Foam level of flotation columns

23
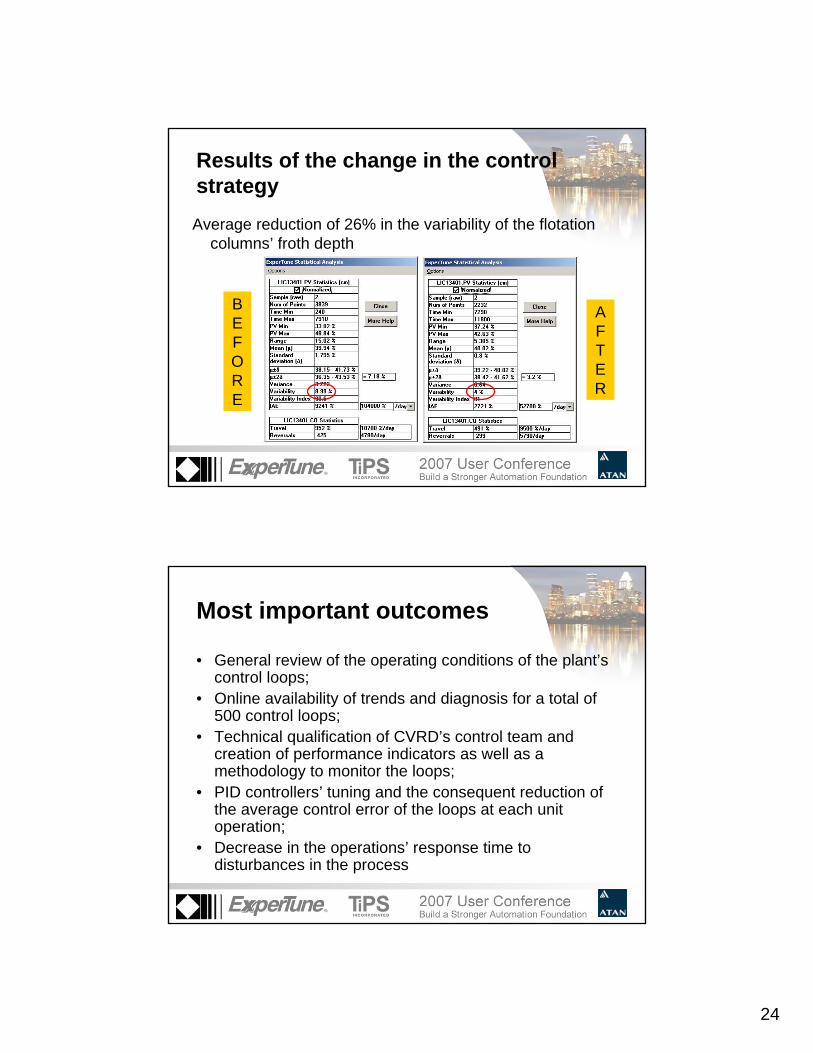
Results of the change in the control strategy
Previous strategy New strategy
Level of the pulp sump
Results of the change in the control strategyReport from PlantTriage’s web interface:
New strategy
Previous strategy
Global grade of the level of a pulp sump
24
Results of the change in the control strategyAverage reduction of 26% in the variability of the flotation
columns’ froth depth
BEFORE
AFTER
Most important outcomes
• General review of the operating conditions of the plant’s control loops;
• Online availability of trends and diagnosis for a total of 500 control loops;
• Technical qualification of CVRD’s control team and creation of performance indicators as well as a methodology to monitor the loops;
• PID controllers’ tuning and the consequent reduction of the average control error of the loops at each unit operation;
• Decrease in the operations’ response time to disturbances in the process

25
Bernardo Soares TorresBernardo Soares [email protected]@atan.com.br
www.atan.com.brwww.atan.com.br
Fortaleza Fortaleza –– CE CE -- BrazilBrazil