daily metals and energy report october 12
TRANSCRIPT
7/31/2019 Daily Metals and Energy Report October 12
http://slidepdf.com/reader/full/daily-metals-and-energy-report-october-12 1/6
Commodities Daily Report
International Commodities
Friday| October 12, 2012
www.angelcommodities.com
Content Overview
Precious Metals
Energy
Base Metals
Important Events for today
Angel Commodities Broking Pvt. Ltd.
Registered Office: G-1, Ackruti Trade Centre, Rd. No. 7, MIDC, Andheri (E), Mumbai - 400 093.
Corporate Office: 6th Floor, Ackruti Star, MIDC, Andheri (E), Mumbai - 400 093. Tel: (022) 2921 2000
MCX Member ID: 12685 / FMC Regn No: MCX / TCM / CORP / 0037 NCDEX: Member ID 00220 / FMC Regn No: NCDEX / TCM / CORP / 0302
Disclaimer: The information and opinions contained in the document have been compiled from sources believed to be reliable. The company does not warrant its accuracy, completene
correctness. The document is not, and should not be construed as an offer to sell or solicitation to buy any commodities. This document may not be reproduced, distributed or published, in whol
part, by any recipient hereof for any purpose without prior permission from “Angel Commodities Broking (P) Ltd”. Your feedback is appreciated on [email protected]
Research Team
Nalini Rao - Sr. Research Analyst
(022) 2921 2000 Extn. 6135
Anish Vyas - Research Associate
(022) 2921 2000 Extn. 6104
Overview:
7/31/2019 Daily Metals and Energy Report October 12
http://slidepdf.com/reader/full/daily-metals-and-energy-report-october-12 2/6
Commodities Daily Report
International Commodities
Friday| October 12, 2012
www.angelcommodities.com
verview
US Trade Balance was at a deficit of $44.2 billion in August.
French CPI declined by 0.3 percent in the last month.
US Unemployment Claims declined to 339,000 for the w/e on 5th Oct.
Japan’s Tertiary Industry Activity increased by 0.4 percent in August.
US crude oil inventories rose by 1.7mn bbl in the last week.
ian markets are trading on firm note after observing favorable data
om the US economy and on China and Japan agreeing to hold talks over
e territorial dispute which was hampering the international trade.
S Trade Balance was at a deficit of $44.2 billion in August as against a
evious deficit of $42.5 billion a month ago. Unemployment Claims
eclined by 30,000 to 339,000 for the week ending on 5th October from
evious rise of 369,000 in prior week. Import Prices remained
nchanged at 1.1 percent for the month of September.
dia’s Trade Balance was at a deficit of $18.1 billion in September from
evious deficit of $15.6 billion in August.
S Dollar Index swung between gains and losses and ended 0.2 percent
wer due to rise in the risk appetite amongst market participants after
bserving positive economic data from the US economy. This led to
ecline in the demand for the low yielding currency that is US Dollar
dex (DX).
S equities ended on a flat note. However, in the early part of the tradeins were registered on the back of positive global market sentiments
ter viewing favorable economic data from the US economy. The
rrency touched a low of 79.78 and closed at 79.86 levels on Thursday.
e Indian Rupee appreciated around 0.7 percent in yesterday’s trading
ssion. The currency appreciated on the back of optimistic statement
om Indian Finance Minister P Chidambaram that there is not serious
reat of ratings downgrading for India. Finance Minster have said that
ey have taken threat for downgrading ratings seriously and many new
forms will be implemented in next one and half years.
owever, weak global market sentiments along with strength in the DX
the early part of the trade led to depreciation in the currency. It
uched a high of 52.62 in yesterday’s trade and closed at 52.67 on
ursday.
r the current month FII inflows totaled at Rs. 9,394.30 crores till 11th
ctober 2012. While year to date basis, net capital inflows stood at Rs.
1,725.10 crores till 11th
October 2012.
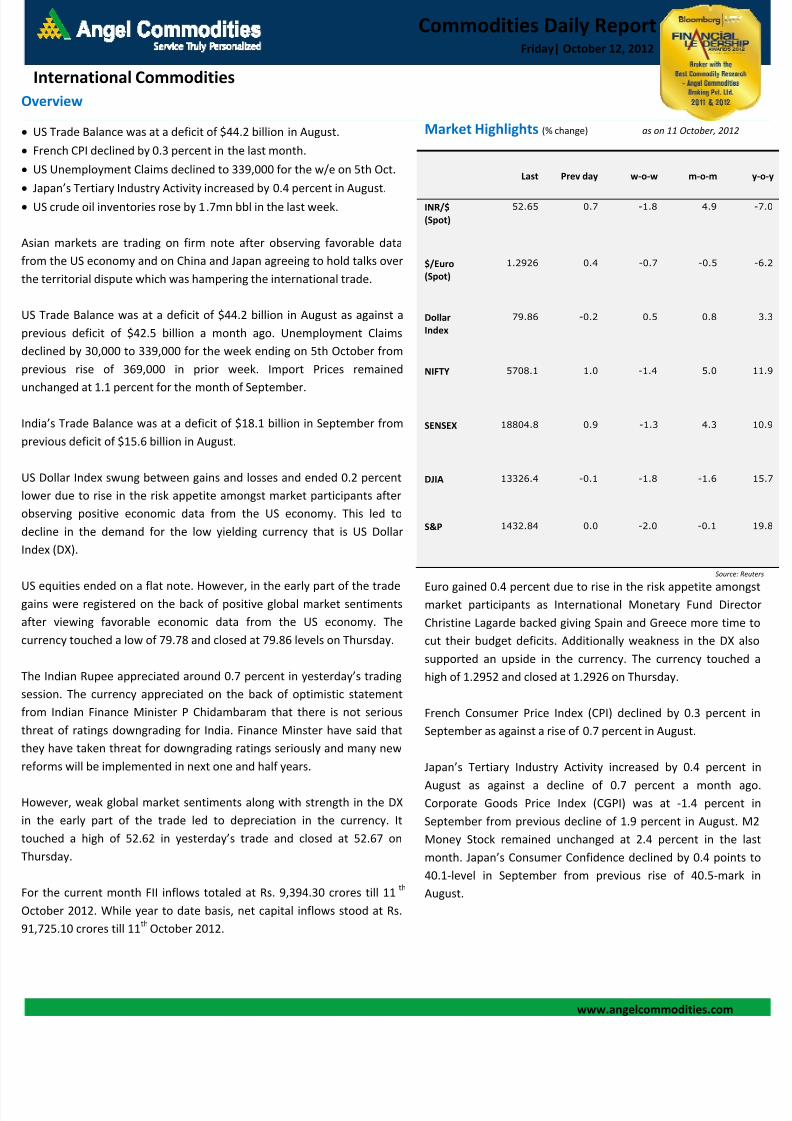
Market Highlights (% change) as on 11 October, 2012
Last Prev day w-o-w m-o-m
INR/$
(Spot)
52.65 0.7 -1.8 4.9
$/Euro
(Spot)
1.2926 0.4 -0.7 -0.5
Dollar
Index
79.86 -0.2 0.5 0.8
NIFTY 5708.1 1.0 -1.4 5.0
SENSEX 18804.8 0.9 -1.3 4.3
DJIA 13326.4 -0.1 -1.8 -1.6
S&P 1432.84 0.0 -2.0 -0.1
Source:
Euro gained 0.4 percent due to rise in the risk appetite amomarket participants as International Monetary Fund Dire
Christine Lagarde backed giving Spain and Greece more tim
cut their budget deficits. Additionally weakness in the DX
supported an upside in the currency. The currency touche
high of 1.2952 and closed at 1.2926 on Thursday.
French Consumer Price Index (CPI) declined by 0.3 percen
September as against a rise of 0.7 percent in August.
Japan’s Tertiary Industry Activity increased by 0.4 percen
August as against a decline of 0.7 percent a month Corporate Goods Price Index (CGPI) was at -1.4 percen
September from previous decline of 1.9 percent in August.
Money Stock remained unchanged at 2.4 percent in the
month. Japan’s Consumer Confidence declined by 0.4 point
40.1-level in September from previous rise of 40.5-mar
August.
7/31/2019 Daily Metals and Energy Report October 12
http://slidepdf.com/reader/full/daily-metals-and-energy-report-october-12 3/6
Commodities Daily Report
International Commodities
Friday| October 12, 2012
www.angelcommodities.com
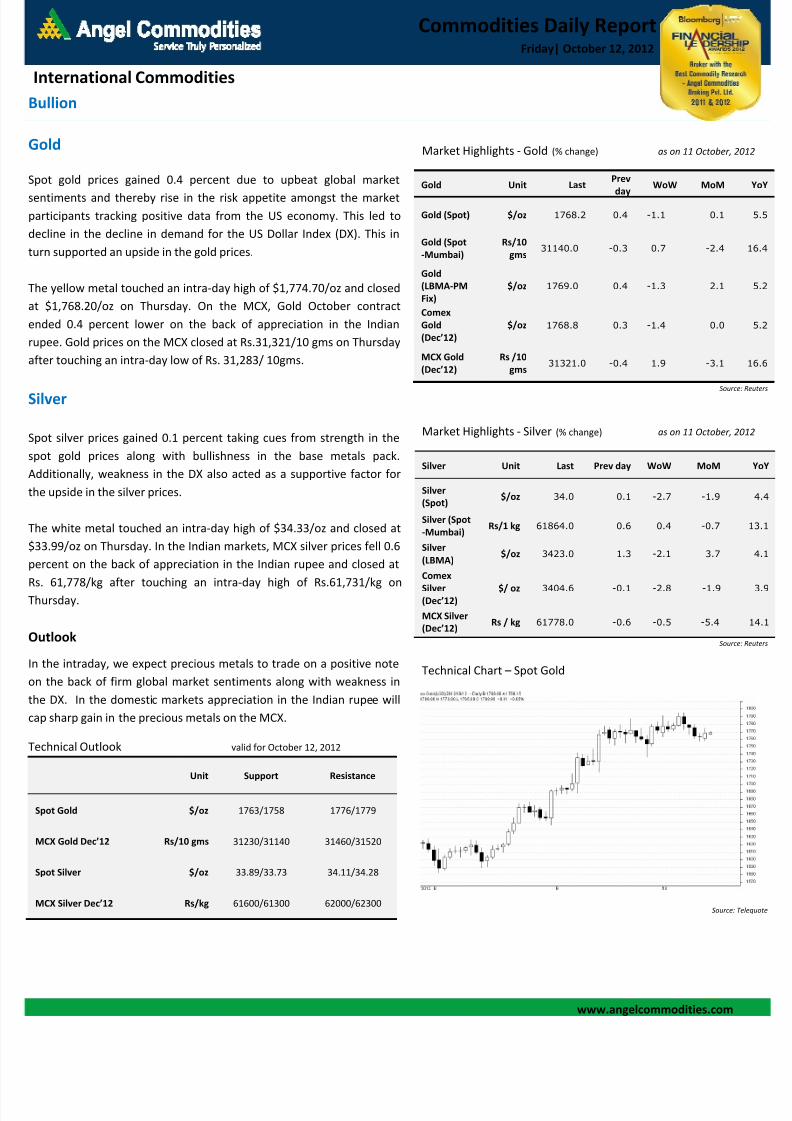
Market Highlights - Gold (% change) as on 11 October, 20
Gold Unit LastPrev
dayWoW MoM
Gold (Spot) $/oz 1768.2 0.4 -1.1 0.1
Gold (Spot
-Mumbai)
Rs/10
gms31140.0 -0.3 0.7 -2.4
Gold
(LBMA-PM
Fix) $/oz 1769.0 0.4 -1.3 2.1
Comex
Gold
(Dec’12)
$/oz 1768.8 0.3 -1.4 0.0
MCX Gold
(Dec’12)
Rs /10
gms31321.0 -0.4 1.9 -3.1
Source
Market Highlights - Silver (% change) as on 11 October, 20
Silver Unit Last Prev day WoW MoM
Silver
(Spot)$/oz 34.0 0.1 -2.7 -1.9
Silver (Spot
-Mumbai) Rs/1 kg 61864.0 0.6 0.4 -0.7
Silver
(LBMA) $/oz 3423.0 1.3 -2.1 3.7
Comex
Silver(Dec’12)
$/ oz 3404.6 -0.1 -2.8 -1.9
MCX Silver
(Dec’12)Rs / kg 61778.0 -0.6 -0.5 -5.4
Source
Technical Chart – Spot Gold
Source: T
Bullion
Gold
Spot gold prices gained 0.4 percent due to upbeat global market
entiments and thereby rise in the risk appetite amongst the marketparticipants tracking positive data from the US economy. This led to
decline in the decline in demand for the US Dollar Index (DX). This in
urn supported an upside in the gold prices.
The yellow metal touched an intra-day high of $1,774.70/oz and closed
at $1,768.20/oz on Thursday. On the MCX, Gold October contract
ended 0.4 percent lower on the back of appreciation in the Indian
upee. Gold prices on the MCX closed at Rs.31,321/10 gms on Thursday
after touching an intra-day low of Rs. 31,283/ 10gms.
Silver
Spot silver prices gained 0.1 percent taking cues from strength in the
pot gold prices along with bullishness in the base metals pack.
Additionally, weakness in the DX also acted as a supportive factor for
he upside in the silver prices.
The white metal touched an intra-day high of $34.33/oz and closed at
$33.99/oz on Thursday. In the Indian markets, MCX silver prices fell 0.6
percent on the back of appreciation in the Indian rupee and closed at
Rs. 61,778/kg after touching an intra-day high of Rs.61,731/kg on
Thursday.
Outlook
n the intraday, we expect precious metals to trade on a positive note
on the back of firm global market sentiments along with weakness in
he DX. In the domestic markets appreciation in the Indian rupee will
ap sharp gain in the precious metals on the MCX.
Technical Outlook valid for October 12, 2012
Unit Support Resistance
Spot Gold $/oz 1763/1758 1776/1779
MCX Gold Dec’12 Rs/10 gms 31230/31140 31460/31520
Spot Silver $/oz 33.89/33.73 34.11/34.28
MCX Silver Dec’12 Rs/kg 61600/61300 62000/62300
7/31/2019 Daily Metals and Energy Report October 12
http://slidepdf.com/reader/full/daily-metals-and-energy-report-october-12 4/6
Commodities Daily Report
International Commodities
Friday| October 12, 2012
www.angelcommodities.com
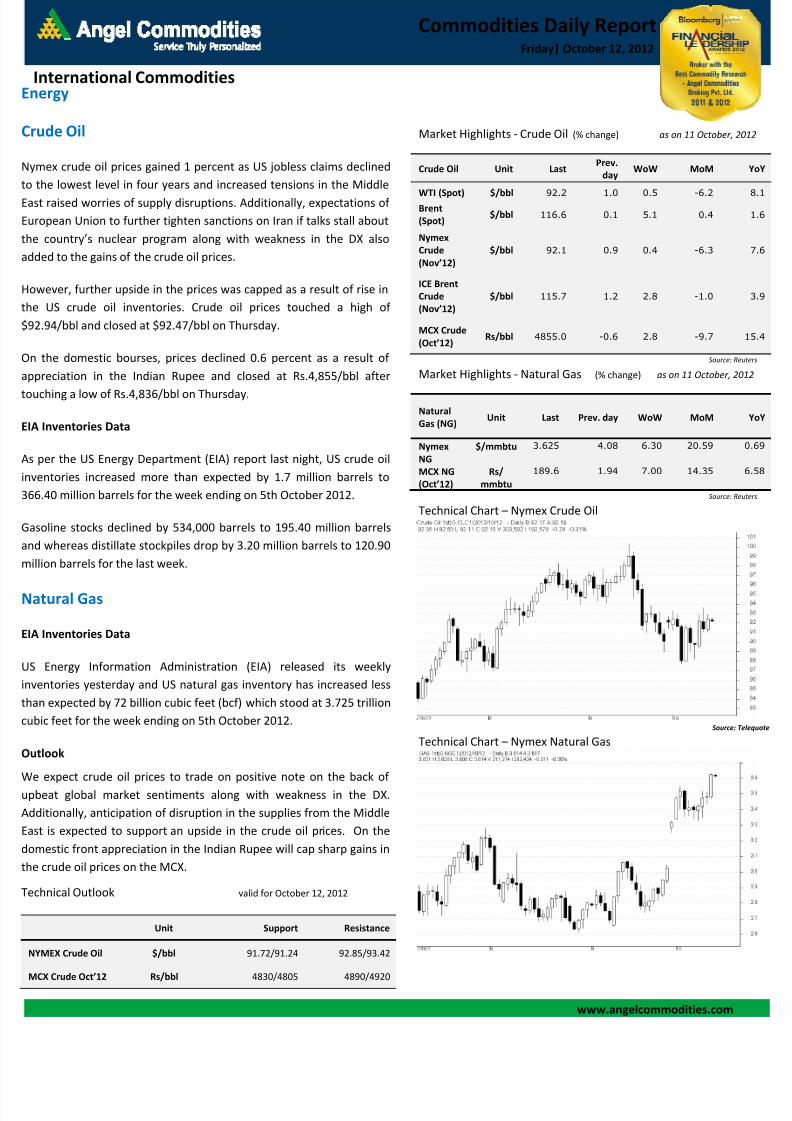
Market Highlights - Crude Oil (% change) as on 11 October, 2
Crude Oil Unit LastPrev.
dayWoW MoM
WTI (Spot) $/bbl 92.2 1.0 0.5 -6.2 Brent
(Spot) $/bbl 116.6 0.1 5.1 0.4
Nymex
Crude
(Nov’12)
$/bbl 92.1 0.9 0.4 -6.3
ICE Brent
Crude
(Nov’12)
$/bbl 115.7 1.2 2.8 -1.0
MCX Crude
(Oct’12)Rs/bbl 4855.0 -0.6 2.8 -9.7
Source: Re
Market Highlights - Natural Gas (% change) as on 11 October, 20
Natural
Gas (NG)Unit Last Prev. day WoW MoM
Nymex
NG
$/mmbtu 3.625 4.08 6.30 20.59
MCX NG
(Oct’12)
Rs/
mmbtu
189.6 1.94 7.00 14.35
Source: Re
Technical Chart – Nymex Crude Oil
Source: T
Technical Chart – Nymex Natural Gas
nergy
rude Oil
ymex crude oil prices gained 1 percent as US jobless claims declined
the lowest level in four years and increased tensions in the Middle
st raised worries of supply disruptions. Additionally, expectations of
ropean Union to further tighten sanctions on Iran if talks stall about
e country’s nuclear program along with weakness in the DX also
ded to the gains of the crude oil prices.
owever, further upside in the prices was capped as a result of rise in
e US crude oil inventories. Crude oil prices touched a high of
92.94/bbl and closed at $92.47/bbl on Thursday.
n the domestic bourses, prices declined 0.6 percent as a result of
ppreciation in the Indian Rupee and closed at Rs.4,855/bbl after
uching a low of Rs.4,836/bbl on Thursday.
A Inventories Data
per the US Energy Department (EIA) report last night, US crude oil
ventories increased more than expected by 1.7 million barrels to
66.40 million barrels for the week ending on 5th October 2012.
asoline stocks declined by 534,000 barrels to 195.40 million barrels
d whereas distillate stockpiles drop by 3.20 million barrels to 120.90
illion barrels for the last week.
atural Gas
A Inventories Data
S Energy Information Administration (EIA) released its weekly
ventories yesterday and US natural gas inventory has increased less
an expected by 72 billion cubic feet (bcf) which stood at 3.725 trillion
bic feet for the week ending on 5th October 2012.
utlook
e expect crude oil prices to trade on positive note on the back of
pbeat global market sentiments along with weakness in the DX.
dditionally, anticipation of disruption in the supplies from the Middle
st is expected to support an upside in the crude oil prices. On the
omestic front appreciation in the Indian Rupee will cap sharp gains in
e crude oil prices on the MCX.
chnical Outlook valid for October 12, 2012
Unit Support Resistance
NYMEX Crude Oil $/bbl 91.72/91.24 92.85/93.42
MCX Crude Oct’12 Rs/bbl 4830/4805 4890/4920
7/31/2019 Daily Metals and Energy Report October 12
http://slidepdf.com/reader/full/daily-metals-and-energy-report-october-12 5/6
Commodities Daily Report
International Commodities
Friday| October 12, 2012
www.angelcommodities.com
ase Metals
he base metals pack traded on a mixed note in the yesterday’s
ade on the back of rise in risk appetite in the global markets which
ad to upside on the base metal prices.
dditionally, weakness in the DX also supported an upside in therices. However, mixed data of LME inventories exerted pressure on
he prices.
the Indian markets, appreciation in the Rupee prevented further
ains in the prices.
opper
opper, the leader of the base metals complex gained 0.8 percent
ue to positive global market sentiments as US jobs data raised
ptimism amongst market participants and increased the riskppetite. This weakened dollar and supported an upside in the
opper prices in yesterday’s session.
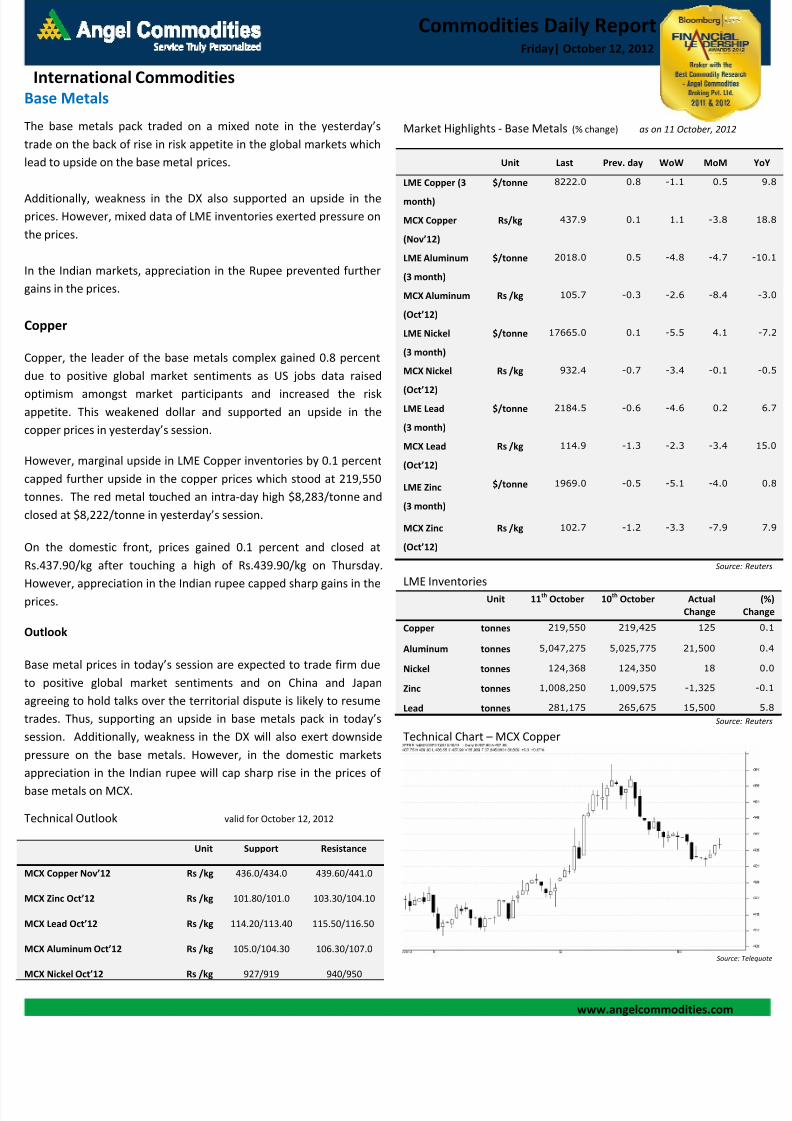
owever, marginal upside in LME Copper inventories by 0.1 percent
apped further upside in the copper prices which stood at 219,550
onnes. The red metal touched an intra-day high $8,283/tonne and
osed at $8,222/tonne in yesterday’s session.
n the domestic front, prices gained 0.1 percent and closed at
s.437.90/kg after touching a high of Rs.439.90/kg on Thursday.
owever, appreciation in the Indian rupee capped sharp gains in therices.
utlook
ase metal prices in today’s session are expected to trade firm due
o positive global market sentiments and on China and Japan
greeing to hold talks over the territorial dispute is likely to resume
ades. Thus, supporting an upside in base metals pack in today’s
ession. Additionally, weakness in the DX will also exert downside
ressure on the base metals. However, in the domestic markets
ppreciation in the Indian rupee will cap sharp rise in the prices of
ase metals on MCX.
echnical Outlook valid for October 12, 2012
Unit Support Resistance
CX Copper Nov’12 Rs /kg 436.0/434.0 439.60/441.0
CX Zinc Oct’12 Rs /kg 101.80/101.0 103.30/104.10
CX Lead Oct’12 Rs /kg 114.20/113.40 115.50/116.50
CX Aluminum Oct’12 Rs /kg 105.0/104.30 106.30/107.0
CX Nickel Oct’12 Rs /kg 927/919 940/950
Market Highlights - Base Metals (% change) as on 11 October, 2012
Unit Last Prev. day WoW MoM
LME Copper (3
month)
$/tonne 8222.0 0.8 -1.1 0.5
MCX Copper
(Nov’12)
Rs/kg 437.9 0.1 1.1 -3.8
LME Aluminum
(3 month)
$/tonne 2018.0 0.5 -4.8 -4.7
MCX Aluminum
(Oct’12)
Rs /kg 105.7 -0.3 -2.6 -8.4
LME Nickel
(3 month)
$/tonne 17665.0 0.1 -5.5 4.1
MCX Nickel
(Oct’12)
Rs /kg 932.4 -0.7 -3.4 -0.1
LME Lead
(3 month)
$/tonne 2184.5 -0.6 -4.6 0.2
MCX Lead
(Oct’12)
Rs /kg 114.9 -1.3 -2.3 -3.4
LME Zinc
(3 month)
$/tonne 1969.0 -0.5 -5.1 -4.0
MCX Zinc
(Oct’12)
Rs /kg 102.7 -1.2 -3.3 -7.9
Source
LME Inventories
Unit 11th
October 10th
October Actual
Change
Copper tonnes 219,550 219,425 125
Aluminum tonnes 5,047,275 5,025,775 21,500
Nickel tonnes 124,368 124,350 18
Zinc tonnes 1,008,250 1,009,575 -1,325
Lead tonnes 281,175 265,675 15,500
Source
Technical Chart – MCX Copper
Source:
7/31/2019 Daily Metals and Energy Report October 12
http://slidepdf.com/reader/full/daily-metals-and-energy-report-october-12 6/6
Commodities Daily Report
International Commodities
Friday| October 12, 2012
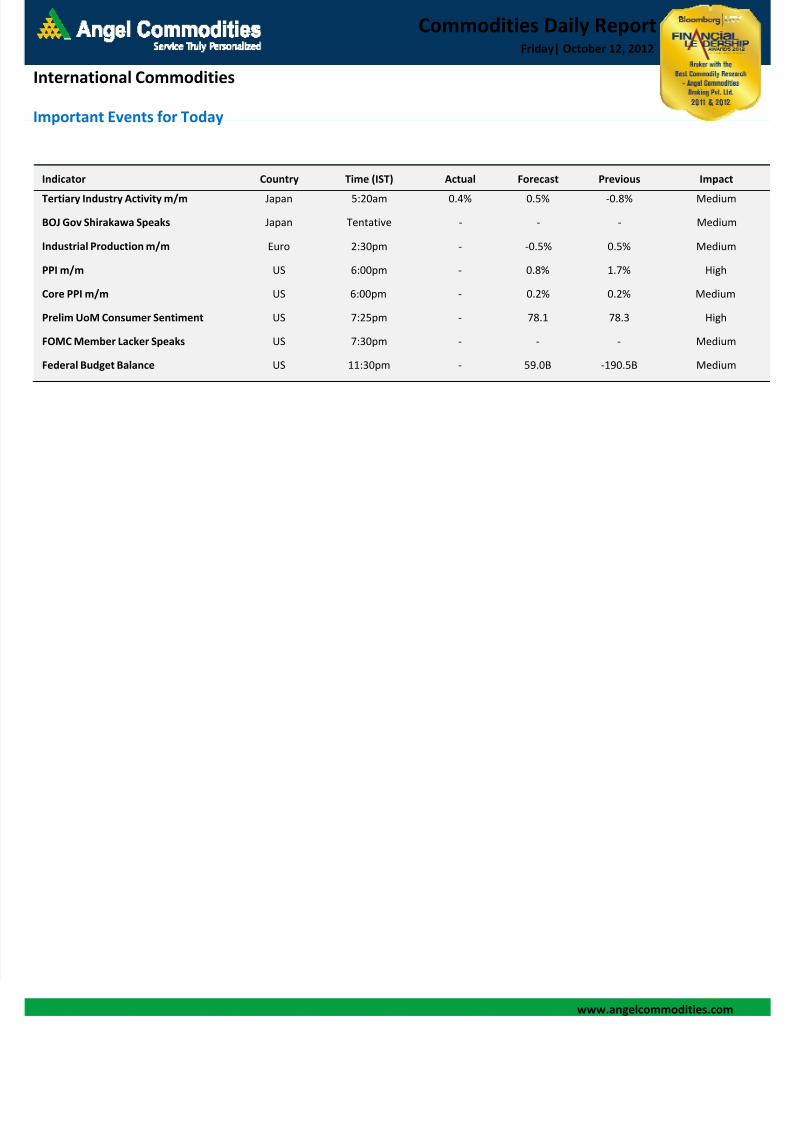
Important Events for Today
Indicator Country Time (IST) Actual Forecast Previous Impact
Tertiary Industry Activity m/m Japan 5:20am 0.4% 0.5% -0.8% Medium
BOJ Gov Shirakawa Speaks Japan Tentative - - - Medium
Industrial Production m/m Euro 2:30pm - -0.5% 0.5% Medium
PPI m/m US 6:00pm - 0.8% 1.7% High
Core PPI m/m US 6:00pm - 0.2% 0.2% Medium
Prelim UoM Consumer Sentiment US 7:25pm - 78.1 78.3 High
FOMC Member Lacker Speaks US 7:30pm - - - Medium
Federal Budget Balance US 11:30pm - 59.0B -190.5B Medium