data center solutions v1 020515
TRANSCRIPT

Mike McMillan Vice President +1 513 369 [email protected]

Page Topic Value
3 Answering the What? Why? and How? questions Leaving Nothing to Chance
4 Strategic Planning Location plus Architecture plus Network
5 Strategic Planning Process Requirements plus Planning through Implementation
6IT Network Advisory Services “Leaving nothing to chance”
Network Solutions Connecting Property, People & Applications
7IT Network Advisory Services “Leaving nothing to chance”
Proven Structured Process
8 Data Center Market Dashboard With our Local, National and Global Market Knowledge
9 Structured Acquisition ProcessUsing our Proven Process all 60+ CBRE Data Center Professionals follow for our Client’s Globally
10 Retail Colocation Sites in Each City Leveraging our Local Colocation Market Knowledge
11 Lease Audit Negotiations 75 Point Lease Negotiation Checklist Including SLA’s
12 Total Cost of Occupancy (TCO) Analysis Detailed TCO to Support Board Presentation, Budgeting and Final Decisions
13 Platform OverviewCBRE Portfolio of Capabilities and Volume of Our Client’s Data Center Business We have Supported
14 Clients Represented CBRE’s Cross-Industry Client Experience and Expertise
Data Center Advisory Services
DATA CENTER ADVISORY SERVICE Example Work Products

Page 3 Data Center Advisory Services
ANSWERING THE WHAT? WHY? AND HOW? QUESTIONS Leaving Nothing to Chance

Page 4
Strategic Planning Process
• Risk• Cost• Capacity
• Reliability• Power Efficiencies
• Economic Incentives
• Flexibility by Tier
Capacity Planning
uuuuuu
NETWORKARCHITECTURE
LOCATION
• Virtualization• Optimization• Consolidation• Decommission
• Technology• Xaas Public vs
Private• Growth
• Latency• Bandwidth• Carriers
• Cost• Diversity• Redundancy
Data Center Advisory Services
STRATEGIC PLANNING

Page 5
uuuuuu uuu uuu
uuuuuu uuu uuu
DISCOVERY PROCESSREQUIREMENTS
CAPACITY PLANNINGGrowth Modeling
Technology RefreshOptimization PlanningApplication Architecture
Scenario Modeling
DATA COLLECTIONInterview Stakeholders
Asset ListsBusiness Functionality
AvailabilityDisaster Recovery Needs
Collect Data
ITNETWORKS
SYSTEMSOptimize: P - V
Capacity AnalysisOptimization, Growth
Business RequirementsApplication Architectures
IT DriversFacility Drivers
Analyze Data
NegotiationAgreements
uuuuuu
Capacity PlanningGrowth, Redundancy,Diversity, & Latency
STRATEGICPLANNING
SCENARIODEVELOPMENT
Application ArchitectureHigh Availability Needs
“What-If” ModelingFacility Architecture
EVALUATE ALTERNATIVESBuild versus Buy versus Xaas
Opportunities/RisksGap Analysis
Architecture ChangesLocation
TCO ANALYSISCost Comparison per Scenario
OptionStaffingNetwork
MigrationServices
IMPLEMENTATION EXECUTEData Center Strategy
SolutionsAnswers
TRANSITIONAcquisition of Cloud/
Managed ServicesRF/RFP
SLATerms
Providers
IMPLEMENTATIONLOI Negotiation
Lease NegotiationFinal TCO
Board Level Presentation
uuu uuu
uu u
u
STRATEGIC PLANNING PROCESS

Page 6
TELECOM NETWORKS ADVISORY SERVICES “LEAVING NOTHING TO CHANCE”
Voice and DataStaying Connected
Real Estate
Voice and Data
Telecommunicatio
ns
Cus
tom
er Se
rvice
Sales Marketing Operations
IT Business People HR
Team
ing
Work Smarter Faster
Productivity Saving Time a
nd M
oney
Busi
ness
Con
tinui
ty
Assessment/Audit Business Resilience
Unified Communications
WHY?
Moving Locations
Optimization (Portfolio)
HOW?
Expertise
Carrier Partners
Purchasing Power
CLIENT VALUE
Savings
Resources
Time
Cost
Page 7
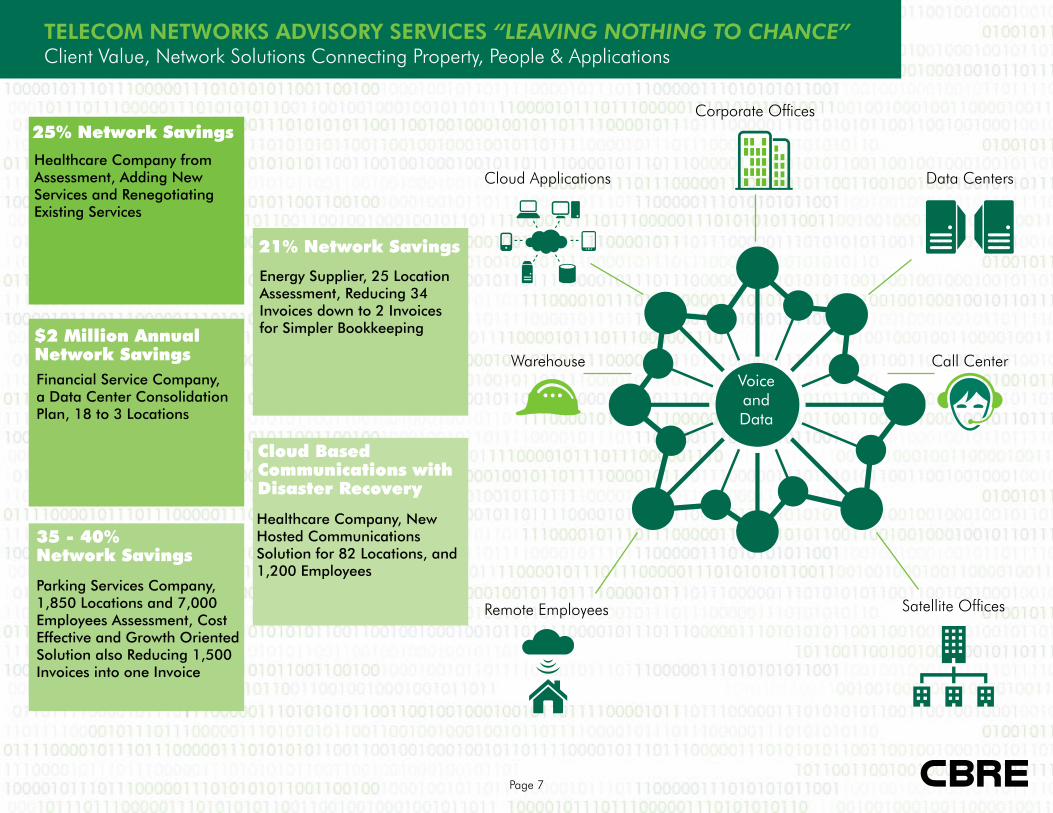
TELECOM NETWORKS ADVISORY SERVICES “LEAVING NOTHING TO CHANCE”Client Value, Network Solutions Connecting Property, People & Applications
Remote Employees
Cloud Applications Data Centers
Satellite Offices
Corporate Offices
VoiceandData
25% Network Savings
Healthcare Company from Assessment, Adding New Services and Renegotiating Existing Services
35 - 40%Network Savings
Parking Services Company, 1,850 Locations and 7,000 Employees Assessment, Cost Effective and Growth Oriented Solution also Reducing 1,500 Invoices into one Invoice
$2 Million AnnualNetwork SavingsFinancial Service Company, a Data Center Consolidation Plan, 18 to 3 Locations
21% Network Savings
Energy Supplier, 25 Location Assessment, Reducing 34 Invoices down to 2 Invoices for Simpler Bookkeeping
Cloud Based Communications with Disaster Recovery
Healthcare Company, New Hosted Communications Solution for 82 Locations, and 1,200 Employees
Call CenterWarehouse

Page 8
CBRE OVERVIEW
BUSINESS LINES
SPECIALTY SERVICES
BUSINESS ACTIVITY STATISTICS MARKET STATISTICS CBRE
EXPERIENCE
POWERED SHELLS ENTERPRISE CENTERS RETAIL COLO WHOLESALE COLO UNDER CONSTRUCTION GREENFIELD SITES D
ATA
CEN
TER
DA
SHB
OA
RD
Market Statistics Data Center Solutions
Group Data Center
Primer Data Center
Map
Data Center Advisory Services
CBRE - DATA CENTER MARKET DASHBOARD With our Local, National and Global Market Knowledge

Page 9
Stage 1
Stakeholder Meeting
Stage 2
RequirementsDevelopment and Decision Criteria
Stage 3
Market and Site Sourcing
Stage 4
RFP Process
Stage 5
Market and Site TCO Analysis
Stage 6
Site Visits and Short Listing
Stage 7
Term Sheet Negotiation
Stage 8
Contract Negotiation
Stage 9
Facility Preparation/Data
Center Commissioning
Established and Structured Acquisition Process
Data Center Advisory Services
Established and Structured Acquisition Process
STRUCTURED ACQUISITION PROCESS Using our Proven Process all 60+ CBRE Data Center Professionals

Page 10
RETAIL COLOCATION SITES IN EACH CITY Leveraging our Local Colocation Market Knowledge
For Example; Cincinnati
CyrusOneCyrusOne
CyrusOne
TW Telecom
Peak 10
CyrusOne
Ascendum IMS
CyrusOne
Level 3
CyrusOne
Appica
CyrusOne
Level 3
Appica
Data Center Advisory Services

Page 11
LEASE AUDIT NEGOTIATIONS 75 Point Lease Negotiation Checklist Including SLA’s
Data Center Advisory Services

Page 12
TOTAL COST OF OCCUPANCY - ANALYSIS Detailed TCO to Support Board Presentation, Budgeting and Final Decisions
Data Center Advisory Services
Work Product Example
Confidential Client Total Cost of Occupancy StudyBuild vs. Lease vs. Modular/Container
Build on CampusWholesale Lease - Market
Terms (Nationally)Colocation - Provider 1
Modular Scenario - Manufacturer 1
Modular Scenario - Manufacturer 2
Modular Scenario - Manufacturer 3
Local Market National Data Center Market Local Market Local Market Local Market Local Market
ASSUMPTIONS
Analysis Start Date 6/1/2014 6/1/2014 6/1/2014 6/1/2014 6/1/2014 6/1/2014Analysis Term 10.00 years 10.00 years 10.00 years 10.00 years 10.00 years 10.00 years
Critical Load at Full Ramp (kW) 600 300 275 300 288 300
Raised Floor Space (SF) 3,500 2,800 TBD 1,440 1,212 1,552
Occupancy Costs $46,979,235 $10,352,184 $7,532,902 $34,419,168 $32,424,469 $31,506,770Day One Capital Costs $18,250,000 $0 $0 $8,782,080 $7,852,983 $6,677,556
Annual Weighted Avg Cost Per kW Used $19,020 $4,191 $3,050 $13,935 $13,127 $12,756Average Annual Cost $4,697,924 $1,035,218 $753,290 $3,441,917 $3,242,447 $3,150,677
NPV Occupancy Cost @ 8% $37,300,499 $6,766,534 $4,832,295 $25,729,327 $24,098,423 $23,089,307
We obtained the information above from sources we believe to be reliable. However, we have not verified its accuracy and make no guarantee, warranty or representation about it. It is submitted subject to the possibility
of errors, omissions, change of price, rental or other conditions, prior sale, lease or financing, or withdrawal without notice. We include projections, opinions, assumptions or estimates for example only, and they may not
represent current or future performance of the property. You and your tax and legal advisors should conduct your own investigation of the property and transaction.
2013
$4,697,924
$1,035,218 $753,290
$3,441,917 $3,242,447 $3,150,677
$0
$500,000
$1,000,000
$1,500,000
$2,000,000
$2,500,000
$3,000,000
$3,500,000
$4,000,000
$4,500,000
$5,000,000
1 2 3 4 5 6
Average Annual Cost
Confidential ClientModular Scenario - Manufacturer 1
Local Market
ASSUMPTIONS NEW LEASE
ANALYSIS START DATE / END DATE Raised Floor/Data Center Space (SF) 1,440 Capital Costs per kW NominalAnalysis Start 6/1/2014 Data Modules (2) $6,001.93 $1,800,580Analysis End 5/31/2024 Power Module Container Equipment $5,630.00 $1,689,000
Construction of Shell and Pad $6,000.00 $1,800,000TERM Modular Data Center Critical Load Capacity in kW Electrical/Mechanical Infrastructure $7,666.67 $2,300,000Analysis Term - Years 10.00 Years Months 1-120 300 Power Run to Premises $0.00 $0 ***Analysis Term - Months 120 Months Data Run to Premises $0.00 $0 ***
Water/Sewer Run to Premises $0.00 $0 ***Real Estate Tax & Operating Expenses Installation of Add'l Utility Feed $2,500.00 $750,000
Growth 2014 Est.Real Estate Taxes 0.0% $0.00 /SF ***Annual Module Maintenantce & 3.0% $262,953.00 Out-Of-Pocket $27,798.60 $8,339,580 Software Support CostsElectricity 3.0% $0.0800 /kWh Soft Costs per kW NominalCooling Uplift Factor 40% * Shipping of Module $641.67 $192,500Office Space RE Taxes & Op Ex 0.0% $0.00 /SF Installation of Module $833.33 $250,000Storage Space RE Taxes & Op Ex 0.0% $0.00 /SF Commissioning $0.00 $0 **
Drawings/Permitting $0.00 $0
Out-Of-Pocket $1,475.00 $442,500
Additional Costs per kW NominalTenant Improvements Required $0 $0Tenant Improvement Allowance $0 $0
Out-Of-Pocket $0 $0
per kW NominalTOTAL OUT-OF-POCKET $29,273.60 $8,782,080
1 2 3 4 5 6 7 8 9 10Fiscal Year Ending Initial Investment 5/31/2015 5/31/2016 5/31/2017 5/31/2018 5/31/2019 5/31/2020 5/31/2021 5/31/2022 5/31/2023 5/31/2024Months in Period 12 12 12 12 12 12 12 12 12 12
Critical Load Capacity (kW) 300 300 300 300 300 300 300 300 300 300Estimated Power Draw (kW) * 205 205 205 205 275 275 275 275 275 275
Cost of Electricity $0.0800 $0.0824 $0.0849 $0.0874 $0.0900 $0.0927 $0.0955 $0.0984 $0.1013 $0.1044
Operating Expense and Electricity TotalsReal Estate Taxes $0 $0 $0 $0 $0 $0 $0 $0 $0 $0 $0Annual Maintenance & Software Support $262,953 $270,842 $278,967 $287,336 $295,956 $304,835 $313,980 $323,399 $333,101 $343,094 $3,014,461Electricity $143,664 $147,974 $152,413 $156,986 $216,908 $223,415 $230,118 $237,021 $244,132 $251,456 $2,004,087Cooling Uplift Factor $57,466 $59,190 $60,965 $62,794 $86,763 $89,366 $92,047 $94,809 $97,653 $100,582 $801,635HR/Staffing - Engineering - Salaries & Benefits **** $1,148,900 $1,148,900 $1,148,900 $1,148,900 $1,148,900 $1,300,989 $1,300,989 $1,300,989 $1,300,989 $1,300,989 $12,249,445HR/Staffing - Security - Salaries & Benefits (6 Officers) $618,000 $618,000 $618,000 $618,000 $618,000 $644,000 $644,000 $644,000 $644,000 $644,000 $6,310,000Fire & Life Safety $5,000 $5,000 $5,000 $5,000 $5,000 $6,000 $6,000 $6,000 $6,000 $6,000 $55,000Painting $2,400 $2,400 $2,400 $2,400 $2,400 $2,880 $2,880 $2,880 $2,880 $2,880 $26,400Parking Lot Re-Striping / Resurfacing $1,200 $1,200 $1,200 $1,200 $1,200 $1,200 $1,200 $1,200 $1,200 $1,200 $12,000Building-Level Plumbing Repairs $1,800 $1,800 $1,800 $1,800 $1,800 $2,160 $2,160 $2,160 $2,160 $2,160 $19,800Building-Level General Maintenance $9,600 $9,600 $9,600 $9,600 $9,600 $11,520 $11,520 $11,520 $11,520 $11,520 $105,600Building-Level Roof Repairs $1,200 $1,200 $1,200 $1,200 $1,200 $1,440 $1,440 $1,440 $1,440 $1,440 $13,200Electrical Infrastructure - Switchgear Maintenance $7,500 $7,500 $7,500 $7,500 $7,500 $9,000 $9,000 $9,000 $9,000 $9,000 $82,500Electrical Infrastructure - Generator Maintenance $4,400 $4,400 $4,400 $4,400 $4,400 $5,500 $5,500 $5,500 $5,500 $5,500 $49,500Electrical Infrastructure - Generator Fuel $15,734 $15,734 $15,734 $15,734 $15,734 $27,518 $27,518 $27,518 $27,518 $27,518 $216,260Electrical Infrastructure - Subontracted Work $3,600 $3,600 $3,600 $3,600 $3,600 $4,800 $4,800 $4,800 $4,800 $4,800 $42,000Electrical Infrastructure - Supplied & Repairs $4,800 $4,800 $4,800 $4,800 $4,800 $7,200 $7,200 $7,200 $7,200 $7,200 $60,000Mechanical Infrastructure - Building Automation $10,000 $10,000 $10,000 $10,000 $10,000 $12,500 $12,500 $12,500 $12,500 $12,500 $112,500Mechanical Infrastructure - Supplies & Repairs $18,000 $18,000 $18,000 $18,000 $18,000 $24,000 $24,000 $24,000 $24,000 $24,000 $210,000Janatorial - General $5,000 $5,000 $5,000 $5,000 $5,000 $6,000 $6,000 $6,000 $6,000 $6,000 $55,000Landscaping Services $6,000 $6,000 $6,000 $6,000 $6,000 $7,200 $7,200 $7,200 $7,200 $7,200 $66,000Pest Control $518 $518 $518 $518 $518 $622 $622 $622 $622 $622 $5,700Water & Sewer $12,000 $12,000 $12,000 $12,000 $12,000 $13,200 $13,200 $13,200 $13,200 $13,200 $126,000
Total $2,339,735 $2,353,657 $2,367,997 $2,382,768 $2,475,279 $2,705,345 $2,723,873 $2,742,958 $2,762,615 $2,782,861 $25,637,088
Capital CostsData Modules (2) $1,800,580 $0 $0 $0 $0 $0 $0 $0 $0 $0 $0 $1,800,580Power Module Container Equipment $1,689,000 $0 $0 $0 $0 $0 $0 $0 $0 $0 $0 $1,689,000Construction of Shell and Pad $1,800,000 $0 $0 $0 $0 $0 $0 $0 $0 $0 $0 $1,800,000Electrical/Mechanical Infrastructure $2,300,000 $0 $0 $0 $0 $0 $0 $0 $0 $0 $0 $2,300,000Power Run to Premises $0 $0 $0 $0 $0 $0 $0 $0 $0 $0 $0 $0Data Run to Premises $0 $0 $0 $0 $0 $0 $0 $0 $0 $0 $0 $0Water/Sewer Run to Premises $0 $0 $0 $0 $0 $0 $0 $0 $0 $0 $0 $0Installation of Add'l Utility Feed $750,000 $0 $0 $0 $0 $0 $0 $0 $0 $0 $0 $750,000
Total $8,339,580 $0 $0 $0 $0 $0 $0 $0 $0 $0 $0 $8,339,580
Soft CostsShipping of Module $192,500 $0 $0 $0 $0 $0 $0 $0 $0 $0 $0 $192,500Installation of Module $250,000 $0 $0 $0 $0 $0 $0 $0 $0 $0 $0 $250,000Commissioning $0 $0 $0 $0 $0 $0 $0 $0 $0 $0 $0 $0Drawings/Permitting $0 $0 $0 $0 $0 $0 $0 $0 $0 $0 $0
Total $442,500 $0 $0 $0 $0 $0 $0 $0 $0 $0 $0 $442,500
Additional CostsTenant Improvements $0 $0 $0 $0 $0 $0 $0 $0 $0 $0 $0 $0
Total $0 $0 $0 $0 $0 $0 $0 $0 $0 $0 $0 $0
Pre -Tax Occupancy Costs $8,782,080 $2,339,735 $2,353,657 $2,367,997 $2,382,768 $2,475,279 $2,705,345 $2,723,873 $2,742,958 $2,762,615 $2,782,861 $34,419,168
NOTES OCCUPANCY TOTALS* Estimated Cooling Uplift Factor of40% to be conservative. GROSS OCCUPANCY COSTS: $34,419,168
** Commissioning included? To be confirmed with Provider. NPV GROSS OCCUPANCY COSTS: 8.00% $25,729,327
*** Did not include costs for RE Taxes, or those to run power, fiber and water service to data center, as they would be uniform for "build" and all "modular" options. AVERAGE ANNUAL COST: $3,441,917
**** Amount includes a DC Facilities Mgr, Chief Engineer and 13 Staff Engineers. ANNUAL WEIGHTED AVG COST PER kW USED: $13,935
NEW LEASE
Build Greenfield Leased (Colo) Build Modular

Page 13 Data Center Advisory Services
PLATFORM OVERVIEW CBRE Portfolio of Capabilities and Volume of Our Client’s Data Center Business We have Supported
StrategicPlanning
NeedsAnalysis
Site Selectionand Acquisition
Design/ Construction Management
Operations and Maintenance
Upgrades and Modifications
Disposition
180 MW $500M $520M 300+ 86 M SF
200+ MW 100+ 75 $1B 1,000+
transactions globally in 2013
data center investment sales
since 2012
in contract value in 2013
data center Project Managers
480 Facilities Operated by
CBRE FM
in the 2014 pipeline data center advisors globally
Global Markets DCSG Project Management
Contract Value
Data Center Facility Managers
and Engineers

Page 14
CLIENTS REPRESENTED CBRE’s Cross-Industry Client Experience and Expertise
Data Center Advisory Services
Mike McMillan Vice President +1 513 369 [email protected]
For more information please contact
CBRE | 201 E Fifth Street, Suite 1200 | Cincinnati, OH 45202 | www.cbre.com/cincinnati
© 2015 CBRE, Inc. This information has been obtained from sources believed reliable. We have not verified it and make no guarantee, warranty or representation about it. Any projections, opinions, assumptions or estimates used are for example only and do not represent the current or future performance of the property. You and your advisors should conduct a careful, independent investigation of the property to determine to your satisfaction the suitability of the property for your needs.
Photos herein are the property of their respective owners and use of these images without the express written consent of the owner is prohibited.
CBRE and the CBRE logo are service marks of CBRE, Inc. and/or its affiliated or related companies in the United States and other countries. All other marks displayed on this document are the property of their respective owners.