de bruijn graphs for sequencing data - rayan chikhi
TRANSCRIPT

de Bruijn graphsfor sequencing data
Rayan Chikhi
CNRSBonsai team, CRIStAL/INRIA, Univ. Lille 1
SMPGD 2016
1

MOTIVATION
- de Bruijn graphs are instrumental for reference-freesequencing data analysis:
1. Genome assembly2. Transcriptome assembly3. Metagenomics assembly4. Ref-free variant detection (recent)5. Transcript quantification (recent)
2
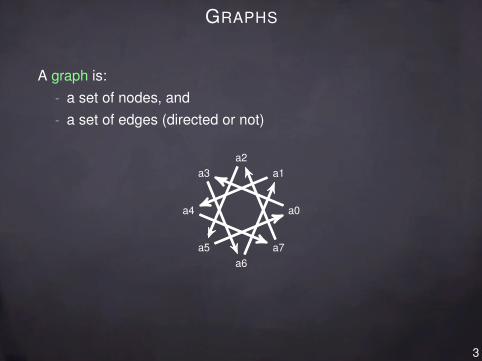
GRAPHS
A graph is:- a set of nodes, and- a set of edges (directed or not)
a0
a1a2
a3
a4
a5a6
a7
3

k -MERS
k -mers are strings of length k
ACTGATGACACT CTG TGA GAT ATG TGA GAC
read
k-mers(k=3)
4

READS, ASSEMBLY
5
GRAPHS FOR SEQUENCING DATA
Graphs represent overlaps between sequences in reads.
Two families of graphs for sequencing data:- de Bruijn graphs generally for Illumina data
- string graphs generally for Sanger/PacBio data
6

DE BRUIJN GRAPHS
A de Bruijn graph for a fixed integer k :1. Nodes = all k-mers (substrings of length k ) in the reads.2. There is an edge between x and y if the (k − 1)-mer prefix
of y matches exactly the (k − 1)-mer suffix of x .
Example for k = 3 and a single read:
ACTG
ACT CTG
7

DE BRUIJN GRAPHS
Example for many reads and still k = 3.
ACTGCTGCTGCC
ACT CTG TGC GCC
8

DE BRUIJN GRAPHS: REDUNDANCY
What happens if we add redundancy?
ACTGACTGCTGCCTGCCTGCTGCCTGCC
dBG, k = 3:
ACT CTG TGC GCC
9

DE BRUIJN GRAPHS: ERRORS
How is a sequencing error (at the end of a read) impacting thede Bruijn graph?
ACTGCTGCCTGATGCC
dBG, k = 3:
ACT CTG TGC
TGA
GCC
10

DE BRUIJN GRAPHS: SNPS
What is the effect of a SNP (or a sequencing error inside aread) on the graph?
AGCCTGAAGCATGA
dBG, k = 3:
AGC
GCC
GCA
CCT
CAT
CTG
TGA
ATG
TGA
11

DE BRUIJN GRAPHS: REPEATS
What is the effect of a small repeat on the graph?
ACTGCTGCTGCTGCTGCTGATGAT
dBG, k = 3:
ACT CTG TGC
GCTTGAGAT
12
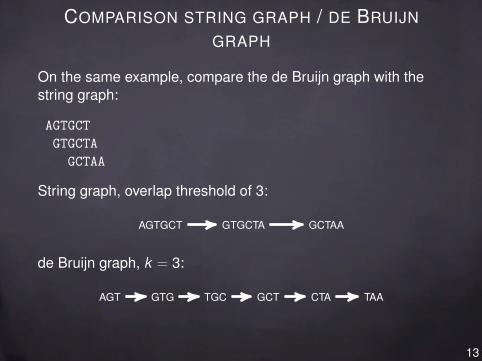
COMPARISON STRING GRAPH / DE BRUIJN
GRAPH
On the same example, compare the de Bruijn graph with thestring graph:
AGTGCTGTGCTA
GCTAA
String graph, overlap threshold of 3:
AGTGCT GTGCTA GCTAA
de Bruijn graph, k = 3:
AGT GTG TGC GCT CTA TAA
13

A SHORT PRACTICAL
Reads:
TACAGTCAGTCAGTCAG
TCAGA
1. Enumerate all distinct k -mers in these reads, for k = 3.2. Construct the de Bruijn graph for k = 3.
(Reminder: nodes are distinct k -mers and edges are all exact(k − 1)-overlaps)
14

PRACTICAL (SOLUTION)Reads:TACAGT
CAGTCAGTCAG
TCAGA
1. The distinct 3-mers are: TAC, ACA, CAG, AGT, GTC, TCA,AGA
2. Note that CAG appears at two places, but is always only asingle node.
3. Construct the de Bruijn graph for k = 3.
TAC ACA CAG AGT GTC TCA
AGA
4. Observe that the order and relative alignment of the readswere not necessary to construct the graph. 15

SHORT NOTE ON REVERSE COMPLEMENTS
Because sequencing is generally not strand-specific:
We always consider that reads (and k-mers) are equalto their reverse complements.
E.g:AAA = TTTATG = CAT
16

THE CHOICE OF k
Choice of k is critical:
- k -mers that contain a sequencing error are noise- k < log4(|genome|): nearly complete graph, uninformative- small k : collapses repeats, more coverage of non-noisy
k -mers- large k : less repeat collapsing, less non-noisy k -mer cov.- k too high: false negatives
Generally, k ≥ 20.(Compare 4k to the genome size.)Higher sequencing coverage means larger k values can beused.
17
HIGHLIGHT ON 3 APPLICATIONS
1. DNA/RNA assembly2. Transcript quantification3. Variant detection
18

GENOME ASSEMBLY
Difficulties: repetitions, sequencing errors, heterozygosity
19

TRANSCRIPTOME ASSEMBLY
Goal: reconstruct mRNA sequencesDifficulties: (repetitions), various expression levels, alternative
splicing
20
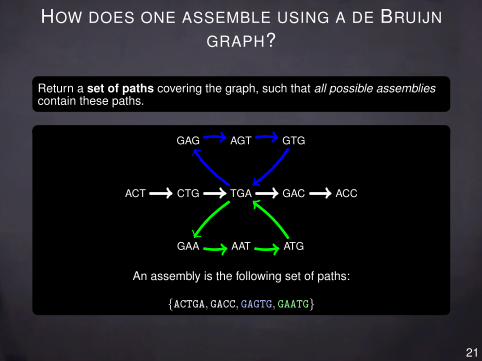
HOW DOES ONE ASSEMBLE USING A DE BRUIJN
GRAPH?
Return a set of paths covering the graph, such that all possible assembliescontain these paths.
ACT CTG TGA GAC ACC
GAA AAT ATG
GAG AGT GTG
An assembly is the following set of paths:
{ACTGA, GACC, GAGTG, GAATG}
21

CONTIGS CONSTRUCTION
Contigs are node-disjoint simple paths.
simple path: a path that does not branch.node-disjoint: two different paths cannot share a node.
Contig 5
Contig 4Contig 3
Contig 1
Contig 2
22

HOW AN ASSEMBLER WORKS[SPAdes, Velvet, ABySS, SOAPdenovo, SGA, Megahit, Minia, .., HGAP, FALCON]
1) Maybe correct the reads. (SPAdes, HGAP, SGA, FALCON)2) Construct a graph from the reads.
Assembly graph with variants & errors
3) Likely sequencing errors are removed.
3) Known biological events are removed.4) Finally, simple paths (i.e. contigs) are returned.
1 1 1 12
3
2
3
2
3
2
3
23

MULTI-K de novo ASSEMBLY
Assemblerk=21
Input reads
Assemblerk=55
Assemblerk=77
Final assembly
Principle:- Assembler is a black box- Input reads + previous assembly with shorter k
24

DE BRUIJN GRAPH VISUALIZATION: BANDAGE
25

BANDAGE
E. coli SPAdes assembly (excerpt). Fig from Lex Nederbragt. What is this knot?
collapsed ribosomal genes (16S, 2S, ..)
26

BANDAGE
E. coli SPAdes assembly (excerpt). Fig from Lex Nederbragt. What is this knot?collapsed ribosomal genes (16S, 2S, ..)
26

RNA QUANTIFICATION
Task: quantify abundance of transcripts in RNA-Seq data.
transcripts
reads
expression levels
2 1
(Many possible units for expression: FPKM, RPKM, TPM)But one basic task: assign reads to transcripts
27
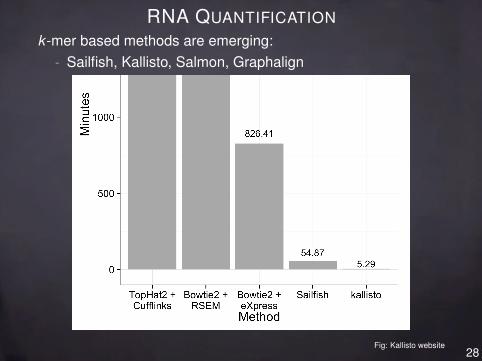
RNA QUANTIFICATIONk -mer based methods are emerging:
- Sailfish, Kallisto, Salmon, Graphalign
Fig: Kallisto website28

KALLISTO
Index: [Bray 15 (arXiv)]1. Construct ref. transcriptome de Bruijn graph2. Color nodes with the transcript(s) it occurs in
Fig: http://tinyheero.github.io/2015/09/02/pseudoalignments-kallisto.html
29

KALLISTO
Read pseudoalignment (1):
Fig: http://tinyheero.github.io/2015/09/02/pseudoalignments-kallisto.html
30

KALLISTO
Read pseudoalignment (2):
Fig: http://tinyheero.github.io/2015/09/02/pseudoalignments-kallisto.html
Result of pseudoalignment of read is a set of transcripts (nocoordinates)
30

KALLISTO QUANTIF. PERFORMANCE
31

REFERENCE-FREE VARIANT DETECTION
Core idea: Variants appear as special structures in the dBG.
AGCCTGAAGCATGA
dBG, k = 3:
AGC
GCC
GCA
CCT
CAT
CTG
TGA
ATG
TGA
32

REFERENCE-FREE VARIANT DETECTION
Small indels:
AGCATGAAGCTGA
dBG, k = 3:
AGC
GCA
GCT
CAT
CTG
ATG
TGA
33

NOT SO SIMPLE IN PRACTICE
Fig: [Sacomoto et al 2014]
- Bubble structure detection (combinator.)- Bubble classification: repeat vs. het (stat. criteria)
34
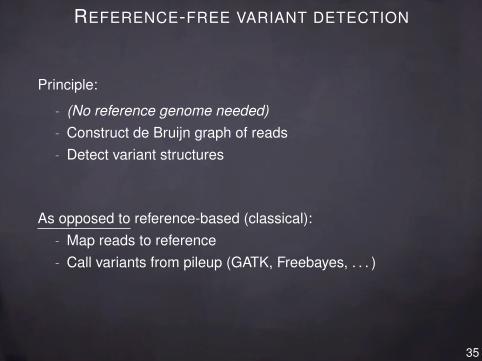
REFERENCE-FREE VARIANT DETECTION
Principle:
- (No reference genome needed)- Construct de Bruijn graph of reads- Detect variant structures
As opposed to reference-based (classical):- Map reads to reference- Call variants from pileup (GATK, Freebayes, . . . )
35

REFERENCE-FREE VARIANT DETECTION
Software:
- Cortex [Iqbal ’12]- Bubbleparse [Legett ’13]- DiscoSNP++ [Uricaru ’14]
Use colored de Bruijn graphs.Given n sequencing datasets,
- Construct de Bruijn graph of union of datasets.- Nodes are annotated with n coverage values
36

k -MER ABUNDANCE HISTOGRAM
number of kmers seen x times
x
1) Example reads dataset:ACTCAGTCA
2) 3-mers:ACTCTCTCAGTCTCA
3) Abundance of each distinct 3-mer:ACT: 1CTC: 1TCA: 2GTC: 1
4) 3-mer abundance:x y1 32 13 04 0
Methods: k -mer counting, e.g. DSK, KMC 2, Jellyfish, . . ..
37

k -MER HISTOGRAM STATISTICS
- Quake corrector, SPAdes assembler [Kelley ’10, Bankevich ’12]I Node coverage cut-off (seq. errors)
- SGA PreQC [Simpson ’13 (arXiv)]I Genome size, graph branch classification, & more
- KmerGenie [Chikhi ’13]I Assembly size, optimal k parameter
38

DISSECTION OF A k -MER HISTOGRAMChr 14 (≈ 88 Mbp) GAGE dataset; histogram k = 21
0 20 40 60 80 120
1e+0
51e
+07
1e+0
9 k = 21
Erroneous k-mers
Genomic non-repeated k-mers
Genomic repeated k-mers,sequencing artifacts, ..
Genomic area
≈number of distinct k -mers covering the genome
≈size of the assembly
→ How to determine exactly this area?39

HISTOGRAM MODEL
We use Quake’s model: [Kelley ’10]
Erroneous k -mers Pareto distribution withshape α:
pdf =α
xα+1
Genomic k -mers Mixture of n Gaussians,weighted by a Zeta distributionof shape s:
w1X1 + w2X2 + . . .+ wnXn
Xj ∼ N (jµ1, (jσ1)2)
P(wj = k) = k−s/ζ(s)
Full model Mixture weighted by(pe, 1− pe).
0 20 40 60 80 120
1e+
051e
+07
1e+
09 k = 21
Numerical optimization (R) is used to fit the model to actual histograms.
40

APPLICATION: FINDING SUITABLE k VALUE
Genome assembly is not robust with respect to k .
Total length and contiguity (NG50) of chr. 14 (88 Mbp) assemblies
41

FINDING OPTIMAL k
- Genome is sufficiently covered by k -mers =⇒ good k value- Requires to know the number of genomic k -mers- Can be estimated with a k -mer histogram and the Quake model
To find the optimal k , one can compare histograms for different values of k .
Chr 14 (≈ 88 Mbp) GAGE dataset; histograms for three values of k
→ Issue: computing a single histogram (using k -mer counting) is time andmemory expensive
42

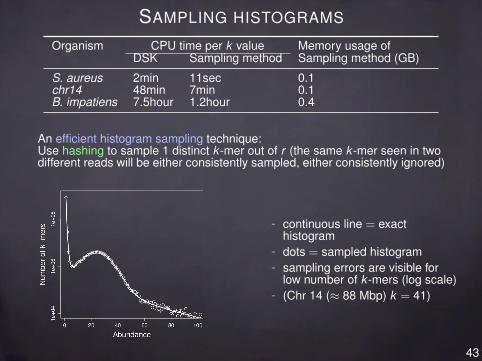
SAMPLING HISTOGRAMS
Organism CPU time per k valueDSK
S. aureus 2minchr14 48minB. impatiens 7.5hour
An efficient histogram sampling technique:Use hashing to sample 1 distinct k -mer out of r (the same k -mer seen in twodifferent reads will be either consistently sampled, either consistently ignored)
- continuous line = exacthistogram
- dots = sampled histogram- sampling errors are visible for
low number of k -mers (log scale)- (Chr 14 (≈ 88 Mbp) k = 41)
43
SAMPLING HISTOGRAMS
Organism CPU time per k value Memory usage ofDSK Sampling method Sampling method (GB)
S. aureus 2min 11sec 0.1chr14 48min 7min 0.1B. impatiens 7.5hour 1.2hour 0.4
An efficient histogram sampling technique:Use hashing to sample 1 distinct k -mer out of r (the same k -mer seen in twodifferent reads will be either consistently sampled, either consistently ignored)
- continuous line = exacthistogram
- dots = sampled histogram- sampling errors are visible for
low number of k -mers (log scale)- (Chr 14 (≈ 88 Mbp) k = 41)
43

KMERGENIE
KmerGenie software (http://kmergenie.bx.psu.edu)Joint work with P. Medvedev (Penn State)
- Assembly size prediction- optimal k prediction- k -mer histogram sampling
44
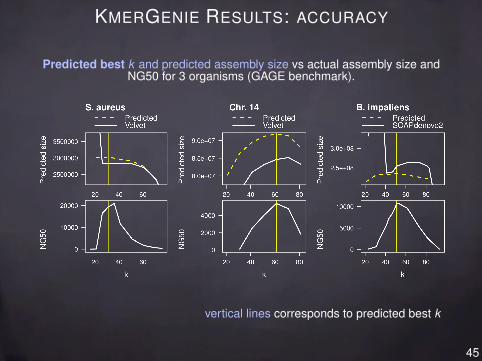
KMERGENIE RESULTS: ACCURACY
Predicted best k and predicted assembly size vs actual assembly size andNG50 for 3 organisms (GAGE benchmark).
vertical lines corresponds to predicted best k
45

OPEN QUESTIONS ON k -MER HISTOGRAMS
ANALYSIS
- Robustness of modelI low-coverage and very-high coverageI polyploidyI metaDNA/RNA
- k choices in multi-k frameworks
46

CONCLUSION
de Bruijn graphs
- Tool for reference-free analysis of sequencing data- Besides assembly, new applications emerge
(quantification, variants)- Information from k -mer histograms
- Practical aspects (mem. usage)- Software for large de Bruijn graphs: BCALM
(github.com/GATB/bcalm), GATB library (www.gatb.fr)
47