deformation capacity and strength of rc frame members … · resistant design and the behavior of...
TRANSCRIPT

1
Deformation Capacity and Strength of RC Frame Members with High-Strength Materials
Min-Yuan Cheng, Leonardus S. B. Wibowo, Remy D. Lequesne and Andres Lepage Synopsis: Some implications of using high-strength concrete and steel materials in reinforced concrete frame members are discussed in terms of both flexural design and behavior. Through an example, it is demonstrated that the computed sectional curvature is highly sensitive to the choice of rectangular stress block used to model compression zone stresses of high-strength concrete. Comparison of various models suggests that the use of the stress block model defined in the ACI Building Code tends to overestimate curvature for concrete strengths exceeding 12 ksi (83 MPa). In addition, recent test data are presented for flexure-dominated concrete members reinforced with high-strength steel bars. The effects of replacing Grade 60 (410) flexural reinforcement with Grade 100 (690) steel on deformation capacity, stiffness, and strength are examined. Test data support the viability of using Grade 100 (690) longitudinal reinforcement to resist loads that induce force-displacement response well into the nonlinear range.
Keywords: High-Strength Steel, High-Strength Concrete, Seismic, Earthquake, Flexure
2
Min-Yuan Cheng, MACI, is an Associate Professor of Civil and Construction Engineering at National Taiwan University of Science and Technology in Taipei, Taiwan. He is a member of ACI Sub-Committee 318-J, Joints and Connections; Joint ACI-ASCE Committee 352, Joints and Connections in Monolithic Concrete Structures; and an associate member of ACI Committee 335, Composite and Hybrid Structures. Leonardus S. B. Wibowo is a PhD Student of Civil and Construction Engineering at National Taiwan University of Science and Technology in Taipei, Taiwan. He received his BS degree in Civil Engineering from Universitas Brawijaya, Malang, Indonesia, and MS degree in Civil Engineering from Institut Teknologi Sepuluh Nopember, Surabaya, Indonesia. Rémy D. Lequesne, MACI, is an Assistant Professor of Civil, Environmental and Architectural Engineering at the University of Kansas. He is Secretary of Joint ACI-ASCE Committee 408, Bond and Development of Steel Reinforcement; and a member of ACI Sub-Committee 318-J, Joints and Connections; and Joint ACI-ASCE Committee 352, Joints and Connections in Monolithic Concrete Structures. His interests include earthquake-resistant design and the behavior of reinforced concrete and fiber reinforced concrete members. Andres Lepage, FACI, is an Associate Professor in the Department of Civil, Environmental, and Architectural Engineering at The University of Kansas, Lawrence, KS. He is a member of ACI Committees 335, Composite and Hybrid Structures; 374, Performance-Based Seismic Design of Concrete Buildings; 375, Performance-Based Design of Concrete Buildings for Wind Loads; and ACI Subcommittee 318-R, High-Strength Steel Reinforcement in Reinforced Concrete Design.
INTRODUCTION
In the United States, there is increasing interest in the use of high-strength materials in structures designed
to resist extreme loading events (due to earthquake, wind, or blast). The term “high-strength” typically refers to concrete with a compressive strength greater than 8 ksi (55 MPa) and steel reinforcement with a yield strength greater than 80 ksi (550 MPa). Advantages of using these high-strength materials include smaller member sizes and reduced reinforcement congestion. High-strength concrete is already somewhat common in U.S. practice; particularly in tall structures where minimizing column dimensions is an important consideration. Use of high-strength steel has been far more limited in the United States.1, 2. This disparity is a reflection of current ACI Building Code3 provisions for earthquake-resistant design, which do not place an upper limit on the specified concrete compressive strength, , but do limit the specified yield strength, , to 60 ksi (410 MPa) for primary longitudinal reinforcement.
The aim of this paper is to highlight unresolved issues pertaining to the behavior and design of flexural
members constructed with high-strength materials. Potential limitations of ACI Building Code3 provisions for flexural design are discussed and future research needs are identified. Results from recent tests of beam specimens subjected to reversed cyclic loading are presented to show the effect of high-strength reinforcement on member behavior. Implications of using high-strength materials on the design of members for demands other than flexure, including serviceability and shear, are outside the scope.
HIGH-STRENGTH CONCRETE FLEXURAL MEMBERS
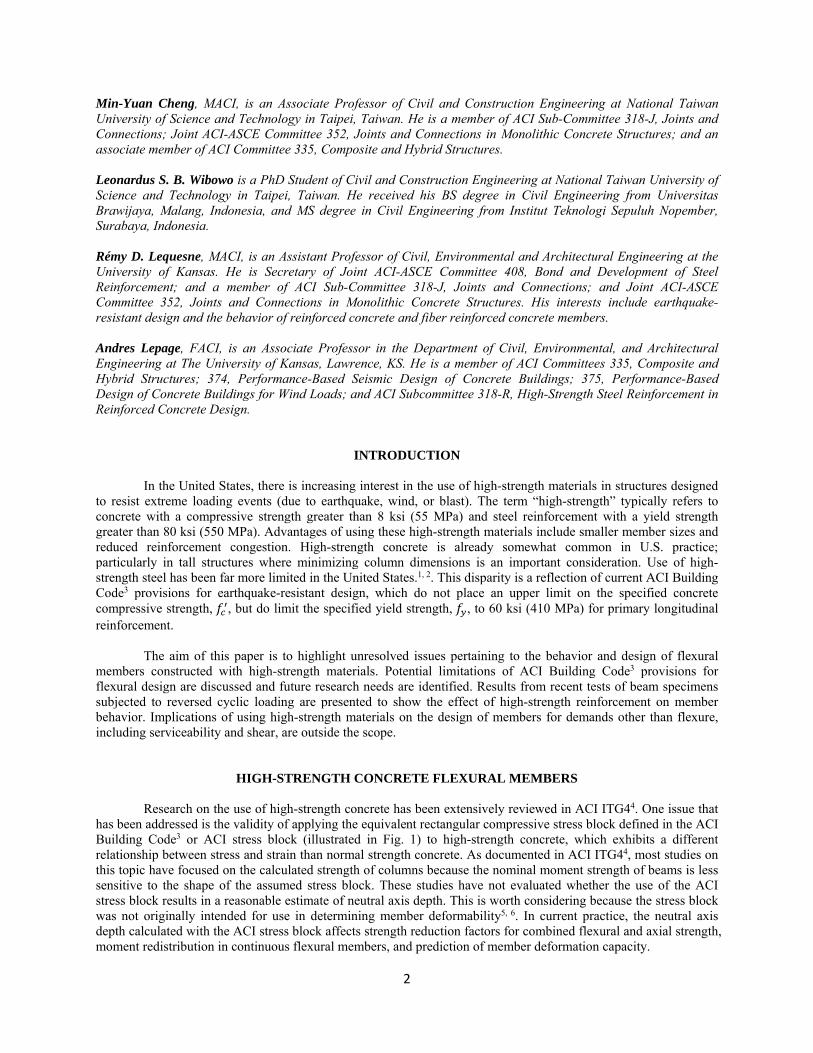
Research on the use of high-strength concrete has been extensively reviewed in ACI ITG44. One issue that has been addressed is the validity of applying the equivalent rectangular compressive stress block defined in the ACI Building Code3 or ACI stress block (illustrated in Fig. 1) to high-strength concrete, which exhibits a different relationship between stress and strain than normal strength concrete. As documented in ACI ITG44, most studies on this topic have focused on the calculated strength of columns because the nominal moment strength of beams is less sensitive to the shape of the assumed stress block. These studies have not evaluated whether the use of the ACI stress block results in a reasonable estimate of neutral axis depth. This is worth considering because the stress block was not originally intended for use in determining member deformability5, 6. In current practice, the neutral axis depth calculated with the ACI stress block affects strength reduction factors for combined flexural and axial strength, moment redistribution in continuous flexural members, and prediction of member deformation capacity.
3
Comparison of Compression Zone Stress Block Definitions The computed sectional curvature associated with flexural strength (or nominal moment capacity) of
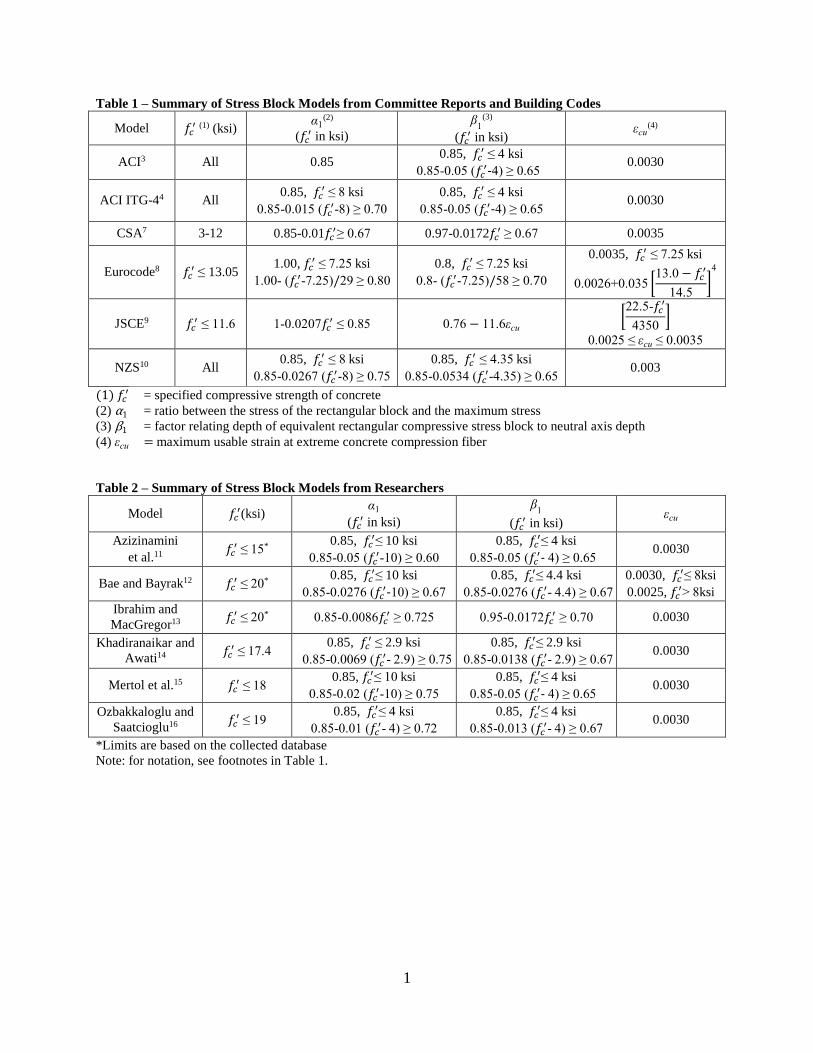
reinforced concrete members cannot be directly obtained from traditional load-deflection measurements because strain measurements on concrete surfaces involve a gauge length, whereas sectional curvature does not. The question of whether deformations calculated using the ACI stress block are reasonable is therefore explored through comparison with results from other stress block models. As shown in Table 1, the definition of the equivalent stress block model has many variations depending on the design standards3, 4, 7-10. Several other equivalent stress block definitions (Table 2) have also been proposed11-16 with the aim of more accurately representing the force in the compression zone when using high-strength concrete. The models differ in several respects, including the limiting value of compressive strain (εcu).
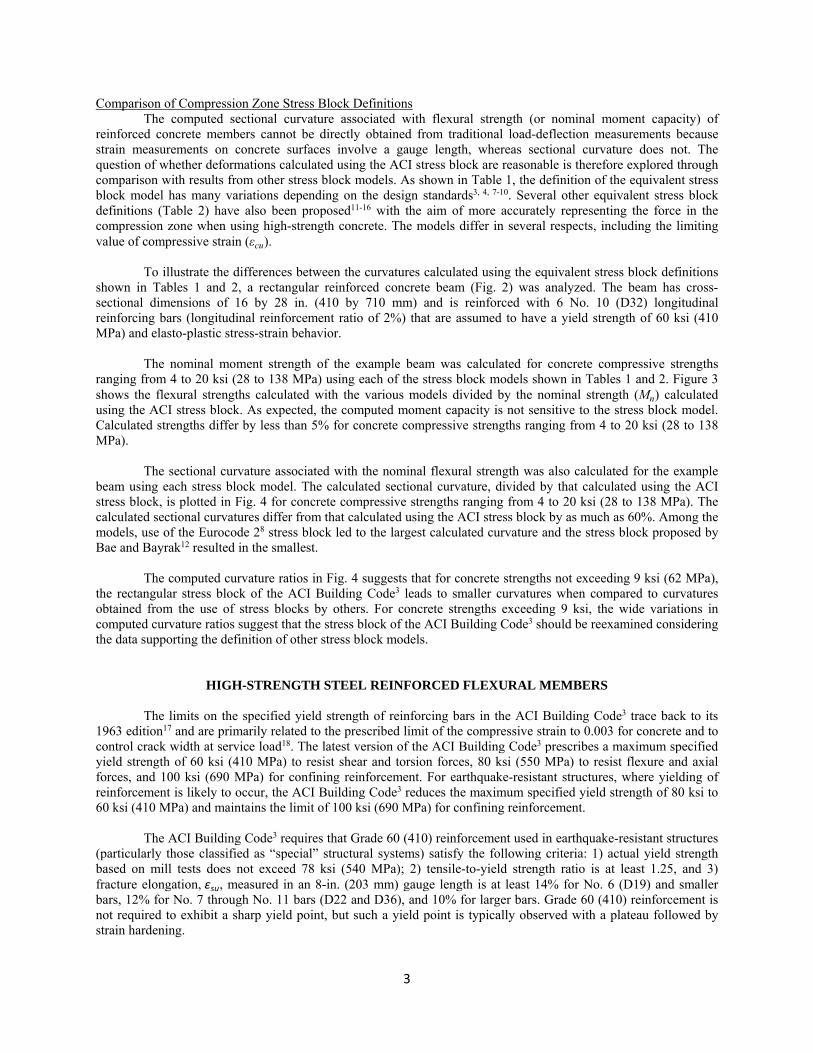
To illustrate the differences between the curvatures calculated using the equivalent stress block definitions
shown in Tables 1 and 2, a rectangular reinforced concrete beam (Fig. 2) was analyzed. The beam has cross-sectional dimensions of 16 by 28 in. (410 by 710 mm) and is reinforced with 6 No. 10 (D32) longitudinal reinforcing bars (longitudinal reinforcement ratio of 2%) that are assumed to have a yield strength of 60 ksi (410 MPa) and elasto-plastic stress-strain behavior.
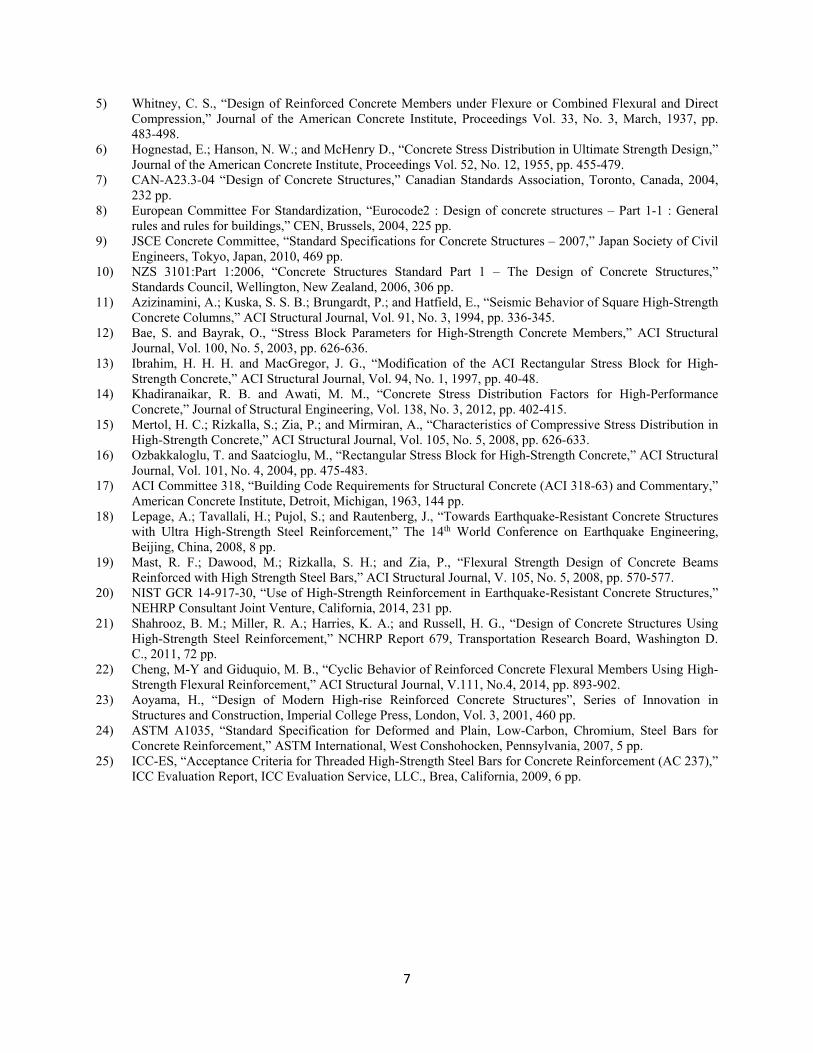
The nominal moment strength of the example beam was calculated for concrete compressive strengths
ranging from 4 to 20 ksi (28 to 138 MPa) using each of the stress block models shown in Tables 1 and 2. Figure 3 shows the flexural strengths calculated with the various models divided by the nominal strength (Mn) calculated using the ACI stress block. As expected, the computed moment capacity is not sensitive to the stress block model. Calculated strengths differ by less than 5% for concrete compressive strengths ranging from 4 to 20 ksi (28 to 138 MPa).
The sectional curvature associated with the nominal flexural strength was also calculated for the example
beam using each stress block model. The calculated sectional curvature, divided by that calculated using the ACI stress block, is plotted in Fig. 4 for concrete compressive strengths ranging from 4 to 20 ksi (28 to 138 MPa). The calculated sectional curvatures differ from that calculated using the ACI stress block by as much as 60%. Among the models, use of the Eurocode 28 stress block led to the largest calculated curvature and the stress block proposed by Bae and Bayrak12 resulted in the smallest.
The computed curvature ratios in Fig. 4 suggests that for concrete strengths not exceeding 9 ksi (62 MPa),
the rectangular stress block of the ACI Building Code3 leads to smaller curvatures when compared to curvatures obtained from the use of stress blocks by others. For concrete strengths exceeding 9 ksi, the wide variations in computed curvature ratios suggest that the stress block of the ACI Building Code3 should be reexamined considering the data supporting the definition of other stress block models.
HIGH-STRENGTH STEEL REINFORCED FLEXURAL MEMBERS
The limits on the specified yield strength of reinforcing bars in the ACI Building Code3 trace back to its 1963 edition17 and are primarily related to the prescribed limit of the compressive strain to 0.003 for concrete and to control crack width at service load18. The latest version of the ACI Building Code3 prescribes a maximum specified yield strength of 60 ksi (410 MPa) to resist shear and torsion forces, 80 ksi (550 MPa) to resist flexure and axial forces, and 100 ksi (690 MPa) for confining reinforcement. For earthquake-resistant structures, where yielding of reinforcement is likely to occur, the ACI Building Code3 reduces the maximum specified yield strength of 80 ksi to 60 ksi (410 MPa) and maintains the limit of 100 ksi (690 MPa) for confining reinforcement.
The ACI Building Code3 requires that Grade 60 (410) reinforcement used in earthquake-resistant structures
(particularly those classified as “special” structural systems) satisfy the following criteria: 1) actual yield strength based on mill tests does not exceed 78 ksi (540 MPa); 2) tensile-to-yield strength ratio is at least 1.25, and 3) fracture elongation, εsu, measured in an 8-in. (203 mm) gauge length is at least 14% for No. 6 (D19) and smaller bars, 12% for No. 7 through No. 11 bars (D22 and D36), and 10% for larger bars. Grade 60 (410) reinforcement is not required to exhibit a sharp yield point, but such a yield point is typically observed with a plateau followed by strain hardening.
4
In the United States there are no design standards defining required mechanical properties for high-strength steel reinforcement to be used as primary reinforcement in earthquake-resistant structures. This is despite an increasing number of studies1, 2, 20-22 demonstrating the potential benefits of high-strength steel. Efforts20 to promote a new standard have led to questions about which attributes are critical to performance. In Japan, the new RC project23 led to the acceptance of Grade 100 (690) steel exhibiting a: 1) tensile-to-yield strength ratio (fu fy) greater
than 1/0.85, 2) εsu of at least 10%, and 3) a distinct yield plateau. It is, however, difficult to produce such reinforcement in the United States without major adjustments to current steel production practices. The influence of these properties has been partially investigated analytically20, but the results are very sensitive to modeling assumptions. Experimental evidence is needed to help define the acceptable range of values for key mechanical properties.
Tests of specimens constructed with high-strength steel reinforcement
Results from laboratory tests of RC beams reinforced with different types of high-strength longitudinal reinforcement and subjected to reversed cyclic loads have been recently reported by Cheng and Giduquio22 and Tavallali et al1. The test data illustrate the influence of various reinforcement attributes on specimen response.
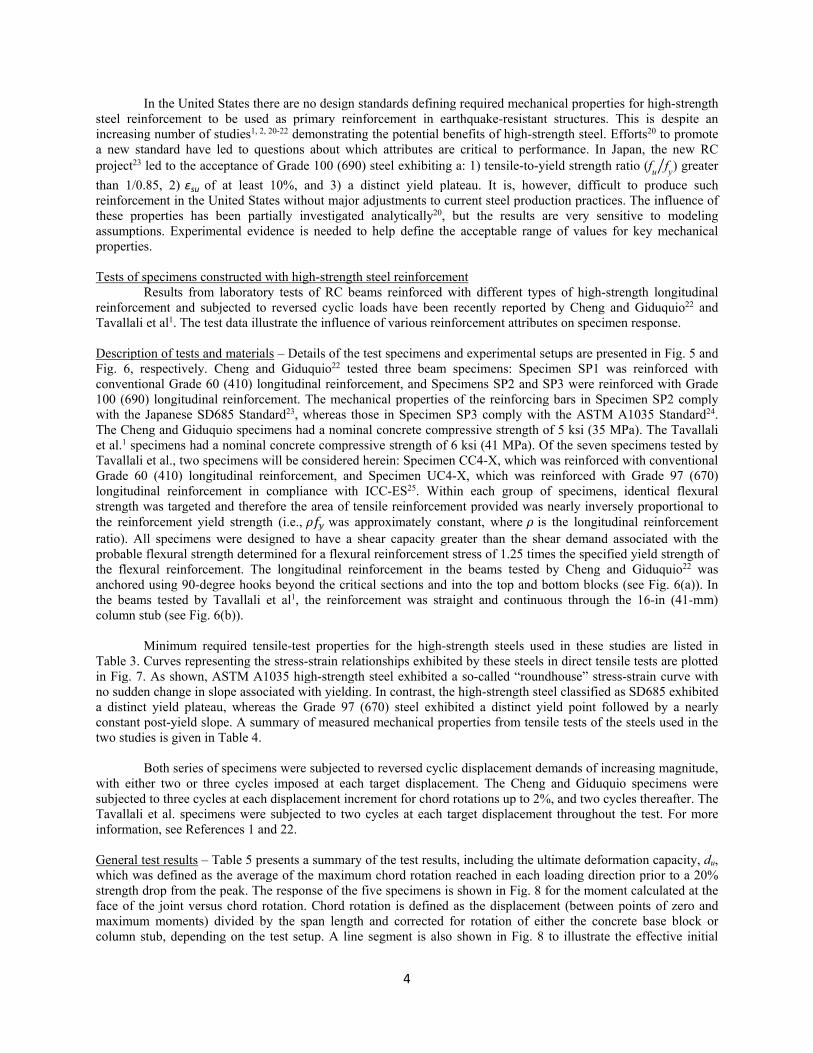
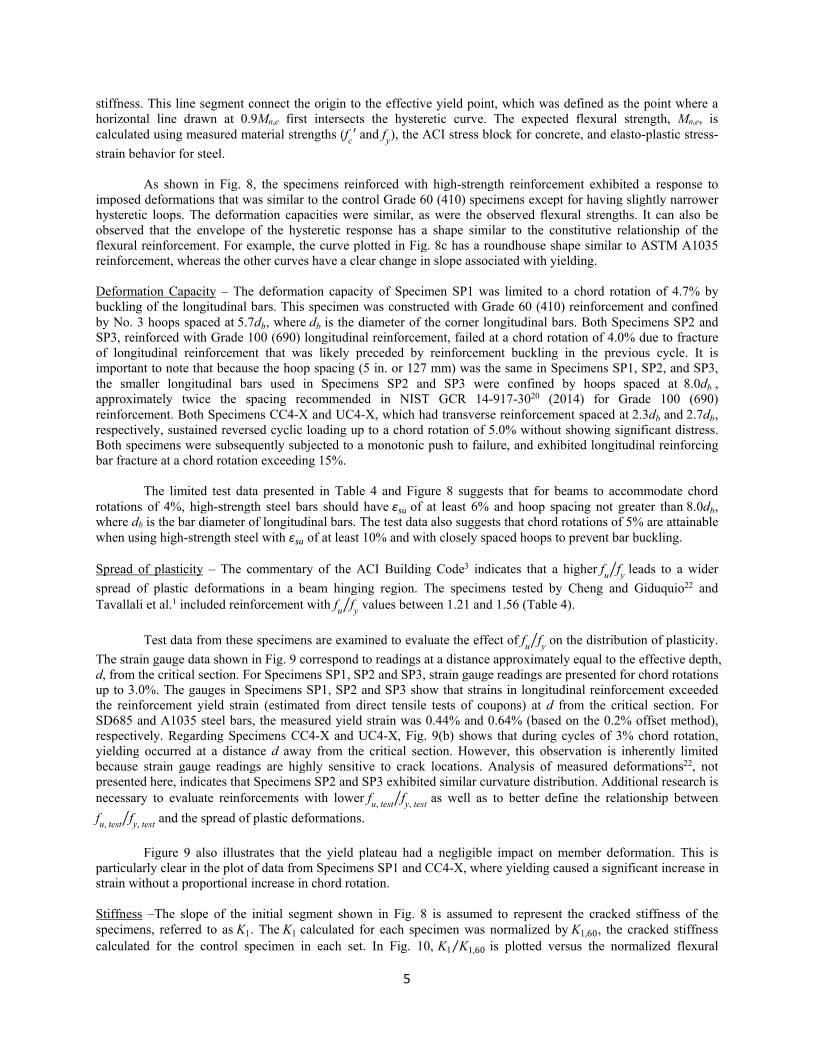
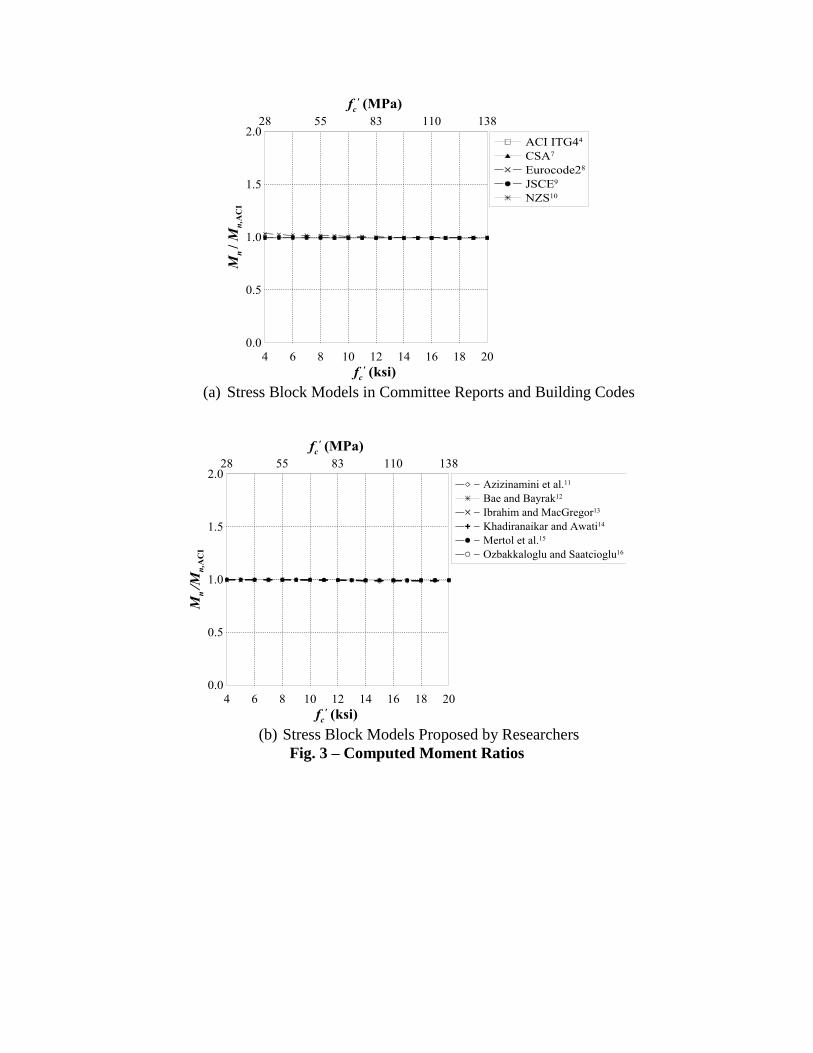
Description of tests and materials – Details of the test specimens and experimental setups are presented in Fig. 5 and Fig. 6, respectively. Cheng and Giduquio22 tested three beam specimens: Specimen SP1 was reinforced with conventional Grade 60 (410) longitudinal reinforcement, and Specimens SP2 and SP3 were reinforced with Grade 100 (690) longitudinal reinforcement. The mechanical properties of the reinforcing bars in Specimen SP2 comply with the Japanese SD685 Standard23, whereas those in Specimen SP3 comply with the ASTM A1035 Standard24. The Cheng and Giduquio specimens had a nominal concrete compressive strength of 5 ksi (35 MPa). The Tavallali et al.1 specimens had a nominal concrete compressive strength of 6 ksi (41 MPa). Of the seven specimens tested by Tavallali et al., two specimens will be considered herein: Specimen CC4-X, which was reinforced with conventional Grade 60 (410) longitudinal reinforcement, and Specimen UC4-X, which was reinforced with Grade 97 (670) longitudinal reinforcement in compliance with ICC-ES25. Within each group of specimens, identical flexural strength was targeted and therefore the area of tensile reinforcement provided was nearly inversely proportional to the reinforcement yield strength (i.e., was approximately constant, where is the longitudinal reinforcement ratio). All specimens were designed to have a shear capacity greater than the shear demand associated with the probable flexural strength determined for a flexural reinforcement stress of 1.25 times the specified yield strength of the flexural reinforcement. The longitudinal reinforcement in the beams tested by Cheng and Giduquio22 was anchored using 90-degree hooks beyond the critical sections and into the top and bottom blocks (see Fig. 6(a)). In the beams tested by Tavallali et al1, the reinforcement was straight and continuous through the 16-in (41-mm) column stub (see Fig. 6(b)).
Minimum required tensile-test properties for the high-strength steels used in these studies are listed in
Table 3. Curves representing the stress-strain relationships exhibited by these steels in direct tensile tests are plotted in Fig. 7. As shown, ASTM A1035 high-strength steel exhibited a so-called “roundhouse” stress-strain curve with no sudden change in slope associated with yielding. In contrast, the high-strength steel classified as SD685 exhibited a distinct yield plateau, whereas the Grade 97 (670) steel exhibited a distinct yield point followed by a nearly constant post-yield slope. A summary of measured mechanical properties from tensile tests of the steels used in the two studies is given in Table 4.
Both series of specimens were subjected to reversed cyclic displacement demands of increasing magnitude,
with either two or three cycles imposed at each target displacement. The Cheng and Giduquio specimens were subjected to three cycles at each displacement increment for chord rotations up to 2%, and two cycles thereafter. The Tavallali et al. specimens were subjected to two cycles at each target displacement throughout the test. For more information, see References 1 and 22.
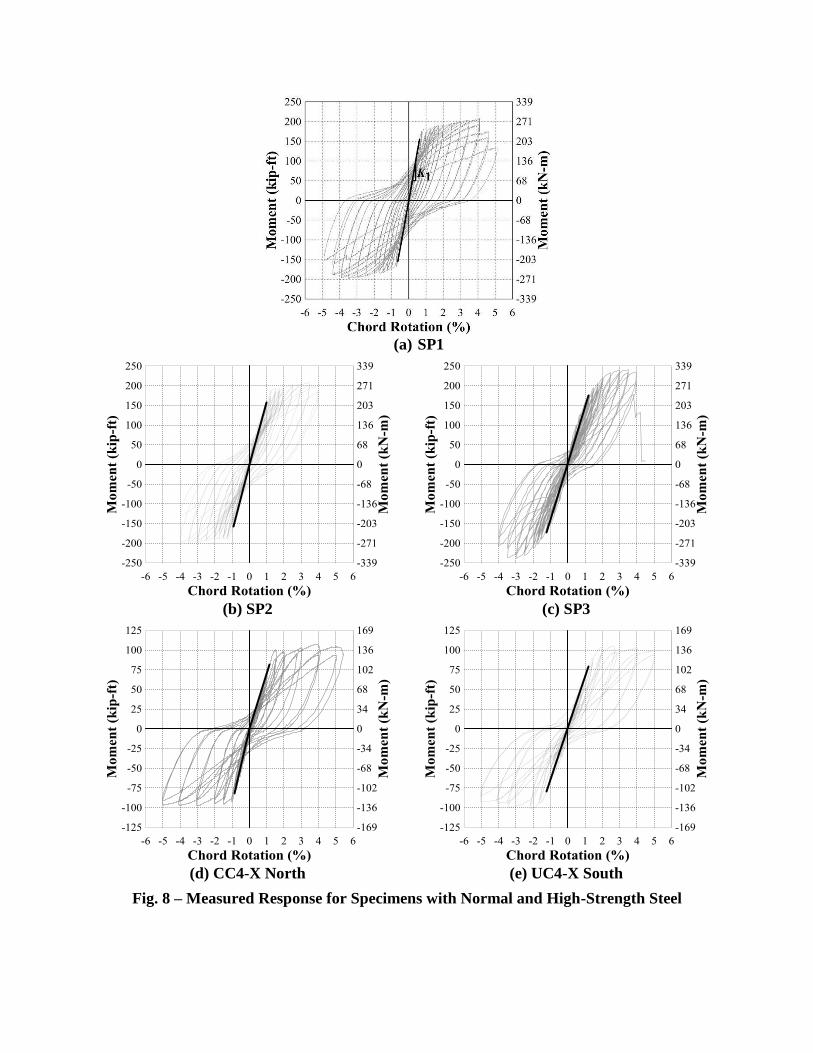
General test results – Table 5 presents a summary of the test results, including the ultimate deformation capacity, du, which was defined as the average of the maximum chord rotation reached in each loading direction prior to a 20% strength drop from the peak. The response of the five specimens is shown in Fig. 8 for the moment calculated at the face of the joint versus chord rotation. Chord rotation is defined as the displacement (between points of zero and maximum moments) divided by the span length and corrected for rotation of either the concrete base block or column stub, depending on the test setup. A line segment is also shown in Fig. 8 to illustrate the effective initial
5
stiffness. This line segment connect the origin to the effective yield point, which was defined as the point where a horizontal line drawn at 0.9Mn,e first intersects the hysteretic curve. The expected flexural strength, Mn,e, is calculated using measured material strengths (fc′ and fy), the ACI stress block for concrete, and elasto-plastic stress-
strain behavior for steel. As shown in Fig. 8, the specimens reinforced with high-strength reinforcement exhibited a response to
imposed deformations that was similar to the control Grade 60 (410) specimens except for having slightly narrower hysteretic loops. The deformation capacities were similar, as were the observed flexural strengths. It can also be observed that the envelope of the hysteretic response has a shape similar to the constitutive relationship of the flexural reinforcement. For example, the curve plotted in Fig. 8c has a roundhouse shape similar to ASTM A1035 reinforcement, whereas the other curves have a clear change in slope associated with yielding.
Deformation Capacity – The deformation capacity of Specimen SP1 was limited to a chord rotation of 4.7% by buckling of the longitudinal bars. This specimen was constructed with Grade 60 (410) reinforcement and confined by No. 3 hoops spaced at 5.7db, where db is the diameter of the corner longitudinal bars. Both Specimens SP2 and SP3, reinforced with Grade 100 (690) longitudinal reinforcement, failed at a chord rotation of 4.0% due to fracture of longitudinal reinforcement that was likely preceded by reinforcement buckling in the previous cycle. It is important to note that because the hoop spacing (5 in. or 127 mm) was the same in Specimens SP1, SP2, and SP3, the smaller longitudinal bars used in Specimens SP2 and SP3 were confined by hoops spaced at 8.0db , approximately twice the spacing recommended in NIST GCR 14-917-3020 (2014) for Grade 100 (690) reinforcement. Both Specimens CC4-X and UC4-X, which had transverse reinforcement spaced at 2.3db and 2.7db, respectively, sustained reversed cyclic loading up to a chord rotation of 5.0% without showing significant distress. Both specimens were subsequently subjected to a monotonic push to failure, and exhibited longitudinal reinforcing bar fracture at a chord rotation exceeding 15%.
The limited test data presented in Table 4 and Figure 8 suggests that for beams to accommodate chord
rotations of 4%, high-strength steel bars should have εsu of at least 6% and hoop spacing not greater than 8.0db, where db is the bar diameter of longitudinal bars. The test data also suggests that chord rotations of 5% are attainable when using high-strength steel with εsu of at least 10% and with closely spaced hoops to prevent bar buckling.
Spread of plasticity – The commentary of the ACI Building Code3 indicates that a higher fu fy leads to a wider
spread of plastic deformations in a beam hinging region. The specimens tested by Cheng and Giduquio22 and Tavallali et al.1 included reinforcement with fu fy values between 1.21 and 1.56 (Table 4).
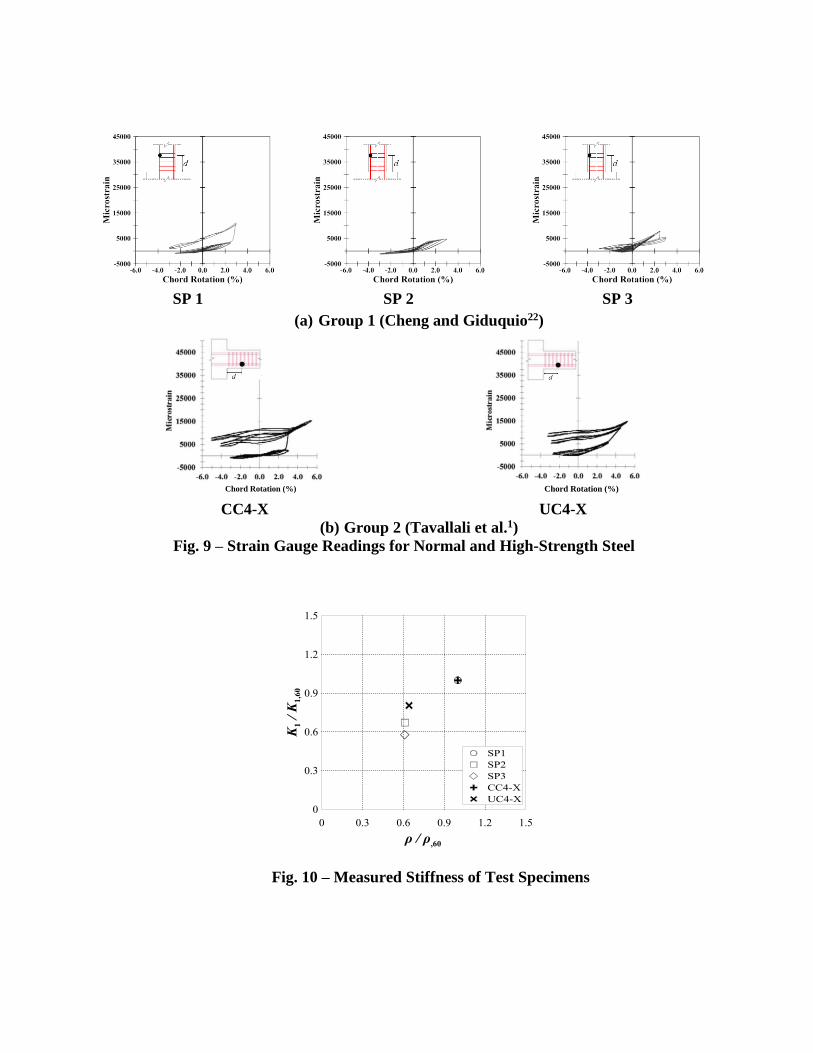
Test data from these specimens are examined to evaluate the effect of fu fy on the distribution of plasticity.
The strain gauge data shown in Fig. 9 correspond to readings at a distance approximately equal to the effective depth, d, from the critical section. For Specimens SP1, SP2 and SP3, strain gauge readings are presented for chord rotations up to 3.0%. The gauges in Specimens SP1, SP2 and SP3 show that strains in longitudinal reinforcement exceeded the reinforcement yield strain (estimated from direct tensile tests of coupons) at d from the critical section. For SD685 and A1035 steel bars, the measured yield strain was 0.44% and 0.64% (based on the 0.2% offset method), respectively. Regarding Specimens CC4-X and UC4-X, Fig. 9(b) shows that during cycles of 3% chord rotation, yielding occurred at a distance d away from the critical section. However, this observation is inherently limited because strain gauge readings are highly sensitive to crack locations. Analysis of measured deformations22, not presented here, indicates that Specimens SP2 and SP3 exhibited similar curvature distribution. Additional research is necessary to evaluate reinforcements with lower fu,test fy, test as well as to better define the relationship between
fu,test fy, test and the spread of plastic deformations.
Figure 9 also illustrates that the yield plateau had a negligible impact on member deformation. This is
particularly clear in the plot of data from Specimens SP1 and CC4-X, where yielding caused a significant increase in strain without a proportional increase in chord rotation.
Stiffness –The slope of the initial segment shown in Fig. 8 is assumed to represent the cracked stiffness of the specimens, referred to as K1. The K1 calculated for each specimen was normalized by K1,60, the cracked stiffness calculated for the control specimen in each set. In Fig. 10, K1 K1,60⁄ is plotted versus the normalized flexural
6
reinforcement ratio ,⁄ , where , is the reinforcement ratio for the Grade 60 (410) control specimen. As shown, the cracked stiffness is approximately proportional to the normalized flexural reinforcement ratio.
Figure 10 shows that for a given concrete beam reinforced with Grade 60 (410) steel bars, replacing the
Grade 60 (410) reinforcement with reduced amount of high-strength reinforcement leads to a reduction in the beam initial stiffness. The reduction in stiffness is nearly proportional to the reduction in reinforcement ratio. Thus, beams reinforced for a target flexural strength (or fy) will have reduced stiffness K1 in proportion to an increase in fy.
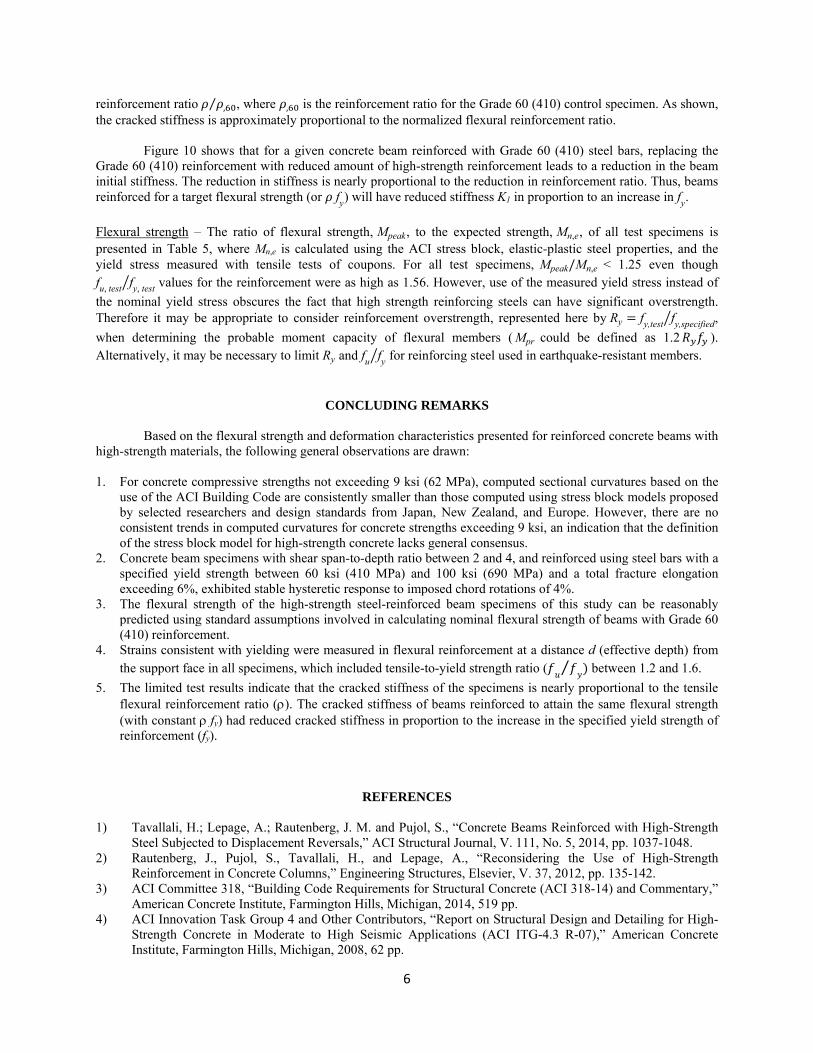
Flexural strength – The ratio of flexural strength, Mpeak, to the expected strength, Mn,e, of all test specimens is presented in Table 5, where Mn,e is calculated using the ACI stress block, elastic-plastic steel properties, and the yield stress measured with tensile tests of coupons. For all test specimens, Mpeak/Mn,e < 1.25 even though fu,test fy, test values for the reinforcement were as high as 1.56. However, use of the measured yield stress instead of
the nominal yield stress obscures the fact that high strength reinforcing steels can have significant overstrength. Therefore it may be appropriate to consider reinforcement overstrength, represented here by Ry fy,test fy,specified,
when determining the probable moment capacity of flexural members ( Mpr could be defined as 1.2 ). Alternatively, it may be necessary to limit Ry and fu fy for reinforcing steel used in earthquake-resistant members.
CONCLUDING REMARKS Based on the flexural strength and deformation characteristics presented for reinforced concrete beams with
high-strength materials, the following general observations are drawn:
1. For concrete compressive strengths not exceeding 9 ksi (62 MPa), computed sectional curvatures based on the use of the ACI Building Code are consistently smaller than those computed using stress block models proposed by selected researchers and design standards from Japan, New Zealand, and Europe. However, there are no consistent trends in computed curvatures for concrete strengths exceeding 9 ksi, an indication that the definition of the stress block model for high-strength concrete lacks general consensus.
2. Concrete beam specimens with shear span-to-depth ratio between 2 and 4, and reinforced using steel bars with a specified yield strength between 60 ksi (410 MPa) and 100 ksi (690 MPa) and a total fracture elongation exceeding 6%, exhibited stable hysteretic response to imposed chord rotations of 4%.
3. The flexural strength of the high-strength steel-reinforced beam specimens of this study can be reasonably predicted using standard assumptions involved in calculating nominal flexural strength of beams with Grade 60 (410) reinforcement.
4. Strains consistent with yielding were measured in flexural reinforcement at a distance d (effective depth) from the support face in all specimens, which included tensile-to-yield strength ratio ( ⁄ between 1.2 and 1.6.
5. The limited test results indicate that the cracked stiffness of the specimens is nearly proportional to the tensile flexural reinforcement ratio (). The cracked stiffness of beams reinforced to attain the same flexural strength (with constant fy) had reduced cracked stiffness in proportion to the increase in the specified yield strength of reinforcement (fy).
REFERENCES
1) Tavallali, H.; Lepage, A.; Rautenberg, J. M. and Pujol, S., “Concrete Beams Reinforced with High-Strength Steel Subjected to Displacement Reversals,” ACI Structural Journal, V. 111, No. 5, 2014, pp. 1037-1048.
2) Rautenberg, J., Pujol, S., Tavallali, H., and Lepage, A., “Reconsidering the Use of High-Strength Reinforcement in Concrete Columns,” Engineering Structures, Elsevier, V. 37, 2012, pp. 135-142.
3) ACI Committee 318, “Building Code Requirements for Structural Concrete (ACI 318-14) and Commentary,” American Concrete Institute, Farmington Hills, Michigan, 2014, 519 pp.
4) ACI Innovation Task Group 4 and Other Contributors, “Report on Structural Design and Detailing for High-Strength Concrete in Moderate to High Seismic Applications (ACI ITG-4.3 R-07),” American Concrete Institute, Farmington Hills, Michigan, 2008, 62 pp.
7
5) Whitney, C. S., “Design of Reinforced Concrete Members under Flexure or Combined Flexural and Direct Compression,” Journal of the American Concrete Institute, Proceedings Vol. 33, No. 3, March, 1937, pp. 483-498.
6) Hognestad, E.; Hanson, N. W.; and McHenry D., “Concrete Stress Distribution in Ultimate Strength Design,” Journal of the American Concrete Institute, Proceedings Vol. 52, No. 12, 1955, pp. 455-479.
7) CAN-A23.3-04 “Design of Concrete Structures,” Canadian Standards Association, Toronto, Canada, 2004, 232 pp.
8) European Committee For Standardization, “Eurocode2 : Design of concrete structures – Part 1-1 : General rules and rules for buildings,” CEN, Brussels, 2004, 225 pp.
9) JSCE Concrete Committee, “Standard Specifications for Concrete Structures – 2007,” Japan Society of Civil Engineers, Tokyo, Japan, 2010, 469 pp.
10) NZS 3101:Part 1:2006, “Concrete Structures Standard Part 1 – The Design of Concrete Structures,” Standards Council, Wellington, New Zealand, 2006, 306 pp.
11) Azizinamini, A.; Kuska, S. S. B.; Brungardt, P.; and Hatfield, E., “Seismic Behavior of Square High-Strength Concrete Columns,” ACI Structural Journal, Vol. 91, No. 3, 1994, pp. 336-345.
12) Bae, S. and Bayrak, O., “Stress Block Parameters for High-Strength Concrete Members,” ACI Structural Journal, Vol. 100, No. 5, 2003, pp. 626-636.
13) Ibrahim, H. H. H. and MacGregor, J. G., “Modification of the ACI Rectangular Stress Block for High-Strength Concrete,” ACI Structural Journal, Vol. 94, No. 1, 1997, pp. 40-48.
14) Khadiranaikar, R. B. and Awati, M. M., “Concrete Stress Distribution Factors for High-Performance Concrete,” Journal of Structural Engineering, Vol. 138, No. 3, 2012, pp. 402-415.
15) Mertol, H. C.; Rizkalla, S.; Zia, P.; and Mirmiran, A., “Characteristics of Compressive Stress Distribution in High-Strength Concrete,” ACI Structural Journal, Vol. 105, No. 5, 2008, pp. 626-633.
16) Ozbakkaloglu, T. and Saatcioglu, M., “Rectangular Stress Block for High-Strength Concrete,” ACI Structural Journal, Vol. 101, No. 4, 2004, pp. 475-483.
17) ACI Committee 318, “Building Code Requirements for Structural Concrete (ACI 318-63) and Commentary,” American Concrete Institute, Detroit, Michigan, 1963, 144 pp.
18) Lepage, A.; Tavallali, H.; Pujol, S.; and Rautenberg, J., “Towards Earthquake-Resistant Concrete Structures with Ultra High-Strength Steel Reinforcement,” The 14th World Conference on Earthquake Engineering, Beijing, China, 2008, 8 pp.
19) Mast, R. F.; Dawood, M.; Rizkalla, S. H.; and Zia, P., “Flexural Strength Design of Concrete Beams Reinforced with High Strength Steel Bars,” ACI Structural Journal, V. 105, No. 5, 2008, pp. 570-577.
20) NIST GCR 14-917-30, “Use of High-Strength Reinforcement in Earthquake-Resistant Concrete Structures,” NEHRP Consultant Joint Venture, California, 2014, 231 pp.
21) Shahrooz, B. M.; Miller, R. A.; Harries, K. A.; and Russell, H. G., “Design of Concrete Structures Using High-Strength Steel Reinforcement,” NCHRP Report 679, Transportation Research Board, Washington D. C., 2011, 72 pp.
22) Cheng, M-Y and Giduquio, M. B., “Cyclic Behavior of Reinforced Concrete Flexural Members Using High-Strength Flexural Reinforcement,” ACI Structural Journal, V.111, No.4, 2014, pp. 893-902.
23) Aoyama, H., “Design of Modern High-rise Reinforced Concrete Structures”, Series of Innovation in Structures and Construction, Imperial College Press, London, Vol. 3, 2001, 460 pp.
24) ASTM A1035, “Standard Specification for Deformed and Plain, Low-Carbon, Chromium, Steel Bars for Concrete Reinforcement,” ASTM International, West Conshohocken, Pennsylvania, 2007, 5 pp.
25) ICC-ES, “Acceptance Criteria for Threaded High-Strength Steel Bars for Concrete Reinforcement (AC 237),” ICC Evaluation Report, ICC Evaluation Service, LLC., Brea, California, 2009, 6 pp.

= ratio between the stress of the
rectangular block and the maximum
stress
= factor relating depth of equivalent
rectangular compressive stress block to
neutral axis depth
Fig. 1 – Equivalent Stress Block Based on ACI Building Code3
𝑓𝑐′ = 4 – 20 ksi (28 – 138 MPa)
Fig. 2 – Cross Section for Analysis (1 in. = 25.4 mm)
= ratio of average stress in rectangular compression
block to the specified concrete strength
= factor relating depth of equivalent rectangular
compressive stress block to neutral axis depth
f c'
Equivalent
Stress Block
c c
f c'
Neutral Axis
Beam Section Stress Distribution
f s
22"
25"
16"
28"
6#10
f c' = 4 to 20 ksi (28 to 138 ksi)
(a) Stress Block Models in Committee Reports and Building Codes
(b) Stress Block Models Proposed by Researchers
Fig. 3 – Computed Moment Ratios

(a) Stress Block Models in Committee Reports and Building Codes
(b) Stress Block Models Proposed by Researchers
Fig. 4 – Computed Curvature Ratios
(a) Specimens Tested by Cheng and Giduquio22 (Note : 1 in. = 25.4 mm)
(b) Specimens Tested by Tavallali et al.1 (1 in. = 25.4 mm)
Fig. 5 – Beam Cross-Sections
10"
16"
No.3@2" ( 10 mm)GR. 60
4No.7 ( 22 mm)GR. 60
4No.7 ( 22 mm)GR. 60
No.3@2" ( 10 mm)GR. 60
16"
4No.6 ( 18 mm)GR. 97
CC4-X UC4-X
10"
4No.6 ( 18 mm)GR. 97
24"
10"
2No.7 ( 22 mm)GR. 60
1No.5 ( 16 mm)GR. 60
3No.5 ( 16 mm)SD685
3No.5 ( 16 mm)A1035
No.3@5" ( 10 mm)GR. 60
SP 1
10"
SP 2
10"
SP 3
concrete cover = 1.6" concrete cover = 1.6" concrete cover = 1.6"
concrete cover = 1.2" concrete cover = 1.2"
24"
24"No.3@5" ( 10 mm)
GR. 60No.3@5" ( 10 mm)
GR. 60
1No.5 ( 16 mm)GR. 60
2No.7 ( 22 mm)GR. 60
3No.5 ( 16 mm)SD685
3No.5 ( 16 mm)A1035
10"
16"
No.3@2" ( 10 mm)GR. 60
4No.7 ( 22 mm)GR. 60
4No.7 ( 22 mm)GR. 60
No.3@2" ( 10 mm)GR. 60
16"
4No.6 ( 18 mm)GR. 97
CC4-X UC4-X
10"
4No.6 ( 18 mm)GR. 97
concrete cover = 1.2" concrete cover = 1.2"
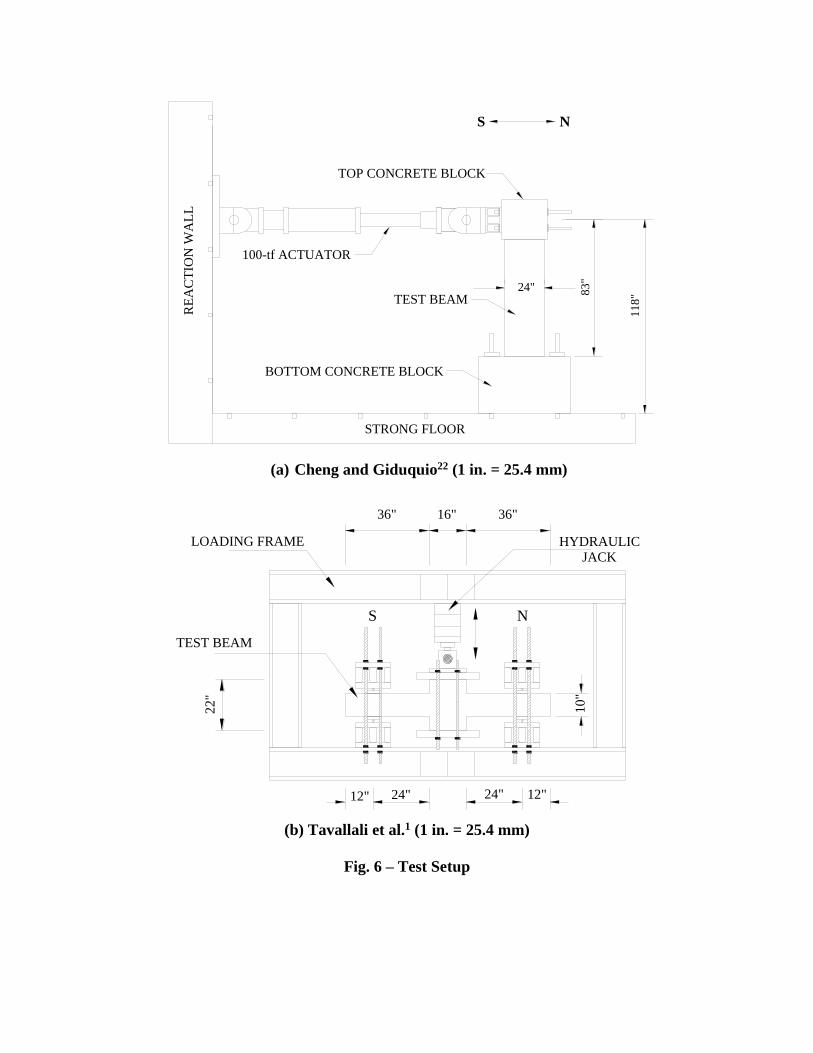
(a) Cheng and Giduquio22 (1 in. = 25.4 mm)
(b) Tavallali et al.1 (1 in. = 25.4 mm)
Fig. 6 – Test Setup
N
83"
118"
24"
100-tf ACTUATOR
BOTTOM CONCRETE BLOCK
TEST BEAM
TOP CONCRETE BLOCKR
EA
CT
ION
WA
LL
S
STRONG FLOOR
16"36" 36"
LOADING FRAME
TEST BEAM
HYDRAULICJACK
22"
24" 12"
S N
10"
12" 24"
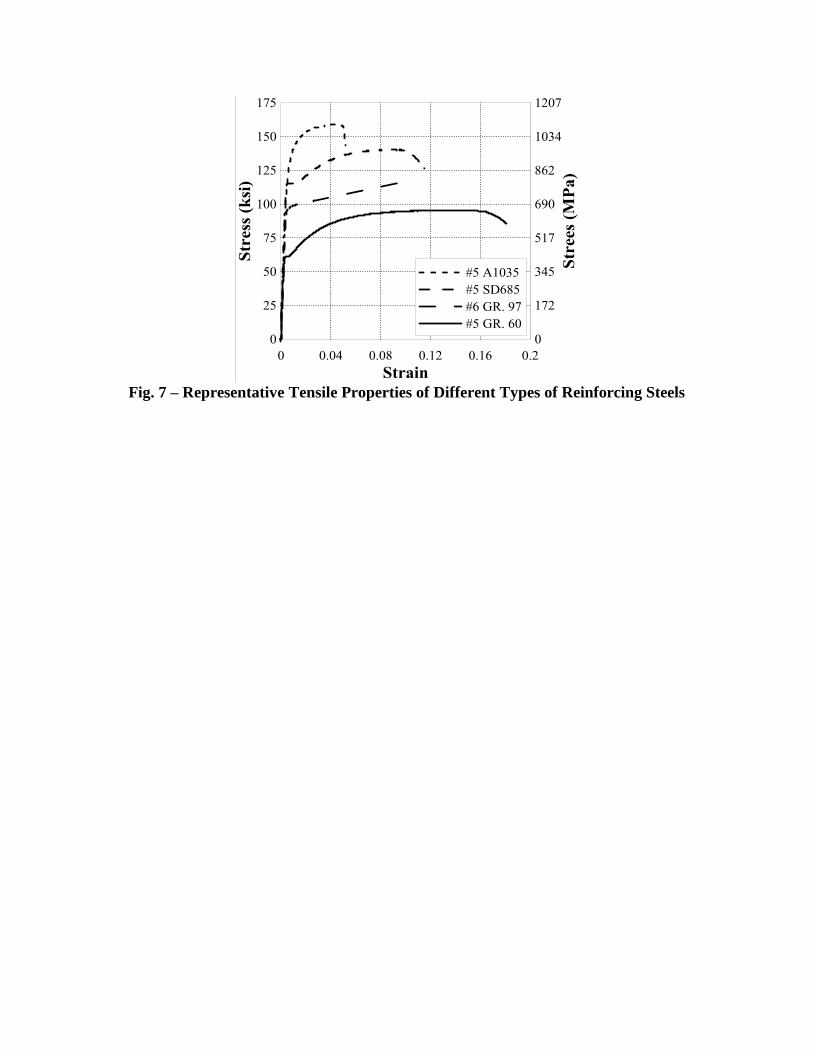
Fig. 7 – Representative Tensile Properties of Different Types of Reinforcing Steels
(a) SP1
(b) SP2 (c) SP3
(d) CC4-X North (e) UC4-X South
Fig. 8 – Measured Response for Specimens with Normal and High-Strength Steel
SP 1 SP 2 SP 3
(a) Group 1 (Cheng and Giduquio22)
CC4-X UC4-X
(b) Group 2 (Tavallali et al.1)
Fig. 9 – Strain Gauge Readings for Normal and High-Strength Steel
Fig. 10 – Measured Stiffness of Test Specimens
Chord Rotation (%) Chord Rotation (%)
1
Table 1 – Summary of Stress Block Models from Committee Reports and Building Codes
Model 𝑓𝑐′ (1) (ksi)
α1(2)
(𝑓𝑐′ in ksi)
β1
(3)
(𝑓𝑐′ in ksi)
εcu(4)
ACI3 All 0.85 0.85, 𝑓𝑐
′ ≤ 4 ksi
0.85-0.05 (𝑓𝑐′-4) ≥ 0.65
0.0030
ACI ITG-44 All 0.85, 𝑓𝑐
′ ≤ 8 ksi
0.85-0.015 (𝑓𝑐′-8) ≥ 0.70
0.85, 𝑓𝑐′ ≤ 4 ksi
0.85-0.05 (𝑓𝑐′-4) ≥ 0.65
0.0030
CSA7 3-12 0.85-0.01𝑓𝑐′≥ 0.67 0.97-0.0172𝑓𝑐
′ ≥ 0.67 0.0035
Eurocode8 𝑓𝑐′ ≤ 13.05
1.00, 𝑓𝑐′ ≤ 7.25 ksi
1.00- (𝑓𝑐′-7.25)/29 ≥ 0.80
0.8, 𝑓𝑐′ ≤ 7.25 ksi
0.8- (𝑓𝑐′-7.25)/58 ≥ 0.70
0.0035, 𝑓𝑐′ ≤ 7.25 ksi
0.0026+0.035 [13.0 − 𝑓𝑐
′
14.5]
4
JSCE9 𝑓𝑐′ ≤ 11.6 1-0.0207𝑓𝑐
′ ≤ 0.85 0.76 − 11.6εcu [22.5-𝑓𝑐
′
4350]
0.0025 ≤ εcu ≤ 0.0035
NZS10 All 0.85, 𝑓𝑐
′ ≤ 8 ksi
0.85-0.0267 (𝑓𝑐′-8) ≥ 0.75
0.85, 𝑓𝑐′ ≤ 4.35 ksi
0.85-0.0534 (𝑓𝑐′-4.35) ≥ 0.65
0.003
(1) 𝑓𝑐′ = specified compressive strength of concrete
(2) α1 = ratio between the stress of the rectangular block and the maximum stress
(3) β1 = factor relating depth of equivalent rectangular compressive stress block to neutral axis depth (4) εcu = maximum usable strain at extreme concrete compression fiber
Table 2 – Summary of Stress Block Models from Researchers
Model 𝑓𝑐′(ksi)
α1
(𝑓𝑐′ in ksi)
β1
(𝑓𝑐′ in ksi)
εcu
Azizinamini
et al.11 𝑓𝑐
′ ≤ 15* 0.85, 𝑓𝑐
′≤ 10 ksi
0.85-0.05 (𝑓𝑐′-10) ≥ 0.60
0.85, 𝑓𝑐′≤ 4 ksi
0.85-0.05 (𝑓𝑐′- 4) ≥ 0.65
0.0030
Bae and Bayrak12 𝑓𝑐′ ≤ 20*
0.85, 𝑓𝑐′≤ 10 ksi
0.85-0.0276 (𝑓𝑐′-10) ≥ 0.67
0.85, 𝑓𝑐′≤ 4.4 ksi
0.85-0.0276 (𝑓𝑐′- 4.4) ≥ 0.67
0.0030, 𝑓𝑐′≤ 8ksi
0.0025, 𝑓𝑐′> 8ksi
Ibrahim and
MacGregor13 𝑓𝑐
′ ≤ 20* 0.85-0.0086𝑓𝑐′ ≥ 0.725 0.95-0.0172𝑓𝑐
′ ≥ 0.70 0.0030
Khadiranaikar and
Awati14 𝑓𝑐
′ ≤ 17.4 0.85, 𝑓𝑐
′ ≤ 2.9 ksi
0.85-0.0069 (𝑓𝑐′- 2.9) ≥ 0.75
0.85, 𝑓𝑐′≤ 2.9 ksi
0.85-0.0138 (𝑓𝑐′- 2.9) ≥ 0.67
0.0030
Mertol et al.15 𝑓𝑐′ ≤ 18
0.85, 𝑓𝑐′≤ 10 ksi
0.85-0.02 (𝑓𝑐′-10) ≥ 0.75
0.85, 𝑓𝑐′≤ 4 ksi
0.85-0.05 (𝑓𝑐′- 4) ≥ 0.65
0.0030
Ozbakkaloglu and
Saatcioglu16 𝑓𝑐
′ ≤ 19 0.85, 𝑓𝑐
′≤ 4 ksi
0.85-0.01 (𝑓𝑐′- 4) ≥ 0.72
0.85, 𝑓𝑐′≤ 4 ksi
0.85-0.013 (𝑓𝑐′- 4) ≥ 0.67
0.0030
*Limits are based on the collected database
Note: for notation, see footnotes in Table 1.

2
Table 3 – Required Tensile-Test Properties of High-Strength Steel
Bar Type Bar Size Min. 𝜀𝑠ℎ
(1)
(%)
Min. 𝜀𝑠𝑢(2)
(%)
Min. fy
(3)
ksi
(MPa)
Min. fu
(4)
ksi
(MPa)
SD68523 All Size 1.4 10 99 to 110
(685 to 755) >1.25 f
y
SD78523 Less than No. 4 NA 8 114
(785)
135
(930)
Grade 100
A103524
No. 3 to
No. 11 NA 7 100(3)
(690)
150
(1030) No. 14, No. 18 6
Grade 9725 Less than No. 6 NA 9 97
(670)
116
(800)
(1) 𝜀𝑠ℎ= strain at onset of strain hardening
(2) 𝜀𝑠𝑢= total fracture elongation, measured within an 8-in. (203 mm) gauge length
(3) fy= yield strength determined using the 0.2%-offset method.
(4) fu= tensile strength
Table 4 – Summary of Longitudinal Reinforcement Properties
Bar Type Bar Size fy, test (1), ksi (MPa) fu, test, ksi (MPa)
εsu, test(2)
(%)
fu, test /
fy, test Esh
(3), ksi (MPa)
Grade 60
SP1 No. 5 61 (420) 95 (654) 18 1.56 265 (1830)
Grade 60
SP1 No. 7 70 (482) 99 (682) 19 1.41 203 (1400)
SD685
SP2 No. 5 115 (792) 140 (965) 12 1.23 320 (2210)
A1035
SP3 No. 5 127 (875) 159 (1096) 6 1.26 804 (5540)
Grade 60
CC4-X No. 7 65 (448) 98 (675) 16 1.51 212 (1460)
Grade 97
UC4-X No. 6(4) 97 (668) 117 (806) 10 1.21 193 (1330)
For notation see Table 3
(1) Determined using 0.2% offset method.
(2) Measured within an 8-in. (203 mm) gauge length.
(3) The secant modulus between the point where yielding initiates and the point at peak on the steel stress-strain
curve.
(4) Actual bar diameter is 0.71 in. (18 mm).

3
Table 5 – Summary of Test Results
Specimen SP1 SP2 SP3 CC4-X UC4-X
𝑓𝑐′
ksi (MPa) 5.4(37) 5.4(37) 5.5(38) 6.0(41) 6.2(43)
Drift du (1)
(%) 4.7 4.0 4.0 5.2 5.0
Mpeak (2)
kip-ft (kN-m) 204(276) 205(277) 240(324) 103(139) 103(139)
Vpeak
bd√𝑓𝑐′
(3)
psi (MPa)
1.93(0.16) 1.93(0.16) 2.25(0.19) 5.20(0.43) 5.10(0.42)
Mn,e (4)
kip-ft (kN-m) 173(235) 177(239) 195(264) 91(123) 89(120)
Mpeak
M𝑛,𝑒
1.18 1.16 1.23 1.13 1.16
εt(5) 0.0217 0.0206 0.0191 0.0078 0.0079
(1) du= the average maximum chord rotation in each loading direction prior to a 20% decrease in strength.
(2) Mpeak= the average peak flexural strength in each loading direction.
(3) Vpeak= the average peak shear strength in each loading direction; b= width of test specimens and d= effective
depth of test specimens.
(4) Mn,e= the expected flexural strength evaluated using equivalent concrete stress block based on current code3 and
bilinear steel stress-strain curve using fy with tested material properties.
(5) εt= tensile longitudinal strain associated with Mn,e.