development and evaluation of an online transcranial ... · abstract development and evaluation of...
TRANSCRIPT

Development and evaluation of an online Transcranial Doppler Ultrasonographic brain-
computer interface for communication
by
Jie Lu
A thesis submitted in conformity with the requirements for the degree of Master of Applied Science
Institute of Biomaterials and Biomedical Engineering University of Toronto
© Copyright by Jie Lu 2013
Abstract
Development and evaluation of an online transcranial Doppler ultrasonographic brain-computer interface for communication
Jie Lu
Master of Applied Science
Graduate Department of Institute of Biomaterials and Biomedical Engineering
University of Toronto
2013
We investigated an emerging brain-computer interface (BCI) modality, namely,
transcranial Doppler ultrasonography (TCD), which measures cerebral blood flow
velocity.
We hypothesized that a bilateral TCD-driven online BCI would be able to
dichotomously classify a user’s intentions with at least 70% accuracy. To test this
hypothesis, we had three objectives: (1) to develop a signal classifier that yielded high
(>80%) offline accuracies; (2) to develop an online TCD-BCI system with an onscreen
keyboard; and, (3) to determine the achievable online accuracy with able-bodied
participants.
ii
With a weighted, forward feature selection and a Naïve Bayes classifier, sensitivity and
specificity of 81.44 ± 8.35% and 82.30 ± 7.39%, respectively, were achieved in the

online differentiation of two mental tasks. The average information transfer rate and
throughput of the system were 0.87 bits/min and 0.35 ± 0.18 characters/min,
respectively. These promising online results encourage future testing of TCD-BCI
systems with the target population.
iii

Acknowledgments
First off, I would like to thank my wonderful and supportive parents, Yanping Lu and
Aixue Jia, without whom I would not be where I am today. Also, great love goes to my
younger sister, Luna Lu, who brings joy into my world.
I would like to thank Dr. Tom Chau for his brilliant guidance and supervision along the
way. His passion and energy has truly been inspirational. Many thanks to my committee
members, Dr. Michelle Keightley and Dr. Elaine Biddiss, and external examiner, Dr.
Anne-Marie Guerguerian for their suggestions and comments.
Special thanks to Colleen Smith, Andrew Myrden, Larissa Schudlo, Dr. Saba Moghimi,
Dr. Young Don Ko, and Dr. Khondaker Mamun for all of their kind help and wonderful
company. I would also like to thank all members of the PRISM lab at Bloorview
Research Institute for their support.
Finally, I would like to acknowledge the financial support of donors of the Kimel Family
Graduate Student Scholarship in Paediatric Rehabilitation, Holland Bloorview Kids
Rehabilitation Hospital, donors of the James F. Crothers Family Fellowships in
Peripheral Nerve Damage, and the Institute of Biomaterials and Biomedical Engineering
at the University of Toronto.
iv

Table of Contents
Abstract ................................................................................................................................ i
Acknowledgments.............................................................................................................. iii
Table of Contents ............................................................................................................... iv
List of Figures .................................................................................................................... ix
List of Tables .................................................................................................................... xii
List of Appendices ........................................................................................................... xiii
Chapter 1. Introduction ....................................................................................................... 1
1.1 Motivation ................................................................................................................. 1
1.2 Research Question and Objectives............................................................................ 2
1.3 Overview ................................................................................................................... 2
Chapter 2. Background ....................................................................................................... 4
2.1 Brain-Computer Interfaces ................................................................................... 4
2.2 Existing BCI Modalities ....................................................................................... 5
2.2.1 Intra-cortical BCIs ........................................................................................ 5
2.2.2 Cortical BCIs ............................................................................................... 5
2.2.3 Non-invasive BCIs ........................................................................................ 5
2.3 Transcranial Doppler Sonography ....................................................................... 6
v

2.3.1 Measuring Blood Flow Velocities ................................................................ 8
2.3.2 Hemodynamic Lateralization ........................................................................ 8
2.3.3 TCD-BCI Applications ................................................................................. 9
2.3.4 Ultrasound Probe Configuration ................................................................... 9
2.4 Communication Systems .................................................................................... 10
2.4.1 Existing Virtual Keyboards ......................................................................... 10
2.4.2 Dynamic Keyboard ..................................................................................... 10
2.5 Mental Tasks ...................................................................................................... 12
Chapter 3. Signal Processing and Classification Techniques to Optimize Transcranial
Doppler Ultrasonography Performance ............................................................................ 14
3.1 Abstract .............................................................................................................. 14
3.2 Introduction ........................................................................................................ 15
3.3 Materials and Methods ....................................................................................... 17
3.3.1 Participants .................................................................................................. 17
3.3.2 Instrumentation ........................................................................................... 17
3.3.3 Mental Tasks ............................................................................................... 18
3.3.4 Experimental Protocol ................................................................................ 19
3.3.5 Pre-processing & Feature Extraction .......................................................... 20
3.3.6 Feature Selection ......................................................................................... 21
3.3.7 Classification .................................................................................................. 23
vi

3.4 Results ................................................................................................................ 24
3.4.1 Linear Discriminant Analysis ..................................................................... 24
3.4.2 Naïve Bayes ................................................................................................ 25
3.4.3 Features ....................................................................................................... 27
3.5 Discussion .......................................................................................................... 28
3.5.1 Classification of Word Repetition .............................................................. 28
3.5.2 Feature Selection ......................................................................................... 29
3.5.3 Classifier ..................................................................................................... 30
3.6 Conclusion .......................................................................................................... 30
Chapter 4. Online Transcranial Doppler Ultrasonographic Control of an Onscreen
Keyboard ........................................................................................................................... 31
4.1. Introduction ........................................................................................................ 32
4.2. Methods .............................................................................................................. 34
4.2.1. Participants .................................................................................................. 34
4.2.2. Instrumentation ........................................................................................... 34
4.2.3. Mental tasks ................................................................................................ 35
4.2.4. Dynamic Keyboard ..................................................................................... 36
4.2.5. Experimental Protocol ................................................................................ 38
4.2.6. Data Processing and Classification ............................................................. 40
4.2.7. Performance evaluation .............................................................................. 41
vii

4.3. Results ................................................................................................................ 44
4.3.1. Feature Selection ......................................................................................... 44
4.3.2. Inter-participant analysis ............................................................................. 45
4.3.3 Inter-session Results ................................................................................... 45
4.3.4 Dynamic Keyboard Output & User Feedback ............................................ 47
4.3.5 User Feedback ............................................................................................. 49
4.4. Discussion .......................................................................................................... 50
4.4.1 Throughput of the Online TCD-based BCI Communication System ......... 50
4.4.2 Feature Selection ......................................................................................... 50
4.4.3 Classification of Word Repetition .............................................................. 51
4.4.4 Performance ................................................................................................ 51
4.4.5 User Feedback Questionnaire ..................................................................... 52
4.4.6 Limitations .................................................................................................. 53
4.5. Conclusion .......................................................................................................... 54
Chapter 5. Conclusions ..................................................................................................... 55
5.1 Contributions ...................................................................................................... 55
5.2 Future Work ....................................................................................................... 56
5.2.1 Evaluate User-Interface effects ................................................................... 56
5.2.2 Evaluating the Effects of Practice on Performance .................................... 57
viii

5.2.3 Testing in More Practical Situations ........................................................... 57
5.2.4 Moving Towards the Target Population ..................................................... 57
References ......................................................................................................................... 58
Appendix ........................................................................................................................... 69
Appendix I: Criteria Questionnaire ............................................................................... 69
Appendix II: Survey Template ...................................................................................... 70
Appendix III: Post Study Questionnaire ....................................................................... 72
ix

List of Figures
Figure 2.1. Application of BCI system [15] ................................................................ 4
Figure 2.2. Lateral view of transtemporal insonation window [24] ................................ 8
Figure 2.3. Axial view of the ultrasound probe directed toward the MCA [36] ............... 8
Figure 2.4. Dynamic keyboard user interface ............................................................ 11
Figure 2.5. An example of dynamic keyboard slide progression ................................. 11
Figure 3.1. Lateral and axial view of the ultrasound probe set at the transtemporal
insonation window, directed toward the MCA [24,36] ............................................... 18
Figure 3.2. TCD dynamic feedback signal showing mean CBFV (averaged over every 1.3
seconds with CBFV sampling rate of 100Hz) in white ............................................... 19
Figure 3.3. Sample training block cues for the activation mental task (left) and the rest
mental task (right), respectively .............................................................................. 19
Figure 3.4. Schematic diagram of a data collection block. The block began with a 1-
minute baseline period, followed by 40 randomized task segments. During each task
segment, the screen randomly displayed either an hourglass or a letter. If a letter was
presented, the participant must perform the activation mental task for the duration of 15
seconds, followed by a 10 second rest task which was cued by an hourglass. If an
hourglass was displayed, the participant continued the rest task. ................................. 20
Figure 3.5. 10-fold cross-validation accuracy for Linear Discriminant Analysis classifier
with Fisher criterion, ISF-SFS, and ISF-WSFS feature selection methods. ................... 25
x

Figure 3.6. 10-fold cross-validation accuracy for Naïve Bayes classifier with Fisher
criterion, ISF-SFS, and ISF-WSFS feature selection methods ..................................... 26
Figure 3.7. Fisher criterion Linear Discriminant Analysis (baseline method) accuracy
versus WSFS Naïve Bayes (optimal method) accuracy. ............................................. 27
Figure 3.8. Average number of features selected by each feature selection and
classification method ............................................................................................. 29
Figure 3.9. Average accuracy from each feature selection and classification method ..... 29
Figure 4.1. Lateral and axial view of the ultrasound probe set at the transtemporal
insonation window, directed toward the MCA [24,36] ............................................... 35
Figure 4.2. TCD dynamic feedback signal showing mean CBFV (averaged over every 1.3
seconds with CBFV sampling rate of 100Hz) in white ............................................... 36
Figure 4.3. Dynamic Keyboard User-interface .......................................................... 37
Figure 4.4. An example of dynamic keyboard progression ......................................... 38
Figure 4.5. Schematic diagram of the training block. The training block began with a 1-
minute baseline period, followed by 40 randomized task segments. During each task
segment, the screen randomly displayed either an hourglass or a letter. If a letter was
presented, the participant must perform the activation mental task for the duration of 15
seconds, followed by a 10 second rest task which was cued by an hourglass. If an
hourglass was displayed, the participant continued the rest task. ................................. 39
Figure 4.6. Sample recording depicting the three most common features: (1) difference
between left and right mean velocities, µL – µR, at 10-15 seconds; (2) difference between
left and right mean velocities, µL – µR, at 5-10 seconds, and, (3) slope of the right MCA
CBFV (mR) at 5-10 seconds. Data shown are normalized and smoothed and represent one
trial performed by participant 10. The left graph depicts a rest trial while the right graph
xi

portrays an activation trial, showing the difference between left and right mean CBFV at
10 – 15 seconds and at 5-10 seconds. ....................................................................... 40
Figure 4.7. Normalized frequency of features (the number of times a feature has been
selected divided by the total number of times all feature have been selected) across all
participants ........................................................................................................... 45
Figure 4.8. Average throughput in characters/minute for sessions I, II, and III for all
participants. .......................................................................................................... 47
Figure 4.9. Edit distances for test blocks from Sessions I (left plot), II (middle plot) and
III (right plot). The horizontal line on each graph indicates an edit distance of 18 where
no input was observed. ........................................................................................... 47
Figure 4.10. User feedback of sessions I, II, and III over the 10 participants. Each
column represents the question corresponding with the survey from Appendix II. Each
row represents each participant. .............................................................................. 49
xii

List of Tables
Table 3.1. Number of features selected by each feature selection method .................... 28
Table 4.1. Classification performance within individual sessions ................................ 46
Table 4.2 Sample normalized edit distance with corresponding actual and intended
outputs ................................................................................................................. 48
xiii

List of Appendices
Appendix I: Criteria Questionnaire ............................................................................... 68
Appendix II: Survey Template ...................................................................................... 69
Appendix III: Post Study Questionnaire ....................................................................... 71
xiv

Chapter 1
Introduction
1.1 Motivation
Individuals who have lost the ability to speak or hear may rely on voluntary physical
movements to communicate. However, for those who additionally have severe physical
impairments, communication becomes extremely difficult. For such persons,
communication and engagement with those around them can become the primary
determinant of a meaningful quality of life [1]. Numerous types of communication
devices have been developed. Some examples include: eye trackers, which locate the
position of an individual’s eye; automatic speech recognition systems, which transcribe
spoken language into readable text; motion recognition and gesture systems, which track
body movements; and brain-computer interfaces (BCIs), which use physiological signals
from the brain to determine user intent [2]. Of these assistive devices, only BCIs require
no muscular activity from the user and thus appear to be particularly suited to individuals
with the most severe impairments [3].
To date, many non-invasive BCI communication systems have been developed. These
BCIs have traditionally used measurement modalities such as electroencephalography
(EEG), magnetoencephalography (MEG), or functional magnetic resonance imaging
(fMRI) to detect cognitive activity associated with user intent [4,5,6,7]. MEG and MRI
systems involve sophisticated equipment that requires specialized personnel, building
infrastructure and exorbitant cost. While EEG is widely used, clinical evidence of
effectiveness is scant, particularly in pediatrics [8]. These limitations have precluded
widespread clinical adoption of these modalities as access solutions [9].
1

In light of these shortcomings, we considered a recently introduced, non-invasive BCI
modality ― transcranial Doppler ultrasonography (TCD). TCD is a medical imaging
technique used to monitor cerebral blood flow velocity (CBFV) within the anterior,
middle, or posterior cerebral arteries (ACA, MCA or PCA respectively) [10]. TCD is
portable and affordable, and generally robust to electrical and magnetic noise [11]. In
addition, several offline TCD-BCI studies over the past three years have demonstrated
the decoding of selected mental tasks with accuracies often in excess of 80% [11,12,13].
1.2 Research Question and Objectives
This thesis addressed the following question: What level of performance (accuracy and
throughput) can be achieved by a TCD-controlled on-screen keyboard with able-bodied
participants? Based on recently published offline evidence, we hypothesized that an
online TCD-BCI will be capable of detecting a user’s intention with at least 70% average
specificity and sensitivity.
The objectives of this thesis were three fold, namely:
1. To determine a signal processing algorithm and classifier that would yield >80%
accuracy offline when discriminating between an intuitive mental task (i.e., repetitive
spelling and imagined writing of a target word) and a rest task (i.e., visual tracking of
a signal on screen).
2. To develop an online BCI system by using TCD to control an on-screen keyboard.
3. To determine the achievable accuracy and throughput of the online BCI system for
able-bodied participants.
1.3 Overview
This thesis includes five chapters, including this introductory chapter. Chapter 2 provides
background information on existing BCI modalities, TCD, and communication systems.
2

Chapter 3 details the evaluation of different signal processing and classification
techniques for bilateral TCD signal classification. Chapter 4 is a manuscript that focuses
on the online testing of the TCD-BCI communication system. Finally, Chapter 5
summarizes the contributions of this thesis and proposes possible future work.
3

Chapter 2
Background
2.1 Brain-Computer Interfaces
For individuals who are cognitively aware but lacking an effective modality to convey
intent, informing caregivers of personal needs can be an insurmountable challenge [14].
An access solution aims to address this challenge, and typically consists of an access
technology paired with a user interface to translate some manifestation of intent (e.g.,
behavioral or physiological) into a functional activity, as depicted in Figure 2.1. A brain-
computer interface is a particular type of access technology in which the access pathway
is some brain imaging modality that provides physiological data relating from which we
can infer changes in cognitive activity [3].
Figure 2.1. Application of BCI system [15]
4

2.2 Existing BCI Modalities
BCI modalities acquire specific physiological signals from the brain. These signals are
then processed to produce control signals for computers or other devices. BCI modalities
can be divided into two categories ― invasive and non-invasive modalities [9]. Invasive
modalities can be further separated into intra-cortical and cortical BCIs depending on the
location of electrodes [15]. Our study will focus on non-invasive BCIs.
2.2.1 Intra-cortical BCIs
Intra-cortical BCIs use signals that are recorded using electrodes directly implanted into
the grey matter of the brain during neurosurgery. These signals include single neuron
spike trains and extracellular local field potentials [9]. Because of their close contact with
the brain tissue, invasive BCIs can produce the fastest and most reliable signals of all BCI
devices [9]. However, implants can be high risk as they can cause brain tissue damage
and the surgery itself can lead to infections [16]. In addition, the nature and significance
of the long-term effects of implanted BCIs remain unclear and has yet to be rigorously
tested and configured for clinical use [17].
2.2.2 Cortical BCIs
As the term suggests, cortical BCIs still require a craniotomy but electrodes are placed on
the surface of the brain rather than inside the brain. Compared to intra-cortical implants,
this approach reduces the risk of infection and the formation of scar tissue [18]. Since the
electrodes are not placed within the brain tissue, the signal strength and recognition are
weaker than that of invasive BCIs [19].
2.2.3 Non-invasive BCIs
Non-invasive BCIs rely on neuroimaging technologies that record signals from outside of
the brain. Some technologies include EEG, MEG, fMRI, and near-infrared spectroscopy
(NIRS). However, these modalities all have limitations that hinder their practical
5

implementation. EEG, for example, is the most commonly used BCI modality [20]. It
uses the electrical activity of neurons to derive a control signal. However, EEG signals
are easily contaminated by electrical and physiological artifacts such as
electromyographic (EMG) activity from cranial muscles or electroculographic (EOG)
activity that accompanies eye movement [15]. In addition, some EEG-BCIs also require
extensive training [20]. MEG and fMRI on the other hand, measure magnetic fields
induced by dendritic currents [21] and blood oxygen level-dependent signals [22],
respectively. They both require extremely expensive instrumentation that are bulky and
immovable [3]. In addition, these approaches require highly controlled environments that
preclude integration in activities of daily living. NIRS is another BCI modality which
harnesses changes in cerebral blood oxygenation levels to derive a control signal [23].
Similar to TCD, NIRS is a hemodynamic BCI and is still very early in its developmental
stage as a BCI modality. However, NIRS is sensitive to ambient lighting and thus its use
is often restricted to illumination-controlled environments. TCD has been proposed as a
potential new BCI modality due to its desirable properties such as portability and
insensitivity towards environmental noise (electrical, magnetic and optical) [11,12,13].
2.3 Transcranial Doppler Sonography
TCD was first developed in 1982 and has traditionally been used for clinical applications
such as screening for sickle cell disease, detection of stenosis and occlusion, and
detection of cerebral microemboli [24,25,26,27,28,29]. TCD works by emitting
ultrasound waves towards a specific blood vessel and detecting the waves that are
reflected by moving red blood cells within that vessel [24]. The difference between the
emitted ultrasound wave frequency and the apparent frequency of the echoes can be used
to calculate the speed of blood flow. The direction of blood flow can also be identified as
well. If the echo frequency is higher than emitted frequency, blood is flowing towards the
TCD probe. Conversely, a lower echo frequency indicates that the blood is flowing away
from the TCD probe. Because TCD can be used to measure real-time changes in CBFV,
functional TCD (fTCD) has been used to examine cerebral lateralization induced by
various mental tasks and cognitive activities [30,31,32,33,34]. From this point on within
6

this thesis, the acronym TCD will be used to mean fTCD. Over the past few years, TCD
has been examined as a BCI modality through a variety of offline studies. In 2011, the
inaugral TCD-BCI study conducted by Myrden, Kushki, Guerguerian & Chau used
verbal fluency and spatial rotation tasks, activation durations of 45 seconds and simple
classifiers to discriminate activity from unconstrained rest with 82.9±10.5% accuracy
[11]. The authors subsequently extended classification to 3 classes, achieving greater than
70% accuracy and transmission rates up to 1.2 bits/minute [35]. Aleem & Chau (2013)
were able to reduce the task period to 18 seconds while for the first time distinguishing
between left and right CBFV lateralizations within a string of successive activations,
managing accuracies of 74.6 ±12.6% [12]. Most recently, Faress & Chau (2013) reported
an average accuracy of 76.1 ± 9.9% across participants in the automatic differentiation
between pre- and post-verbal fluency elicited hemodynamic profiles [13].
Like other BCI modalities, TCD does have its limitations. For example, TCD's spatial
resolution is limited because it only targets the main cerebral arteries (within the Circle of
Willis). Skill and patience are often needed to properly position TCD probes. Similar to
all metabolic BCIs, TCD requires a longer signal acquisition time than EEG and MEG
due to the hemodynamic delay, i.e., the neurovascular time lag between neuronal firing
accompanying the mental task and consequent CBFV changes. In addition, extensive
physical movements may induce similar hemodynamic responses, leading to false
detections. However, these spurious responses can usually be controlled by keeping the
individual still.
In our study, we used a TCD instrument with two probes, one positioned on each side of
the subject's skull. The precise position of each probe will depend on the location of the
individual's transtemporal insonation window (Figure 2.2), a relatively thin area on
eachlateral side of the skull. These windows provide a clear view of the ACA, MCA and
PCA on each side of the brain. Of these arteries, we focussed on the MCAs, as they
supply areas of the brain that are implicated in the mental activities of interest (e.g.,
spelling and motor imagery). Figure 2.3 demonstrates the orientation of the probe as it
7

measures CBFV within the left MCA. Together, the two probes can simultaneously
monitor cerebral blood flow velocity in both the left and right MCAs.
Figure 2.2. Lateral view of transtemporal insonation window [24]
Figure 2.3. Axial view of the ultrasound probe directed toward the MCA [36]
2.3.1 Measuring Blood Flow Velocities
ACA, MCA and PCA, along with many other arteries, can typically be measured through
the transtemporal window [37]. The majority of the brain is perfused either directly or
indirectly by the above three arteries, where each artery is usually responsible for
supplying a specific part of the brain [38]. Therefore, these arteries are commonly imaged
for the purpose of psychological and neuroscience research that aims to identify
metabolically active regions associated with specific mental tasks [39]. The change of
CBFV as a result of mental activity is known as neurovascular coupling. When a mental
task is performed, the neural activity increases, leading to an increased regional demand
in glucose and oxygen supply. In addition, the increased neural activity affects the local
astrocytes to signal for vasodilation, which causes an increase in CBFV as well [40].
2.3.2 Hemodynamic Lateralization
Certain mental and physical tasks tend to activate specific brain regions in most
individuals. The regional activation may not always be symmetrical between left and
right sides of the brain, resulting in hemispheric lateralization [31]. If the active region is
Transtemporal
Window Middle Cerebral
Artery
TCD Probe
8

perfused by the MCA, ACA, or PCA, the CBFV within the responsible artery will
increase. TCD can be used to detect this change. The MCA is the largest of these arteries,
and has been implicated in a wide variety of mental tasks [39]. For example, verbal
fluency tasks (such as constructing as many words as possible starting with a specific
letter) and verbal similarity tasks (such as deciding whether a pair of words is similar or
different) usually induce left-hemispheric lateralization, i.e., CBFV increases more in the
left MCA than the right MCA. On the other hand, visuospatial tasks (such as solving 3D
puzzles) and visual matching tasks (such as visually searching for matching images)
usually induce right-hemispheric lateralization [41].
2.3.3 TCD-BCI Applications
To date, TCD has been predominantly utilized for diagnosing and monitoring cerebral
vasculature in a clinical setting. Functional TCD has also been used to observe changes in
CBFV during cognitive, sensory, and motor tasks. The success of existing studies in
depicting cognitive task-elicited CBFV changes has provided the fundamental
groundwork for the development of TCD-BCI.
To date, there have been four published papers that report the success of offline TCD-
BCI systems [11,12,13,35]. Each system improved upon the previous in terms of the
number of features used and the trial-wise data acquisition duration while maintaining the
average accuracy. However, an online TCD-BCI has yet to be reported.
2.3.4 Ultrasound Probe Configuration
Within this thesis, the TCD probes were placed on either side of the transtemporal
windows. Both probes had the same power setting (spatial peak temporal average
intensity) of 300mW/cm2, which is equivalent to a thermal cranial index (TIC) of 1.4 [42].
This setting is used to ensure signal quality while observing participant safety. The
setting is also within the limit of 720 mW/cm2 as mandated by the FDA [43]. In addition,
according to the British Medical Ultrasound Society, with TIC between 1.0 to 1.5, a
maximum of 30 minutes continuous scanning time is acceptable [44].
9

The low-pass filter cutoff frequency and the sampling volume were set at 150Hz and
11mm, respectively, as in offline TCD studies [11,12,13,35]. The gain was set at either
31, 38, or 44 times, depending on the quality of the participant’s signal.
2.4 Communication Systems
There are many categories of potential user interfaces for BCI systems as illustrated in
Figure 2.1. These user interfaces include augmentative and alternative communication
(AAC) aids, environmental control units, and computers. In this thesis, we focused on
augmentative and alternative communication, which often involves a virtual keyboard.
2.4.1 Existing Virtual Keyboards
Due to the extensive research on EEG BCI, most of the virtual keyboards developed and
examined to date have been tailored for EEG or neural input based BCI [45]. For
example, the most well-known and utilized keyboard is the P300 speller, which functions
by quickly and randomly flashing the rows and columns of a letter matrix to detect the
location of the desired letter through a time-locked event related potential. However, the
scanning of rows and columns that is inherent in the design of the P300 speller would be
very inefficient for a hemodynamic BCI. Sorger et al. proposed a communication system
for real-time fMRI-based spelling. The system utilized a combination of BOLD signal
location, signal onset delay, and signal duration to encode 27 characters [46]. However,
this encoding system would require that participants learn a non-intuitive coding scheme
for communication. To date, there is no established user interface for hemodynamic BCIs.
2.4.2 Dynamic Keyboard
In this thesis, we implemented the dynamic keyboard, an innovative communication
program developed by researchers of the CanAssist group from the University of Victoria.
Compared to other on-screen spellers such as Dasher and On-screen Keyboard, the
dynamic keyboard offers higher accuracy and speed [47]. Figure 2.4 illustrates an
example of the dynamic keyboard user interface. The software bins the letters of the
10

English alphabet according to their usage frequencies and presents different bins
sequentially.
Figure 2.4. Dynamic keyboard user interface
A bin with a new set of characters is presented every 15 seconds. Figure 2.5 gives an
example of the keyboard progression. If the bin containing the desired character is shown,
the user can choose the bin by performing the mental activation task. Otherwise, the user
can remain in the rest state. If a bin is selected, the user is presented with an undo option
to immediately undo the selection, if needed. Otherwise, the user can bypass the undo
slide and scan through individual characters within the selected bin. If a specific character
is selected, a word prediction slide is shown to increase throughput.
Figure 2.5. An example of dynamic keyboard slide progression
Selection
Selection
No Selection
No Selection
11

The typed text can be output to computer programs such as Notepad++, Microsoft Office,
or Internet Explorer.
We chose the dynamic keyboard because it minimizes the number of choices through
which a user has to scan. As a result, the dynamic keyboard can potentially increase
communication throughput (characters per minute). At the initiation of the thesis, the
available implementation of the dynamic keyboard could only be operated through a
computer mouse or a physical switch. We developed a new implementation that
simplified the visual interface (i.e., only a single bin was visible at any point in time) and
replaced the switch with a TCD-based activation so that no muscle movement would be
required.
2.5 Mental Tasks
Numerous neuroscience journals have investigated various types of mental tasks that can
elicit a lateralization in blood flow velocity. Previous offline TCD studies have utilized
these mental tasks to elicit CBFV lateralization which act as input signals for the BCI
system. Some examples include verbal fluency (thinking of as many words as one can
within a time frame that starts with a specific letter), which elicits a left-lateralization
(higher left MCA CBFV compared to that of the right side); mental rotation (mentally
completing a 3D puzzle), which elicits a right-lateralization (higher right MCA CBFV
compared to that of the left side) [39]. However, these tasks can be mentally demanding.
Verbal fluency, for example, will also require the individual to have a sufficient
vocabulary.
To simplify the activation mental, we have considered a new activation task which is
word repetition. This task required the participant to repetitively spell the intended word
while imagining writing the word throughout the task duration of 15 seconds (i.e. spelling
task with associated motor imagery). This task was chosen because it is intuitive while
having the potential to elicit a left-lateralized MCA CBFV. The motor imagery
component of the activation task has been shown to activate the primary motor and
12

sensory cortex of the contralateral side [48,49]. Thus a right-hand related motor imagery
is likely to elicit a left-sided CBFV lateralization resulting from neurovascular coupling
with the activated areas. In addition, single word viewing has also been shown to elicit
left lateralization in CBFV [50].
13

Chapter 3
Signal Processing and Classification Techniques to Optimize Transcranial Doppler Ultrasonography Performance
This chapter describes the data analysis and classification methods considered for an
online Transcranial Doppler ultrasonography - brain computer interface system. It is
written in paper format and thus may contain information that has been previously stated.
3.1 Abstract
Transcranial Doppler Ultrasonography (TC) is an emerging brain-computer interface
(BCI) modality. Several offline studies have demonstrated algorithmic differentiation
between two mental tasks with accuracies in excess of chance, but have used
computationally sophisticated features and classifiers. A preferred approach for online
implementation has not yet been identified. In this study, we conducted an offline
analysis of TCD recordings to investigate the potential for increasing accuracy in a TCD-
based BCI while adhering to features and classifiers computationally conducive to online
implementation. Cerebral blood flow velocities from the left and right middle cerebral
arteries were recorded from ten able-bodied participants during the performance of two
different mental activities (word generation and visual tracking). Invoking a signal
processing method from previous offline studies, we obtained an average accuracy of
73.32 ± 4.09%. We subsequently compared systematic feature selection approaches
(Fisher criterion, sequential forward selection, weighted sequential forward selection) and
two simple classifiers, namely, linear discriminant analysis (LDA) and a Naïve Bayes
(NB) classifier. With the combination of weighted sequential forward selection, which
14

yielded less than a handful of time domain features, and a Naïve Bayes classifier, a
maximum accuracy of 79.69 ± 3.20% was attained. Obtained with computationally
simple features and classifier, this result sets the stage for the development of an online
TCD-BCI.
3.2 Introduction
Individuals who are cognitively aware but living with severe motor disabilities such as
muscular dystrophy, multiple sclerosis, high-level spinal cord injuries or locked-in
syndrome may not be able to use conventional means of expression such as speech and
gestures for communication. Brain-computer interface (BCI) systems offer an alternative
means of communication for these individuals [15]. These BCI systems enable users to
generate a control command through mental activity [15]. Many portable brain
monitoring modalities have been explored for BCI development. The majority of systems
have used electroencephalography (EEG) [51], but hemodynamic-based monitoring
modalities such as near-infrared spectroscopy (NIRS) [5,6], and transcranial Doppler
(TCD) ultrasonography systems [11] have recently been introduced as BCI alternatives.
The cerebral hemodynamic response is inherently slower than the corresponding
electrical response measured using EEG. However hemodynamic monitoring systems are
not prone to electro-genic artifacts such as muscle contraction or eye-movement. Among
the existing hemodynamic monitoring systems, TCD-based systems have recently
demonstrated high accuracies in offline studies [11,12,13]. However, TCD has yet to be
tested as an online BCI system, a necessary step to justify further exploration of TCD as a
viable access pathway.
TCD is a non-invasive ultrasound technology that detects the changes in cerebral blood
flow velocity (CBFV). It was first introduced as a medical imaging device in 1982, and
has been widely applied clinically [24] for the detection of increased intracranial pressure
in neurocritical care, evaluation of subarachnoid haemorrhage, detection of
microembolism, and monitoring of cerebral circulation during cardiopulmonary bypass
[25,52,53,54].
15

TCD has recently been used as a functional brain imaging tool to examine the effects of
mental tasks on the blood flow velocities. In particular, functional TCD studies have
focused on the middle cerebral arteries (MCAs), which perfuse 80% of the brain, and
thus measurements of velocities therein reflect cognitive effort levels [39,41]. Blood flow
lateralization elicited by mental tasks, such as verbal fluency and visuospatial tasks, has
been detected using TCD in many studies [39,41,55,56,57]. The blood flow lateralization
is due to the coupling between the cerebral blood flow and oxidative metabolism [58].
Because of the anatomy and the different functional areas of the brain, the left
hemisphere exhibits augmented blood flow velocity during verbal fluency tasks while the
right hemisphere demonstrates heightened activation during visuospatial tasks [41]. The
response latency is rooted in an inherent physiological hemodynamic delay of 5-10
seconds between the onset of mental activation and the manifestation of blood flow
changes [59,60]. Despite the slower response rate, recent functional TCD-BCI studies
have reported promising rates of differentiation between different mental states
[13,11,12]. Myrden et al. (2011) first introduced TCD as a BCI measurement modality
and discriminated between word generation and rest (average accuracy of 82.9±10.5%)
and between mental rotation and rest (85.7±10%) in 9 able-bodied adults using 45s task
periods. The authors later followed up with a 3-class BCI, discerning among word
generation, mental rotation and unconstrained rest with over 70% accuracy and reaching
transmission rates of 1.2 bits per minute [35]. Subsequently, in a study of 18 adults,
Aleem & Chau (2013) reduced the task period to 18s and classified successive left and
right lateralizations offline in a user-independent framework with accuracies up to
74.6±12.6%. Most recently, in an offline TCD-NIRS-BCI study, Faress & Chau (2013)
achieved an average accuracy of 76.1 ± 9.9% in the automatic differentiation between
pre- and post-verbal fluency hemodynamics [13]. The collective evidence from offline
studies supports the investigation of an online TCD-BCI [11,12,13].
In this chapter, we have considered an alternative mental task, repetitively spell the
intended word while imagining writing the word. Additionally, the duration of the
activity was reduced from a previous length of 18 seconds [12] to 15 seconds for
throughput improvement. Through this chapter, we have investigated various signal
16

processing methods and classifiers to enhance the TCD-BCI functionality towards an
online system.
3.3 Materials and Methods
3.3.1 Participants
Thirteen able-bodied participants with normal or corrected-to-normal vision were
recruited for this study. One participant was excluded after the first session due to the
inability to follow study protocol. A second participant was excluded upon disclosing
post-study, medical history that violated inclusion criteria. A third participant was
excluded due to inadequate transtemporal windows, which precluded the location of the
MCAs. The ten remaining participants included for study (aged 18 – 40 years; all
female), were all right-handed with no reported history of neurological, metabolic,
respiratory, cardiovascular, or drug/alcohol-related conditions. All participants provided
written informed consent. This study was approved by the research ethics board of both
Holland Bloorview Kids Rehabilitation Hospital and the University of Toronto.
3.3.2 Instrumentation
The Doppler spectra of blood flow through the left and right MCAs were monitored using
the MultiDop X-4 TCD (Compumedics Germany) and the accompanying bilateral
headgear with two fixed 2 MHz ultrasonic transducers. The data were recorded at a
sampling frequency of 100Hz. The probes were positioned over the transtemporal
insonation window according to an established insonation procedure [61] as seen in
Figure 3.1.
17

Figure 3.1. Lateral and axial view of the ultrasound probe set at the transtemporal insonation window, directed toward the MCA [24,36]
Ultrasound gel was applied between the probe and the user’s skin to ensure proper signal
transduction. Once the probe was placed onto the transtemporal window, the TCD was
turned on with an initial depth setting of 50mm. The insonation angle and depth were
then adjusted to find the bifurcation of the internal carotid artery into the middle cerebral
artery (blood flowing toward the probe) and the anterior cerebral artery (blood flowing
away from the probe). The insonation depth was then decreased until the maximum
unidirectional flow towards the probe was detected. All participants were given 5 minute
breaks per every 15 minutes of TCD usage to provide sufficient time for probe cooling.
Throughout the recording process, the thermal cranial index (TIC) of the probes did not
exceed 1.5, thus avoiding discomfort or thermal injury to the participants, which is in
accordance with the British Medical Ultrasound Society safety guidelines [62].
The MultiDop X-4TCD device was approved by Health Canada’s Medical Devices
Directorate for investigational testing.
3.3.3 Mental Tasks
Participants performed two mental tasks throughout the study (i.e. activation and rest).
The word repetition was used as an activation mental task and visual tracking was used as
a rest state. Word repetition required the participant to repetitively spell the intended
Transtemporal
Window Middle Cerebral
Artery
TCD Probe
18
word while imagining writing the word throughout the task duration of 15 seconds (i.e.
spelling task with associated motor imagery). Visual tracking required the participant to
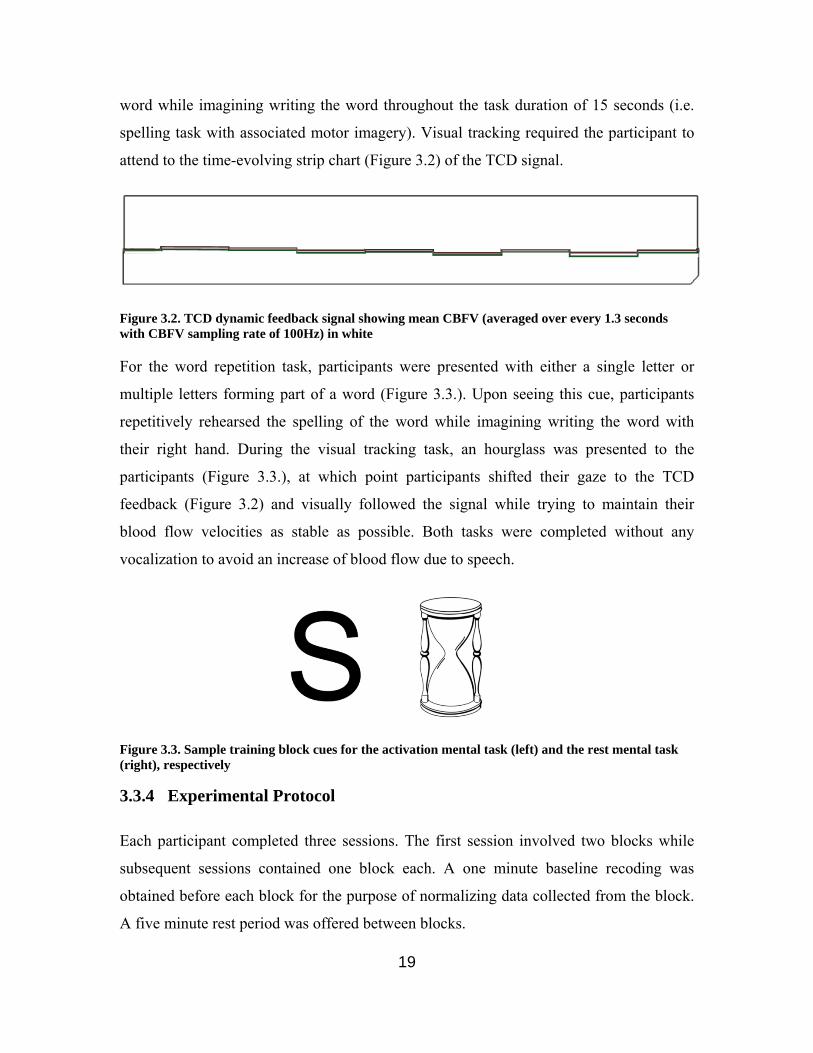
attend to the time-evolving strip chart (Figure 3.2) of the TCD signal.
Figure 3.2. TCD dynamic feedback signal showing mean CBFV (averaged over every 1.3 seconds with CBFV sampling rate of 100Hz) in white
For the word repetition task, participants were presented with either a single letter or
multiple letters forming part of a word (Figure 3.3.). Upon seeing this cue, participants
repetitively rehearsed the spelling of the word while imagining writing the word with
their right hand. During the visual tracking task, an hourglass was presented to the
participants (Figure 3.3.), at which point participants shifted their gaze to the TCD
feedback (Figure 3.2) and visually followed the signal while trying to maintain their
blood flow velocities as stable as possible. Both tasks were completed without any
vocalization to avoid an increase of blood flow due to speech.
Figure 3.3. Sample training block cues for the activation mental task (left) and the rest mental task (right), respectively
3.3.4 Experimental Protocol
Each participant completed three sessions. The first session involved two blocks while
subsequent sessions contained one block each. A one minute baseline recoding was
obtained before each block for the purpose of normalizing data collected from the block.
A five minute rest period was offered between blocks.
19

For each block, the participants performed a total of forty task segments. Each segment
was either an activation task or a rest task. The sequence of task presentation was
randomized (Figure 3.4). A ten second recovery period was included after each activation
task to allow the participant’s blood flow velocities to return to baseline levels. During
the recovery period, the participants performed the rest task to restore basal blood flow
velocities. For each mental task, specific cues were presented to the participants for the
task duration.
or
Figure 3.4. Schematic diagram of a data collection block. The block began with a 1-minute baseline period, followed by 40 randomized task segments. During each task segment, the screen randomly displayed either an hourglass or a letter. If a letter was presented, the participant must perform the activation mental task for the duration of 15 seconds, followed by a 10 second rest task which was cued by an hourglass. If an hourglass was displayed, the participant continued the rest task.
3.3.5 Pre-processing & Feature Extraction
All data collected from the blocks were used for classifier training. Therefore, for each
participant, a total of eighty activation data segments and eighty rest data segments were
used to train a user-specific classifier. A total of forty-four features were extracted from
each segment. The features were chosen according to previous TCD studies which have
investigated lateralized activation tasks [11].
Baseline Segment 1
15 s 10 s
15 s
Segment 2 Segment 3 Segment 39 Segment 40
1 minute 13 minutes 20 seconds
20

3.3.6 Feature Selection
Three feature selection methods were investigated, including Fisher criterion, sequential
forward selection (SFS), weighted sequential forward selection (WSFS).
The Fisher criterion [63] was based on previous offline TCD-BCI studies and thus was
considered as the baseline standard [11]. For a given feature, this criterion can be
expressed as:
21
20
210
ssmm
J+−
= (1)
where 𝑚𝑚0and 𝑠𝑠0 represent the mean and standard deviation of the feature values extracted
from TCD recordings during the resting task, while 𝑚𝑚1 and 𝑠𝑠1 are the mean and standard
deviation of the same features during the activation task. The value of the Fisher criterion
increases as the average separation between groups increases and the average separation
within group decreases. This criterion thus yields the features that provide the maximum
separability between rest and activation tasks. As in a previous TCD-BCI study, we
retained only the top 3 features identified by the Fisher criterion [11].
For the second and third feature selection methods, we used the interclass separability F-
score (ISF) as the feature ranking method. The ISF is a normalized measure of
discrimination between the features of two classes [64]. The ISF of a feature can be
defined as:
∑ ∑= =−
−+−
−
−+−=
1 0
1 12
00,0
211,
1
20
21
)(1
1)(1
1)()(
n
i
n
i ii mxn
mxn
mmmmISF
(2)
where 1n and 0n represent the number of instances from the activation and rest tasks,
respectively; m , 1m and 0m , are the average feature values for the whole data set, the
activation data, and the rest data, respectively; 1,ix is the ith activation feature value, and
21

0,ix is the ith rest feature value. Therefore, the numerator is an indication of the
separability between the activation and rest class feature values and the denominator
reflects the intraclass variability of the feature. The larger the ISF, the more likely the
feature under consideration will be discriminative.
The sequential feature selection (SFS) approach consists of a forward step which starts
from an initially empty set of features Z0. At each forward step l, a new subset is created
containing all features within the previous subset Z(l-1). In addition, feature a+ is added to
the new subset Zl, where a+ is the next available feature from the set of ranked and
ordered features [65]. Therefore, the first subset only contains the top ranked feature from
the ISF ranking and the last subset contains all 44 extracted features. The number of
subsets created is equal to the number of available features. Within this study, we
performed a 10-fold cross-validation. For each fold, an optimal subset was obtained
according to the validation accuracies of the subsets. The 10 optimal subsets were then
collected. A new 10-fold cross-validation was performed with this superset of optimal
features and a final set of features was selected as that boasting the highest validation
accuracy. These features were utilized to train the final classifier.
The third approach is weighted sequential feature selection (WSFS). WSFS extended the
sequential forward search (SFS) approach [65] by explicitly considering feature
contributions (i.e. the number of times a specific feature was chosen). For each fold of a
10-fold cross-validation for feature selection, all features were first ranked according to
F-score [64] for interclass separability, using the training set. These ranked features were
then organized into cumulative subsets such that the first subset contained the top ranked
feature, the second subset contained the top two ranked features, and so on. The last
subset contained all features. Within each fold, the subset with the highest validation
accuracy was selected. Therefore, 10-fold cross-validation yielded 10 such subsets.
22

3.3.7 Classification
Two classification methods were compared. The first was a Linear Discriminant Analysis
and the second, a Naïve Bayes classifier.
Previous offline TCD studies implemented Fisher criterion feature selection and Linear
Discriminant Analysis (LDA) classifier methods [11,12,13]. Thus within this section, we
have established the baseline accuracy for our TCD data set through LDA:
0)( wxwxy T += (3)
Where w is the weight vector for the feature vector x, and w0 is the bias [66]. Not all 44
features were included in the feature vector, x. Within each session, appropriate features
were selected according to the methods introduced above. The LDA classified each
testing data point as rest when y≤0, and activation when y>0.
From existing studies involving hemodynamic data, the Naïve Bayes (NB) classifier has
performed well with a modest feature vector dimensionality [67]. The NB classifier
assumes independence between features within each class. However, NB appears to work
well in practice even when that independence assumption is not strictly valid [68].
Therefore, we have implemented the NB classifier, assuming independence between
features. To decide whether a specific test data belongs to either the rest class or the
activation class, the posterior possibilities (Ck) of both classes were calculated. The test
data were assigned to the class with the highest posterior probability. Ck, given by:
)()( kj
jkk CxpCpC ∏= (4)
where )( kCp is the prior probability for the rest or activation class (k = 0 or 1,
respectively). Because there were equal numbers of rest and activation instances (80 rest,
80 activation), we have set 5.0)()( 10 == CpCp . The likelihood, )( kj Cxp , is the class-
conditional probabilities for each feature within either rest or activation classes. A
23

Gaussian distribution was assumed for each feature. Thus for a set of selected features
(𝑋𝑋) of the test data, the likelihood of that test data belonging to class k is given as:
∏∏
−−==
j kj
kjj
kjjkjk
xCxpCXp 2
,
,
2,
)(21exp
2
1)()(σµ
πσ (5)
Where kj ,µ and kj ,σ are the mean and variance respectively of the jth feature in class k.
Both the mean and the variance were calculated from the training data and the same
calculation was done for all features for both classes.
The Fisher criterion, ISF-SFS and ISF-WSFS were compared as feature selection
methods for both LDA and NB classifiers.
3.4 Results
3.4.1 Linear Discriminant Analysis
Data from 10 participants were individually analyzed. Each set contained 80 activation
and 80 rest instances. A 10-fold cross validation method was applied to each data set so
that all data points were randomly arranged into 10 groups. Each group of data contained
8 activation instances and 8 rest instances. For each fold, one group was set aside as
testing data while the rest were used as training data. In each fold, a different group was
chosen as testing data while the other 9 groups were used as training data. This procedure
was repeated until each group participated once as testing data. The 10-fold cross
validation method was efficient for small samples of data as it allowed all the data points
to contribute as both testing and training data. Additionally, it prevented over-fitting by
ensuring that the training and testing data were different within each fold [66].
The performance of the feature selection methods and the classifier was defined by the
overall session accuracy. The accuracy for each session was calculated from the averaged
accuracies of the 10-fold cross validation. Fisher criterion, SFS, and WSFS resulted in an
24

average validation accuracy of 73.32 ± 4.09%, 78.69 ± 3.71% and 78.94 ± 3.57%,
respectively, using the LDA classifier (Figure 3.5).
Figure 3.5. 10-fold cross-validation accuracy for Linear Discriminant Analysis classifier with Fisher criterion, ISF-SFS, and ISF-WSFS feature selection methods.
3.4.2 Naïve Bayes
The accuracy for each participant using the different feature selection and Naïve Bayes
classifier combinations is summarized in Figure 3.6.
50
55
60
65
70
75
80
85
90
1 2 3 4 5 6 7 8 9 10
Fisher LDA
SFS LDA
WSFS LDA
Participant Number
Acc
urac
y (%
)
25
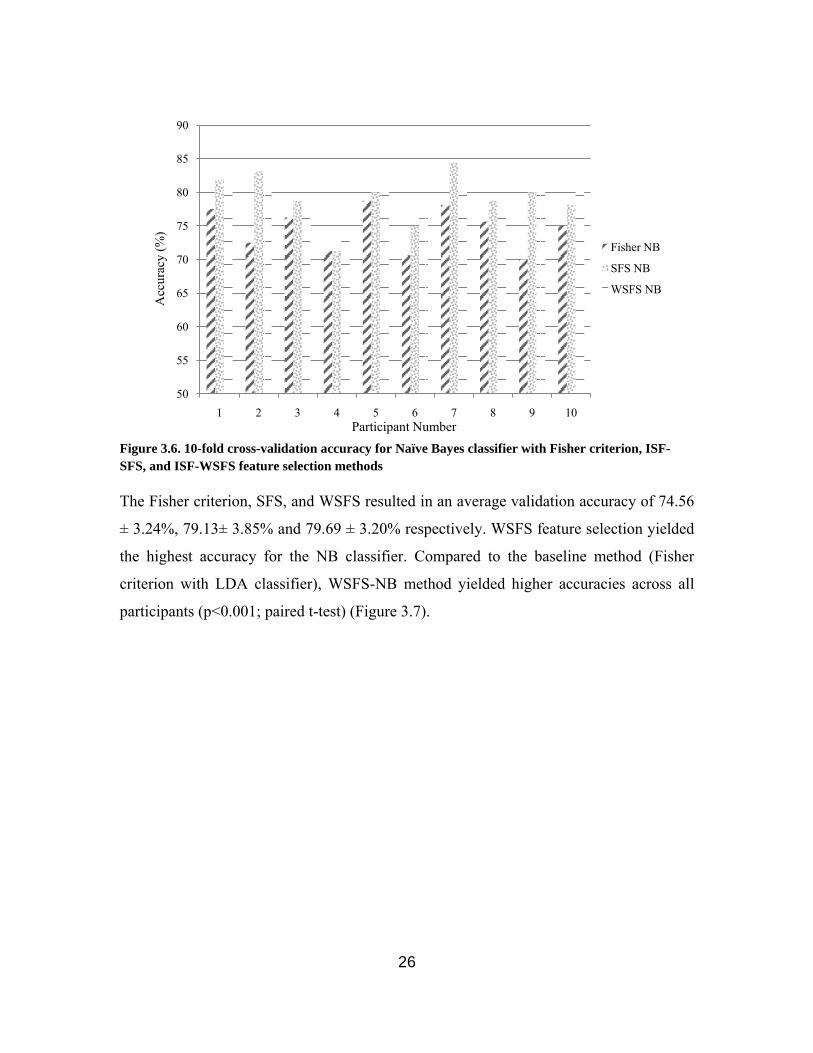
Figure 3.6. 10-fold cross-validation accuracy for Naïve Bayes classifier with Fisher criterion, ISF-SFS, and ISF-WSFS feature selection methods
The Fisher criterion, SFS, and WSFS resulted in an average validation accuracy of 74.56
± 3.24%, 79.13± 3.85% and 79.69 ± 3.20% respectively. WSFS feature selection yielded
the highest accuracy for the NB classifier. Compared to the baseline method (Fisher
criterion with LDA classifier), WSFS-NB method yielded higher accuracies across all
participants (p<0.001; paired t-test) (Figure 3.7).
50
55
60
65
70
75
80
85
90
1 2 3 4 5 6 7 8 9 10
Fisher NB
SFS NB
WSFS NB
Participant Number
Acc
urac
y (%
)
26

Figure 3.7. Fisher criterion Linear Discriminant Analysis (baseline method) accuracy versus WSFS Naïve Bayes (optimal method) accuracy.
The increase in accuracy was especially noticeable for participants who had lower
accuracies with the baseline method, namely participants 4, 9 and 10.
3.4.3 Features
The Fisher feature selection method required a set number of three features for
classifier training. However, both SFS and WSFS method did not restrict the number of
features selected. Overall, SFS and WSFS method selected an average of 5.1 ± 3.0 and
3.2 ± 1.5 features, respectively, for the LDA classifier. For the Naïve Bayes classifier, the
SFS and WSFS method selected an average of 4.6 ± 3.5 and 3.0 ± 1.3 features
respectively. The detailed number of features selected for each participant is shown in
Table 3.1.
50
55
60
65
70
75
80
85
90
1 2 3 4 5 6 7 8 9 10
Fisher LDA
WSFS NB
Participant Number
Acc
urac
y (%
)
27

Table 3.1. Number of features selected by each feature selection method
Participant SFS LDA
SFS NB
WSFS LDA
WSFS NB
1 6 5 6 5 2 12 14 3 3 3 7 5 1 1 4 3 5 4 2 5 4 2 4 3 6 2 2 1 2 7 2 2 3 2 8 6 3 3 3 9 3 4 3 4 10 6 4 4 5
3.5 Discussion
3.5.1 Classification of Word Repetition
A previous offline TCD-BCI study conducted by Myrden et al. achieved 82.9 ± 10.5%
accuracy using a 45 second data collection window, differentiating between verbal
fluency mental task and relaxation [11]. A subsequent offline TCD-BCI study conducted
by Aleem et al. was able to achieve 80.0 ± 9.6% accuracy using an 18 second data
collection window, differentiating between verbal fluency and mental rotation mental
tasks [12]. More recently, Faress & Chau achieved an average accuracy of 76.1 ± 9.9% in
the automatic differentiation between pre- and post-verbal fluency hemodynamics with a
20 second data collection window [13]. Comparatively, we achieved an average accuracy
of 79.69 ± 3.20% with a 15 second window. The chance level for this offline data is 60%,
as calculated by Muller-Putz et al. [69] . This offline result exceeds the chance level and
compares favorably to findings of previous studies, while considering the shortest data
collection window to date and a combination of computationally efficient features and
classifier.
28

3.5.2 Feature Selection
The average number of features used for all methods exceeded the set number of 3
features, suggesting that more than 3 features are needed to achieve class discrimination.
Given that ten-fold cross-validation was used, where the training and validation data were
mutually exclusive subsets of data, we can be assured that the higher accuracy was not
due to overfitting.
Overall, the WSFS method minimized the number of features for each participant as seen
in Figure 3.8 while maintaining cross-validation accuracies comparable to those of the
SFS method, as seen in Figure 3.9. Therefore, the WSFS feature selection method
seemed to eliminate redundant or uninformative features.
Figure 3.8. Average number of features selected by each feature selection and classification method
Figure 3.9. Average accuracy from each feature selection and classification method
There was significant difference between the Fisher criterion and SFS feature selection
methods with both LDA and NB classifiers (p < 0.001; p = 0.002; paired t-test).
Likewise, accuracies significantly differed between Fisher criterion and WSFS feature
selection methods with both LDA and NB classifiers (p < 0.001; p < 0.001; paired t-test).
0
1
2
3
4
5
6
7
8
SFS LDA SFS NB WSFS LDA
WSFS NB
Methods
Num
ber o
f Fea
ture
s
70.00
72.00
74.00
76.00
78.00
80.00
82.00
84.00
SFS LDA SFS NB WSFS LDA
WSFS NB
Methods
Ave
rage
Acc
urac
y (%
)
29

The WSFS and SFS feature selection methods offered similar accuracies with either
classifier (pLDA = 0.401; pNB = 0.134; paired t-test).
3.5.3 Classifier
When keeping the feature selection methods the same, there was no significant difference
between the LDA and NB classifiers. However, when taking into account a combination
of feature selection methods and classifiers, there were significant differences between
both SFS-NB and WSFS-NB methods and the standard Fisher criterion LDA method
(p<0.001; p<0.001; paired t-test). In addition, WSFS-NB was significantly different from
SFS-LDA (p = 0.026), though SFS-NB was not significantly different from WSFS-LDA
(p=0.627).
When comparing the WSFS-NB method with the Fisher-LDA method, the largest
improvement in classification was seen in participants 9 and 10 (over 8% increase).
When comparing the same participants with SFS-NB method and SFS-LDA method, the
improvements were only 1.25% and 4.38% respectively. Collectively, these findings
suggest that it was the judicious combination of feature selection method and classifier
that improved accuracies, rather than either method alone.
3.6 Conclusion
In this chapter, we compared different feature selection methods and classifiers for a set
of TCD data. We demonstrated that although all methods were able to reasonably
differentiate the TCD data into activation and rest states, a Naïve Bayes classifier with
weighted sequential forward feature selection achieved the best performance. Our feature
selection and classifier methods improved upon previously published work by further
reducing the data analytic window (to 15s) along with the post-activation window (to
10s) and honing in on algorithms that are conducive to online implementation.
30

Chapter 4
Online Transcranial Doppler Ultrasonographic Control of an Onscreen Keyboard
This chapter is a manuscript and thus contain information already presented in Chapter 2.
In addition, the introduction and method part of this chapter has been described within
Chapter 3 and may be repetitive material.
Abstract. Brain-computer interface (BCI) systems exploit brain activity for generating a
control command and may be used by individuals with severe motor disabilities as an
alternative means of communication. Transcranial Doppler Ultrasonography (TCD) is an
emerging brain monitoring modality for BCI development. However, current studies have
exclusively used offline analysis. The feasibility of a TCD-based BCI system hinges on
its online performance, which has not been documented to date. In this paper, an online
TCD BCI system was implemented for the control of a scanning keyboard. Target letters
were selected by repetitively rehearsing the spelling of the intended word, while letters
were bypassed by performing a visual tracking task. With 10 able-bodied young adults,
these two mental tasks were differentiated using a Naïve Bayes classification algorithm
and a set of time-domain user-dependent features. The system achieved an average
specificity and sensitivity of 81.44 ± 8.35% and 82.30 ± 7.39%, respectively. The level of
agreement between the intended and machine-predicted selections was moderate
(κ=0.60). The average information transfer rate was 0.87 bits/min with an average
throughput of 0.35 ± 0.18 character/min. These results suggest that future studies of
online TCD-based BCI systems are warranted.
31

4.1. Introduction
Individuals who are cognitively aware but living with severe motor disabilities such as
muscular dystrophy, multiple sclerosis, high-level spinal cord injuries or locked-in
syndrome may not be able to use conventional means of expression such as speech and
gestures for communication. Brain-computer interface (BCI) systems offer an alternative
means of communication for these individuals [15]. These BCI systems enable users to
generate a control command through mental activity [15]. Many portable brain
monitoring modalities have been explored for BCI development. The majority of systems
have used electroencephalography (EEG) [51], but hemodynamic-based monitoring
modalities such as near-infrared spectroscopy (NIRS) [5,6], and transcranial Doppler
(TCD) ultrasonography systems [11] have recently been introduced as BCI alternatives.
The cerebral hemodynamic response is inherently slower than the corresponding
electrical response measured using EEG. However hemodynamic monitoring systems are
not prone to electro-genic artifacts such as muscle contraction or eye-movement. Among
the existing hemodynamic monitoring systems, TCD-based systems have recently
demonstrated high accuracies in offline studies [11,12,13]. However, TCD has yet to be
tested as an online BCI system, a necessary step to justify further exploration of TCD as a
viable access pathway.
TCD is a non-invasive ultrasound technology that detects the changes in cerebral blood
flow velocity (CBFV). It was first introduced as a medical imaging device in 1982, and
has been widely applied clinically [24] for the detection of increased intracranial pressure
in neurocritical care, evaluation of subarachnoid haemorrhage, detection of
microembolism, and monitoring of cerebral circulation during cardiopulmonary bypass
[25,52,53,54].
TCD has recently been used as a functional brain imaging tool to examine the effects of
mental tasks on the blood flow velocities. In particular, functional TCD studies have
focused on the middle cerebral arteries (MCAs), which perfuse 80% of the brain, and
thus measurements of velocities therein reflect cognitive effort levels [39,41]. Blood flow
32

lateralization elicited by mental tasks, such as verbal fluency and visuospatial tasks, has
been detected using TCD in many studies [39,41,55,56,57]. The blood flow lateralization
is due to the coupling between the cerebral blood flow and oxidative metabolism [58].
Because of the anatomy and the different functional areas of the brain, the left
hemisphere exhibits augmented blood flow velocity during verbal fluency tasks while the
right hemisphere demonstrates heightened activation during visuospatial tasks [41]. The
response latency is rooted in an inherent physiological hemodynamic delay of 5-10
seconds between the onset of mental activation and the manifestation of blood flow
changes [59,60]. Despite the slower response rate, recent functional TCD-BCI studies
have reported promising rates of differentiation between different mental states
[11,12,13]. Myrden et al. (2011) first introduced TCD as a BCI measurement modality
and discriminated between word generation and rest (average accuracy of 82.9±10.5%)
and between mental rotation and rest (85.7±10%) in 9 able-bodied adults using 45s task
periods. The authors later followed up with a 3-class BCI, discerning among word
generation, mental rotation and unconstrained rest with over 70% accuracy and reaching
transmission rates of 1.2 bits per minute [35]. Subsequently, in a study of 18 adults,
Aleem & Chau (2013) reduced the task period to 18s and classified successive left and
right lateralizations offline in a user-independent framework with accuracies up to
74.6±12.6%. Most recently, in an offline TCD-NIRS-BCI study, Faress & Chau (2013)
achieved an average accuracy of 76.1 ± 9.9% in the automatic differentiation between
pre- and post-verbal fluency hemodynamics [13]. The collective evidence from offline
studies supports the investigation of an online TCD-BCI [11,12,13].
In the current study, an online TCD-based BCI system was implemented for operating a
spelling system (i.e. scanning keyboard). The spelling interface was controlled via two
mental states, namely, rest and activation. The activation task was repetitive mental
spelling of the intended word and the rest mental task was the visual tracking of a display
of TCD signals.
33

4.2. Methods
4.2.1. Participants
Thirteen able-bodied participants with normal or corrected-to-normal vision were
recruited for this study. One participant was excluded after the first session due to the
inability to follow study protocol. A second participant was excluded upon disclosing
post-study, medical history that violated inclusion criteria. A third participant was
excluded due to inadequate transtemporal windows, which precluded the location of the
MCAs. The ten remaining participants included for study (aged 18 – 40 years; all
female), were all right-handed with no reported history of neurological, metabolic,
respiratory, cardiovascular, or drug/alcohol-related conditions. All participants provided
written informed consent. This study was approved by the research ethics board of both
Holland Bloorview Kids Rehabilitation Hospital and the University of Toronto.
4.2.2. Instrumentation
The Doppler spectra of blood flow through the left and right MCAs were monitored using
the MultiDop X-4 TCD (Compumedics Germany) and the accompanying bilateral
headgear with two fixed 2 MHz ultrasonic transducers. The data were recorded at a
sampling frequency of 100Hz. The probes were positioned over the transtemporal
insonation window according to an established insonation procedure [61] as seen in
Figure 4.1.
34

Figure 4.1. Lateral and axial view of the ultrasound probe set at the transtemporal insonation window, directed toward the MCA [24,36]
Ultrasound gel was applied between the probe and the user’s skin to ensure proper signal
transduction. Once the probe was placed onto the transtemporal window, the TCD was
turned on with an initial depth setting of 50mm. The insonation angle and depth were
then adjusted to find the bifurcation of the internal carotid artery into the middle cerebral
artery (blood flowing toward the probe) and the anterior cerebral artery (blood flowing
away from the probe). The insonation depth was then decreased until the maximum
unidirectional flow towards the probe was detected. All participants were given 5 minute
breaks per every 15 minutes of TCD usage to provide sufficient time for probe cooling.
Throughout the recording process, the thermal cranial index (TIC) of the probes did not
exceed 1.5, thus avoiding discomfort or thermal injury to the participants, which is in
accordance with the British Medical Ultrasound Society safety guidelines [62].
The MultiDop X-4TCD device was approved by Health Canada’s Medical Devices
Directorate for investigational testing.
4.2.3. Mental tasks
Participants performed two mental tasks throughout the study (i.e. activation and rest).
The word repetition was used as an activation mental task and visual tracking was used as
a rest state. Word repetition required the participant to repetitively spell the intended
Transtemporal
Window Middle Cerebral
Artery
TCD Probe
35

word while imagining writing the word throughout the task duration of 15 seconds (i.e.
spelling task with associated motor imagery). Visual tracking required the participant to
attend to the time-evolving strip chart (Figure 4.2) of the TCD signal.
Figure 4.2. TCD dynamic feedback signal showing mean CBFV (averaged over every 1.3 seconds with CBFV sampling rate of 100Hz) in white
For the word repetition task during the training session, participants were presented with
either a single letter or multiple letters forming part of a word. Upon seeing this cue,
participants repetitively rehearsed the spelling of the word while imagining writing the
word with their right hand. During the visual tracking task, an hourglass was presented to
the participants, at which point participants shifted their gaze to the TCD feedback
(Figure 4.2) and visually followed the signal while trying to maintain their blood flow
velocities as stable as possible. Both tasks were completed without any vocalization to
avoid an increase of blood flow due to speech.
During the testing sessions, the participants were asked to perform the activation mental
task when the desired letter appeared among the currently available letter choices and to
perform the rest mental task when the desired letter was not displayed.
4.2.4. Dynamic Keyboard
A custom on-screen keyboard was developed based on the concept of the dynamic
keyboard developed by the University of Victoria. In our implementation, each level of
the keyboard hierarchy contained multiple bins, although at any given time, only one bin
was displayed to minimize the mental workload and user confusion. Each bin contained
multiple letters or words (Figure 4.3).
36

Figure 4.3. Dynamic Keyboard User-interface
The letters were grouped together on the basis of letter frequency given existing letter
outputs. For example, the top 5 beginning of word letters (t, a, i, s, o) were grouped into
the first letter bin only if there had been no letter output. However, if the letter “t” was
selected, the first letter bin would contain letters “h, o, r, a, e” instead (Figure 4.4). The
words were grouped using word prediction. For every letter bin selected, a bin containing
high frequency words based on the existing letter outputs and previous letter bin selection
was presented. To select the intended letter or word within a bin, participants had to
choose the bin by performing the activation mental task. Once the bin was chosen, an
undo button was available to the participant. This button allowed the user to delete the
most recent selection and return to the bin from the previous level of the hierarchy. If the
participant did not choose to delete the most recent selection, the individual letters or
words within the above selected bin were presented one at a time to the participant
(Figure 4.4). This latter selection would be at the second level of the keyboard hierarchy.
If no selections were made on a given level of the hierarchy, the procedure would restart
from the beginning of the previous level.
Output Box
Current bin
TCD signal
37

Figure 4.4. An example of dynamic keyboard progression
4.2.5. Experimental Protocol
Each participant completed three sessions. The first session involved two training blocks
and one testing block while subsequent sessions contained one training block followed by
two testing blocks. A one minute baseline recoding was obtained before each block for
the purpose of normalizing data collected from the block. A five minute rest period was
offered between blocks.
For each training block, the participants performed a total of forty task segments. Each
segment was either an activation task or a rest task. The sequence of task presentation
was randomized (Figure 4.5). A ten second recovery period was included after each
activation task to allow the participant’s blood flow velocities to return to baseline levels.
Selection
Selection
No Selection
No Selection No Selection
Selection
No Selection No Selection
No Selection
38

During the recovery period, the participants performed the rest task to restore basal blood
flow velocities. For each mental task, specific cues were presented to the participants for
the task duration. For the first session, participants had a ten minute break while the two
blocks of training data were used to train the appropriate classifier. For sessions two and
three, the ten minute break occurred after the first training block. During this break, the
classifier was trained with data from the current and initial sessions. After each session,
the participants' feedback on tiredness levels were collected through a written survey.
or
Figure 4.5. Schematic diagram of the training block. The training block began with a 1-minute baseline period, followed by 40 randomized task segments. During each task segment, the screen randomly displayed either an hourglass or a letter. If a letter was presented, the participant must perform the activation mental task for the duration of 15 seconds, followed by a 10 second rest task which was cued by an hourglass. If an hourglass was displayed, the participant continued the rest task.
For each testing block, the participants were asked to spell a given target phrase to the
best of their abilities using the dynamic keyboard. The participants performed the
activation task only when the bin containing the intended selection was presented. If a
false positive occurred, the participants were instructed to select the undo button and
correct the error before continuing the spelling process. If a false-negative occurred, the
participants were instructed to simply wait until the keyboard looped back to the intended
bin.
1 minute 13 minutes 20 seconds
Baseline Segment 1
15 s 10 s
15 s
Segment 2 Segment 3 Segment 39 Segment 40
39

4.2.6. Data Processing and Classification
All data collected from the training blocks were used for classifier training. Therefore, for
each participant, a total of forty activation data segments and forty rest data segments
were used to train a user-specific classifier for session I. For each subsequent session,
training data from session I (40 activation and 40 rest segments) and the session at hand
(20 activation and 20 rest segments) were pooled for training (i.e. 60 activation and 60
rest data segments). Each segment was 15 seconds in duration. A total of forty-four
features were extracted from each segment. The features were chosen according to
previous TCD studies which have investigated lateralized activation tasks [11].
Figure 4.6. Sample recording depicting the three most common features: (1) difference between left and right mean velocities, µL – µR, at 10-15 seconds; (2) difference between left and right mean velocities, µL – µR, at 5-10 seconds, and, (3) slope of the right MCA CBFV (mR) at 5-10 seconds. Data shown are normalized and smoothed and represent one trial performed by participant 10. The left graph depicts a rest trial while the right graph portrays an activation trial, showing the difference between left and right mean CBFV at 10 – 15 seconds and at 5-10 seconds.
Weighted sequential feature selection (WSFS) was used to algorithmically select three to
five features for each session, for each participant, to train a Naïve Bayes classifier.
WSFS extended the sequential forward search (SFS) approach [65] by explicitly
considering feature contributions (i.e. the number of times a specific feature was chosen).
For each fold of a 10-fold cross-validation for feature selection, all features were first
ranked according to F-score [64] for interclass separability, using the training set. These
ranked features were then organized into cumulative subsets such that the first subset
contained the top ranked feature, the second subset contained the top two ranked features,
and so on. The last subset contained all features. Within each fold, the subset with the
µL
mR
µR
µL µR
40

highest validation accuracy was selected. Therefore, 10-fold cross-validation yielded 10
such subsets.
We enumerated the occurrence of each feature within these 10 subsets. Certain features
appeared consistently across all subsets while others surfaced intermittently. The selected
features were regrouped based on their frequency of occurrence, such that the mth group
contained all the features that appeared at least m times, where m = {1, 2,…,10}. These
new subsets were evaluated through a subsequent constrained 10-fold cross-validation
(i.e. only the m pre-determined feature subsets were cross-validated) with newly
randomized testing and training sets. The final set of features was then selected as that
with the highest average validation accuracy. The chosen features were used to train a
Gaussian Naïve Bayes classifier.
Figure 4.6 demonstrates a single trial of a rest task (left) and activation task (right). The
three most common features selected across sessions and participants are highlighted.
The least common of the three features (slope of the right MCA CBFV) was selected in
six out of ten participants.
4.2.7. Performance evaluation
To capture the different nuances of online classification performance, several metrics
were invoked as suggested by Thomas et al. and Schlӧgl et al. [70,71]. To gauge the
correctness of classification for a biased classifier (i.e., unequal performance for each
class), sensitivity and specificity were estimated from the confusion matrix [28].
Specificity is the number of true negatives divided by the actual number of negatives in
the test set while sensitivity is the number of true positives divided by the actual number
positives in the test set.
To measure the agreement between the predicted and desired selections [72,70] in the
presence of unbalanced data (i.e., unequal number of samples per class due to the nature
of the experiment), Cohen's kappa (κ) coefficient was estimated. Kappa ranges from 1
(perfect match) to 0 (chance level). If all values of κ within the 95% confidence interval
41

around the mean are above 0 (�̅�𝜅 ± 1.96 × 𝜑𝜑(𝜅𝜅) > 0, where ϕ(k) is the standard error),
then the average kappa value is significantly above chance [73]. The classification
accuracy ACC (overall agreement) was derived from the 2×2 confusion matrix H, as
𝐴𝐴𝐴𝐴𝐴𝐴 = 𝑝𝑝0 = ∑ 𝐻𝐻𝑖𝑖𝑖𝑖𝑖𝑖𝑁𝑁
(6)
where 𝐻𝐻𝑖𝑖𝑖𝑖 are the main diagonal elements (i.e., number of correct classifications) of the
confusion matrix H and 𝑁𝑁 = ∑ ∑ 𝐻𝐻𝑖𝑖𝑖𝑖𝑖𝑖𝑖𝑖 is the total number of trials. The chance expected
agreement 𝑝𝑝𝑒𝑒 , is the probability of observing the current confusion matrix and is given
by,
𝑝𝑝𝑒𝑒 = ∑ 𝑛𝑛+𝑖𝑖𝑛𝑛𝑖𝑖+𝑖𝑖𝑁𝑁2 (7)
𝑤𝑤here 𝑛𝑛+𝑖𝑖 and 𝑛𝑛𝑖𝑖+ are the marginal column and row sums, respectively. The estimate of
the kappa coefficient κ is thus,
κ = 𝑝𝑝0−𝑝𝑝𝑒𝑒1−𝑝𝑝𝑒𝑒
(8)
while its standard error ϕ(κ) is given by,
ϕ(κ) = �𝑝𝑝0+𝑝𝑝𝑒𝑒2−∑ [𝑛𝑛+𝑖𝑖𝑛𝑛𝑖𝑖+(𝑛𝑛+𝑖𝑖+𝑛𝑛𝑖𝑖+)]/𝑁𝑁3𝑖𝑖
(1−𝑝𝑝𝑒𝑒)√𝑁𝑁 (9)
This method of evaluation is preferred for problems with unbalanced classes [74,75],
such as sleep classification.
To gauge performance of the system as a communication channel, we estimated the
Nykopp information transfer rate (ITR), which is recommended for classification
problems with unbalanced class sizes [70]. Letting 𝑥𝑥𝑖𝑖 represent the actual input category
( 𝑥𝑥0 = rest, 𝑥𝑥1 = activation) and 𝑦𝑦𝑖𝑖 represent the predicted output ( 𝑦𝑦0 = rest, 𝑦𝑦1 =
activation), the ITR was given by
𝐼𝐼𝐼𝐼𝑅𝑅Nykopp = ∑ ∑ 𝑝𝑝(𝑥𝑥𝑖𝑖)𝑝𝑝�𝑦𝑦𝑖𝑖 �𝑥𝑥𝑖𝑖�𝑙𝑙𝑙𝑙𝑙𝑙2�𝑝𝑝�𝑦𝑦𝑖𝑖 �𝑥𝑥𝑖𝑖��1𝑖𝑖=0
1𝑖𝑖=0 (10)
42

where
𝑝𝑝�𝑦𝑦𝑖𝑖 � = ∑ 𝑝𝑝(𝑥𝑥𝑖𝑖)𝑝𝑝�𝑦𝑦𝑖𝑖 �𝑥𝑥𝑖𝑖�1𝑖𝑖=0 (11)
𝑝𝑝�𝑦𝑦𝑖𝑖 �𝑥𝑥𝑖𝑖� = 𝐻𝐻𝑖𝑖𝑖𝑖𝑛𝑛𝑖𝑖+
(12)
while 𝑝𝑝(𝑥𝑥0) = 0.7 and 𝑝𝑝(𝑥𝑥1) = 0.3 are the prior probabilities of rest and activation tasks,
respectively to be, estimated from the average frequency of occurrence of each task when
spelling an intended message with no mistakes. To calculate the bit-rate, we multiplied
the Nykopp ITR by the average number of trials per minute [70].
To assess system efficiency, the average throughput, defined as the number of characters
output per minute, was determined. Only correct characters were counted while the
measured duration included the time required to make error corrections. Since
participants were asked to correct mistakes during the spelling process, the estimated
throughputs were generally conservative with the low char/min.
To measure the resemblance of the actual output to the intended output, the Levenshtein
or edit distance was calculated. The edit distance compares the similarity between two
strings of unequal length and is defined as the number of editorial operations required to
convert the actual output into the intended output [76]. Each deletion and insertion of a
character was given a weight of 1 while a substitution was given a weight of 2, being
equivalent to a deletion followed by an insertion [76]. Since the intended outputs were of
different lengths for the testing blocks of the three sessions, the edit distances were
normalized based on the longest string length of the intended outputs (Equation 13).
Other normalization methods more severely penalize a lack of input over an incorrect
selection [77,78,79]. However, due to the study design, an incorrect selection should have
a higher edit distance than a lack of input since the effort required to correct an incorrect
selection is far greater than that needed to produce an intended output with no
corrections. The normalized edit distance, 𝐷𝐷𝐸𝐸𝑁𝑁 , is given by,
𝐷𝐷𝐸𝐸𝑁𝑁 = 𝐷𝐷𝐸𝐸|𝑋𝑋|
× |𝑋𝑋∗| (13)
43

where |𝑋𝑋| is the length of the intended output, 𝐷𝐷𝐸𝐸 is the raw edit distance between
intended and actual output, and |𝑋𝑋∗| is the length of the longest intended output from all
sessions. Given the longest string length in our experiment was 18, i.e. |𝑋𝑋∗| = 18, a
normalized edit distance of 18 indicated no output and 0 meant perfect match between the
intended output and the actual output. Any score above 18 indicated that the actual output
mismatched the intended output. The larger the normalized edit distance is, the further
away the actual output was from the intended output.
4.3. Results
4.3.1. Feature Selection
Bilateral features were more frequently selected (Figure 4.7), which could be due to the
left-lateralized nature of the language task. The higher selection frequency of bilateral
features was consistent with that reported in a previous offline TCD-BCI study using
verbal fluency [11]. Therefore, our modified verbal fluency task (i.e., rehearsing the
spelling while imagining the writing of the target word) appeared to elicit machine-
discernible left-hemispheric lateralization.
44

Figure 4.7. Normalized frequency of features (the number of times a feature has been selected divided by the total number of times all feature have been selected) across all participants
4.3.2. Inter-participant analysis
The online performance on the testing blocks in sessions II and III is reported in Table
4.1. The system achieved an average specificity and sensitivity of 81.44 ± 83.5% and
82.30 ± 7.39% respectively, resulting in an average kappa coefficient of 0.60 ± 0.03. All
participants exhibited a kappa coefficient that exceeded chance. Seven out of eight
participants achieved a kappa coefficient over 0.4, which is equivalent to an accuracy
>70% had the classes been balanced [73].
4.3.3 Inter-session Results
Classification performance across all sessions are summarized in Table 4.1. Only four out
of ten participants were able to achieve above chance level kappa coefficient (�̅�𝜅 ± 1.96 ×
𝜑𝜑(𝜅𝜅) > 0). Of the four participants, three were able to achieve a moderate agreement
45

within the first session (κ > 0.4). For sessions II and III, all participants achieved
accuracies above chance. Moderate agreement between intended and predicted selections
(κ > 0.4) was achieved in nine out of ten participants.
Table 4.1. Classification performance within individual sessions
Part
icip
ant
Sess
ion #
Features selected
Specificity (%)
Sensitivity (%)
Kappa 𝒌𝒌� ± ϕ(𝒌𝒌)
Information transfer rate
ITRNykopp (bits/trial)
Bit-rate (bits/min)
1 I II III
3 3 4
94.23 84.27 70.24
25.00 70.97 88.89
0.23 ± 0.19 0.53 ± 0.14 0.51 ± 0.13
0.05 0.21 0.23
0.16 0.65 0.73
2 I II III
1 3 2
78.26 75.00 82.93
71.43 86.11 94.74
0.43 ± 0.18 0.54 ± 0.13 0.72 ± 0.14
0.16 0.24 0.42
0.51 0.77 1.33
3 I II III
2 2 5
80.00 82.72 82.72
46.67 83.78 78.38
0.26 ± 0.17 0.63 ± 0.14 0.59 ± 0.14
0.05 0.30 0.25
0.16 0.93 0.78
4 I II III
2 4 2
32.65 77.03 71.62
72.73 71.88 68.00
0.03 ± 0.08 0.45 ± 0.14 0.34 ± 0.13
<0.01 0.15 0.10
0.01 0.49 0.31
5 I II III
4 1 1
36.84 83.13 71.80
100.00 91.89 90.91
0.27 ± 0.13 0.69 ± 0.14 0.58 ± 0.13
0.16 0.39 0.26
0.50 1.22 0.81
6 I II III
1 2 3
94.11 81.18 78.41
33.33 88.57 74.19
0.32 ± 0.20 0.63 ± 0.14 0.47 ±0.13
0.09 0.33 0.18
0.27 1.03 0.57
7 I II III
4 3 3
88.89 90.91 93.26
71.43 71.88 80.65
0.59 ± 0.21 0.63 ± 0.15 0.74 ± 0.16
0.26 0.29 0.41
0.82 0.91 1.28
8 I II III
4 2 3
85.42 82.98 75.29
36.36 72.72 77.14
0.22 ± 0.17 0.56 ± 0.16 0.47 ± 0.13
0.04 0.21 0.18
0.13 0.66 0.56
9 I II III
4 3 3
82.00 88.64 86.05
40.00 93.75 81.82
0.20± 0.16 0.76 ± 0.15 0.64 ± 0.15
0.04 0.48 0.31
0.12 1.53 0.99
10 I II III
4 2 2
93.88 83.75 88.37
54.55 94.87 82.35
0.52 ± 0.22 0.73 ± 0.15 0.68 ± 0.15
0.20 0.43 0.35
0.64 1.37 1.10
Average online performance
(sessions II and III) 81.44 ± 8.35
82.30 ± 7.39 0.60 ± 0.03 0.28 0.87
46

4.3.4 Dynamic Keyboard Output & User Feedback
The throughput for all three sessions of all participants are shown in Figure 4.8. The
average throughput for session I, II and III across participants were 0.04 ± 0.05, 0.30 ±
0.14, and 0.32 ± 0.10 characters/minute, respectively.
Figure 4.8. Average throughput in characters/minute for sessions I, II, and III for all participants.
Figure 4.9 depicts the edit distances for each session.
Figure 4.9. Edit distances for test blocks from Sessions I (left plot), II (middle plot) and III (right plot). The horizontal line on each graph indicates an edit distance of 18 where no input was observed.
47

Using a paired t-test, we compared the edit distances for the 10 participants at a rigorous
significance level of 0.01. In the session I test block, there was no significant difference
between edit distances for the no output case ( |𝑋𝑋∗| = 18 ) against distances when
something was spelled (p = 0.619). In other words, the composed output was distant from
the target output string. In session II, testing blocks 1 and 2 showed significant reduction
in edit distances below that achieved in session I (p = 0.001; p = 0.005), though there was
no significant difference between the edit distances of the two blocks (p = 0.019). In
session III, testing blocks 1 and 2 again showed significant improvement over session I
edit distances (p = 0.001; p < 0.001). In addition, there was no significant difference
between edit distances of the two testing blocks in session III (p = 0.790). Finally, there
was no significant difference between edit distances from the corresponding blocks of
sessions II and III (p ≥ 0.114). Table 4.2 gives an example of the normalized edit
distances and the actual output along with intended output messages.
Table 4.2 Sample normalized edit distance with corresponding actual and intended outputs
Normalized Edit Distance
Actual Output Intended Output
20.8 The to s Good morning 16.0 Wi Winter in January 12.0 Made ae Made it myself 6.5 Having Having fun
The correlation between tiredness levels and performance of all sessions were ascertained
through Spearman's coefficient (rs) [80]. There were no significant correlations between
the tiredness levels and edit space or throughput. In addition, there were no significant
correlations between tiredness and specificity or sensitivity. However, there was a
negative trend on the tiredness of the participant before the session and the specificity of
the testing blocks (rs = -0.314, n = 20, p = 0.177).
48

4.3.5 User Feedback
I A B C D E F 1
2
3
4
5
6
7
8
9
10
II A B C D E F 1
2
3
4
5
6
7
8
9
10
III A B C D E F 1
2
3
4
5
6
7
8
9
10
Very good / Very Good / Somewhat Okay Bad / Not really Very bad / Not at all
Figure 10.10. User feedback of sessions I, II, and III over the 10 participants. Each column represents the question corresponding with the survey from Appendix II. Each row represents each participant.
All participants reported the TCD headset to be very comfortable or somewhat
comfortable across all sessions. Participants’ opinions on the dynamic keyboard’s ease of
use improved over sessions II and III compared to that of session I, though not
significantly (p=0.157, p = 0.059 respectively). Participants’ opinion of the online TCD-
BCI system and their feelings after the usage did not differ much between all sessions
(p>0.100 for all). Opinions in regard to the online TCD-BCI system were mostly neutral
to positive and the user’s feelings after TCD-BCI usage were mostly neutral to positive as
well. Participants’ tiredness before and after each session did not differ significantly
across all three sessions (p>0.200 for all).
49

4.4. Discussion
4.4.1 Throughput of the Online TCD-based BCI Communication System
The throughputs for sessions two and three improved beyond those of session one,
approaching transmission rates of established BCI spelling devices (0.5 char/min) [81].
The observed combination of low throughput (Figure 4.8) and high kappa coefficient
(Table 4.1) can be attributed to the cost (temporal penalty) of a false-negative. If a bin
was unintentionally bypassed, the participant had to wait between 4 and 15 additional
slides before the target bin would be presented again. This wait time can translate into a
temporal penalty of several minutes for missing a selection, and is an inherent limitation
of scanning keyboards. Additional practice may help to decrease response latency.
Further, the Dynamic Keyboard interface could also be improved (e.g., context-specific
word prediction) to enhance the speed and accuracy of letter/word selection.
4.4.2 Feature Selection
Among the unilateral and bilateral features introduced to the feature set, some features
were consistently selected by the feature selection algorithm across all participants. For
most participants, the left lateralization of the mental task was pronounced. This finding
confirms previous reports of left hemispheric lateralization accompanying verbal fluency
tasks [11,41]. Due to the inherent lateralization, bilateral features were selected more
frequently, as shown in Figure 4.7, particularly features corresponding to differences
between the mean velocities of the left and right MCAs. Nine out of ten participants had
the two most frequent features (i.e. difference of MCA means at 5-10 seconds and 10-15
seconds) selected at least in one session. The difference in means between 10 and 15
seconds was the most frequently selected feature, followed by the difference in means
between 5 and 10 seconds. The selection frequency of the feature representing the
difference in the means between 0 and 5 seconds is considerably lower (Figure 4.7). This
50

is likely due to theinherent5 to 10 seconds hemodynamic delay post-mental activation
[59,60].
4.4.3 Classification of Word Repetition
All participants, except participant 3, improved in performance in sessions II and III
when compared to session I. This improvement is attributable in part to the increase of
training data available to the classifier. In addition, participants may have also become
more familiar and comfortable with the study protocol and the user-interface. A
longitudinal study of TCD-based BCI may help elucidate the effect of mental practice on
functional performance.
Other factors surrounding the experimental paradigm (e.g. fatigue, extended trial duration
or head motion) may have also impacted participant performance. For example,
participant 4 reported a lack of concentration and physical fatigue, which may explain the
lower accuracies for this individual.
4.4.4 Performance
The TCD-BCI was able to achieve an average bit-rate of 0.87 bits/min and a maximum of
1.53 bits/min. If the post-activation task 10 second recovery time was removed, the
average bit-rate would improve to 1.10 bits/min. In addition, if we are able to bring a
three-task TCD into an online setting, similar to the offline study by Aleem et al. [12],
assuming equal priors, we can further increase the bit-rate to 4.38 bits/min. Due to a lack
of published online TCD-BCIs at present, we compare our results to those of other
hemodynamic BCIs. Recent fMRI BCI studies using two-task algorithm attained an
average of 2 bits/min (~80% accuracy). Other fMRI BCI studies with a four-task
algorithm attained bit rates between 0.9 bit/min to 1.5 bits/min (~ 90% accuracies)
[82,83,84]. In comparison, our study achieved a comparable bit-rate with a much simpler
set-up. At present, EEG-BCIs still offer the most compelling bit-rates, typically in the
order of 15 – 30 bits/min [85,86].
51

The average throughput for session I was not significantly different from 0
characters/minute at a significance level of 0.01 (p = 0.022), which could have been due
to the lowered specificity and sensitivity across participants in session I. Throughput for
sessions II and III were significantly different from session I (p = 0.001; p < 0.001) and
from 0 characters/minute (p < 0.001; p < 0.001). This improvement may be due, in part,
to the user’s increasing familiarity with the keyboard, facilitating more skilled navigation
through the user interface. Given the temporal resolution of TCD and the sequential
nature of the dynamic keyboard, the throughput may have approached its theoretical limit
at 0.3 characters/minute. Without modification of the user interface and the temporal
window of data acquisition, further improvement of the throughput might not be possible.
Incidentally, the change in throughput from session II to III was not significant (p =
0.653), but this does not preclude further improvements over extended periods of
practice.
Similar to throughput, the edit distances for both session II and III improved significantly
beyond session I values. Within sessions II and III, the edit distances for the actual
outputs did not differ significantly. This suggested that the duration of TCD usage did not
affect the quality of the output as testing block 2 typically occurred an hour after initial
TCD set-up. Therefore, prolonged TCD usage may be possible provided that breaks are
provided every 15 ~ 20 minutes.
4.4.5 User Feedback Questionnaire
Feedback regarding the performance of the online TCD-BCI system was neutral to
positive (except for the first sessions for participants 2 and 5). Participants 4 and 8 both
indicated that they were “somewhat tired” prior to and “very tired” after every session.
The lack of energy prior to the session may have impacted participant performance with
the online TCD-BCI. The live feedback may have further frustrated the participants,
exacerbating their fatigue and diminishing their concentration, thus forming a negative
feedback loop that further impacted performance. However, the lack of significant overall
correlation between tiredness levels and performance in terms of specificity, sensitivity,
52
edit distance, and throughput suggest that user perceived fatigue did not directly impact
overall user performance.
4.4.6 Limitations
Within this study, the participant population was considerably homogeneous. All
participants were right-handed females who are naïve to the TCD-BCI system. With such
a restricted participant population, it could be difficult to interpret the extendibility of the
results into other populations such as a male population, individuals who are not naïve to
the TCD-BCI system, or individuals who are not right-handed. However, having such a
homogeneous sample will allow for comparison between restrictive factors such as
gender and handedness in future studies.
The inefficiency of the scanning keyboard undoubtedly constrained the observed BCI
accuracies. Scanning keyboards are frequently used as an interface for assistive
technology devices [87,88]. However, the existing keyboard interface was prone to long
delays in the event of incorrect selections. For example, for individuals who achieved
high accuracies (>85%), it was still difficult to spell the intended phrase within the
allotted time. Further improvement of the Dynamic Keyboard is necessary to achieve
more efficient communication in future studies. Additionally, the throughput could be
lower than reported if one takes into account the five minutes of break that is necessary
per every fifteen minutes of TCD usage.
One of the major determinants for participant performance was their motivation and
concentration. For participants who reported fatigue during specific sessions, (e.g. session
3, participant 4), the overall accuracy rates were lower compared to that of other
participants. For participants who maintained concentration during the testing session, on
the other hand, higher accuracies were observed (e.g. participant 7 and participant 9).
Despite the efforts to precisely locate the MCAs, unbalanced left and right CBFV
magnitudes were occasionally observed. Probe placement errors may contribute to lower
accuracies. Future TCD-BCI studies should endeavor to place the probes flush against the
53

skin overlying the temporal bone and establish the same physiological insonation depth
and sampling volume on either side of the head.
Another potential source of signal contamination for functional TCD studies is motion
artifact. Conspicuous facial movements may shift the TCD probes, resulting in
momentary or continuous deterioration of the recorded signals. Additionally, extensive
body movements e.g. swinging of the arms, crossing and uncrossing the legs, and shifting
body in the chair) may also introduce CBFV changes unrelated to the mental tasks at
hand. Moderate movements (e.g. moving hands, and shifting feet) were observed in many
participants during this experiment. However, the high classification accuracies achieved
suggest a level of robustness to these motion artifacts.
4.5. Conclusion
Using an online TCD-BCI system with an onscreen keyboard and combined word
repetition-motor imagery as the activation task, an average specificity and sensitivity of
81.44 ± 8.35% and 82.30 ± 7.39% were achieved with 10 able-bodied participants. The
agreement between the intended and machine-predicted selections was moderate (κ=0.60
± 0.03), with an average information transfer rate of 0.87 bits/min. The average
throughput was 0.35 ± 0.18 characters/min. These results support further investigation of
online bilateral TCD-BCI systems using intuitive language tasks.
54

Chapter 5
Conclusions
5.1 Contributions
This thesis explored transcranial Doppler Ultrasonography as an online brain-computer
interface system for communication purposes. The main contributions are as follow:
1. Compared different signal processing and classification methods for TCD system to
determine the best classification scheme for the following activation paradigm:
a. Task duration of 15s
b. Post-activation duration of 10s
Both of these temporal durations represent reductions from values reported in the TCD-
BCI literature. The selected signal processing algorithm extracted intuitive time-domain
features from TCD signals, selected the most useful of these features based on weighted
sequential forward selection based on F-score, and differentiated between the rest and
activation mental activities using Naïve Bayes classifier.
2. Explored the possibility of classifying two novel mental tasks in an online study while
demonstrating that classification accuracies are not significantly different from previous
TCD-BCI studies. The task paradigm was as follows:
a. Activation mental task: verbal repetition with associated motor imagery
b. Rest mental task: visual tracking of a graphical signal display
55

3. Investigated user-specific feature sets ranging from 1 to 5 features. This low
dimensionality and tailoring of the number of features allowed accurate performance with
as little data as possible.
4. Implemented the first online TCD-BCI system for communication purposes. The
system reached performance levels comparable to that of published off-line systems. In
particular, the following performance metrics were attained.
a. Both specificity and sensitivity of the online TCD-BCI exceeded 80% across
sessions II and III
b. A moderate level of agreement (κ=0.60 ± 0.03) was reached between the
intended and machine-predicted selections.
c. Information transfer rate of the system reached 0.87 bits/min.
d. Throughput of TCD-BCI controlled keyboard was 0.35 ± 0.18 characters/min,
which is a conservative estimate as participants were required to correct any
mistakes and only the correct outputs were considered for the throughput
calculation.
e. Although the edit distance indicated that none of the participants successfully
spelled the entire target message, significant improvements in message fidelity
were seen between sessions II and I, as well as sessions III and I.
5.2 Future Work
5.2.1 Evaluate User-Interface effects
Currently, there have been many types of user-interfaces designed for BCI signal
acquisition systems, none of which are particularly suited to a hemodynamic BCI. Given
the hemodynamic delay, any type of hemodynamic BCI will require an extremely
efficient user interface. The user interface must be intuitive and be able to disambiguate
56

the desired character with as few user selections as possible. In addition, the interface
should be clean, simple and uncluttered.
5.2.2 Evaluating the Effects of Practice on Performance
The effect of practice on user performance was not explored in this study. To determine
the optimal amount of training data and user training to achieve peak performance, two
types of longitudinal studies could be considered. First, one may entertain a dynamic
classifier that incorporates all previous and incoming online data as training data,
retraining the classifier periodically to determine the optimal amount of training data
required. Another longitudinal study might involve setting a static amount of training
data and analyze the effect of prolonged usage on system performance.
5.2.3 Testing in More Practical Situations
For this thesis, all data were collected under laboratory settings with minimal to no
distractions. However, for the system to be practical in everyday life, it is necessary to
conduct future tests in out-of-laboratory settings that expose the user to noise,
environmental lighting, presence of people, changes in temperature, and other
distractions.
5.2.4 Moving Towards the Target Population
While the ultimate goal is to create a novel BCI for individuals with severe motor
impairments, it may be helpful to first conduct an intermediate study on individuals who
have physical disabilities but retain a means of communication. For example, individuals
with upper spinal cord injuries. This type of recruitment will allow us to confirm the
participant’s precision in following the experimental protocol while providing some
indication of whether or not our results can be generalized to individuals with disabilities.
However, caution towards involuntary movements and spasms should be taken when
designing the system.
57

Chapter 6
References
[1] M. Sledz, M. Oddy, and J.G. Beaumont, "Psychological adjustment to locked-in
syndrome," Journal of Neurology, Neurosurgery & Psychiatry, vol. 78, no. 14, pp.
1407-1408, 2007.
[2] D. J. Higginbotham, H. Shane, S. Russell, and K. Caves, "Access to AAC: present,
past, and future," Augmentative and Alternative Communication, vol. 23, no. 3, pp.
243-257, 2007.
[3] B. Allison, E. Wolpaw, and J. Wolpaw, "Brain-computer interface systems: progress
and prospects," Expert Review of Medical Devices, vol. 4, pp. 463-474, 2007.
[4] D.J. Krusienski, E.W. Sellers, D.J. McFarland, T.M. Vaughan, and J.R. Wolpaw,
"Toward enhanced P300 speller performance," Journal of Neuroscience Methods,
vol. 167, no. 1, pp. 15-21, 2008.
[5] T. H. Falk, M. Guirgis, S. Power, and T. Chau , "Taking NIRS-BCIs outside the lab:
towards achieving robustness against environment noise," IEEE Transactions on
Neural Systems and Rehabilitation Engineering, vol. 19, no. 2, pp. 136-146, 2011.
[6] R. Sitaram, A. Caria , and N. Birbaumer, "Hemodynamic brain-computer interfaces
for communication and rehabilitation," Neural Networks, vol. 22, no. 9, pp. 1320-
1328, 2009.
[7] S. G. Mason, A. Bashashati, M. Fatourechi, K. F. Navarro, and G. E. Birch, "A
58

comprehensive survey of brain interface technology designs," Annals of Biomedical
Engineering, vol. 35, no. 2, pp. 137-169, 2007.
[8] S. Moghimi and T. Chau, "A review of EEG-based brain-computer interfaces as
access pathways for individuals with severe disabilities," Assistive Technology, vol.
25, no. 2, pp. 99-110.
[9] N. Birbaumer, A. Murguialday, and L. Cohen, "Brain-computer interface in
paralysis," Current Opinion in Neurology, vol. 21, no. 6, pp. 634-638, 2008.
[10] C.H. Tegeler and D. Ratanakorn, "Physics and principles," in Transcranial Doppler
ultrasonography. Boston, Massachusetts: Butterworth-Heinemann, 1999, pp. 3-11.
[11] A. J. B. Myrden, A. Kushki, E. Sejdic, A. Guerguerian, and T. Chau, "A Brain-
Computer Interface Based on Bilateral Transcranial Doppler Ultrasound," PLoS
ONE, vol. 6, no. 9, 2011.
[12] I. Aleem and T. Chau, "Towards a hemodynamic BCI using transcranial Doppler
(TCD) without user-specific training data," Journal of Neural Engineering, vol. 10,
no. 1, 2013.
[13] A. Faress and T. Chau, "Towards a multimodal brain-computer interface:
Combining fNIRS and fTCD measurements to enable higher classification
accuracy," Neuroimage, vol. 77, pp. 186-194, August 2013.
[14] S. G. Mason, "Brain-controlled switch for asynchronous control applications," IEEE
Transactions on Biomedical Engineering, vol. 47, pp. 1297-1307, 2000.
[15] K. Tai, S. Blain, and T. Chau, "A review of emerging access technologies for
individuals with severe motor impairments," Assistive Technology, vol. 20, pp. 204-
219, 2008.
59
[16] P. Haselager, R. Vlek, J. Hill, and F. Nijboer, "A note on ethical aspects of BCI,"
Neural Networks, vol. 22, pp. 1352-1357, 2009.
[17] J. R. Wolpaw et al., "BCI meeting 2005 - workshop on signals and recording
methods," IEEE Transacrtions on Neural Systems and Rehabilitation Engineering,
vol. 14, no. 2, pp. 138-141, 2006.
[18] C. de Negueruela, Broschart M., Menon C., and J.R. Millan, "Brain–computer
interfaces for space applications," Personal and Ubiquitous Computing, vol. 15, no.
5, pp. 527-537, 2011.
[19] E.C. Leuthardt, G. Schalk, J.R. Wolpaw, J.G. Ojemann, and D.W. Moran, "A brain-
computer interface using electrocorticographic signals in humans," Journal of
Neural Engineering, vol. 1, no. 2, pp. 63-71, 2004.
[20] E. Sellers and E. Donchin, "A P300-based brain-computer interface: initial tests by
ALS patients," Clinical Neurophysiology, vol. 117, no. 3, pp. 538-548, 2006.
[21] J. Mellinger et al., "An MEG-based brain–computer interface (BCI)," NeuroImage,
vol. 36, no. 3, pp. 581-593, 2007.
[22] N. Weiskopf et al., "Principles of a brain-computer interface (BCI) based on real-
time functional magnatic resonance imaging (fMRI)," IEEE Transactions on
Biomedical Engineering, vol. 51, no. 6, pp. 966-970, 2004.
[23] S. Coyle, T. Ward, C. Markham, and G. McDarby, "On the suitability of near-
infrared (NIR) systems for next-generation brain-computer interfaces,"
Physiological Measurement, vol. 58, no. 4, pp. 815-822, 2004.
[24] R. Aaslid, T.M. Markwalder, and H. Nornes, "Noninvasive transcranial Doppler
ultrasound recording of flow velocity in basal cerebral arteries," Journal of
Neurosurgery, vol. 57, no. 6, pp. 769-774, 1982.
60

[25] G. Tsivgoulis, A. Alexandrov, and M. Sloan, "Advances in transcranial Doppler
ultrasonography," Current Neurology and Neuroscience Reports, vol. 9, no. 1, pp.
46-54, 2009.
[26] L. Lowe and D. Bulas, "Transcranial Doppler imaging in children: sickle cell
screening and beyond," Pediatric Radiology, vol. 35, pp. 54-65, 2005.
[27] R. Panerai, "Transcranial Doppler for evaluation of cerebral autoregulation,"
Clinical Autonomic Research, vol. 19, no. 4, pp. 197-211, 2009.
[28] M. Saqqur, "Role of transcranial Doppler in neurocritical care," Critical Care
Medicine, vol. 35, pp. s216-s223, 2007.
[29] S. Sakar, S. Ghosh, S.K. Ghosh, and A. Collier, "Role of transcranial Doppler
ultrasonography in stroke," Postgraduate Medical Journal, vol. 83, pp. 683-689,
2007.
[30] D.V. Bishop, N.A. Badcock, and G. Holt, "Assessment of cerebral lateralization in
children using functional transcranial Doppler ultrasound (fTCD)," Journal of
Visualized Experiments, vol. 27, no. 43, p. 2161, 2010.
[31] L. Bracco et al., "Cerebral hemodynamic lateralization during memory tasks as
assessed by functional transcranial Doppler (fTCD) sonography: effects of gender
and healthy aging," Cortex, vol. 47, no. 6, pp. 750-758, 2010.
[32] F. J.C. Artal, C. V. Cabrera, and T. A. Horan, "Lateralization of cerebral blood flow
velocity changes during auditory stimulation: a functional transcranial Doppler
study," Applied Neuropsychology, vol. 11, no. 3, pp. 167-174, 2004.
[33] P.C. Njemanze, C.R. Gomez, and S. Horenstein, "Cerebral lateralization and color
perception: a transcranial Doppler study," Cortex, vol. 28, no. 1, pp. 69-75, 1992.
61

[34] P.C. Njemanze, "Cerebral lateralization and general intelligence: gender differences
in a transcranial Doppler study," Brain and Language, vol. 92, no. 3, pp. 234-239,
2005.
[35] A. Myrden, A. Kushki, E. Sejdic, and T. Chau, "Towards increased data
transmission rate for a three-class metabolic brain-computer interface based on
transcranial Doppler ultrasound," Neuroscience Letters, vol. 528, no. 2, pp. 99-103,
2012.
[36] Hemodynamics AG, TCD simulator, 2008.
[37] P.D. Syme, "The use of Transcranial Doppler ultrasonography as a 'cerebral
stethoscope' for the assessment and treatment of acute stroke," The Journal - Royal
College of Physicians of Edinburgh, vol. 36, pp. 17-28, 2006.
[38] L. Edvinsson, Cerebral blood flow and metabolism, 2nd ed. New York, NY, USA:
Raven Press, 1993.
[39] N. Stroobant and G. Vingerhoets, "Transcranial Doppler ultrasonography monitoring
of cerebral hemodynamics during performance of cognitive tasks: a review,"
Neuropsycology Review, vol. 10, no. 4, p. 213, 2000.
[40] P. Haydon and G. Carmignoto, "Astrocyte control of synaptic transmission and
neurovascular coupling," Physiological Reviews, vol. 86, no. 3, pp. 1009-1031,
2006.
[41] G Vingerhoets and N Stroobant, "Lateralization of cerebral blood flow velocity
changes during cognitive tasks. a simultaneous bilateral transcranial Doppler study,"
Stroke, vol. 30, pp. 2152-2158, 1999.
[42] Compumedics, DWL Transcranial Doppler: QL Software, 2009.
62

[43] T.R. Nelson and J.S. Abramowics, "Ultrasound biosafety considerations for the
practicing sonographer and sonologist," Journal of Ultrasound in Medicine, vol. 28,
pp. 139-150, 2009.
[44] The Safety Group of the British Medical Ultrasound Society, "Guidlines for the safe
use of diagnostic ultrasound equipment," The British Medical Ultrasound Society,
November 2009.
[45] T.O. Zander, C. Kothe, S. Jatzev, and M. Gaertner, "Application for Brain-Computer
Interfaces," in Human-Computer Interaction Series, J. Karat and J. Vanderdonckt,
Eds. London Dordrecht Heidelberg New York: Springer, 2010, ch. 6, pp. 90-93.
[46] B. Sorger, J. Reithler, B. Dahmen, and R. Goebel, "A real-time fMRI-based spelling
device immediately enabling robust motor-independent communication," Current
Biology, vol. 22, pp. 1333-1338, July 2012.
[47] CanAssist, Dynamic Keyboard, 2008.
[48] C.A. Porro et al., "Primary motor and sensory cortex activation during motor
performance and motor imagery: a functional magnetic resonance imaging study,"
The Journal of Neuroscience, vol. 16, no. 23, pp. 7688-7698, December 1996.
[49] A.S.M. Salinet, T.G. Robinson, and R.B. Panerai, "Active, passive, and motor
imagery paradigms: component analysis to assess neurovascular coupling," Journal
of Applied Physiology, vol. 114, pp. 1406-1412, February 2013.
[50] J. Levy et al., "Piecemeal recruitment of left-lateralized brain areas during reading:
A spatio-functional account," NeuroImage, vol. 43, no. 3, pp. 581-591, November
2008.
[51] J.R. Wolpaw, N. Birbaumer, D.J. McFarland, G. Pfurtscheller, and T.M. Vaughan,
"Brain-computer interfaces for communication and control," Clinical
63

Neurophysiology, vol. 113, pp. 767-791, 2002.
[52] S. Sarkar, S. Ghosh, S. Ghosh, and A. Collier, "Role of transcranial Doppler
ultrasonography in stroke," Postgraduate Medical Journal, vol. 83, no. 985, pp. 683-
689, 2007.
[53] B. Reinsfelt et al., "Transcranial doppler microembolic signals and serum marker
evidence of brain injury during transcatheter aortic valve implantation," Acta
Anaesthesiologica Scandinavica, vol. 56, no. 2, pp. 240-247, 2012.
[54] H. White and B. Venkatesh, "Applications of transcranial Doppler in the ICU: a
review," Intensive Care Medicine, vol. 32, no. 7, pp. 981-994, 2006.
[55] A Haag, N Moeller, S Knake, A Hermsen, and W Ortel, "Language lateralization in
children using functional transcranial Doppler sonography," Dev Med Child Neurol,
vol. 52, pp. 331-336, 2009.
[56] A JO Whitehouse, N Badcock, M Groen, and D VM Bishop, "Reliability of a novel
paradigm for determining hemispheric lateralization of visuospatial function,"
Journal of the International Neuropsychological Society, vol. 15, pp. 1028-1032,
2009.
[57] R Aaslid, "Visually evoked dynamic blood flow response of the human cerebral
circulation," Stroke, vol. 18, pp. 771-775, 1987.
[58] R.B. Buxton and F.R. Lawrence, "A model for the coupling between cerebral blood
flow and oxygen metabolism during neural stimulation," Journal of Cerebral Blood
Flow and Metabolism, vol. 17, pp. 64-72, 1997.
[59] I. Szirmai, I Amrein, L. Palvolgyi, R. Debreczeni, and A. Kamondi, "Correlation
between blood flow velocity in the middle cerebral artery and EEG during cognitive
effort," Cognitive Brain Research, vol. 24, pp. 33-40, 2005.
64

[60] A.G. Harders, G. Laborde, D.W. Droste, and E. Rastogi, "Brain activity and blood
flow velocity changes: a transcranial Doppler study," International Journal of
Neuroscience, vol. 47, pp. 81-102, 1989.
[61] A. Alexandrov, M. Sloan, L.K. Wong, C. Douville, and A. Razumovsky, "Practice
standards for transcranial Doppler ultrasound: Part I - test performance," Journal of
Neuroimaging, vol. 17, no. 1, pp. 11-18, 2007.
[62] BMUS Safety Group, "Guidelines for the safe use of diagnostic ultrasound
equipment," Ultrasound, vol. 18, pp. 52-59, 2010.
[63] D. Foley and J. Sammon, "An optimal set of discrimination vectors," IEEE
Translactions on Computers, vol. 24, pp. 281-289, 1975.
[64] R.O. Duda, P.E. Hart, and D.G. Stork, Pattern Classification. New York: John
Wiley & Sons, 2012.
[65] K.A. Mamun et al., "A robust strategy for decoding movements from deep brain
local field potentials to facilitate brain machine interfaces," Biomedical Robotics and
Biomechatronics (BioRob), 2012 4th IEEE RAS & EMBS International Conference
on, pp. 320-325, 2012.
[66] C. Bishop, Pattern Recognition and Machine Learning, 1st ed.: Springer, 2006.
[67] F. Pereira, T. Mitchell, and M. Botvinick, "Machine learning classifiers and fMRI: a
tutorial overview," NeuroImage, vol. 45, pp. S199-209, 2009.
[68] I. Rish, "An empirical study of the naive Bayes classifier," in Proceedings of IJCAI-
01 workshop on Empirical Methods in AI, Sicily, Italy, 2001, pp. 41-46.
[69] G.R. Muller-Putz, R. Scherer, C. Brunner, R. Leeb, and G. Pfurtscheller, "Better
than random? A closer look on BCI results," International Journal of
65

Bioelectromagnetism, vol. 10, no. 1, pp. 52-55, 2008.
[70] E. Thomas, M. Dyson, and M. Clerc, "An analysis of performance evaluation for
motor-imagery based BCI," Journal of Neural Engineering, pp. doi:10.1088/1741-
2560/10/3/031001, May 2013.
[71] A. Schlögl, J. Kronegg, J. E. Huggins, and S. G. Mason, "Evaluation criteria in BCI
research," in Towards Brain-Computer Interfacing. USA: MIT Press, 2007, ch. 19,
pp. 327-342.
[72] J. Cohen, "A coefficient of agreement for nomnal scales," Educational and
Psychological Measurement, vol. 20, pp. 37-46, 1960.
[73] E.V.C. Friedrich, R. Scherer, and C. Neuper, "The effect of distinct mental strategies
on classification performance for brain-computer interfaces," International Journal
of Psychophysiology, vol. 84, no. 1, pp. 86-94, 2012.
[74] H. Danker-Hopfe et al., "Interrater reliability between scorers from eight European
sleep laboratories in subjects with different sleep disorders," Journal of Sleep
Research, vol. 13, no. 1, pp. 63-69, 2004.
[75] P. Anderer et al., "An E-Health solution for automatic sleep classification according
to Rechtschaffen and Kales: Validation study of the Somnolyzer 24x7 utilizing the
Siesta Database," Neuropsychobiology, vol. 51, pp. 115-133, 2005.
[76] D. Sankoff and J.B. Kruskal, Time wraps, string edits, and macromolecules: the
theory and practice of sequence comparison. Massachusetts, USA: Addison Wesley
Publishing Company, April 1983, ch. 1, p. 00.
[77] A. Marzal and E. Vidal, "Computation of normalized edit distance and applications,"
IEEE Trans. Pattern Analysis and Machine Intelligence, vol. 15, no. 9, pp. 926-932,
September 1993.
66

[78] A. Weigel and F. Fein, "Normalizing the weighted edit distance," in Proc. 12th
IAPR Int'l Conf. Pattern Recognition, vol.2, October 1994, pp. 339 - 402.
[79] Y.J. Li and B. Liu, "A normalized Levenshtein distance metric," IEEE transactions
on pattern analysis and machine intelligence, vol. 29, no. 6, pp. 1091-1095, June
2007.
[80] B.W. Brown and M. Hollander, Statistics: A Biomedical Introduction. New York,
USA: John Wiley and Sons, Inc, 1977.
[81] N. Birbaumer et al., "A spelling device for the paralysed," Nature, vol. 398, pp. 297-
298, 1999.
[82] S.S. Yoo et al., "Brain–computer interfaceusingfMRI: spatialnavigationbythoughts,"
Neuroreport, vol. 15, no. 10, pp. 1591-1595, 2004.
[83] S.M. LaConte, S.J. Peltier, and X.P. Hu, "Real-time fMRI using brain-state
classificatoin," Human Brain Mapp, vol. 28, no. 10, pp. 1033-1044, 2007.
[84] L. Minati, A. Nigri, C. Rosazza, and M.G. Bruzzone, "Thoughts turned into high-
level commands: Proof-of-concept study of a vision-guided robot arm driven by
functional MRI(fMRI) signals," Medical Engineering & Physics, vol. 34, pp. 650-
658, 2012.
[85] K. Kansaku, N. Hata, and K. Takano, "My thoughts through a robot's eye: an
augmented reality-brain-machine interface," Neuroscience Research, vol. 66, no. 2,
pp. 219-222, 2010.
[86] E. Donchin and Y. Arbel, "P300 based brain computer interfaces: a progress report,"
in Foundations of Augmented Cognition. Neuroergonomics and Operational
Neuroscience. Berlin Heidelberg: Springer, 2009, pp. 724-731.
67

[87] D. Jans and S. Clark, Augmentative communication in practice: an introduction, A.
Wilson, Ed. Edinburgh: CALL Centre, United Kingdom: University of Edinburgh,
1994.
[88] G.W. Lesher, B.J. Moulton, and J.D. Higginbotham, "Techniques for augmenting
scanning communication," Augmentative and Alternative Communication, vol. 14,
no. 2, pp. 81-101, 1998.
68

Appendix
Appendix I: Criteria Questionnaire
Participant #: Date:
REB #:
Please answer the following questions to the best of your knowledge:
Do you have or have you had any cardiovascular disease?
a) yes b) used to c) no
Do you have or have you had any respiratory problem?
a) yes b) used to c) no
Do you have a history of migraine?
a) yes b) used to c) no
Have you had any head injury?
) yes b) no
69

Appendix II: Survey Template
Participant #: ______________________
REB #: ____________________________
The following questions are related to your experience with using the online TCD
communication system:
A. Overall, what did you think of the online TCD system?
a) very good b) good c) okay d) bad e) very bad
B. How comfortable was the TCD apparatus?
a) very b) somewhat c) not really d) not at all
If it was a bit uncomfortable, what was the reason?
C. How easy was the Dynamic Keyboard to use?
a) very b) somewhat c) not really d) not at all
D. How do you feel after using the system?
a) very good b) good c) okay d) bad e) very bad
E. How tired did you feel before the study?
a) very b) somewhat c) not really d) not at all
70

F. How tired do you feel after the study?
a) very b) somewhat c) not really d) not at all
Any comments you would like to make?
Thank you for participating in the study!
71

Appendix III: Post Study Questionnaire
Participant #: ________________
REB #: ___________________
1.) Have you ever had a systemic rheumatologic illness (e.g. endocarditis - inflammation
of the inner layer of the heart, vasculitis - inflammatory destruction of blood vessels)?
2.) Have you ever had a seizure disorder?
3.) Have you ever had a CNS infection (e.g. meningitis)?
4.) Have you ever had a traumatic brain injury?
5.) Do you require a pacemaker or electronic medical implants?
6.) Have you ever received treatment for a psychiatric, behavioural or language disorder
(e.g. ADHD, conduct disorder, Tourette Disorder, Obsessive Compulsive Disorder,
recurrent major depression, schizophrenia, bipolar disorder, drug dependence, autism,
delay in learning to speak, stuttering, dyslexia, problems understanding)?
7.) Do you exhibit a fear of enclosed spaces (not liking elevators, small rooms etc.)?
72