development of bio-hybrid three wheeled auto-rickshaw …cistup.iisc.ac.in/presentations/research...
TRANSCRIPT

Final Report
Development of Bio-Hybrid Three wheeled Auto-Rickshaw for Urban Transportation
Submitted to:
CiSTUP Indian Institute of Science Bangalore-560012, India
By
Investigator(s) from IISc: Dr.R.T.Naik and Prof.G.K.Anathasuresh
Co-investigator(s) from other connected Agency: - NA
From: Name: Dr.R.T.Naik and Prof.G.K.Anathasuresh Department: Mechanical Engineering Indian Institute of Science Bangalore–560012, India
March, 2013
1

Centre for infrastructure, Sustainable Transport and Urban Planning Indian Institute of Science, Bangalore – 560 012
FORMAT FOR THE INTERIM REPORT ON CiSTUP FUNDED PROJECTS. 1. Title of the Project: Development of Bio-Hybrid Three Wheeled Auto-Rickshaw for Urban Transportation. 2. Scheme Code No.: CIST/MME/RTN/0031 3. Principal Investigator-Name & Department. Dr.R.T.Naik Department of Mechanical Engineering Indian Institute of Science Bangalore-560012, India. Co-Investigator (If any)-Name & Department. Prof.G.K.Anathasuresh Department of Mechanical Engineering Indian Institute of Science Bangalore-560012, India. 4. Date of Commencement: 01-04-2011
Project Duration: Two Years
Ending Date of the Project. 31-03-2013
5. Discussion/Summary of work carried out (Explaining Deliverables, Implementation etc. with List and future direction.) ---2 to 5 Pages--- 5.1. Introduction In large cities in Asia particularly in India millions of auto-rickshaws operated under taxi-services. But, these three-wheelers cause lot of air pollution and produce large amounts of green house gasses. The drivers of these vehicles shown in the figure.1constitute mainly the lower income groups in society who earn around Rs 100–150 per day. Locally people will address these three wheeled rickshaw as Auto.
Figure.1: Three-wheeled Auto-Rickshaw with 2S Gasoline Engine
2

Here it is aimed to make these autos more efficient through the use of an affordable add-on hybrid system. The fuel economy improvement objectives are 40%–60% without loss of vehicle Performance with lower emissions which improve air quality in Indian cities and also influences the social and economic situation of threes auto drivers and people in general. In the year 2010 there were about 35 million Gasoline-engine-power two-wheelers and about 3.5 million petrol- and diesel-powered three wheelers. Since then the population is estimated to be grown at a rate of about 22% per annum [3]. If we assume that an auto-rickshaw runs approximately 55–75 Km/day with a fuel consumption of 24–32 Km/l, then the fuel consumption is approximately 1.98 liter/day and CO2- emissions are 1.95 liter/day and alternate fuel gas will be 5.5 Kg/day. If a hybrid system added on to the conventional drive train would save fuel of at least 43%, then the total amount of CO2-reduction for 1 million autos would be 2 million Kg/day. If the CO2-reduction would be traded on the concern market, then the saved CO2-emissions against Rs.1800/1000Kg [4] would be worth approximately 3600 thousand rupees, and on a yearly basis (assume 300 days in operation per year) approximately 1100 million rupees. 5.2. Literature Review In various literatures many design concepts for three wheeled vehicles can be seen [1,2]. The completely battery driven rickshaw, which has been developed in India discussed [3].The electric vehicle has a zero emission range of 60–80 Km (60%–80% depth-of-discharge) [4]. The maximum speed is 30 Km/h. The electric motor size is 1.2 kW and the battery pack consists of a 3 lead-acid batteries with a total capacity of 100 Ah with a package mass of 96 Kg. The cost price of the conventional rickshaw in mass production is estimated to be between Rs.85, 000–1, 20,000. In this study we are aiming at a fuel saving of at least 42% for a hybrid system with a cost price in mass production between Rs.25,000-50,000. The additional cost of CO2-emissions reduction per day would be approximately Rs.16,000/Kg.In comparison with the full-electric vehicle this would be around Rs.20, 000/Kg CO2 reduction. Using these assumptions the hybrid system could be more cost-effective while the vehicle performance is not compromised [5]. The main objective of this proposal is to make the existing Auto Rickshaw more efficient through the use of an affordable add-on hybrid system. Hybrid electric battery propulsion technology is being promoted as more cost effective, more reliable and more energy efficient than conventional petrol and other alternative fuel options [6]. Usually Hybrid electric battery vehicle (HEV) will have a power unit, such as an engine (diesel, gasoline or natural gas reciprocating engine), one or more electrical machines (motor or generators) and an Energy storage system, which can be charged by the engine or by regenerative braking[7].In this study, a concept design evaluation study for the innovative hybridization of auto explored along with different hybrid concepts are evaluated and compared by simulation using a quasistatic simulation method [8]. A conceptual design for the hybrid system will be presented. 6. Results and Discussions of the Work 6.1. Vehicle Modeling and Powertrain The vehicle is equipped with a two-stroke 145.45 cc single cylinder SI engine with a maximum crankshaft power of 5.15 kW. The maximum engine efficiency is typically 20% and 22% for an optimized engine with a LPG kit [9]. The transmission consists of a four speed manual gearbox
3

with a reverse gear, and a wet-plate clutch. The kerb mass of the vehicle is 285 Kg and the maximum payload is 325 Kg. Since, the actual vehicle data (roll and air drag resistance) is yet unknown, estimated values are used for the vehicle parameters. In Table I an overview of the vehicle specifications is listed. The actual fuel efficiency map is also yet not available. Therefore, the engine efficiency map of a 1.0 l SI engine is downsized to meet the specifications of the 145 cc 2-stroke engine. Thereby, the efficiency values of the 1.0-l engine are linearly down-scaled, where the maximum efficiency becomes 20% corresponding to the typical maximum value of a two-stroke engine. The transmission and the final drive efficiency are both average constant 95% assumed.
Table.1: Specifications: Bajaj RE Two stroke Gasoline Auto-Rickshaw S.No Item Name Specifications I Engine No of cylinders One Strokes Two Cooler Air cooled Max.power 7 HP Max.Torque 12 Nm @3500 rpm II Transmission Forward gear 4 Reverse gear 1 Gear ratios 0.18, 0.32, 0.50, 0.85 Primary ratio 0.86 Final Drive ratio 0.22 III Clutch Type Wet Discs multi IV Breaks Front and rear Hydraulic V Weights & Measures Gross vehicle weight 600 kg VI Chassis and dimensions Monocoque Overall length 2621 mm Over width 1300 mm Overall height 1700 mm Wheel base 1995 mm Ground clearance 181 mm Turning radius 2850 mm VII Tyres 4-8 PR Roll resistance 0.013 Air drag coefficient 0.42 Frontal surface area 2.0 m2 VIII Electric system System Voltage 12 V Alternator output 13 V, 33A @3500 rpm IX Fuel economy Mileage within a city 19 Km/liter Mileage on the highway 24 Km/liter Average traveled distance 42 to 58 Km/day Maximum speed 54–78 Km/h X Fuel tank capacity 8 liters Gas tank travel distance 142 Km to 185 Km Oil must be added to every liter 18 to 48 ml/liter
4

6.2. Drive cycle and drive power demand It is found that auto-rickshaws in the traffic conditions in inner-city areas run at only 15–18 Km/h. This cause severe emission pollution, since the conventional power trains are designed to run efficiently at 41–48 Km/h.Furthermore, the pollution is increased more by frequently starting and stopping of the rickshaw in the traffic. Hence, the drive cycle plays an important role in the design of the hybrid drive train, since it determines the operations points of the power source. Furthermore, on an average the auto-rickshaws travel about 55–65 Km per day. The Federal Test Procedure FTP-75 has been used to mimic the usage of the rickshaw, because of its more dynamic behavior compared to the Indian drive cycle. In addition, the FTP-75 has been modified by reducing the top speed to 50 Km/h. The average drive cycle speed is 19 Km/h, which correspond to the average inner-city traffic situations. Using this drive cycle and the vehicle parameters as listed in Table.1, the vehicle wheel torque can be calculated as follows:
with the wheel speed
The drive power demand becomes, Pv(t) = Tv(t) ¢ !v(t) (3) In Figure 2, the modified FTP-75 and the drive power demand calculated with Equation (3) as a function of time is shown. The fuel economy using the drive power demand, the drive cycle, and pre-scribed gear box shifts can be calculated. In addition, the maximum output of the alternator is estimated to be 12:5 V ¢ 35 A = 437 W. For the simulation an average electrical load of 210 W is assumed.
Figure.2: Drive cycle and power demand as a function of time
The fuel economy in l/100Km as a function of time is shown in Figure 3. The fuel economy over the modified FTP-75 becomes 3.5 l/100Km, or 28 Km/l. Idle fuel cut-off is assumed during braking. If the engine is stopped at vehicle standstill, then an absolute or relative fuel saving could be realized of 0.22 l/100Km or approximately 6% respectively. The fuel consumption for engine restart is not included. The fuel economy with start stop and idle fuel cut-off during braking is 31 Km/l.
5
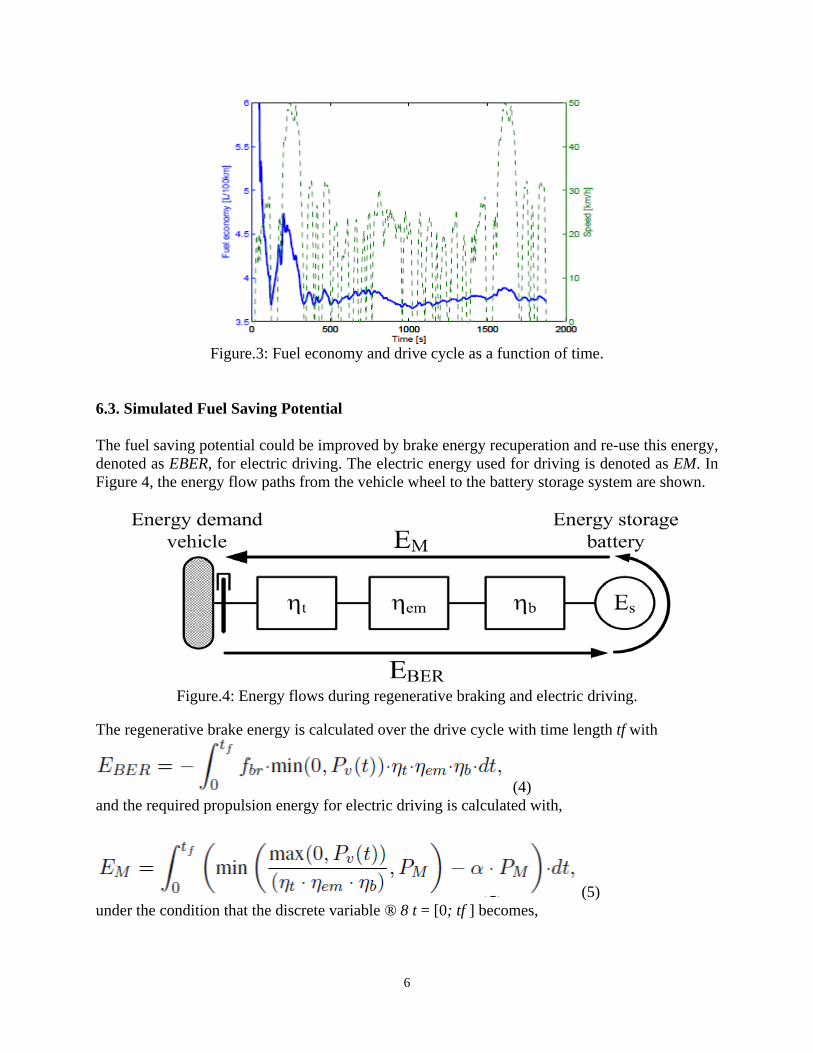
Figure.3: Fuel economy and drive cycle as a function of time.
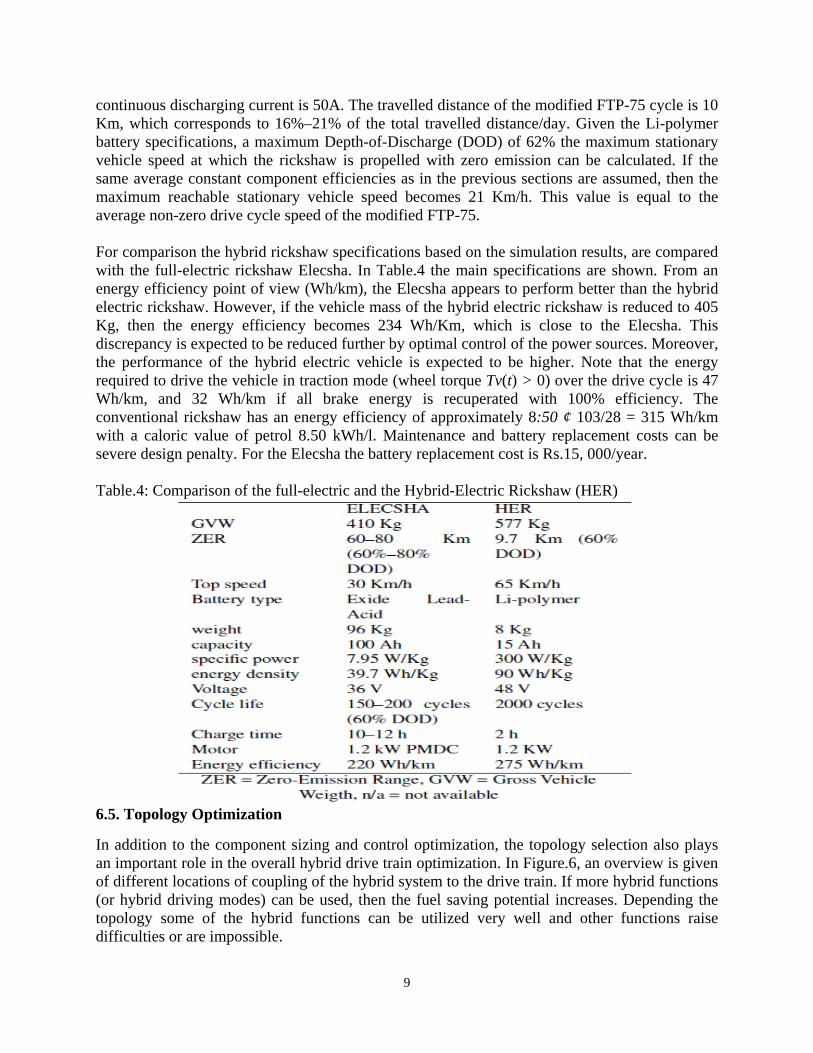
6.3. Simulated Fuel Saving Potential The fuel saving potential could be improved by brake energy recuperation and re-use this energy, denoted as EBER, for electric driving. The electric energy used for driving is denoted as EM. In Figure 4, the energy flow paths from the vehicle wheel to the battery storage system are shown.
Figure.4: Energy flows during regenerative braking and electric driving.
The regenerative brake energy is calculated over the drive cycle with time length tf with
(4) and the required propulsion energy for electric driving is calculated with,
(5) under the condition that the discrete variable ® 8 t = [0; tf ] becomes,
6

(6) The storage power up to which the brake energy can be used for pure electric driving, denoted as PoM , becomes,
(7)
(8) In Table.2 the required electric machine size (kW) based on the maximum generative braking power, i.e and the fuel economy improvement (including start-stop at vehicle stand still) are shown as a function of regenerative brake fraction fbr. The transmission ´t, the electric motor ´em and battery efficiency ´b are 98%, 85%, and 80% average constant assumed. The engine is assumed to shut off and has no drag losses during braking and electric driving. It can be observed, that the fuel saving potential and the required electric machine size are strongly affected by the regenerative brake fraction. Table.2: Fuel saving potential as a function of regenerative brake fraction and electrical loads.
The total relative fuel saving potential with a 1.2 kW electric machine size, 50% regenerative brake fraction including start-stop, engine off and disengaged during electric braking and driving, and 210 W electrical loads becomes 13%. Although, the electric machine is specified at 1.2 kW only 484 W is used for propulsion during electric driving. In Figure.5, the operation points of the electric machine over de drive cycle for the electric-only modes are plotted. The maximum drive power up to which the rickshaw is propelled by the electric machine is 484W and the maximum braking power at the wheels is -1.25 kW. If the electrical loads are zero, then the fuel economy improvement is 21%, which is still too low because to objective is to realize at least 42% fuel saving. However, the vehicle model used in this section needs to validated and the strategy is not optimal and the fuel saving could be further improved, which is defined as future research. Furthermore, as will be shown in Section 5 that the idle startstop function without fuel cut-off during braking only already fuel consumption
7

reduction gives of 14%. This in contrary to the 6% estimated on the modified FTP-75 in this section. It is likely that the engine efficiency estimated is too high in this section, and, therefore, the actual fuel savings for the full-hybrid solution are also expected to be much higher.
Figure.5: Operation points of the electric machine. 6.4. Energy Storage Specification Many different battery technologies are available on the market, ex. Lead-Acid SLA, NiCd, NiMH, Li-ion, Lipolymer battery technologies. The Lead-Acid batteries are safe, but have lower energy and power density specifications compared to the other battery technologies. NiMH battery, which is more expensive, has a good efficiency has become a mature technology and is a well-accepted storage technologies for hybrid vehicle applications. Li-ion batteries have a high energy, power density and efficiency specification, but are expensive. This type of battery have a narrow overcharge tolerance. Continuously charging over the maximum voltage limitation would damage the battery performance (cycle life) and could result in firing, or explosion. In Table.3 an overview of different battery specifications is shown. Table.3: Battery Technologies
In Table.3, an overview of different battery specifications is shown. Among Li- polymer technologies the lithium iron phosphate (LiFePO4) is seen as a suitable battery technology for large capacity and high power applications. The LiFePO4 is characterized by faster charging (two times faster), a large overcharge tolerance (0.7 V from it charging voltage plateau 3.4 V), and a longer cycle life (2000 cycles, five times larger) compared to conventional Li-ion batteries. However, these batteries are still relative expensive, i.e., approximately Rs.35, 000 /kWh. On the Asian market LiFePO4 batteries are available. We have selected the Li-polymer battery with a nominal voltage of 48V and a capacity of 15Ah.The energy density is 90 Wh/Kg. The maximum
8
continuous discharging current is 50A. The travelled distance of the modified FTP-75 cycle is 10 Km, which corresponds to 16%–21% of the total travelled distance/day. Given the Li-polymer battery specifications, a maximum Depth-of-Discharge (DOD) of 62% the maximum stationary vehicle speed at which the rickshaw is propelled with zero emission can be calculated. If the same average constant component efficiencies as in the previous sections are assumed, then the maximum reachable stationary vehicle speed becomes 21 Km/h. This value is equal to the average non-zero drive cycle speed of the modified FTP-75. For comparison the hybrid rickshaw specifications based on the simulation results, are compared with the full-electric rickshaw Elecsha. In Table.4 the main specifications are shown. From an energy efficiency point of view (Wh/km), the Elecsha appears to perform better than the hybrid electric rickshaw. However, if the vehicle mass of the hybrid electric rickshaw is reduced to 405 Kg, then the energy efficiency becomes 234 Wh/Km, which is close to the Elecsha. This discrepancy is expected to be reduced further by optimal control of the power sources. Moreover, the performance of the hybrid electric vehicle is expected to be higher. Note that the energy required to drive the vehicle in traction mode (wheel torque Tv(t) > 0) over the drive cycle is 47 Wh/km, and 32 Wh/km if all brake energy is recuperated with 100% efficiency. The conventional rickshaw has an energy efficiency of approximately 8:50 ¢ 103/28 = 315 Wh/km with a caloric value of petrol 8.50 kWh/l. Maintenance and battery replacement costs can be severe design penalty. For the Elecsha the battery replacement cost is Rs.15, 000/year. Table.4: Comparison of the full-electric and the Hybrid-Electric Rickshaw (HER)
6.5. Topology Optimization In addition to the component sizing and control optimization, the topology selection also plays an important role in the overall hybrid drive train optimization. In Figure.6, an overview is given of different locations of coupling of the hybrid system to the drive train. If more hybrid functions (or hybrid driving modes) can be used, then the fuel saving potential increases. Depending the topology some of the hybrid functions can be utilized very well and other functions raise difficulties or are impossible.
9

Figure.6: Overview topology design options for parallel hybrid drive train.
ICE=Internal Combustion Engine, FT=Fuel Tank, CL=Wet-plate clutch, MT=Manual Transmission, BAT = Battery, Aux = Auxiliaries, S/A = Starter/Alternator. Table.5: Topology Design Options
In Table.5 an overview is given of the process and consequences of the simple different topologies. From this qualitative comparison it can be concluded that topology 1, 3, and 5 perform the same and are therefore favorable. In the following sections, the design of the developed microhybrid systems for a 2-stroke Bajaj auto is presented. Although, with a full-hybrid solution the full saving potential is likely to be much higher, the investment costs are also higher compared to a hybrid system. 6.6. Design and Working Principle of the Micro-Hybrid System In the hybrid system is designed in order to reduce fuel consumption and emissions of a Bajaj 2RE three wheeler. Moreover, the micro hybrid system is specially designed as a retrofit ‘kit’, i.e., the kit can be installed in a used auto. The main working principle of the micro hybrid system is the start-stop functionality. Especially, in crowded city areas (see, Figure 7), vehicles are frequently standing still in front of traffic lights and in traffic jams. During these periods, no
10

power from the engine is requested and engine idling is therefore a waste of fuel and the engine produces unnecessary polluting emissions. The hybrid system is able to stop the engine from running when no power is requested and start the engine quickly again when the driver is going to drive away. In order to stop the engine, the electric circuit of the sparkplug will be opened and further ignitions will be prevented. Due to the friction of the piston and the compression of the fuel mixture, the engine stops. As soon as the driver is going to drive away, the micro-hybrid system will start the engine within a very short time i.e less than 500 ms) instance where after it can be used to propel the vehicle.
Figure.7: Auto-rickshaws during high traffic hours
Figure.8 shows the motor compartment and drive train of the auto and the designed micro-hybrid system prototype installed on the engine. The micro-hybrid system is connected to the flywheel housing and the flywheel itself. There are a couple reasons for this position: (i) the system must be connected to the crankshaft, (ii) the flywheel is not fully covered in the original engine, and (iii) virtually no changes have to be made on the original engine in order to connect the micro hybrid system.
Figure. 8: Motor compartment with the micro-hybrid system (green) connected to the engine. Figure.9 shows an exploded view of the mechanical part of the micro-hybrid system. The used electric machine for the prototype is a 600 W brushed DC motor that operates on 12 V nominal (1). This electric machine is mounted on a frame (3) and kept in place with a holder (2). The frame has a couple functions: (i) it functions as housing for the gear set, (ii) as connection for the electric machine and (iii) as connection for the hybrid kit on the original engine with the connectors (4). The gear set (7, 12, 11) is needed to adapt the angular velocity of the electric machine to the angular velocity of the engine and to increase the torque that is needed to start the engine. The requested torque depends on the acceleration of the crankshaft and flywheel, the compression of the air/fuel mixture, and the friction of the piston within the cylinder for the prototype system. The final gear (11) is connected to the axle (9), which is connected to the flange (10), which is mounted on the flywheel. This final gear (11) runs freely in one direction, and allows to run the engine without driving the electric machine thereby eliminating additional friction losses.
11

Figure.9: Exploded view of the micro-hybrid system.
Figure.10: Manufactured mechanical parts of the micro-hybrid system prototype.
6.7. Performance of the Microhybrid System By stopping the engine from running at moments where no drive power is requested, will prevent unnecessary emissions and fuel consumption. In order to simulate the usage of the autos within a crowded city, a drive cycle has been constructed (based on measurements performed in India). This drive cycle is plotted in the upper part of Figure.11 and shows the speed (m/s) as function of time. During the drive cycle with a total time of 12 minutes, the speed is equal to 0 km/h for 232 seconds (idling time). This is plotted in red in the lower part of Figure 11.The periods where no power is requested from the engine do not only contain the idling periods, but also the phases where the auto is decelerating. The periods where no engine power is required is indicated with the green line. The total amount of time where no engine power is requested is 300 seconds on this cycle.
12

Figure.11: Drive cycle (blue) with idling phases indicated with a red line and zero power phases indicated with a green line.
6.8. Fuel Consumption and Emission Reduction Potential Using the start-stop function of the micro-hybrid system, on the drive cycle as shown in Figure 11, implies that 14% can be saved with shutting off the engine during the idling phases and 21% (or 34 grams of fuel) by stopping the engine when no propulsion power is requested, e.g., during braking. Figure.12 shows the fuel consumption of the auto during the first part of the drive cycle with (red) and without (blue) the effect of the micro-hybrid system during the idling phases. It can be observed that the fuel consumption during the idling periods reduces to 0 g/s with the hybrid system, while the original fuel consumption is approximately 0.1 g/s during these periods.
Figure.12: Fuel consumption of the original engine and with the hybrid system during the drive
cycle. 6.9. Comparison of Simulated Drive Cycles The ICE conventional rickshaw model was designed to replicate the baseline for comparison to all the alternative powered vehicles and main results for comparison based upon the rickshaw drive cycles. The “LP FC” and “HP FC” columns represent the low and high power FC hybrid configurations. “Conv” represents the conventional model. LP means Gas and HP means hybrid.
13
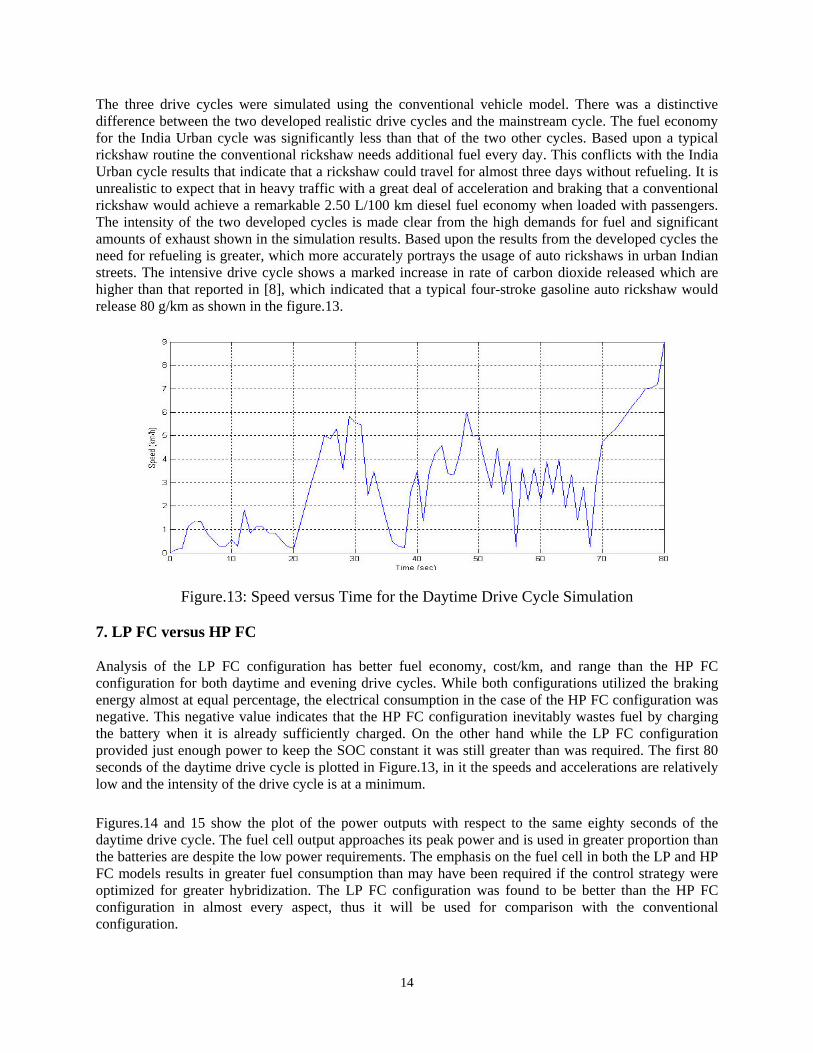
The three drive cycles were simulated using the conventional vehicle model. There was a distinctive difference between the two developed realistic drive cycles and the mainstream cycle. The fuel economy for the India Urban cycle was significantly less than that of the two other cycles. Based upon a typical rickshaw routine the conventional rickshaw needs additional fuel every day. This conflicts with the India Urban cycle results that indicate that a rickshaw could travel for almost three days without refueling. It is unrealistic to expect that in heavy traffic with a great deal of acceleration and braking that a conventional rickshaw would achieve a remarkable 2.50 L/100 km diesel fuel economy when loaded with passengers. The intensity of the two developed cycles is made clear from the high demands for fuel and significant amounts of exhaust shown in the simulation results. Based upon the results from the developed cycles the need for refueling is greater, which more accurately portrays the usage of auto rickshaws in urban Indian streets. The intensive drive cycle shows a marked increase in rate of carbon dioxide released which are higher than that reported in [8], which indicated that a typical four-stroke gasoline auto rickshaw would release 80 g/km as shown in the figure.13.
Figure.13: Speed versus Time for the Daytime Drive Cycle Simulation 7. LP FC versus HP FC Analysis of the LP FC configuration has better fuel economy, cost/km, and range than the HP FC configuration for both daytime and evening drive cycles. While both configurations utilized the braking energy almost at equal percentage, the electrical consumption in the case of the HP FC configuration was negative. This negative value indicates that the HP FC configuration inevitably wastes fuel by charging the battery when it is already sufficiently charged. On the other hand while the LP FC configuration provided just enough power to keep the SOC constant it was still greater than was required. The first 80 seconds of the daytime drive cycle is plotted in Figure.13, in it the speeds and accelerations are relatively low and the intensity of the drive cycle is at a minimum. Figures.14 and 15 show the plot of the power outputs with respect to the same eighty seconds of the daytime drive cycle. The fuel cell output approaches its peak power and is used in greater proportion than the batteries are despite the low power requirements. The emphasis on the fuel cell in both the LP and HP FC models results in greater fuel consumption than may have been required if the control strategy were optimized for greater hybridization. The LP FC configuration was found to be better than the HP FC configuration in almost every aspect, thus it will be used for comparison with the conventional configuration.
14
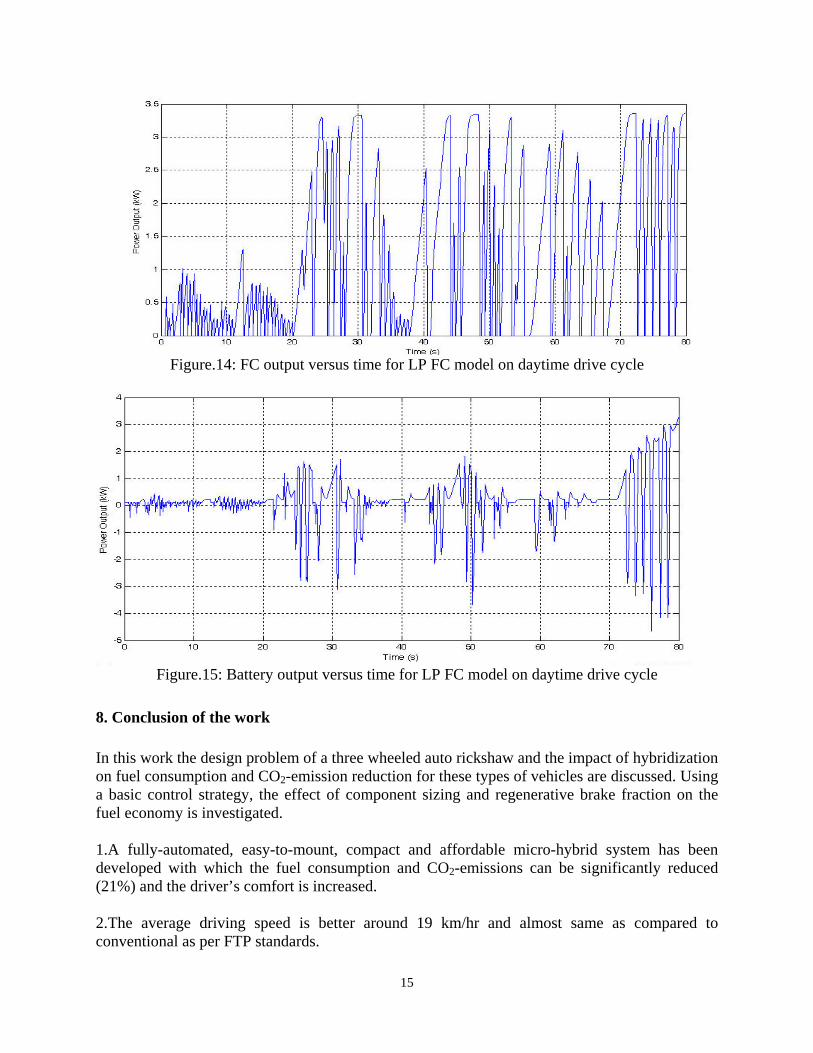
Figure.14: FC output versus time for LP FC model on daytime drive cycle
Figure.15: Battery output versus time for LP FC model on daytime drive cycle
8. Conclusion of the work In this work the design problem of a three wheeled auto rickshaw and the impact of hybridization on fuel consumption and CO2-emission reduction for these types of vehicles are discussed. Using a basic control strategy, the effect of component sizing and regenerative brake fraction on the fuel economy is investigated. 1.A fully-automated, easy-to-mount, compact and affordable micro-hybrid system has been developed with which the fuel consumption and CO2-emissions can be significantly reduced (21%) and the driver’s comfort is increased. 2.The average driving speed is better around 19 km/hr and almost same as compared to conventional as per FTP standards.
15

3. The fuel economy was reduced by 6% at higher speeds due to proper driving cycles. 4. The total relative fuel saving potential with a 1.2 kW could be due to the more efficiency of the electric machine. 5.Li-ion batteries have a high energy, power density and efficiency specification, but are expensive. However, the efficiency is higher compared to other battery systems. 6. Qualitative comparison it can be concluded that topology 1, 3, and 5 perform the same and are therefore favorable due to the increase of fuel saving potential. 7. The fuel consumption during the idling periods reduces to 0 g/s with the hybrid system, while the original fuel consumption is approximately 0.1 g/s during these periods 8. It was found that the LP FC configuration is better than the HP FC model in both performance and cost due to intensity of rickshaw driving is captured more accurately by the two developed drive cycles as opposed to a standard urban drive cycle. 9. The significant advantage of both FC models compared to ICE rickshaws is their lack of carbon dioxide emissions. 10.The operating cost of FC hybrid rickshaws significantly higher than the conventional one since most rickshaws are privately owned and do not generate significant income the higher initial investment and operating costs currently. 11.The various bio-hybrid systems shown that potential utilization for reducing the emissions of the Urban Transportation and also improving the engine efficiency and low fuel economy. 9. Scope of Future Work
Hybridization can also be done with other fuels with other modeling for the more efficiency.
10. Acknowledgement
Authors acknowledge the CiSTUP for funding this project.
11. References: 1.A. Rajvanshi, “Cycle rickshaws as a sustainable transport system for developing countries,” Human Power, Technical journal of the IHPVA, no. 49, pp. 15–18, 2000. 2.F. Caricchi, L. D. Ferraro, F. G. Capponi, O. Honorati, and E. Santini, “Three-wheeled electric maxi-scooter for improved driving performance in large urban areas,” in Proc. of the IEEE Electric Machines and Drives Conference, vol. 3, pp. 1363–1368, June 2003. 3.Weeks Update India, “New petrol/diesel price India New Delhi, Mumbai, Bangalore, Chennai, Kolkata”, 2009.
16

17
4.M. Alam, T. Moeller, and A. Maly, “Converions of an Indian three weeler scooter into a hybrid fuel cell Ni-MH battery vehicle and validation of the vehicle model for the Bajaj three wheeler scooter,” in Proc. of the IEEE Conference on Electric and Hybrid Vehicles, 2006. 5.Y.Wu, B. Chen and K. D. Huang, “The effect of control strategy and driving pattern on the fuel economy and exhaust emission of a hybrid electrical bus”, SAE World Congress: Advanced Hybrid Vehicle Powertrains, Detroit, Michigan, 2008. 6.M.C.Kisacikoglu, M. Uzunoglu and M. S. Alam, “Fuzzy logic control of a fuel cell/battery/ultra-capacitor hybrid vehicular power system”, Proc. IEEE Vehicle Power and Propulsion Conference, Arlington, Texas, 2007. 7.P. Mulhall, M. Naviwala, S. M. Lukic, J. Braband and A. Emadi, “Entrepreneurial projects program at Illinois Institute of Technology: solar/battery hybrid three-wheel auto rickshaw for India”, Proc. IEEE Vehicle Power and Propulsion Conference, Arlington, Texas, 682-689, 2007. 8.M. S. Alam, T. Moelle and A. Maly, “Conversion of an Indian three wheeler scooter into hybrid fuel cell Ni-MH battery vehicle and validation of the Vehicle model for the Baja three wheeler scooter”, Proc. IEEE Conference on Electric and Hybrid Vehicles, Pune, India, 2006. 9.Y. Gurkayank, O.Onar,A.Khaligh,“A photovoltaic battery powered electric rickshaw for Indian market”,SAE World Congress:Advanced Hybrid Vehicle Powertrains,Detroit,USA,2009. 10.T.V. Ramachandra and Shwetmala, “Emissions from India’s transport sector: Statewise synthesis”, Atmospheric Environment, Vol. 43, No. 34, 5510-5517, 2009. 11.S. Lukic, P. Mulhall, G. Choi, M. Naviwala, S. Nimmagadda, and A. Emadi “Usage pattern development for three-wheel auto Rickshaw taxis in India”, Proc. IEEE Vehicle Power and Propulsion Conference, Arlington, Texas,610-616, 2007. 12.M. Alam, T.Taher,M.Khader, A. Lateef, R. Kizilel, “Analysis and hardware development of a novel prototype hybrid PEM fuel cell Li-Ion battery scooter”, Proc. IEEE Conference on Electric and Hybrid Vehicles, Pune, India, 2006. 13.Gair, S, A.Cruden, J. McDonald, and B. Hredzak, Electronic differential with sliding mode controller for a direct wheel drive electric vehicle, Pro.of IEEE International Conf.on Mechatronics, 98-103, 2004. 14.Perez-Pinal, F. J., C. Nunez, R. Alvarez, U. Cervantes, and A. Emadi, Differential for traction applications in Proc.of IEEE Vehicle Power and Propulsion Conf., Arlington,771-776, 2007. 15.Rajkumar, P., Effect of air pollution on respiratory system of auto rickshaw drivers in Delhi, Indian Journal of Occupational and Environmental Medicine, Vol. 3, No. 4, 171-3, 1999. 12. Signature of the Principal Investigator/Investigator: