diffuse photon pr - university of pennsylvania _boas.pdfiv boas dius e ph ot on prob e s of t urbid...
TRANSCRIPT
DIFFUSE PHOTON PROBES OF STRUCTURAL AND DYNAMICAL
PROPERTIES OF TURBID MEDIA
THEORY AND BIOMEDICAL APPLICATIONS
David A Boas
A DISSERTATION
in
PHYSICS
Presented to the Faculties of the University of Pennsylvania in Partial Fulllment of
the Requirements for the Degree of Doctor of Philosophy
Arjun G Yodh
Supervisor of Dissertation
Robert Hollebeek
Graduate Group Chairperson
COPYRIGHT
David Alan Boas

ABSTRACT
DIFFUSE PHOTON PROBES OF STRUCTURAL AND DYNAMICAL
PROPERTIES OF TURBID MEDIA
THEORY AND BIOMEDICAL APPLICATIONS
David A Boas
Arjun G Yodh
Diusing photons can be used to detect localize and characterize optical and
dynamical spatial inhomogeneities embedded in turbid media Measurements of the
intensity of diuse photons reveal information about the optical properties of a system
Speckle uctuations carry information about the dynamical and optical properties
This dissertation shows that simple diusion theories accurately model the intensity
and speckle correlation signals that diuse through turbid media with spatially varying
properties and discusses possible biomedical applications
We rst look at the intensity of diuse photons provided by a light source that is
intensity modulated This generates diuse photon density waves DPDWs which
exhibit classical wave behavior We demonstrate experimentally and theoretically the
refraction diraction and scattering of DPDWs Using accurate signal and noise
models we then present a detailed analysis which shows that DPDWs can be used
to detect and locate objects larger than mm and to characterize objects larger than
cm which are embedded inside turbid media with biologically relevant parameters
This diuse photon probe should may nd applications in medicine as a bedside
brain hematoma monitor or for screening breast cancer or other functional imaging
applications
We then consider the coherence properties of the diuse photons as revealed by
speckle intensity uctuations and show that the temporal autocorrelation function of
these uctuations is accurately modeled by a correlation diusion equation Because
the correlation diusion equation is analogous to the photon diusion equation all
concepts and ideas developed for DPDWs can be directly applied to the diusion of
correlation We show experimentally and with Monte Carlo simulations that the dif
iii

iv Boas Diuse Photon Probes of Turbid Media Theory and Applications
fusion of correlation can be viewed as a correlation wave that propagates spherically
outwards from the source and scatters from macroscopic spatial variations in dynam
ical andor optical properties We also demonstrate the utility of inverse scattering
algorithms for reconstructing images of the spatially varying dynamical properties of
turbid media The biomedical applicability of this diuse probe is illustrated with
examples of monitoring blood ow and probing the depth of burned tissue
ACKNOWLEDGEMENTS
My time spent working on this dissertation has been lled with good times during
which I learned and grew intellectually and personally It is with great pleasure that
I acknowledge the many people that made this experience possible and enjoyable
Without my advisors Arjun Yodh and Britton Chance I would have missed the
exciting developments in biomedical diuse optics that have taken place during the
last four years and the unique combination of applying their physical and physiological
insights Arjun has exposed me to the power of brainstorming that is the process
of viewing a particular problem from every imaginable angle drawing connections
to related problems and then weeding the abundance of ideas down to a few that
warrant further pursuit I hope that I have acquired this ability from Arjun as well as
the critical thinking and excitement with which he approaches scientic projects My
interactions with Brit complemented well my interactions with Arjun Second opinions
as well as the rst are a valuable commodity and Brits are not to be taken lightly
which is why I treasure the opportunities to discuss new and continuing projects with
him Brits uncanny ability to sort through numerous ideas seemingly similar and
orthogonal and pursue a long term goal has kept me pointed in the right direction at
times when forces were pulling me every which way A treasure chest of new research
projects is a curse without the ability to stay focussed on a welldened track I am
also grateful to Brit for the many opportunities that he directed my way despite my
sometimes hesitant approach His faith in my abilities has gone a long way towards my
intellectual growth Let me not forget to acknowledge the many wonderful sailing and
windsurng trips with Olympic gold medalist Britton Chance I am deeply indebted
to Arjun and Brit for their guidance I hope to utilize the skills and knowledge that
they have passed to me and pursue a healthy scientic career
I thank the faculty of the Department of Physics and Astronomy and the Depart
ment of Biochemistry and Biophysics for exposing me to their respective disciplines
in and out of the class room I single out Michael Cohen for his sharing with me
the joys of becoming intimate with Bessel functions and the rest of my dissertation
v

vi Boas Diuse Photon Probes of Turbid Media Theory and Applications
committee Tom Lubensky Charlie Johnson and Larry Gladney for their time and
interest in my dissertation research
The support from Britton Chances right hand voice feet and artistic consultant
respectively Dot McGovern Pat Daley Henry Williams and Mary Leonard have
made this dissertation possible through their eorts to keep our work funded and the
lab atmosphere friendly I appreciate their eorts as well as the eorts of Bill Penney
Alan Bonner and Mike Carmen in the Biophysics Shop for their four years of teaching
me the ins and outs of a machine shop
Maureen OLeary has been a friend and colleague during my ve years in graduate
school starting with qualifying exam preparation through the ups and downs of
research and the excitement and turmoil of writing a dissertation I am happy to
have had the opportunity to work through so many challenges with Maureen I am
also grateful to have had various interactions with postdocs and graduate students
Hanli Liu Peter Kaplan Tony Dinsmore Joe Culver Bill Angerer Kristin Jester
Jining Qi and Ming Kao Chunhua Xie and Yunsong Yang in and out of the lab
including the many hiking expeditions with Ravi Sachidanandam
Visiting scholar Larry Campbell made strong contributions to my understanding of
photon correlation spectroscopy through our many detailed discussions on the subject
His tendency to question every confusing aspect of a problem is admirable and on many
occasions led me to new levels of understanding I hope that I have acquired some
of his tenacity Laura Zemany and Igor Meglinsky were especially helpful with the
correlation measurements of ow in turbid media I am indebted to Norm Nishioka
Kevin Schomaker and Tom Deutsch of the Wellman Institute for the opportunity to
apply correlation techniques to a clinical problem
I am indebted to Mary Leonard for her help with many of the gures that appear
in this dissertation and to Arjun Yodh and Naomi Nagy for their comments on drafts
of this dissertation
I wish to thank my mother Karen for stimulating and encouraging my joy for
problem solving which has lead me to where I am today I thank my father Raymond

Acknowledgements vii
for teaching me my rst computer program in which enabled me to solve ever
more complicated problems
Naomi Nagy has provided a constant supply of support and encouragement and
most importantly has helped me realize that seemingly impossible goals are easily
achieved through condence and a positive outlook I owe my future to her

Contents
Introduction
The Migration of Diuse Photon Density Waves through Highly
Scattering Media
Diusion Approximation to the Transport Equation
Diuse Photon Density Waves
Interaction with FreeSpace Boundaries
Refraction and Diraction of Diuse Photon Density Waves
Refraction at planar interfaces
Refraction and diraction by spherical inhomogeneities
Scattering of Diuse Photon Density Waves
An Analytic Solution
Experimental Verication of the Analytic Solution
Scattering from Multiple Objects
SemiInnite Media
General Heterogeneous Media
TimeDomain Measurements
Photon Migration within the P Approximation
P Theory
Comparison of P and Diusion Theories
Summary
viii

Contents ix
Practical Limits to the Detection Localization and Characterization
of Optical Inhomogeneities with Diuse Photon Density Waves
The Models
Analytic Solution for the Signal
Noise Models
Description of Simulations
Detection and Localization
Detection of Absorbing Objects
Detection of Scattering Objects
Characterization
Characterization of Absorbing Objects
Characterization of Scattering Objects
Optimizing the Experimental Design
Optimizing Measurement Geometry
Optimal Modulation Frequency
Utilizing Spectral Information
Measurements at Multiple Optical Wavelengths
Summary
Correlation Diusion
Introduction
Theory
Single Scattering
Multiple Scattering Diusing Wave Spectroscopy
Correlation Transport and Correlation Diusion
Ergodicity
Experimental Results
Validity of Diusion Equation for Media with Spatially Varying
Brownian Motion
Imaging Media with Spatially Varying Brownian Motion

x Boas Diuse Photon Probes of Turbid Media Theory and Applications
Validity of Diusion Equation for Media with Spatially Varying
Flow Properties
Monte Carlo Simulations
Homogeneous Media with Brownian Motion
Media with Spatially Varying Brownian Motion
Media with Random Flow
Summary
Biomedical Applications for Correlation Diusion
Blood Flow Monitoring
Burn Diagnosis
Experiments on Phantoms
Clinical Work
Experimental Methods
Measuring Diuse Photon Density Waves
Experimental
Monte Carlo
Photon Correlation Spectroscopy Techniques
Experimental
Monte Carlo
Making Resin Phantoms
Recipe for Resin Phantoms
Molds
Machining
Warnings
Summary
A PN Approximation Method
A Photon Transport Equation

Contents xi
A P and Diusion Approximation
A P Approximation
A Correlation Transport Equation
B HenyeyGreenstein Phase Function
C Monte Carlo Code
C montec
C ranc
C ranc
C ran c

List of Tables
Fits of the Analytic Scattering Theory to Experimental Measurements
Results of Fitting for the Optical Properties
Tissue Burn Depths
Conguration of Parallel Port
xii
List of Figures
Photon Transport
Experimental Observation of Diuse Photon Density Waves
Extrapolated Zero Boundary Condition
Method of Images for SemiInnite Media
Refraction of Diuse Photon Density Waves by a Planar Interface
Diraction of Diuse Photon Density Waves by Spherical Absorbers
Diraction Model and Ray Optics Model
Experimental Observation of Refraction and Diraction by Spherical
Scatterers
Diagram of Diuse Photon Density Waves Scattering from Spherical
Objects
Diuse Photon Density Wave Sensitivity Curves
Validation of the Analytic Scattering Theory
Fitting the Analytic Scattering Theory to Experimental Measurements
Fitting for the Optical Properties
Summary of Fits for Optical Properties
PulseTrain and Power Spectrum
Comparison of Diusion Theory and P Theory for Optical Character
ization Versus Absorption Coecient
Comparison of Diusion Theory and P Theory for Optical Character
ization Versus Modulation Frequency
xiii

xiv Boas Diuse Photon Probes of Turbid Media Theory and Applications
Experimental System for Investigating the Limits to Detection Local
ization and Characterization
Sources of Noise in the Amplitude and Phase of Diuse Photon Density
Waves
Detection of Absorbing Objects
Smallest Detectable Absorbing Objects
Detection of Scattering Objects
Smallest Detectable Scattering Objects
Simultaneous Characterization of the Object Diameter and Absorption
Coecient
Contributions of the Dierent Multimoments of the Scattered Diuse
Photon Density Wave
Simultaneous Characterization of Object Diameter and Scattering Coef
cient
Optimizing the SourceDetector Geometry for Object Characterization
Moments Analysis of Optimizing SourceDetector Geometry
Optimal Modulation Frequency for Characterizing Absorbing Objects
Optimal Modulation Frequency for Characterizing Scattering Objects
Utilizing Multiple Modulation Frequencies for Characterizing Absorb
ing and Scattering Objects
ChiSquared Valleys
Universal Curve for Optical Characterization
Speckles
Single Scattering Setup
Multiple Scattering Setup
Pulsed DiusingWave Spectroscopy
Ensemble Averaged Correlation Function from a Nonergodic System
Experimental Setup for Heterogeneous Brownian Motion
Correlation Scattering from a Spherical Inhomogeneity Raw Data

List of Figures xv
Correlation Scattering from a Spherical Inhomogeneity
Correlation Scattering for Dierent Optical Properties
Correlation Scattering for Dierent Brownian Diusion Coecients
Tomographic Image of Brownian Motion
Experimental Setup of Flow through a Cylindrical Vein
Correlation Measurements of Flow in a Cylindrical Vein
Monte Carlo Simulations of Correlation Diusion Homogeneous Media
Breakdown of the Correlation Diusion equation Homogeneous Media
Monte Carlo Spherical Object Setup
Monte Carlo Results for Spatially Varying Brownian Motion
Total Momentum Transfer Distribution
Monte Carlo Results for Spatially Varying Brownian Motion and Ab
sorption
Monte Carlo Results for Spatially Varying Brownian Motion and Scat
tering
Random Flow
Absorption Spectra of Oxy and Deoxy Hemoglobin and Water
Setup for Cu Ischemia Experiments
Correlation Function Measured with Dierent Cu Pressures
Measured Flow Correlated with Blood Deoxygenation and Volume
Schematic of Burn Phantom
Schematic of Experimental Setup for Burn Study
Burn Phantom g for Dierent SourceDetector Separations
Burn Phantom g for Dierent Burn Thicknesses
Burn Phantom Summary of Decay Rates
Solution of Diusion Equation for Layered Media
Comparison of Correlation Diusion Theory and Burn Phantom Data
Setup for Pig Experiments
Preburn Measurements

xvi Boas Diuse Photon Probes of Turbid Media Theory and Applications
Correlation Functions for Hour Old Burns
Comparison of Dierent Burns
Experimental System for Measuring Diuse Photon Density Waves
Stepper Motor Driven Translation Stage
Circuit Diagram for Stepper Motor Controller
Monte Carlo Flow Chart
Experimental Setup for Photon Correlation Spectroscopy
Setup for Ensemble Averaging

Chapter
Introduction
The potential to acquire information about tissue optical and dynamical properties
noninvasively oers exciting possibilities for medical imaging For this reason the
diusion of near infrared photons NIR in turbid media has been the focus of substan
tial recent research Applications range from pulse oximetry
to tissue characterization to imaging of breast and brain tumors
and to probing blood ow Presently pulsetime amplitude
modulated and continuous wave sources of light are used to
probe turbid media for optical anomalies such as tumors and hematomas
These procedures are complicated by the fact that light does not travel ballistically
through turbid media Rather photons experience many scattering events prior to
their absorption or transmission through boundaries For many biological tissues the
absorption length for NIR light is much longer than the scattering length Furthermore
the scattering length is much smaller than the dimensions of the sample In this
case the migration of photons is accurately described as a diusional process These
conditions are met in breast tissue for which the reduced scattering coecient s
which is the reciprocal of the photon random walk step is approximately cm
and the absorption coecent a which is the reciprocal of the photon absorption
length is approximately cm
An intensity modulated source of light produces a wave of light energy density
which propagates spherically outwards from the source through the turbid medium

Boas Diuse Photon Probes of Turbid Media Theory and Applications
This intensity wave is called a diuse photon density wave DPDW
Although microscopically the photons are diusing and have thus lost memory of
their initial direction macroscopically the photons combine incoherently to produce a
scalar wave of light energy density with a well dened phase front The wavelength of
the DPDW depends on the optical properties and source modulation frequency and is
around cm for typical biological samples and modulation frequencies MHz
The optics of DPDWs have been well dened in the recent literature
In particular studies of the distortion of DPDWs by optical
inhomogeneities demonstrate that heterogeneities may be found and characterized by
measuring distortions in the DPDW wavefront
In a dierent vein when a photon scatters from a moving particle its frequency
is Dopplershifted by an amount that is proportional to the speed of the scattering
particle and dependent on the scattering angle relative to the velocity of the scatterer
Under certain conditions it is possible to measure these small frequency shifts caused
by Doppler scattering events Thus it is possible to noninvasively measure particle
motions and density uctuations in a wide range of systems Applications include
measuring the Brownian motion of suspended macromolecules veloci
metry of ow elds and invivo blood ow monitoring
Methods for using light to measure ow and density uctuations have appeared
with numerous names including Photon Correlation Spectroscopy Dynamic Light
Scattering QuasiElastic Light Scattering and Diusing Wave Spectroscopy
These methods basically fall into two categories Doppler methods
and speckle methods The Doppler methods measure the Doppler broadening of the
laser light linewidth directly using tunable optical lters Speckle methods monitor
the intensity uctuations that arise from the beating of electric elds with slightly
dierent frequencies This is analogous to the acoustic beat notes that a musician
uses to tune a musical instrument The two dierent methods essentially give access
to the same information as is discussed by Briers
Intensity and Dopplerspeckle probes of random media are connected since they
Chapter Introduction
both rely on the behavior of the migrating photons The two dierent probes require
dierent equipment since the rst measures the average intensity and the other indir
ectly measures the light coherence properties but I show that the measured signals
can be accurately predicted and quantied using analogous diusion models
Spectroscopic intensity probes have been used since the s to measure blood
oxygenation noninvasively and to detect hematomas and various breast cancers Non
invasive monitoring of average blood oxygenation is successful and widely accepted
Detection of hematomas and cancers has also been successful but is not widely ac
cepted because of the inability to accurately characterize the anomalies To improve
anomaly characterization it is necessary to have models which accurately predict the
migration of photons through turbid media with spatially varying optical properties
The photon diusion model has been shown to work well as I will show
in this dissertation
Photon correlation spectroscopy specically speckle probes but including Dop
pler probes because of their similarity is successfully used in industry and biology for
measuring and monitoring particle size aggregation gelation and ow in optically
dilute and concentrated samples Medical applications include monitoring blood ow
and diagnosing the viability of burned tissue Quantication of correlation signals
from turbid samples has been limited to systems with spatially uniform optical and
dynamical properties The models I present here which permit the quantitative ana
lysis of signals from samples with spatially varying properties increase the range of
applicability for photon correlation spectroscopy
The work I present here is a unication of intensity and speckle probes of turbid
media By treating themwith similar theoretical models ideas and concepts developed
for one probe to be easily applied to the other probe Chapter reviews the photon
diusion model discusses macroscopic scalar wave solutions that arise in this model
otherwise known as diuse photon density waves including the scattering of diuse
photon density waves from macroscopic heterogeneities and experimentally demon
strates the validity and accuracy of this model Chapter presents a signaltonoise
Boas Diuse Photon Probes of Turbid Media Theory and Applications
analysis which reveals the power and practical limits to the detection localization
and characterization of optical inhomogeneities using diuse photon density waves
Chapter presents a diusion equation for correlation and experimentally demon
strates its validity and accuracy for turbid media with spatially varying Brownian
motion ow and optical properties Chapter discusses two biomedical applica
tions for correlation diusion monitoring blood ow and probing tissue burn depths
Chapter describes the experimental methodology used throughout

Chapter
The Migration of Diuse Photon Density Waves through Highly
Scattering Media
When light enters a highly scattering or turbid medium such as a cloud milk or
tissue the photons do not simply reect back from or transmit through the medium as
they would for a pane of glass Instead the individual photons scatter many times and
thus trace out random paths before escaping from or being absorbed by the medium
In this chapter I consider the collective properties of these scattered photons When
the intensity of a point source in a turbid medium with uniform optical properties is si
nusoidally modulated a macroscopic wave of photon density develops and propagates
spherically outwards from the source Although microscopically the individual photons
follow random walklike trajectories macroscopically a coherent photon density wave
is created
After experimentally verifying the existence of these waves I examine their re
fraction at planar interfaces between media with dierent optical properties and their
refraction and diraction by objects with dierent optical properties than the sur
rounding media I show that the perturbation of the diuse photon density wavefronts
is captured by standard refraction diraction and scattering models
The theoretical basis of this work derives from the photon diusion equation The
radiative transport equation is a more accurate model for the migration of photons
in general but is typically dicult to handle I start this chapter by reviewing the

Boas Diuse Photon Probes of Turbid Media Theory and Applications
assumptions that reduce the general transport equation to a diusion equation The
classical wave behavior of DPDWs is then considered At the end of the chapter
the breakdown of the diusion approximation is considered as well as higher order
approximations to the transport equation
Diusion Approximation to the Transport Equation
The linear transport equation for photons propagating in media that scatters and
absorbs photons is
v
Lr t
trLr t tLr t s
ZLr tf d Sr t
Lr t is the radiance at position r traveling in direction at time t with units
of W m sr sr steradian unit solid angle The normalized phase function
f represents the probability of scattering into a direction from direction
v is the speed of light in the medium and t s a is the transport coecient
where s is the scattering coecient and a is the absorption coecient Sr t
is the spatial and angular distribution of the source with units of W m sr The
photon uence is given by
r t Z
dLr t
The photon ux or current density is given by
Jr t Z
dLr t
Both the uence and the ux have units of W m The linear transport equation
neglects coherence and polarization eects Recently however Ackerson et al have
successfully included coherence eects within a transport model Photon
polarization within the transport equation has also been considered by Fernandez and
Molinari
Chapter Migration of Diuse Photon Density Waves
drr
Ω
Ω
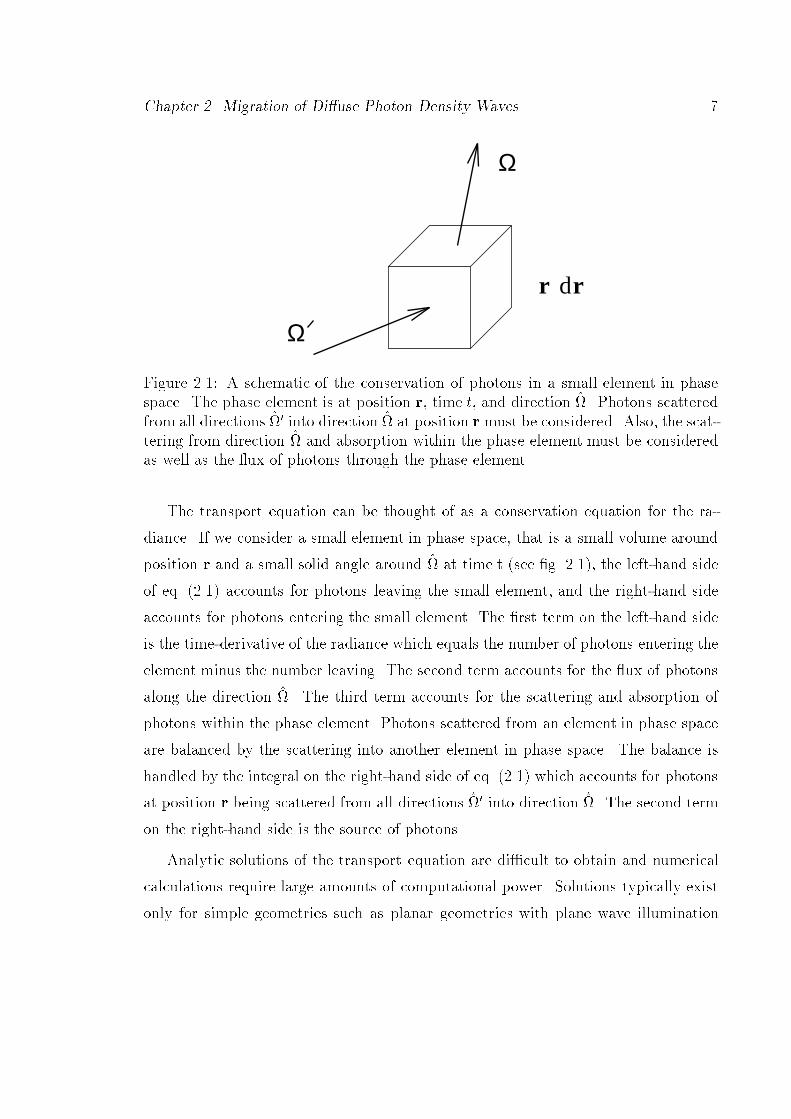
Figure A schematic of the conservation of photons in a small element in phasespace The phase element is at position r time t and direction Photons scatteredfrom all directions into direction at position r must be considered Also the scattering from direction and absorption within the phase element must be consideredas well as the ux of photons through the phase element
The transport equation can be thought of as a conservation equation for the ra
diance If we consider a small element in phase space that is a small volume around
position r and a small solid angle around at time t see g the lefthand side
of eq accounts for photons leaving the small element and the righthand side
accounts for photons entering the small element The rst term on the lefthand side
is the timederivative of the radiance which equals the number of photons entering the
element minus the number leaving The second term accounts for the ux of photons
along the direction The third term accounts for the scattering and absorption of
photons within the phase element Photons scattered from an element in phase space
are balanced by the scattering into another element in phase space The balance is
handled by the integral on the righthand side of eq which accounts for photons
at position r being scattered from all directions into direction The second term
on the righthand side is the source of photons
Analytic solutions of the transport equation are dicult to obtain and numerical
calculations require large amounts of computational power Solutions typically exist
only for simple geometries such as planar geometries with plane wave illumination
Boas Diuse Photon Probes of Turbid Media Theory and Applications
some spherical geometries and a few other special cases
These diculties are reduced by considering approximate solutions to the trans
port equation A standard approximation method for the transport equation is known
as the PN approximation The method of the PN approximation is simply
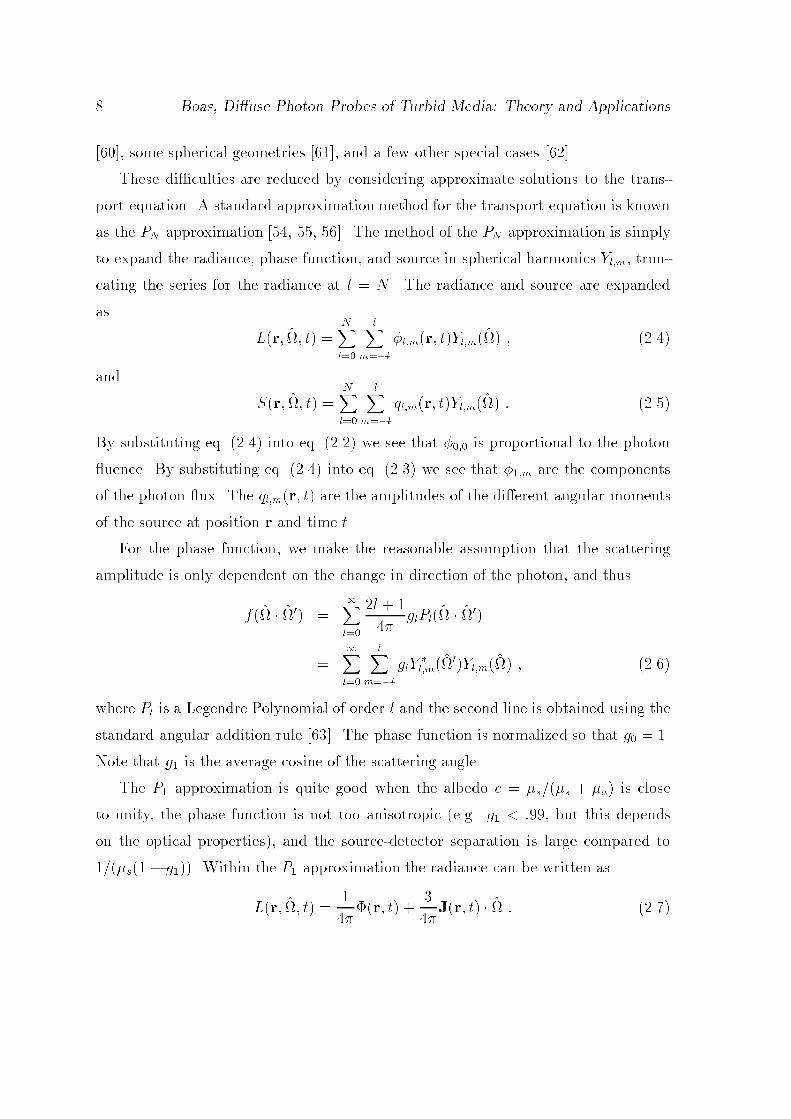
to expand the radiance phase function and source in spherical harmonics Ylm trun
cating the series for the radiance at l N The radiance and source are expanded
as
Lr t NXl
lXml
lmr tYlm
and
Sr t NXl
lXml
qlmr tYlm
By substituting eq into eq we see that is proportional to the photon
uence By substituting eq into eq we see that m are the components
of the photon ux The qlmr t are the amplitudes of the dierent angular moments
of the source at position r and time t
For the phase function we make the reasonable assumption that the scattering
amplitude is only dependent on the change in direction of the photon and thus
f Xl
l
glPl
Xl
lXml
glY
lmYlm
where Pl is a Legendre Polynomial of order l and the second line is obtained using the
standard angular addition rule The phase function is normalized so that g
Note that g is the average cosine of the scattering angle
The P approximation is quite good when the albedo c ss a is close
to unity the phase function is not too anisotropic eg g but this depends
on the optical properties and the sourcedetector separation is large compared to
s g Within the P approximation the radiance can be written as
Lr t
r t
Jr t
Chapter Migration of Diuse Photon Density Waves
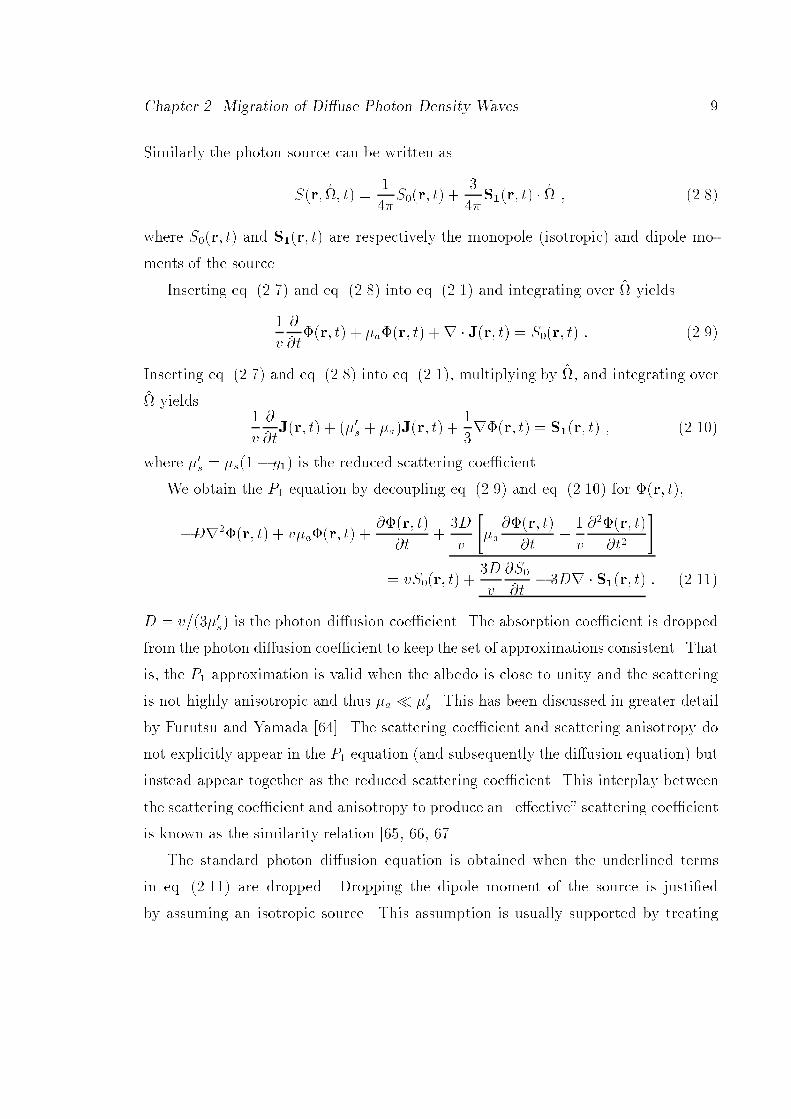
Similarly the photon source can be written as
Sr t
Sr t
Sr t
where Sr t and Sr t are respectively the monopole isotropic and dipole mo
ments of the source
Inserting eq and eq into eq and integrating over yields
v
tr t ar t r Jr t Sr t
Inserting eq and eq into eq multiplying by and integrating over
yields
v
tJr t s aJr t
rr t Sr t
where s s g is the reduced scattering coecient
We obtain the P equation by decoupling eq and eq for r t
Drr t var t r t
t
D
v
ar t
t
v
r t
t
vSr t D
v
S
t Dr Sr t
D vs is the photon diusion coecient The absorption coecient is dropped
from the photon diusion coecient to keep the set of approximations consistent That
is the P approximation is valid when the albedo is close to unity and the scattering
is not highly anisotropic and thus a s This has been discussed in greater detail
by Furutsu and Yamada The scattering coecient and scattering anisotropy do
not explicitly appear in the P equation and subsequently the diusion equation but
instead appear together as the reduced scattering coecient This interplay between
the scattering coecient and anisotropy to produce an eective scattering coecient
is known as the similarity relation
The standard photon diusion equation is obtained when the underlined terms
in eq are dropped Dropping the dipole moment of the source is justied
by assuming an isotropic source This assumption is usually supported by treating

Boas Diuse Photon Probes of Turbid Media Theory and Applications
collimated sources as isotropic sources displaced one transport mean free path into the
scattering medium from the collimated source The assumption for dropping the other
terms is best seen in the frequencydomain where the time dependence of the source is
taken as expit When the intensity of the source is sinusoidally modulated then
the photon uence becomes r expit The time derivatives can then be replaced
by i and the rest of the underlined terms can be ignored when Dv This
assumption is equivalent to vs that is the scattering frequency must be much
larger than the modulation frequency
Given these assumptions we arrive at the photon diusion equation for r t
Drr t var t r t
t vSr t
Note that in the frequencydomain the photon diusion equation can be rewritten as
the Helmholtz equation
r kACACr vD
Sr
where the wavenumber is complex ie
kAC va i
D
Diuse Photon Density Waves
When the source of photons in a turbid medium is intensity modulated eg Sr t
SDCr SACr expit then the photon uence will oscillate at the same fre
quency This small but measurable traveling wave disturbance of the light energy
density is referred to as a diuse photon density wave
Diuse photon density waves are scalar damped traveling waves These traveling
waves arise formally in any diusive system that is driven by an oscillating source
such as in heat conduction and chemical waves Fishkin and Gratton for
example have calculated the light energy density Urt within an optically
dense homogenous media in the presence of a modulated point light source at the

Chapter Migration of Diuse Photon Density Waves
origin They then used the result and the principle of superposition to derive the light
energy density in the presence of an absorbing semiinnite plane The oscillatory
part of the solution for an innite homogenous dense random media with an intensity
modulated point source is
ACr t vSAC Dr
expikr expit
SAC is the source modulation amplitude D vs is the photon diusion coef
cient in the turbid medium where v is the speed of light in the medium and s
is the reduced scattering coecient is the angular modulation frequency and the
wavenumber k is given by
k
sva i
D
va
D
exp
i
tan
va
va
D
i cos
tan
va
sin
tan
va
This is not the only solution for k however it is the solution which satises the
physical condition that the amplitude is exponentially attenuated rather than growing
ie the imaginary part of k is greater than zero This particular solution is obtained
by extracting the from the rest of the equation on the second line An analogous
equation for k can be found using the following approach still requiring the imaginary
part of k to be greater than zero
k x iy
k x y ixy
x y vaD
xy
D
k
rvaD
Bvuut
va
CA
i
Bvuut
va
CA
Boas Diuse Photon Probes of Turbid Media Theory and Applications
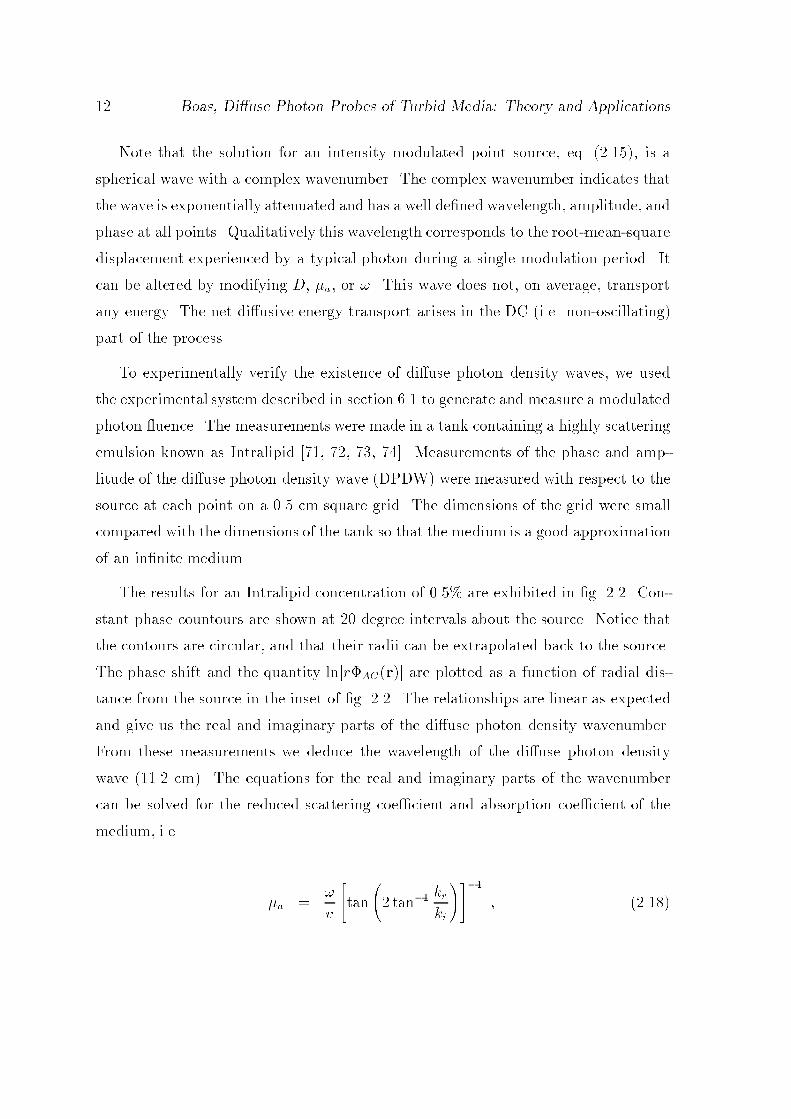
Note that the solution for an intensity modulated point source eq is a
spherical wave with a complex wavenumber The complex wavenumber indicates that
the wave is exponentially attenuated and has a well dened wavelength amplitude and
phase at all points Qualitatively this wavelength corresponds to the rootmeansquare
displacement experienced by a typical photon during a single modulation period It
can be altered by modifying D a or This wave does not on average transport
any energy The net diusive energy transport arises in the DC ie nonoscillating
part of the process
To experimentally verify the existence of diuse photon density waves we used
the experimental system described in section to generate and measure a modulated
photon uence The measurements were made in a tank containing a highly scattering
emulsion known as Intralipid Measurements of the phase and amp
litude of the diuse photon density wave DPDW were measured with respect to the
source at each point on a cm square grid The dimensions of the grid were small
compared with the dimensions of the tank so that the medium is a good approximation
of an innite medium
The results for an Intralipid concentration of are exhibited in g Con
stant phase countours are shown at degree intervals about the source Notice that
the contours are circular and that their radii can be extrapolated back to the source
The phase shift and the quantity lnjrACrj are plotted as a function of radial dis
tance from the source in the inset of g The relationships are linear as expected
and give us the real and imaginary parts of the diuse photon density wavenumber
From these measurements we deduce the wavelength of the diuse photon density
wave cm The equations for the real and imaginary parts of the wavenumber
can be solved for the reduced scattering coecient and absorption coecient of the
medium ie
a
v
tan
tan
krki

Chapter Migration of Diuse Photon Density Waves
s kr ki
a
v
Here kr and ki are respectively the real and imaginary parts of the wavenumber
Using eq and eq we nd that s cm and a cm for
Intralipid at C The photon absorption can be attributed almost entirely to water
Interaction with FreeSpace Boundaries
Diuse photon density waves propagating in innite homogeneous media are spherical
waves If the turbid medium is not innite or homogeneous then the wave fronts are
distorted Here I consider homogeneous media that have a boundary between the
turbid media and media which do not scatter light Microscopically the perturbation
of the diuse photon density wave arises from photons escaping into the nonscattering
medium When a photon crosses the boundary from the turbid medium into the non
scattering medium there is no mechanism for changing the direction of the photon to
return it to the turbid medium except for Fresnel reections at the boundary This
photon escape reduces the number of photons in the wave front thus reducing the
amplitude and altering the phase Generally the long path length photons are more
likely to escape reducing the mean path length and the DPDW wavelength Thus the
phase tends to increase because of the presence of a freespace boundary
Within the diusion approximation the exact boundary condition for an index
matched freespace boundary is that the component of the ux normal to the inter
face pointing from the nonscattering medium into the turbid medium must be zero
Specically
Jinr
r
D
vn rr
where n is the normal to the boundary pointing away from the turbid medium and r is
on the boundary This boundary condition is known as the zero partial ux boundary

Boas Diuse Photon Probes of Turbid Media Theory and Applications
Position (cm)
Pos
ition
(cm
)
ln |rA
C |
Distance (cm)
Pha
se (
degr
ees)
Figure Constant phase contours shown as a function of position for a homogeneous solution of Intralipid The contours are shown in degree intervalsInset The measured phase shift circles and lnjrACrj squares are plotted as afunction of radial distance from the source So

Chapter Migration of Diuse Photon Density Waves
z=0z=-z b
Free-Space Turbid Medium
Φ(z)
Figure Schematic of the extrapolated zero boundary condition
condition At the boundary we measure the outward component of the ux
Joutr
r D
vn rr
r D
vn rr
The second line is derived from the condition that Jin on the boundary and
shows that what we measure on the boundary is proportional to the uence and the
component of the ux normal to the boundary
Generally it is dicult to obtain analytic solutions of the diusion equation using
the zero partial ux boundary condition Instead the approximate extrapolated zero
boundary condition is used This requires the uence to be zero at a distance of
s from the actual boundary For example for a semiinnite medium with the
boundary at z and the turbid medium at z the extrapolated zero boundary
condition requires zb where zb s This extrapolation distance
comes from a linear extrapolation of the uence at the boundary to the zero crossing
point see g It is argued that zb s gives better agreement with the
photon transport equation Here I use zb s to remain consistent
with the recent literature eg
Boas Diuse Photon Probes of Turbid Media Theory and Applications
z=ztrSource +1
Image -1
z=-zz=0
ρ
Detector z=-2z - z trb
b
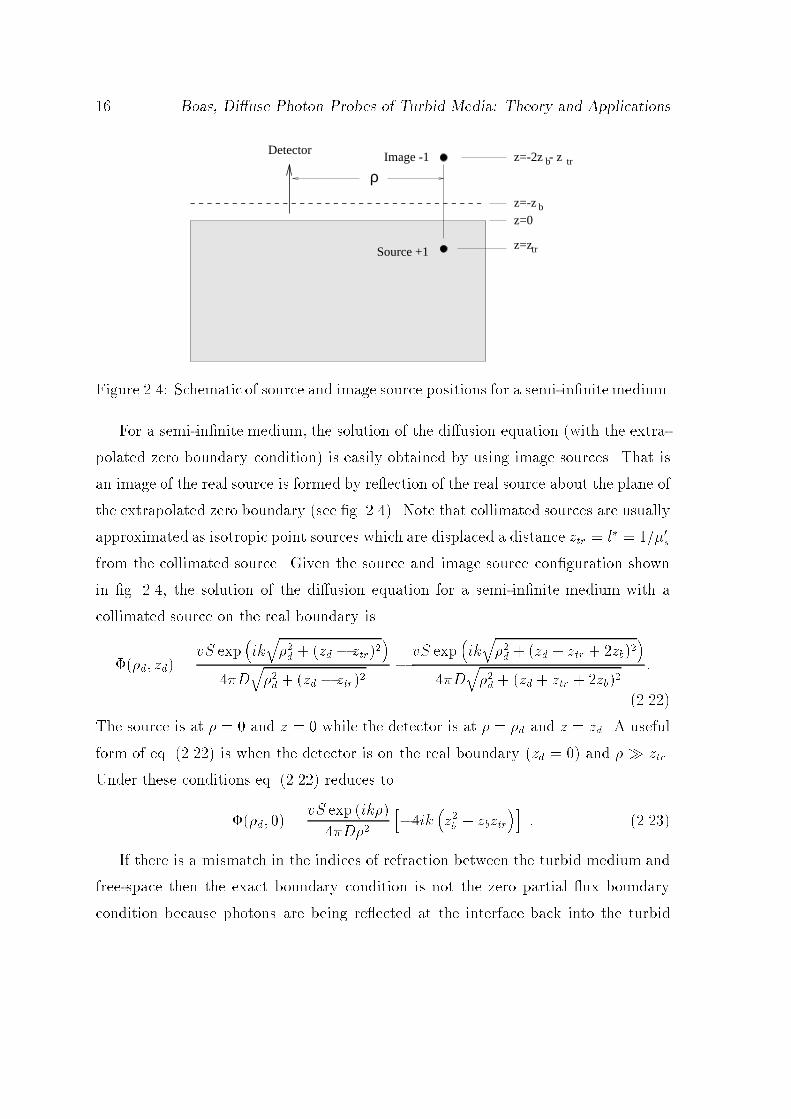
Figure Schematic of source and image source positions for a semiinnite medium
For a semiinnite medium the solution of the diusion equation with the extra
polated zero boundary condition is easily obtained by using image sources That is
an image of the real source is formed by reection of the real source about the plane of
the extrapolated zero boundary see g Note that collimated sources are usually
approximated as isotropic point sources which are displaced a distance ztr l s
from the collimated source Given the source and image source conguration shown
in g the solution of the diusion equation for a semiinnite medium with a
collimated source on the real boundary is
d zd vS exp
ikqd zd ztr
D
qd zd ztr
vS exp
ikqd zd ztr zb
D
qd zd ztr zb
The source is at and z while the detector is at d and z zd A useful
form of eq is when the detector is on the real boundary zd and ztr
Under these conditions eq reduces to
d vS exp ik
D
h ik
zb zbztr
i
If there is a mismatch in the indices of refraction between the turbid medium and
freespace then the exact boundary condition is not the zero partial ux boundary
condition because photons are being reected at the interface back into the turbid
Chapter Migration of Diuse Photon Density Waves
medium In this case the exact boundary condition is
Jinr
r
D
vn rr R
rRj
D
vn rr
where R and Rj are respectively the reection coecient for the isotropic uence and
the reection coecient for the anisotropic ux They are given by
R Z
sin cos RFresneld
Rj Z
sin cos RFresneld
where RFresnel is the Fresnel reection coecient for unpolarized light
RFresnel
nin cos nout cos
nin cos nout cos
nin cos nout cos
nin cos nout cos
when c
when c
The angle of incidence is given with respect to the boundary normal the refracted
angle is given by nin sin nout sin and nin and nout are respectively the index
of refraction inside and outside the turbid medium This condition is called the partial
ux boundary condition The partial ux boundary condition can be reduced to an
extrapolated zero boundary condition where
zb Reff
Reff
l
where
Reff R Rj
R Rj
This boundary condition is described in detail by Haskell et al and Aronson
Refraction and Diraction of Diuse Photon Density Waves
In this section I present experiments which illustrate the refraction and diraction
of diuse photon density waves I demonstrate that the refraction of these waves at
Boas Diuse Photon Probes of Turbid Media Theory and Applications
planar interfaces is well described by Snells Law In addition I demonstrate that
simple diractive and refractive models can be used to understand the scattering of
these waves by absorptive and dispersive objects embedded in an otherwise uniform
system
Refraction at planar interfaces
Fig demonstrates the refraction of these waves in three ways A planar bound
ary has been introduced separating the lower medium with Intralipid concentration
cl and light diusion coecient Dl from the upper medium with Intralipid
concentration cu and light diusion coecient Du In g contours of
constant phase are drawn every for the propagation of the DPDW from the lower
medium to the upper medium The contours below the boundary are the homogenous
media contours without reection they are obtained before the partition is intro
duced into the sample The contours above the boundary are derived from the diuse
photon density waves transmitted into the less concentrated medium As a result of
the detector geometry the closest approach to the partition is about cm
We expect a number of general results First the wavelength in the less dense
medium u cm should be greater than the wavelength of the diuse photon
density wave in the incident medium l cm This was observed The ratio
of the two wavelengths should equal the ratio of the diusional indices of refraction
of the two media Specically we see as expected that u lqDlDu l
qclcu
this relation holds when absorption is negligible Furthermore we would expect that
the apparent source position Si as viewed from within the upper medium should
be shifted from the real source position So cm by a factor l u
as predicted by Snells law for paraxial waves This is what we nd within the
accuracy of this measurement Using the radii from the full contour plots we see that
the apparent source position is shifted from cm to cm from the
planar interface
Finally g explicitly demonstrates Snells law for diuse photon density

Chapter Migration of Diuse Photon Density Waves
A
t
i
Position (cm)
Pos
ition
(cm
)
upper
lower
Figure Constant phase contours in degree intervals as a function of positionshowing the propagation of a diuse photon density wave across a planar boundarythat separates concentrated Intralipid from Intralipid So source position Si apparent source position A point on boundary i angle of incident ray tangle of refracted ray The solid lines are obtained directly from data The dotdashed lines are obtained by interpolation over large distances and are drawn toshow the irregularities at large angles
Boas Diuse Photon Probes of Turbid Media Theory and Applications
waves This can be seen by following the ray from So to the point A at the boundary
and then into the upper medium The ray in the lower medium makes an angle
i with respect to the surface normal The upper ray is constructed in the
standard way between the apparent source position Si through the point A on the
boundary and into the medium above the boundary It is perpendicular to the
circular wavefronts in the less dense medium and makes an angle t with
respect to the boundary normal Within the accuracy of the experiment we see that
sin i sin t l u so that Snells law accurately describes the propagation
of diuse photon density waves across the boundary The wavefronts become quite
distorted when the source ray angle exceeds degrees These irregularities are a
consequence of total internal reection diraction and spurious boundary eects
Refraction and diraction by spherical inhomogeneities
Here I present measurements of diuse photon density wavefront distortions that
arise when these waves are perturbed by purely absorptive or dispersive homogen
eous spheres In general one would expect both refractive and diractive processes
to aect the wavefronts Unfortunately our intuition from conventional optics is of
limited applicability since we must work in the near eld Measurements of wavefront
distortions from purely absorbing spheres are reasonably well described by a simple
diraction model whereby the diuse photon density wave is scattered by an absorbing
disk of the same diameter The pure dispersive case is qualitatively dierent Here
a ray optic model works well for scatterers characterized by a larger light diusion
coecient relative to that of the surrounding turbid medium but a diractive model
is required under the opposite conditions
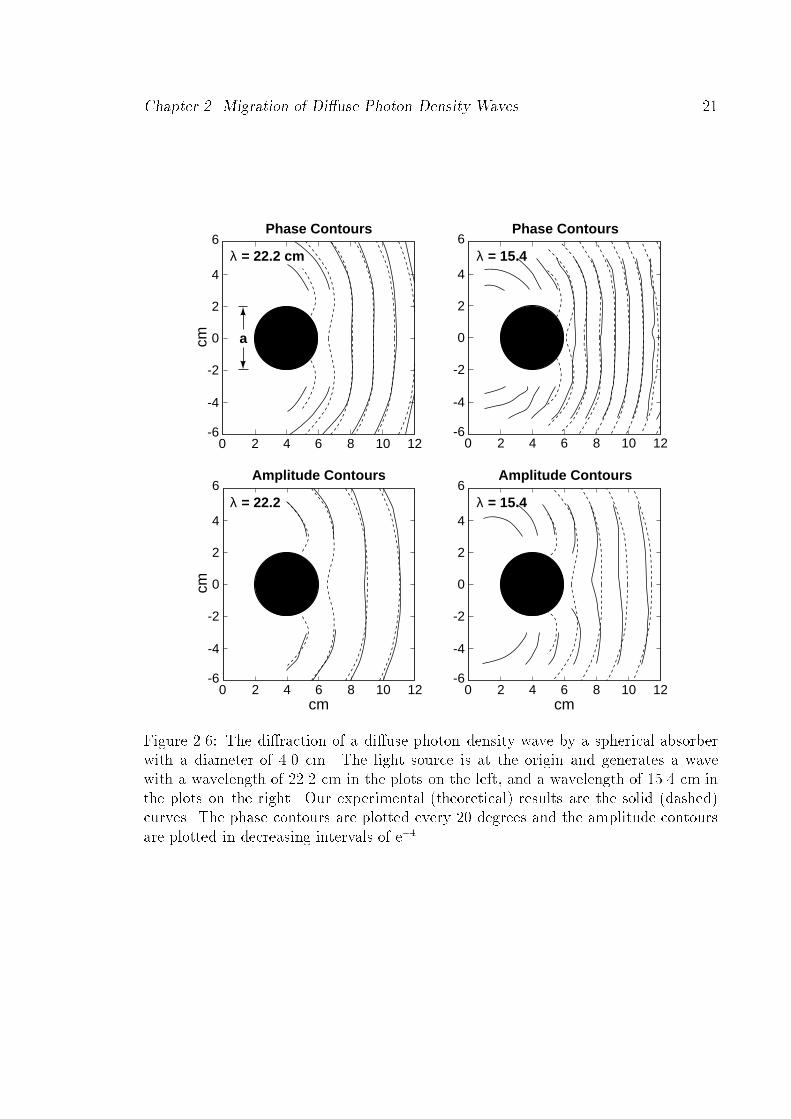
The diraction of DPDWs by absorptive spheres is illustrated in g The
contours of constant phase and amplitude are plotted for a DPDW traveling in dier
ent concentrations of Intralipid and diracting around a cm diameter absorptive
sphere The sphere was saturated with ink so that the fraction of incident light trans
mitted through the sphere was below the detection limit of Nevertheless the
Chapter Migration of Diuse Photon Density Waves
6
4
2
0
-2
-4
-60 2 4 6 8 10 12
cm
6
4
2
0
-2
-4
-60 2 4 6 8 10 12
6
4
2
0
-2
-4
-60 2 4 6 8 10 12
cm
cm
6
4
2
0
-2
-4
-60 2 4 6 8 10 12
cm
λ = 22.2 cm
λ = 22.2
λ = 15.4
λ = 15.4
a
Phase Contours Phase Contours
Amplitude Contours Amplitude Contours
Figure The diraction of a diuse photon density wave by a spherical absorberwith a diameter of cm The light source is at the origin and generates a wavewith a wavelength of cm in the plots on the left and a wavelength of cm inthe plots on the right Our experimental theoretical results are the solid dashedcurves The phase contours are plotted every degrees and the amplitude contoursare plotted in decreasing intervals of e

Boas Diuse Photon Probes of Turbid Media Theory and Applications
R1
R2
Absorbing
Disk
SP
A
(a)
S
P
P2
1
(b)
a
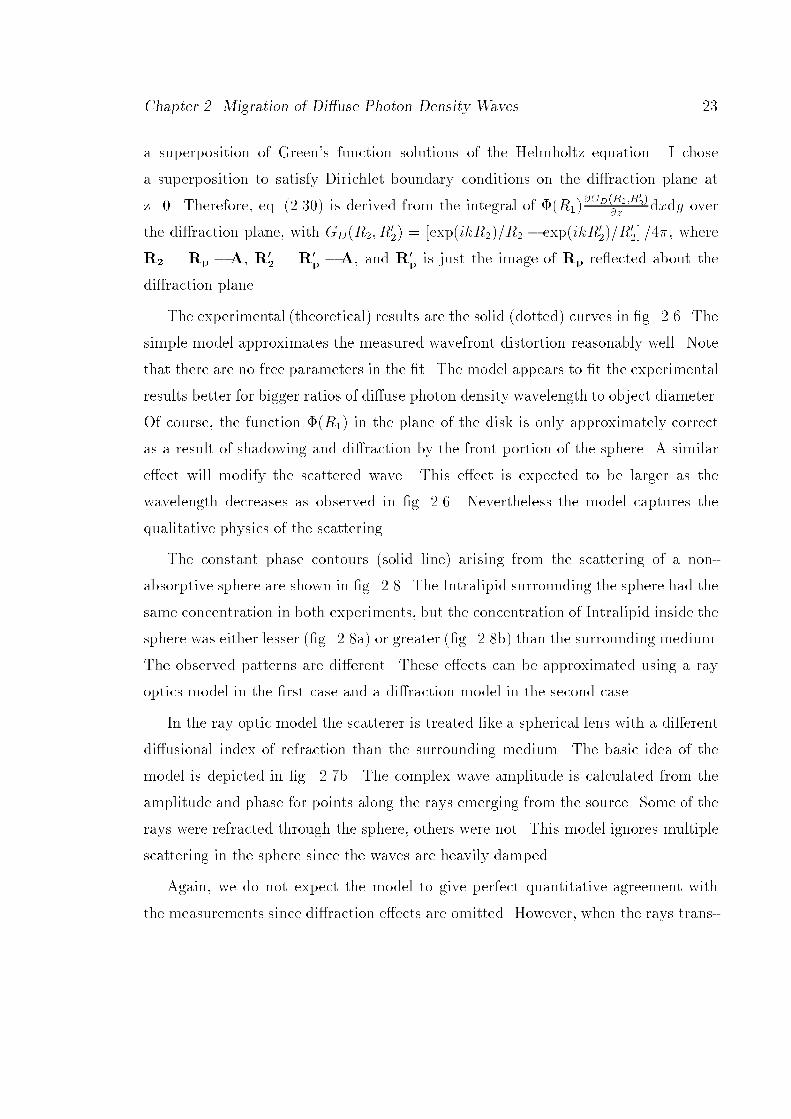
Figure a In the diraction model the sphere is replaced by an absorbing disk ofthe same diameter a cm which lies in a plane through the center of the sphereR is the distance from the source S to a point A in the diraction plane dashed lineand R is the distance from A to the image point P Here we take the zaxis to benormal to the diraction plane and we let the diraction plane coincide with the xyplane ie z The wavefront at P is calculated by integrating the standard Kirchoequation over the diraction plane b In the ray model the wavefront is calculated bydetermining the phase and amplitude of rays which are refracted through a sphericallens
wavefronts on the other side of the sphere are detected These wavefronts are formed
by the diraction of the wave around the sphere
Here I have modeled this eect in a simple way In the model I replaced the
sphere by a totally absorbing disk of the same diameter The disk was chosen to lie
in a plane containing the center of the sphere with surface normal pointing in the z
direction The diraction from this disk can be calculated using the standard Kircho
construction
xp yp zp kzpi
ZS
dx dy RexpikR
R
i
kR
The construction is depicted in g a Here R is the complex amplitude
of the photon uence in the plane of the disk R is the length of the vector from
the source at position Rs xs ys zs to a point A x y z on
the diraction plane R is the length of the vector going from A to the detection
point Rp xp yp zp The Greens function is derived from the point source
solution for diuse photon density waves in an innite homogeneous medium so that
k is complex Specically the Greens function for this problem is derived from
Chapter Migration of Diuse Photon Density Waves
a superposition of Greens function solutions of the Helmholtz equation I chose
a superposition to satisfy Dirichlet boundary conditions on the diraction plane at
z Therefore eq is derived from the integral of RGDRR
zdxdy over
the diraction plane with GDR R
expikRR expikR
R
where
R Rp A R
R
p A and R
p is just the image of Rp reected about the
diraction plane
The experimental theoretical results are the solid dotted curves in g The
simple model approximates the measured wavefront distortion reasonably well Note
that there are no free parameters in the t The model appears to t the experimental
results better for bigger ratios of diuse photon density wavelength to object diameter
Of course the function R in the plane of the disk is only approximately correct
as a result of shadowing and diraction by the front portion of the sphere A similar
eect will modify the scattered wave This eect is expected to be larger as the
wavelength decreases as observed in g Nevertheless the model captures the
qualitative physics of the scattering
The constant phase contours solid line arising from the scattering of a non
absorptive sphere are shown in g The Intralipid surrounding the sphere had the
same concentration in both experiments but the concentration of Intralipid inside the
sphere was either lesser g a or greater g b than the surrounding medium
The observed patterns are dierent These eects can be approximated using a ray
optics model in the rst case and a diraction model in the second case
In the ray optic model the scatterer is treated like a spherical lens with a dierent
diusional index of refraction than the surrounding medium The basic idea of the
model is depicted in g b The complex wave amplitude is calculated from the
amplitude and phase for points along the rays emerging from the source Some of the
rays were refracted through the sphere others were not This model ignores multiple
scattering in the sphere since the waves are heavily damped
Again we do not expect the model to give perfect quantitative agreement with
the measurements since diraction eects are omitted However when the rays trans

Boas Diuse Photon Probes of Turbid Media Theory and Applications
6
4
2
0
-2
-4
-60 2 4 6 8 10 12
cm
cm
6
4
2
0
-2
-4
-60 2 4 6 8 10 12
cm
(a) (b)
Figure The scattering of a diuse photon density waves by purely dispersivespheres a The Intralipid concentration within the spherical shell is lessthan the surrounding medium b The Intralipid concentration is greater thanthe surrounding medium For both the surrounding Intralipid is the same the source islocated at the origin the sphere has a diameter of cm and is centered at x cmy cm The phase contours are drawn every degrees for the experimental solidlines and theoretical dashed lines results The theoretical results were calculated ina by the ray model and in b by the diraction model
mitted through the sphere are attenuated less than the rays outside of the sphere we
would expect diraction eects to be negligible This is the case when the sphere has
a smaller concentration of Intralipid than the surrounding medium and the expected
behavior was observed see g a For near axis rays the model also predicts
an apparent source position at zs cm This is easily veried by standard ray
construction techniques
The ray method does not work well for dense spheres The dense sphere acts more
like an absorber since the diuse photon density wave is signicantly attenuated upon
traveling through the sphere For this reason one might expect the purely diractive
model discussed earlier to work better Indeed this is what was observed see g
b

Chapter Migration of Diuse Photon Density Waves
Scattering of Diuse Photon Density Waves
The previous section showed that diuse photon density waves are distorted by the
presence of optical inhomogeneities The degree of distortion is determined by the
characteristics of the inhomogeneity such as its position shape size and scattering
and absorption properties We saw that in some cases the perturbation can be modeled
using a simple diraction or ray optic model A better theory for the observed per
turbation is desirable for many reasons In particular the simple models discussed
in the previous section only work for specic dierences in the optical properties and
specic sourcedetector positions relative to the inhomogeneity That is the object
must be placed between the source and detector and it must be highly absorbing
relative to the background or have a smaller scattering coecient with no absorption
contrast Since the Helmholtz equation is known to describe the transport of DPDWs
in a piecewise homogeneous media we expect that an exact solution exists
for the scattering of DPDWs by spherical objects The solutions will be
similar to and simpler than the theory of Mie scattering often used in optics
In this section I derive the analytic solution of the Helmholtz equation for a piece
wise homogeneous system consisting of a spherical object composed of one highly
scattering medium embedded in a second highly scattering medium of innite spatial
extent This solution is easily extended to semiinnite media using the extrapolated
zero boundary condition The analytic solution is compared with ex
perimental data in order to assess the theorys predictive power and a simple inverse
localization algorithm is demonstrated to determine the size and location of a spherical
object Finally the theory is extended to include more complex problems in imaging
An Analytic Solution
The derivation of the analytic solution for the scattering of DPDWs from spherical
inhomogeneities begins with the Helmholtz equation eq In the presence of a
spherical heterogeneity the photon uence is found by constructing a general solution
Boas Diuse Photon Probes of Turbid Media Theory and Applications
to eq outside and inside the sphere and applying the appropriate boundary
conditions It is natural to analyze the problem in spherical coordinates whose origin
coincides with the center of the spherical object see g The general solution
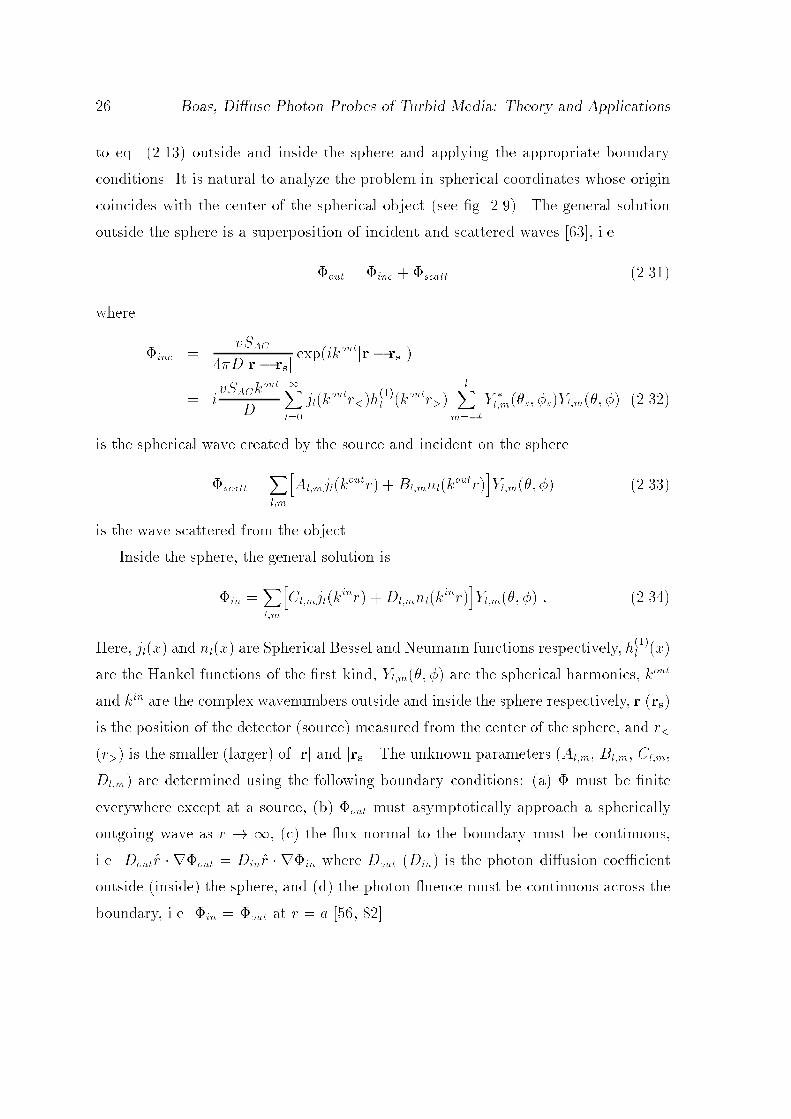
outside the sphere is a superposition of incident and scattered waves ie
out inc scatt
where
inc vSAC
Djr rsj expikoutjr rsj
ivSACk
out
D
Xl
jlkoutrhl koutr
lXml
Y
lms sYlm
is the spherical wave created by the source and incident on the sphere
scatt Xlm
hAlmjlk
outr Blmnlkoutr
iYlm
is the wave scattered from the object
Inside the sphere the general solution is
in Xlm
hClmjlk
inr Dlmnlkinr
iYlm
Here jlx and nlx are Spherical Bessel and Neumann functions respectively hl x
are the Hankel functions of the rst kind Ylm are the spherical harmonics kout
and kin are the complex wavenumbers outside and inside the sphere respectively r rs
is the position of the detector source measured from the center of the sphere and r
r is the smaller larger of jrj and jrsj The unknown parameters Alm Blm Clm
Dlm are determined using the following boundary conditions a must be nite
everywhere except at a source b out must asymptotically approach a spherically
outgoing wave as r c the ux normal to the boundary must be continuous
ie Doutr rout Dinr rin where Dout Din is the photon diusion coecient
outside inside the sphere and d the photon uence must be continuous across the
boundary ie in out at r a

Chapter Migration of Diuse Photon Density Waves
rsr - r s
r1,d
r1,2
rs,1 rs,2
First OrderSecond Order
(a) (b)
x
z
a
Detector
Object 2
Object 1
Source
Detector
Source
Figure To solve the Helmholtz equation for a spherical boundary it is natural touse spherical coordinates with the origin at the center of the object a The source ispositioned on the zaxis s to exploit the azimuthal symmetry of the problemand the relevant distances between the source object and detector are indicated in thegure Scattering from multiple objects is diagrammed in b The rst and secondorder waves scattered from the rst object are illustrated by the solid and dashed linerespectively The relevant distances are indicated in the diagram
Considering these boundary conditions and using the orthogonality relation for the
spherical harmonics I nd
Alm ivSACkout
Dhl koutzsY
lm
Doutxj
lxjlyDinyjlxjly
Doutxhl xjlyDinyh
l xjly
Blm iAlm
Clm ivSACkout
Dhl koutzsY
lm
Doutxh
l xjlxDoutxh
l xjlx
Doutxhl xjlyDinyh
l xjly
Dlm
where x kouta y kina rs r zs and jl and hl are the
rst derivatives of the functions jl and hl with respect to the argument Placing
the source on the zaxis exploits the azimuthal symmetry of the problem leading to
Alm Clm for m The distortion of the wave is entirely dependent on the
parameters kout k outs outa kin k ins ina Dout Din rs and the object
Boas Diuse Photon Probes of Turbid Media Theory and Applications
radius a In general the innite sum for out converges permitting the sum to be
truncated after obtaining the desired precision The proceeding calculations require
no more than terms in the series to obtain better than precision which far
exceeds experimental precision On a Sun Microsystems Mountain View CA Sparc
out can be calculated times per second depending on the above mentioned
parameters
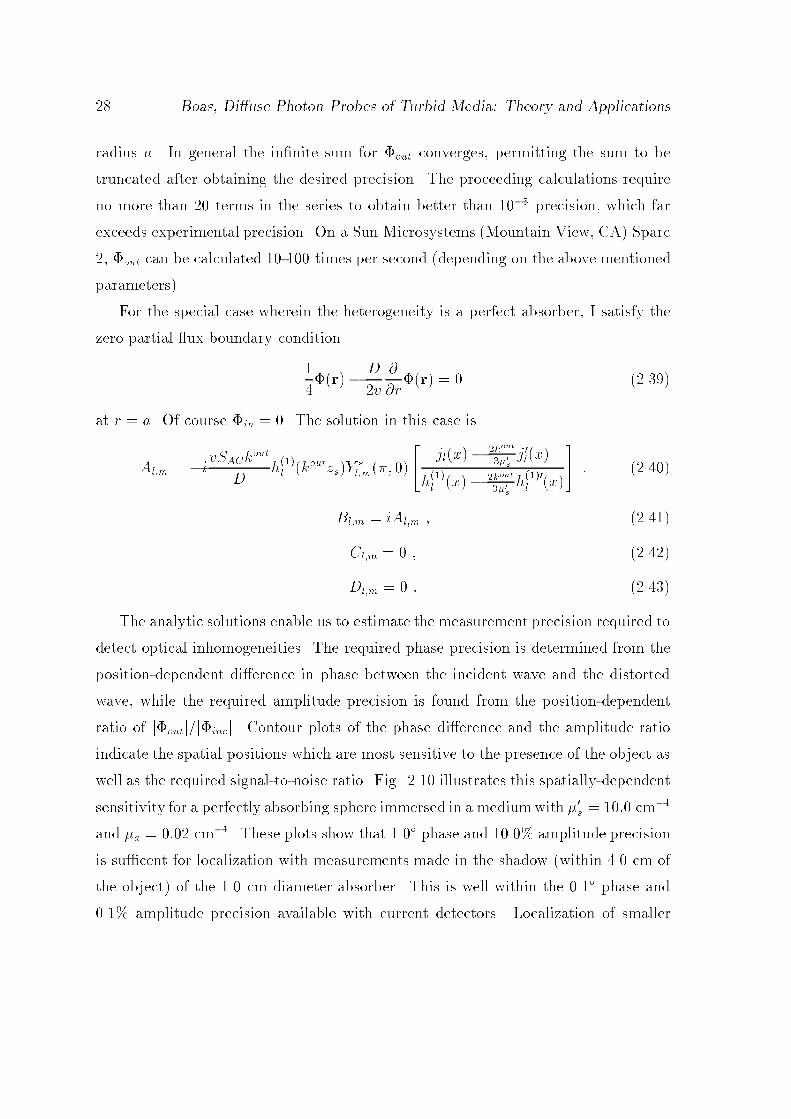
For the special case wherein the heterogeneity is a perfect absorber I satisfy the
zero partial ux boundary condition
r D
v
rr
at r a Of course in The solution in this case is
Alm ivSACkout
Dhl koutzsY
lm
jlx kout
s
jlx
hl x kout
s
hl x
Blm iAlm
Clm
Dlm
The analytic solutions enable us to estimate the measurement precision required to
detect optical inhomogeneities The required phase precision is determined from the
positiondependent dierence in phase between the incident wave and the distorted
wave while the required amplitude precision is found from the positiondependent
ratio of joutjjincj Contour plots of the phase dierence and the amplitude ratio
indicate the spatial positions which are most sensitive to the presence of the object as
well as the required signaltonoise ratio Fig illustrates this spatiallydependent
sensitivity for a perfectly absorbing sphere immersed in a medium with s cm
and a cm These plots show that phase and amplitude precision
is sucent for localization with measurements made in the shadow within cm of
the object of the cm diameter absorber This is well within the phase and
amplitude precision available with current detectors Localization of smaller
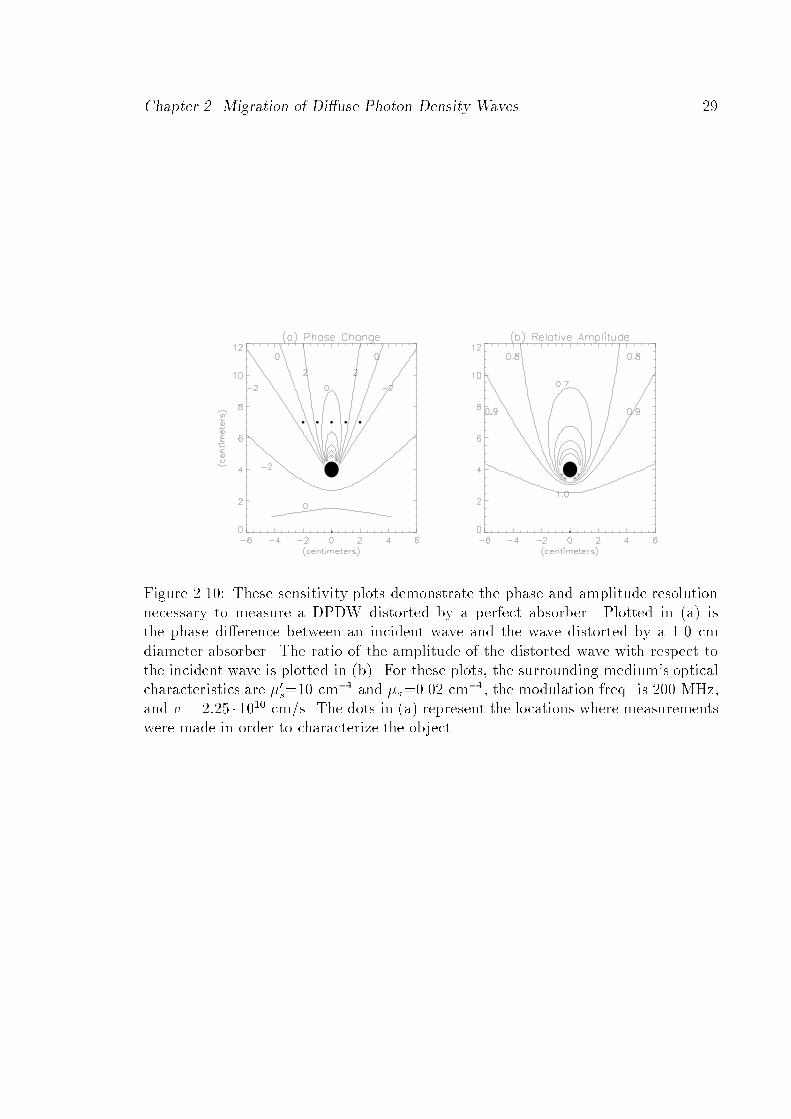
Chapter Migration of Diuse Photon Density Waves
Figure These sensitivity plots demonstrate the phase and amplitude resolutionnecessary to measure a DPDW distorted by a perfect absorber Plotted in a isthe phase dierence between an incident wave and the wave distorted by a cmdiameter absorber The ratio of the amplitude of the distorted wave with respect tothe incident wave is plotted in b For these plots the surrounding mediums opticalcharacteristics are s cm and a cm the modulation freq is MHzand v cm!s The dots in a represent the locations where measurementswere made in order to characterize the object
Boas Diuse Photon Probes of Turbid Media Theory and Applications
absorbers will require better precision A more detailed signaltonoise analysis that
reveals the limits to detecting localizing and characterizing is given in chapter
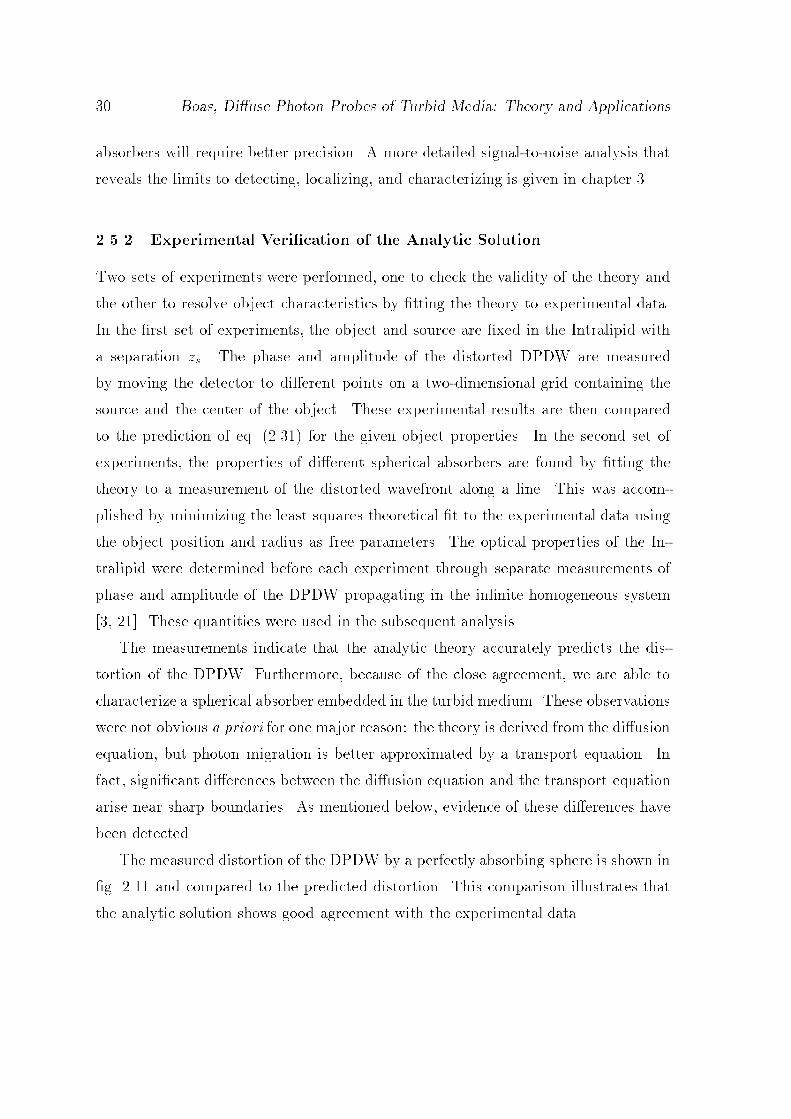
Experimental Verication of the Analytic Solution
Two sets of experiments were performed one to check the validity of the theory and
the other to resolve object characteristics by tting the theory to experimental data
In the rst set of experiments the object and source are xed in the Intralipid with
a separation zs The phase and amplitude of the distorted DPDW are measured
by moving the detector to dierent points on a twodimensional grid containing the
source and the center of the object These experimental results are then compared
to the prediction of eq for the given object properties In the second set of
experiments the properties of dierent spherical absorbers are found by tting the
theory to a measurement of the distorted wavefront along a line This was accom
plished by minimizing the least squares theoretical t to the experimental data using
the object position and radius as free parameters The optical properties of the In
tralipid were determined before each experiment through separate measurements of
phase and amplitude of the DPDW propagating in the innite homogeneous system
These quantities were used in the subsequent analysis
The measurements indicate that the analytic theory accurately predicts the dis
tortion of the DPDW Furthermore because of the close agreement we are able to
characterize a spherical absorber embedded in the turbid medium These observations
were not obvious a priori for one major reason the theory is derived from the diusion
equation but photon migration is better approximated by a transport equation In
fact signicant dierences between the diusion equation and the transport equation
arise near sharp boundaries As mentioned below evidence of these dierences have
been detected
The measured distortion of the DPDW by a perfectly absorbing sphere is shown in
g and compared to the predicted distortion This comparison illustrates that
the analytic solution shows good agreement with the experimental data

Chapter Migration of Diuse Photon Density Waves
Figure The experimental measurements solid lines of a DPDW distorted by a cm radius perfect absorber are compared to the theoretical prediction dotted linesfor the given experimental parameters Phase contours are drawn every degreesin a while the amplitude contours are drawn every e For this experiment theoptical properties of the surrounding medium were s cm and a cmf MHz and v cm!s
Figure The ts to experiment C and G from table are presented in a andb respectively The experimental data s are compared to the best t solid lineThe experimental parameters are given in table
Boas Diuse Photon Probes of Turbid Media Theory and Applications
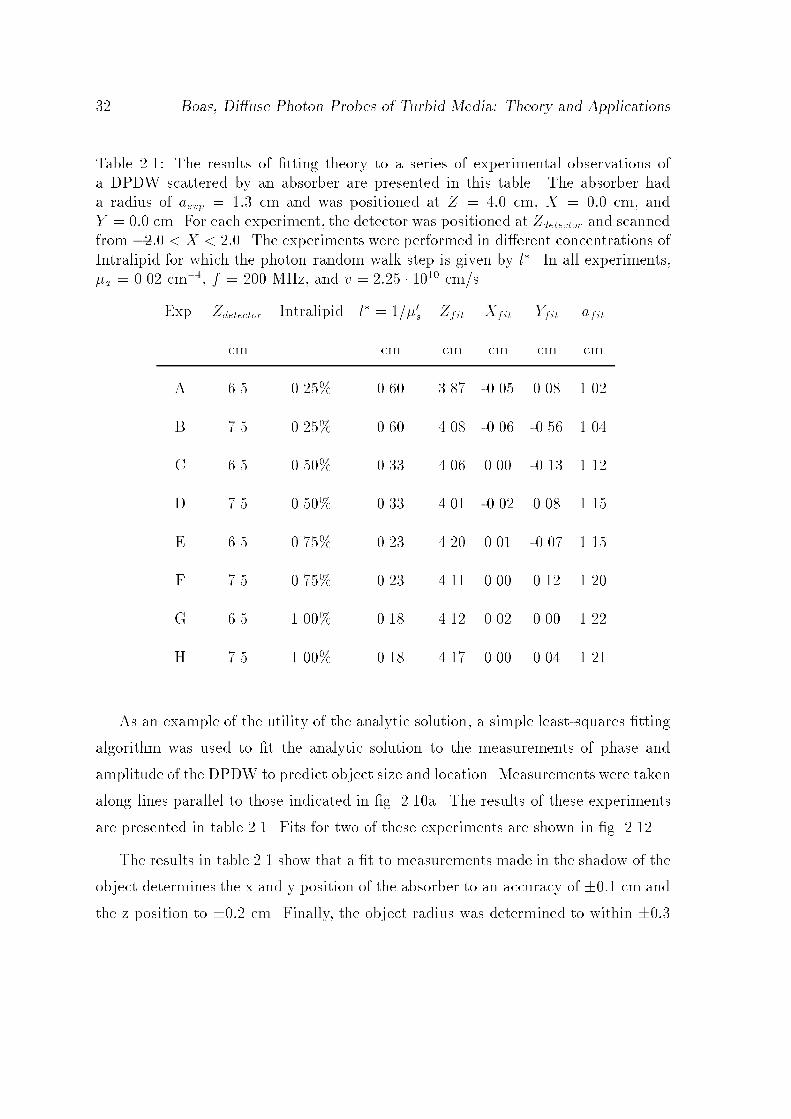
Table The results of tting theory to a series of experimental observations ofa DPDW scattered by an absorber are presented in this table The absorber hada radius of aexp cm and was positioned at Z cm X cm andY cm For each experiment the detector was positioned at Zdetector and scannedfrom X The experiments were performed in dierent concentrations ofIntralipid for which the photon random walk step is given by l In all experimentsa cm f MHz and v cm!s
Exp Zdetector Intralipid l s Zfit Xfit Yfit afit
cm cm cm cm cm cm
A
B
C
D
E
F
G
H
As an example of the utility of the analytic solution a simple leastsquares tting
algorithm was used to t the analytic solution to the measurements of phase and
amplitude of the DPDW to predict object size and location Measurements were taken
along lines parallel to those indicated in g a The results of these experiments
are presented in table Fits for two of these experiments are shown in g
The results in table show that a t to measurements made in the shadow of the
object determines the x and y position of the absorber to an accuracy of cm and
the z position to cm Finally the object radius was determined to within
Chapter Migration of Diuse Photon Density Waves
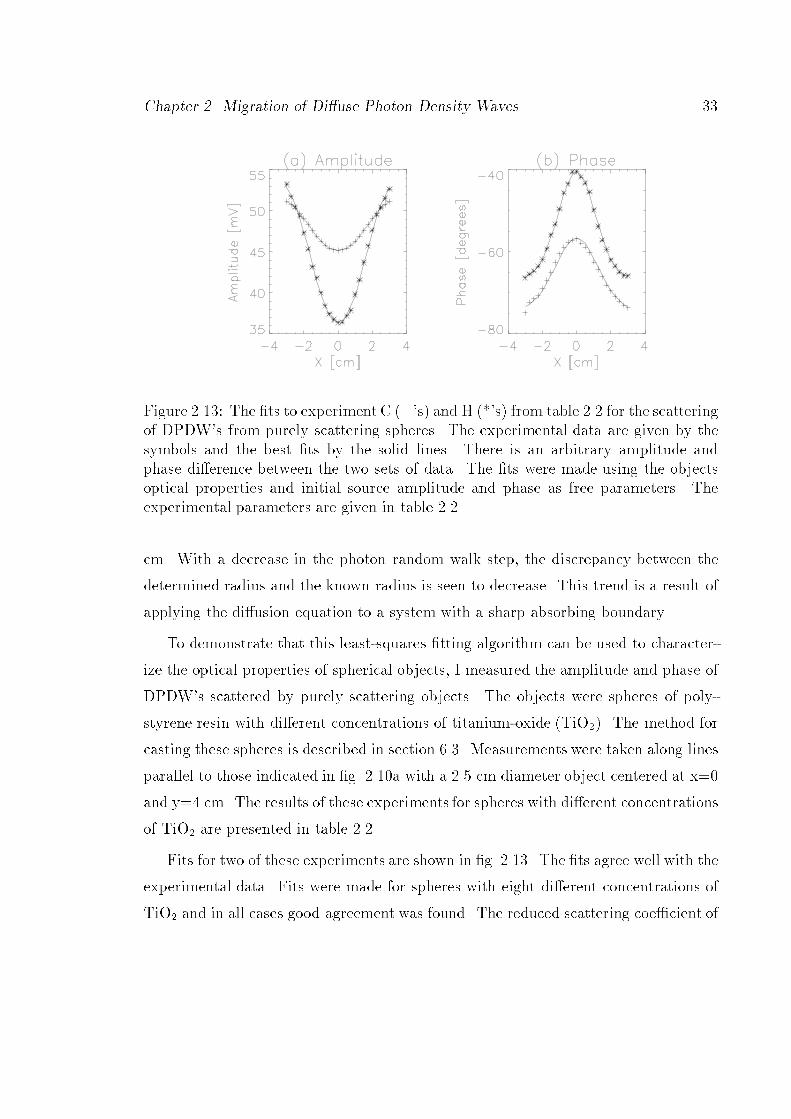
Figure The ts to experiment C s and H "s from table for the scatteringof DPDWs from purely scattering spheres The experimental data are given by thesymbols and the best ts by the solid lines There is an arbitrary amplitude andphase dierence between the two sets of data The ts were made using the objectsoptical properties and initial source amplitude and phase as free parameters Theexperimental parameters are given in table
cm With a decrease in the photon random walk step the discrepancy between the
determined radius and the known radius is seen to decrease This trend is a result of
applying the diusion equation to a system with a sharp absorbing boundary
To demonstrate that this leastsquares tting algorithm can be used to character
ize the optical properties of spherical objects I measured the amplitude and phase of
DPDWs scattered by purely scattering objects The objects were spheres of poly
styrene resin with dierent concentrations of titaniumoxide TiO The method for
casting these spheres is described in section Measurements were taken along lines
parallel to those indicated in g a with a cm diameter object centered at x
and y cm The results of these experiments for spheres with dierent concentrations
of TiO are presented in table
Fits for two of these experiments are shown in g The ts agree well with the
experimental data Fits were made for spheres with eight dierent concentrations of
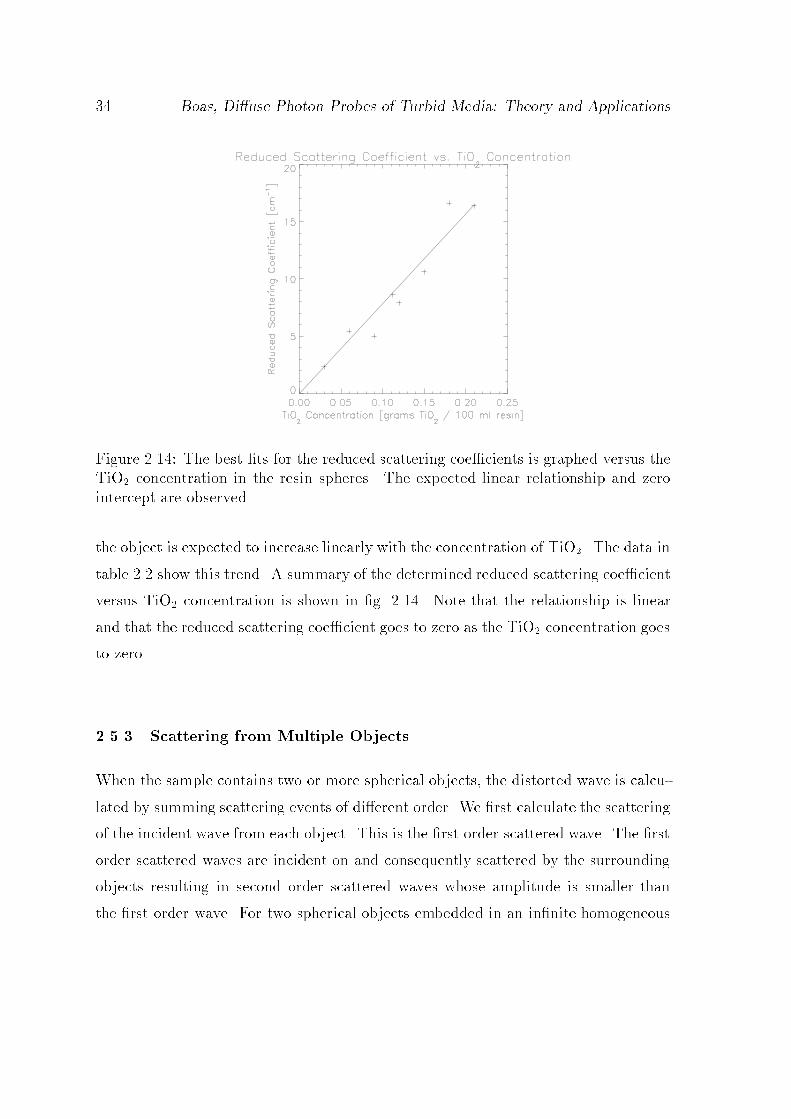
TiO and in all cases good agreement was found The reduced scattering coecient of
Boas Diuse Photon Probes of Turbid Media Theory and Applications
Figure The best ts for the reduced scattering coecients is graphed versus theTiO concentration in the resin spheres The expected linear relationship and zerointercept are observed
the object is expected to increase linearly with the concentration of TiO The data in
table show this trend A summary of the determined reduced scattering coecient
versus TiO concentration is shown in g Note that the relationship is linear
and that the reduced scattering coecient goes to zero as the TiO concentration goes
to zero
Scattering from Multiple Objects
When the sample contains two or more spherical objects the distorted wave is calcu
lated by summing scattering events of dierent order We rst calculate the scattering
of the incident wave from each object This is the rst order scattered wave The rst
order scattered waves are incident on and consequently scattered by the surrounding
objects resulting in second order scattered waves whose amplitude is smaller than
the rst order wave For two spherical objects embedded in an innite homogeneous

Chapter Migration of Diuse Photon Density Waves
Table Results for the tted object reduced scattering coecient versus dierentTiO concentrations
Background TiO Concentration Object
Exp s cm a cm grams TiO ! ml Resin s cm
A
B
C
D
E
F
G
H
Boas Diuse Photon Probes of Turbid Media Theory and Applications
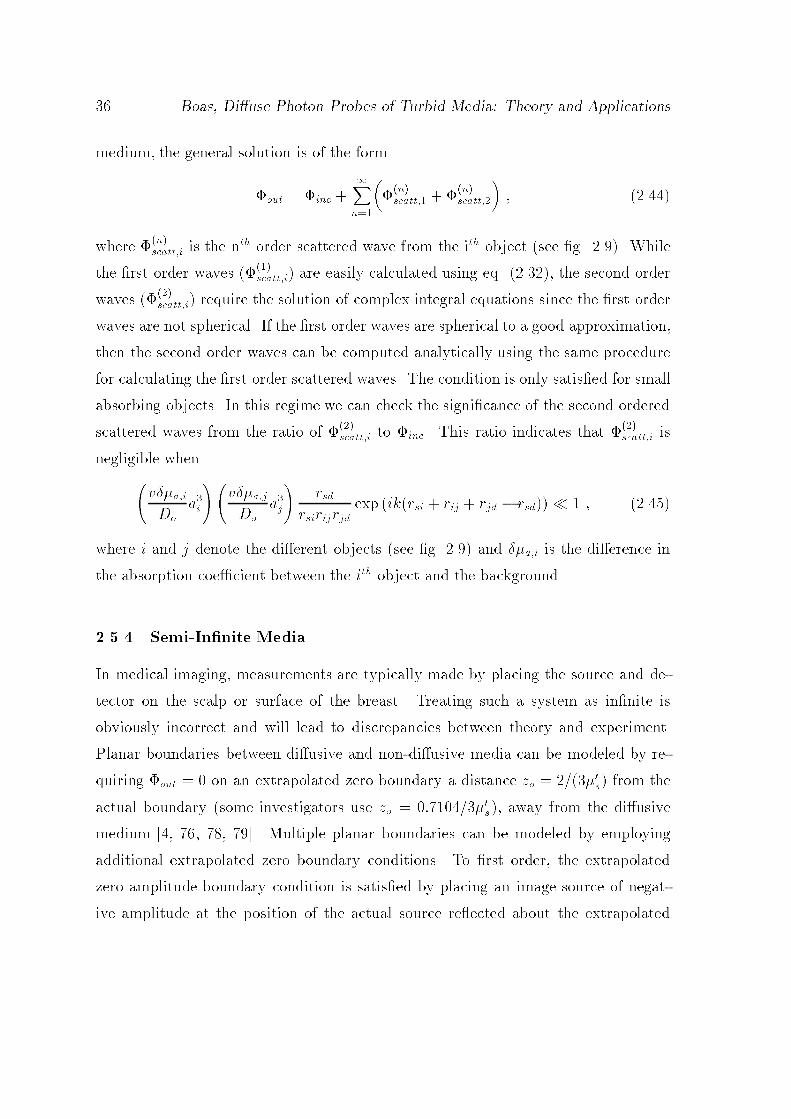
medium the general solution is of the form
out inc Xn
nscatt
nscatt
where nscatti is the nth order scattered wave from the ith object see g While
the rst order waves scatti are easily calculated using eq the second order
waves scatti require the solution of complex integral equations since the rst order
waves are not spherical If the rst order waves are spherical to a good approximation
then the second order waves can be computed analytically using the same procedure
for calculating the rst order scattered waves The condition is only satised for small
absorbing objects In this regime we can check the signicance of the second ordered
scattered waves from the ratio of scatti to inc This ratio indicates that
scatti is
negligible when
vaiDo
ai
vajDo
aj
rsd
rsirijrjdexp ikrsi rij rjd rsd
where i and j denote the dierent objects see g and ai is the dierence in
the absorption coecient between the ith object and the background
SemiInnite Media
In medical imaging measurements are typically made by placing the source and de
tector on the scalp or surface of the breast Treating such a system as innite is
obviously incorrect and will lead to discrepancies between theory and experiment
Planar boundaries between diusive and nondiusive media can be modeled by re
quiring out on an extrapolated zero boundary a distance zo s from the
actual boundary some investigators use zo s away from the diusive
medium Multiple planar boundaries can be modeled by employing
additional extrapolated zero boundary conditions To rst order the extrapolated
zero amplitude boundary condition is satised by placing an image source of negat
ive amplitude at the position of the actual source reected about the extrapolated
Chapter Migration of Diuse Photon Density Waves
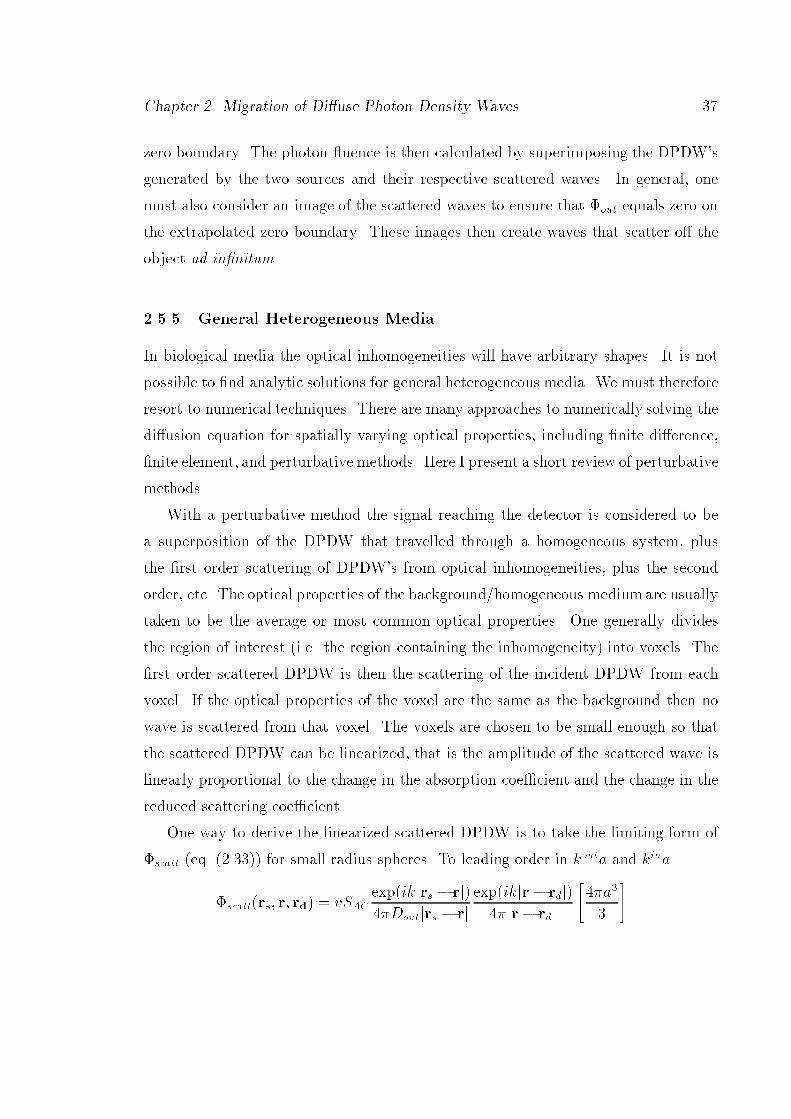
zero boundary The photon uence is then calculated by superimposing the DPDWs
generated by the two sources and their respective scattered waves In general one
must also consider an image of the scattered waves to ensure that out equals zero on
the extrapolated zero boundary These images then create waves that scatter o the
object ad innitum
General Heterogeneous Media
In biological media the optical inhomogeneities will have arbitrary shapes It is not
possible to nd analytic solutions for general heterogeneous media We must therefore
resort to numerical techniques There are many approaches to numerically solving the
diusion equation for spatially varying optical properties including nite dierence
nite element and perturbative methods Here I present a short review of perturbative
methods
With a perturbative method the signal reaching the detector is considered to be
a superposition of the DPDW that travelled through a homogeneous system plus
the rst order scattering of DPDWs from optical inhomogeneities plus the second
order etc The optical properties of the background!homogeneous medium are usually
taken to be the average or most common optical properties One generally divides
the region of interest ie the region containing the inhomogeneity into voxels The
rst order scattered DPDW is then the scattering of the incident DPDW from each
voxel If the optical properties of the voxel are the same as the background then no
wave is scattered from that voxel The voxels are chosen to be small enough so that
the scattered DPDW can be linearized that is the amplitude of the scattered wave is
linearly proportional to the change in the absorption coecient and the change in the
reduced scattering coecient
One way to derive the linearized scattered DPDW is to take the limiting form of
scatt eq for small radius spheres To leading order in kouta and kina
scattrs r rd vSACexpikjrs rj Doutjrs rj
expikjr rdj jr rdj
a
Boas Diuse Photon Probes of Turbid Media Theory and Applications
varDout
ik
jrs rj
ik
jr rdj
sr cos
sout sr
Here a ainaout is the dierence in the absorption coecient of the voxel and
background s sin sout is the dierence in the reduced scattering coecient
k kout and is the angle between the line joining the source to the voxel and the
line joining the detector to the voxel The volume for a sphere of radius a appears in
eq If the voxel is not a sphere then the a must be replaced by the actual
volume of the voxel
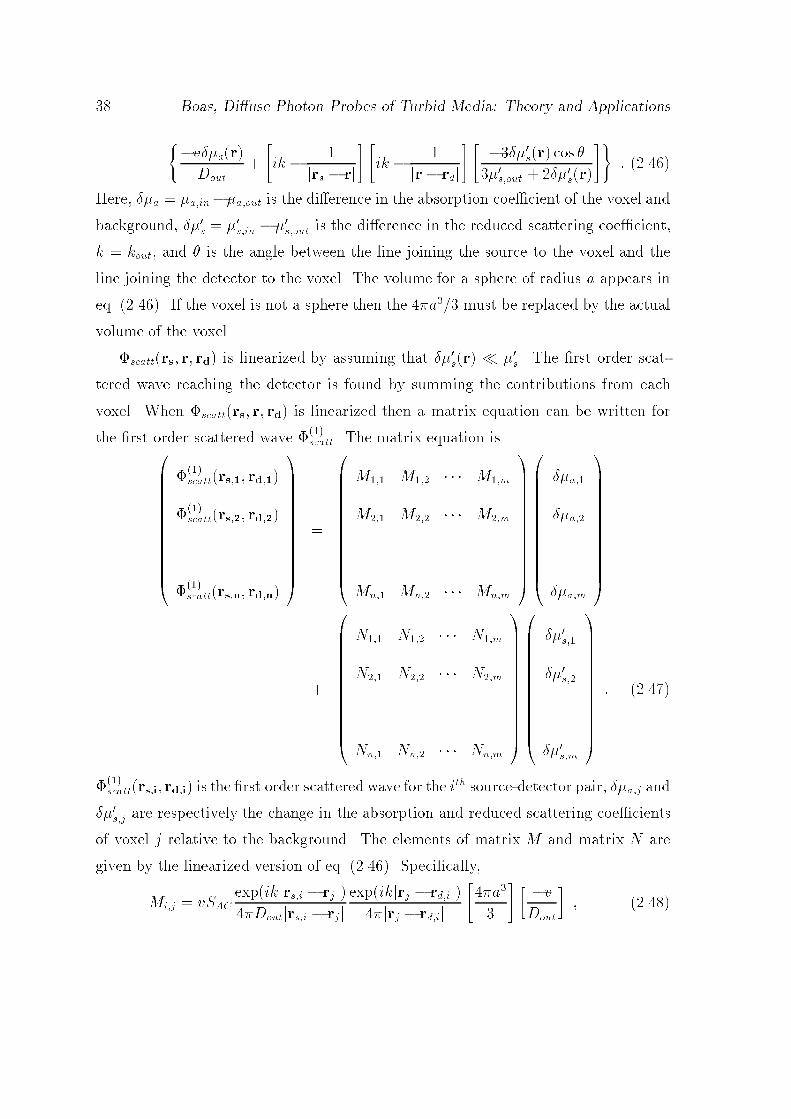
scattrs r rd is linearized by assuming that sr s The rst order scat
tered wave reaching the detector is found by summing the contributions from each
voxel When scattrs r rd is linearized then a matrix equation can be written for
the rst order scattered wave scatt The matrix equation is
BBBBBBBBBBBBB
scattrs rd
scattrs rd
scattrsn rdn
CCCCCCCCCCCCCA
BBBBBBBBBBBBB
M M Mm
M M Mm
Mn Mn Mnm
CCCCCCCCCCCCCA
BBBBBBBBBBBBB
a
a
am
CCCCCCCCCCCCCA
BBBBBBBBBBBBB
N N Nm
N N Nm
Nn Nn Nnm
CCCCCCCCCCCCCA
BBBBBBBBBBBBB
s
s
sm
CCCCCCCCCCCCCA
scattrsi rdi is the rst order scattered wave for the ith sourcedetector pair aj and
sj are respectively the change in the absorption and reduced scattering coecients
of voxel j relative to the background The elements of matrix M and matrix N are
given by the linearized version of eq Specically
Mij vSACexpikjrsi rjj Doutjrsi rjj
expikjrj rdij jrj rdij
a
vDout

Chapter Migration of Diuse Photon Density Waves
and
Nij vSACexpikjrsi rjj Doutjrsi rjj
expikjrj rdij jrj rdij
a
ik
jrsi rjj
ik
jrj rdij
cos ijsout
where rj is the position of the jth voxel and rsi and rdi are the position of the ith
source and detector respectively
This same matrix equation can be found directly from the heterogeneous diusion
equation When the optical properties are spatially varying then the photon diusion
equation is
rDr rrDrrr varr ir vSr
Separating the spatially constant terms to the lefthand side and the spatially varying
terms to the righthand side we get
rr vaoDo
r i
Dor
v
DrSr
sorsr rr
var
Do
r ao i
v
sr
The solution to this equation is after integrating rsr rr by parts and recog
nizing that r ko
r vSo exp ikojr rsj
Dojr rsj Z var
DorGr r
sr
sorr rGr r
dr
This equation is usually solved perturbatively by assuming that
This is known as the Born approximation Substituting this perturbative
expansion into eq and collecting terms of like order we obtain
rs rd vSo exp ikojrd rsj
Dojrd rsj
Boas Diuse Photon Probes of Turbid Media Theory and Applications
Time
Intensity
Frequency
Power
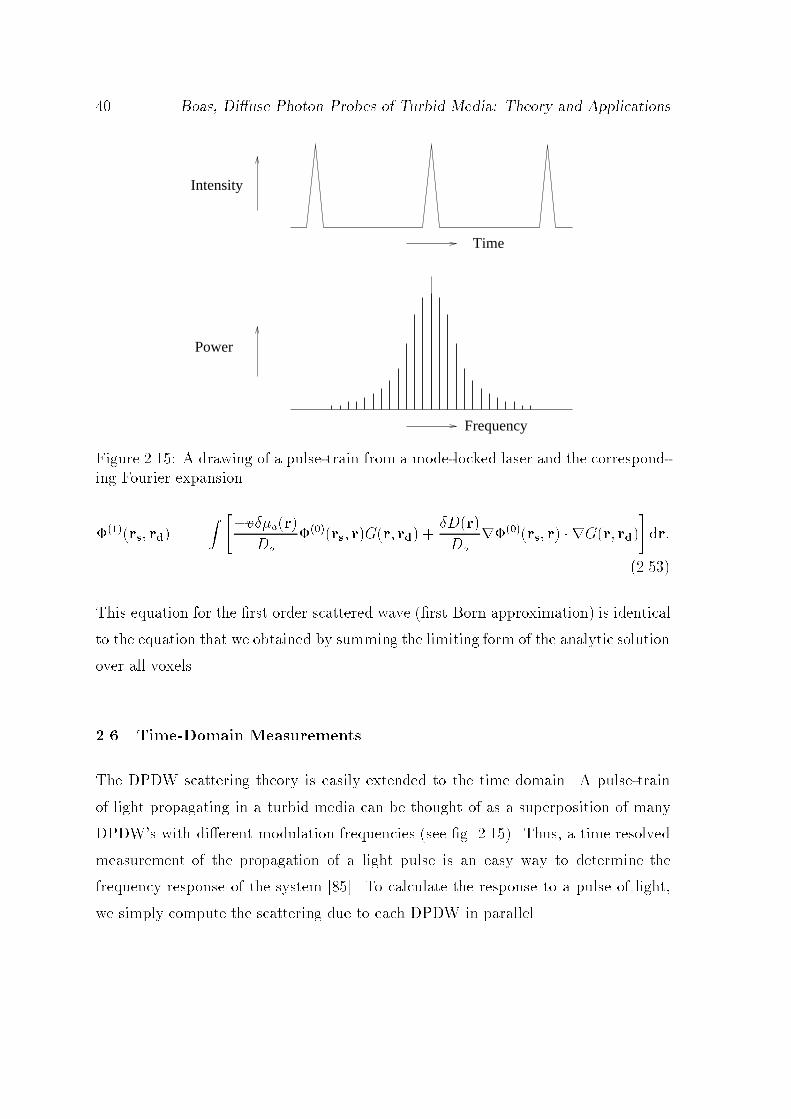
Figure A drawing of a pulsetrain from a modelocked laser and the corresponding Fourier expansion
rs rd Z var
Dors rGr rd
Dr
Dorrs r rGr rd
dr
This equation for the rst order scattered wave rst Born approximation is identical
to the equation that we obtained by summing the limiting form of the analytic solution
over all voxels
TimeDomain Measurements
The DPDW scattering theory is easily extended to the time domain A pulsetrain
of light propagating in a turbid media can be thought of as a superposition of many
DPDWs with dierent modulation frequencies see g Thus a time resolved
measurement of the propagation of a light pulse is an easy way to determine the
frequency response of the system To calculate the response to a pulse of light
we simply compute the scattering due to each DPDW in parallel

Chapter Migration of Diuse Photon Density Waves
I computed the temporal evolution of a light pulse with width ps and period
T s in an innite medium with dierent size perfect absorbers The results
indicate that the measured photon uence decreases as a result of an absorber but
that the decay rate of the uence is relatively unaected by its presence These results
are consistent with the experimental observations of Liu et al
Photon Migration within the P Approximation
At optical wavelengths between and nm the absorption of photons in the
body is generally small compared to the corresponding scattering rate Thus a major
condition for the validity of the diusion approximation is satised The criteria is
sometimes violated in hematomas liver and other regions with large concentrations of
blood where photon absorption is large A more accurate model of photon transport
is required to describe and analyze photon migration through these systems This
section presents the P solution of the transport equation which is a more
accurate approximation for photon transport than the diusion approximation I
demonstrate the advantages and disadvantages of the P approximation for analyzing
highly absorbing systems I nd that the P approximation in general permits a more
accurate determination of the reduced scattering s and absorption a coecients
for highly absorbing systems ie a
s or systems probed at modulation
frequencies in excess of to GHz In systems with highly anisotropic scattering
ie hcos i determination of the reduced scattering coecient using the P
approximation gives values comparable to results obtained within the diusion P
approximation
P Theory
The transport equation was presented in section eq along with a description
of the PN approximation method Here I present the solution of the P approxim
ation and discuss the limits in which the P approximation reduces to the diusion
Boas Diuse Photon Probes of Turbid Media Theory and Applications
approximation The P equations are not solved because of inconsistencies that arise
at boundaries
Expanding the radiance Lr t phase function f and source Sr t
terms of the transport equation eq in spherical harmonics and evaluating the
integral over d the transport equation is rewritten as
Xlm
v
lmt
r lm lt lm qlm
Ylm
where lt s gl a note
t a gl is the coecient for the lth moment
of the normalized phase function For the HenyeyGreenstein phase function gl gl
where g is the average cosine of the scattering angle see appendix B When the
photon scattering is anisotropic then lt
lt
Next we multiply eq by Y and integrate over Using the ortho
gonality relations for the spherical harmonics we obtain an innite set of coupled
linear dierential equations for lm that agree with Kaltenbach and Kaschke See
appendix A for these calculations Within the P approximation the moments greater
than l are ignored ie we set lm for l By considering higher moments
of the radiance the P approximation should be more accurate than the diusion ap
proximation However the P approximation will break down as the anisotropy of the
radiance is increased by increasing photon absorption and!or the DPDW modulation
frequency
Working in the frequency domain ie t i the equation for in a
homogeneous medium is
r r
r Wqr Xqr Y qr Zqr
where
v i
v
a
t
t
t
at a
t
t
t
iv
aiv
t i
v
t i
v
t
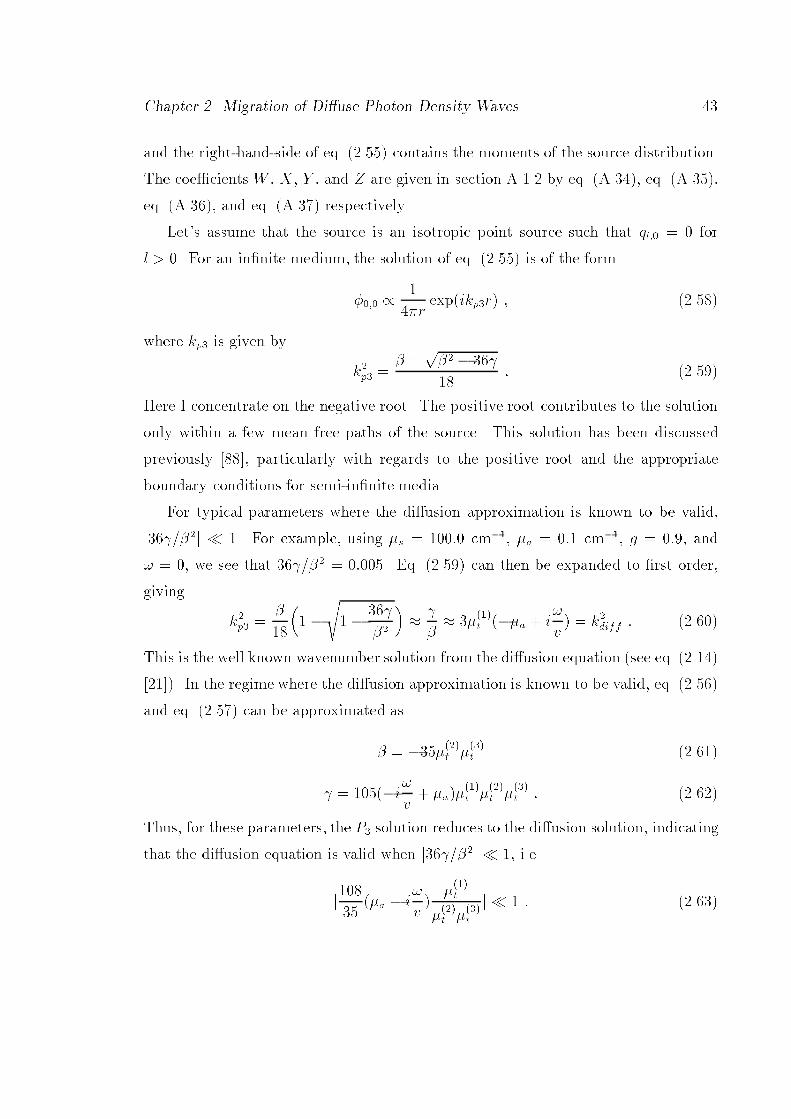
Chapter Migration of Diuse Photon Density Waves
and the righthandside of eq contains the moments of the source distribution
The coecients W X Y and Z are given in section A by eq A eq A
eq A and eq A respectively
Lets assume that the source is an isotropic point source such that ql for
l For an innite medium the solution of eq is of the form
rexpikpr
where kp is given by
kp p
Here I concentrate on the negative root The positive root contributes to the solution
only within a few mean free paths of the source This solution has been discussed
previously particularly with regards to the positive root and the appropriate
boundary conditions for semiinnite media
For typical parameters where the diusion approximation is known to be valid
jj For example using s cm a cm g and
we see that Eq can then be expanded to rst order
giving
kp
s
t a i
v kdiff
This is the well known wavenumber solution from the diusion equation see eq
In the regime where the diusion approximation is known to be valid eq
and eq can be approximated as
t t
iv
at
t
t
Thus for these parameters the P solution reduces to the diusion solution indicating
that the diusion equation is valid when jj ie
j
a i
v
t
t
t
j

Boas Diuse Photon Probes of Turbid Media Theory and Applications
For systems that do not satisfy this condition it is believed that the full solution of
the P equation would more accurately approximate photon transport through the
system Furthermore from this condition we see that the limits of validity of the
diusion equation can be checked by increasing a relative to s increasing
v relative to s and decreasing the scattering anisotropy factor while holding
s constant
Comparison of P and Diusion Theories
To test the usefulness of the P approximation compared to the diusion approxima
tion I rst generated data for known parameters using a Monte Carlo computer code
for photon transport in an innite homogeneous system The code is explained in
section and supplied in appendix C The Monte Carlo code was used to nd the
temporal response to a pulse of light injected into a homogeneous innite medium for
various optical properties and scattering anisotropies I then used the generated data
to compare diusion theory and P as a function of a the modulation frequency
by Fourier transforming the data and the scattering anisotropy The comparison was
made by tting amplitude and phase data versus the sourcedetector separation using
the P solution and diusion solution to nd s and a Sourcedetector separations
ranging from to cm in steps of cm were used
Fig displays the optical properties determined from the Monte Carlo data
using the P approximation and the diusion approximation versus the known ab
sorption coecient of the medium Results are plotted for data generated with two
dierent anisotropy factors All results in g are for a modulation frequency
of MHz The analysis based on the P approximation is signicantly better than
diusion theory at determining the correct s when the scattering is isotropic ie
g and the absorption coecient exceeds of the known reduced scattering
coecient A similiar dierence is observed for the determined absorption coecient
For anisotropic scattering g we see that in nding s the P approximation
is not as good as the diusion approximation when a
s although P still en

Chapter Migration of Diuse Photon Density Waves
ables a more accurate determination of a This is most likely a result of a premature
truncation of the spherical harmonic expansion of the phase function in arriving at
the P theory In diusion theory the anisotropy is implicitly contained in the reduced
scattering coecient while in the P theory the anisotropy is expressed explicitly
Modifying the P theory with the E approximation discussed by Star may
improve the determination of s Basically within the E approximation a delta
function is added to spherical harmonics expansion of the phase function eq
to compensate for the truncation
To investigate the accuracy of the diusion approximation and the P approxim
ation for high modulation frequencies I used Monte Carlo data for a system with
s cm and a cm and calculated the optical properties using both
approximations for frequency components ranging from to GHz The results are
plotted in g for a system with isotropic scattering g a and b and aniso
tropic scattering with g g c and d In the case of isotropic scattering
the P approximation is in general more accurate than diusion theory although dif
fusion theory is accurate to for modulation frequencies less than GHz For
anisotropic scattering however s is more accurately determined by diusion theory
up to GHz while P is superior for determining a Similar trends are observed for
dierent absorption coecients
Summary
We have seen that the migration of photons in highly scattering media can be treated
by the photon diusion equation For an intensity modulated source the diusion
equation predicts a coherent photon density waves that propagate spherically outwards
from the source and this has been observed Although microscopically the photons
are individually following a random walk macroscopically they produce a coherent
intensity wave The properties of this intensity wave can be understood using conven
tional optics This was demonstrated experimentally with the refraction of DPDWs
Boas Diuse Photon Probes of Turbid Media Theory and Applications
Figure A comparison of diusion theory closed circles and the P approximation open circles for nding the scattering top and absorption bottom propertiesof an innite system is presented as a function of the known absorption coecientof the medium s was xed at cm The results for isotropic scattering arepresented in a and b and the anisotropic results are given in c and d

Chapter Migration of Diuse Photon Density Waves
Figure Optical properties determined using diusion theory stars and P diamonds are compared with the known optical properties solid line as a function ofthe modulation frequency The results for isotropic scattering are presented in a andb and the anisotropic results are given in c and d

Boas Diuse Photon Probes of Turbid Media Theory and Applications
at a planar interface between two dierent scattering media and the refraction dif
fraction and scattering by spherical inhomogeneities Interestingly the scattering is
accurately modeled by an analytic solution of the Helmholtz equation and is analog
ous to a scalar version of Mie Theory for the scattering of electromagnetic waves from
dielectric spheres Experimental observations demonstrate that this solution can be
used in conjunction with a simple imaging algorithm to characterize spherical ob
jects Finally we looked at higher order approximations to the transport equation
specically the P approximation and found that the applicability of DPDWs could
be extended to probe highly absorbing media such as liver and hematomas
Chapter
Practical Limits to the Detection Localization and Characterization of
Optical Inhomogeneities with Diuse Photon Density Waves
In the previous chapter I demonstrated various physical properties of diuse photon
density waves DPDWs and showed that DPDWs are perturbed by the presence
of optical inhomogeneities and that by measuring the perturbation of a DPDW it is
possible to detect localize and characterize the inhomogeneities It is desirable to
establish fundamental limits for the detection localization and characterization of
optical inhomogeneities in order to assess the degree with which diusing photons can
be eectively used to provide physiological information about tissues An understand
ing of these limiting factors will lead to the optimization of medical optical imaging
prototypes
Since measurements are made in the neareld ie within one DPDW wavelength
of the source the usual diraction criteria are inadequate for resolution determina
tions In the neareld resolution is intimately related to the signaltonoise ratio of
the measurement The resolving power of DPDWs has been studied within this con
text by comparing the amplitude of the spatial frequencies with the noise level
Additionally the resolving power of pulsetime measurements has been examined us
ing temporal point spread functions No analysis however has been
made that focuses on limitations for the detection localization and characterization
of optical inhomogeneities with DPDWs
Boas Diuse Photon Probes of Turbid Media Theory and Applications
This chapter presents such an analysis The signals are calculated using the ana
lytic model for the scattering of DPDWs discussed in section Two
dierent noise models are considered shotnoise and random errors due to positional
uncertainty of the source and detector My analysis indicates that uncertainties in
source detector and sample position limits detection to millimeter size objects and
full optical characterization to centimeter size objects I show how small improve
ments can be made by optimizing the measurement geometry and source modulation
frequency I nd that modulation frequencies less than MHz are optimal for de
tection and characterization For higher modulation frequencies the noise threshold
increases with the modulation frequency more than the relevant signal In addition
I show that spectral measurements ie using DPDW information at several source
modulation frequencies enhance the characterization of scattering objects but not ab
sorbing objects Schemes for optimizing measurement protocols for clinically relevant
systems are discussed
The Models
In order to determine the limits for detection and characterization of localized hetero
geneities I utilize exact models A spherical inhomogeneity embedded in an otherwise
homogeneous turbid medium is used as the standard system see g for assessing
the limits The turbid medium is an innite slab of nite thickness Measurements
are made in transmission mode at a single photon wavelength For an ideal experi
mental system the signaltonoise ratio is shotnoise limited and thus scales with the
squareroot of the number of photons detected However there are other sources of
random error that exceed shotnoise such as the positional uncertainty of the source
and detector relative to the sample I consider these eects in the following sections
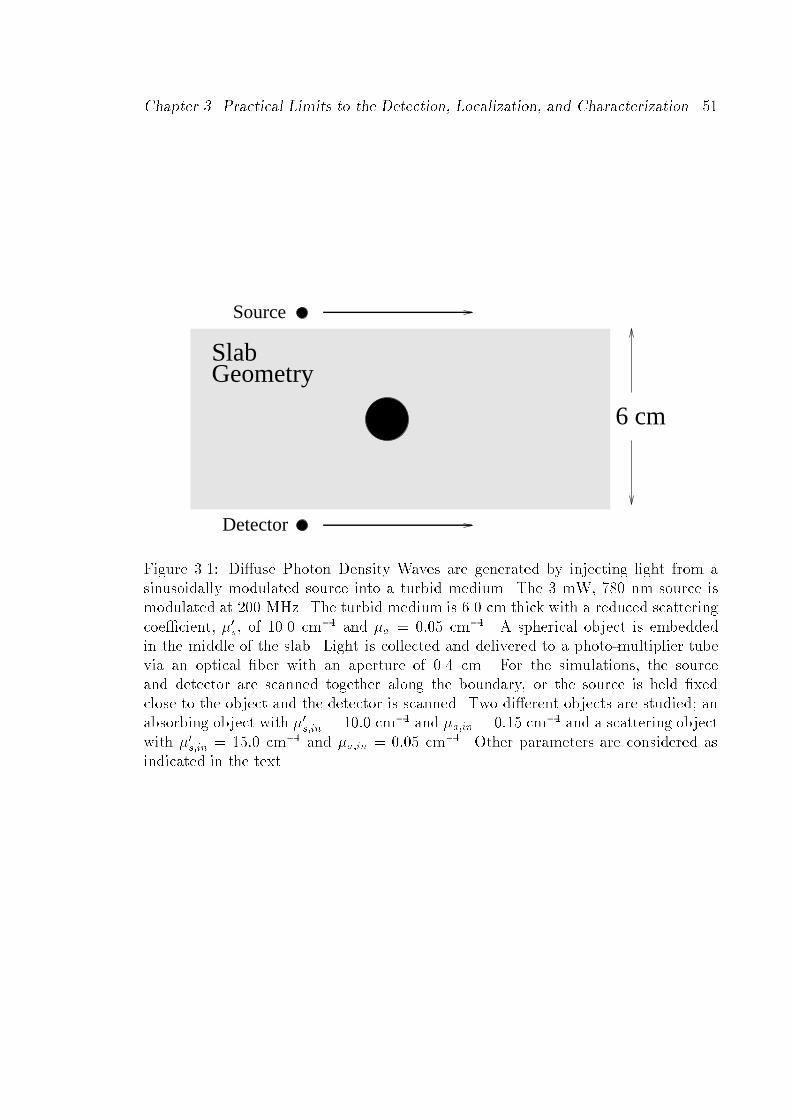
Chapter Practical Limits to the Detection Localization and Characterization
Source
Detector
6 cm
SlabGeometry
Figure Diuse Photon Density Waves are generated by injecting light from asinusoidally modulated source into a turbid medium The mW nm source ismodulated at MHz The turbid medium is cm thick with a reduced scatteringcoecient s of cm and a cm A spherical object is embeddedin the middle of the slab Light is collected and delivered to a photomultiplier tubevia an optical ber with an aperture of cm For the simulations the sourceand detector are scanned together along the boundary or the source is held xedclose to the object and the detector is scanned Two dierent objects are studied anabsorbing object with sin cm and ain cm and a scattering objectwith sin cm and ain cm Other parameters are considered asindicated in the text
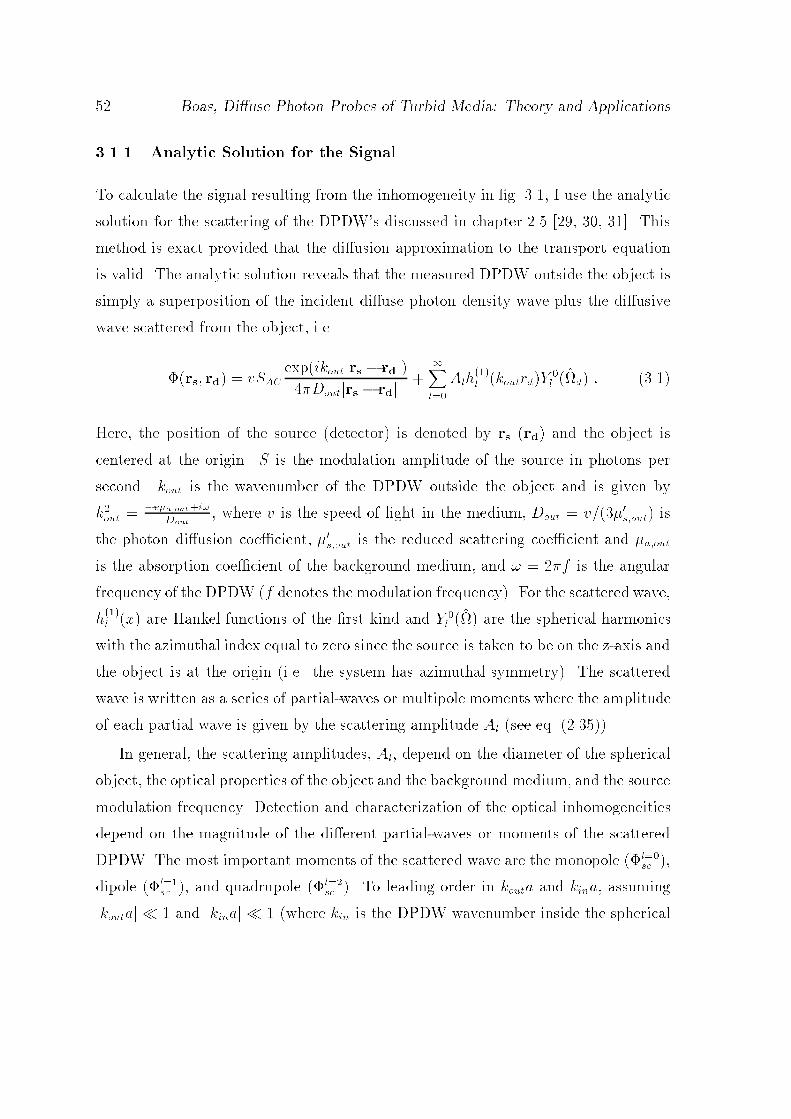
Boas Diuse Photon Probes of Turbid Media Theory and Applications
Analytic Solution for the Signal
To calculate the signal resulting from the inhomogeneity in g I use the analytic
solution for the scattering of the DPDWs discussed in chapter This
method is exact provided that the diusion approximation to the transport equation
is valid The analytic solution reveals that the measured DPDW outside the object is
simply a superposition of the incident diuse photon density wave plus the diusive
wave scattered from the object ie
rs rd vSACexpikoutjrs rdjDoutjrs rdj
Xl
Alhl koutrdY
l d
Here the position of the source detector is denoted by rs rd and the object is
centered at the origin S is the modulation amplitude of the source in photons per
second kout is the wavenumber of the DPDW outside the object and is given by
kout vaouti
Dout where v is the speed of light in the medium Dout vsout is
the photon diusion coecient sout is the reduced scattering coecient and aout
is the absorption coecient of the background medium and f is the angular
frequency of the DPDW f denotes the modulation frequency For the scattered wave
hl x are Hankel functions of the rst kind and Y
l are the spherical harmonics
with the azimuthal index equal to zero since the source is taken to be on the zaxis and
the object is at the origin ie the system has azimuthal symmetry The scattered
wave is written as a series of partialwaves or multipole moments where the amplitude
of each partial wave is given by the scattering amplitude Al see eq
In general the scattering amplitudes Al depend on the diameter of the spherical
object the optical properties of the object and the background medium and the source
modulation frequency Detection and characterization of the optical inhomogeneities
depend on the magnitude of the dierent partialwaves or moments of the scattered
DPDW The most important moments of the scattered wave are the monopole lsc
dipole lsc and quadrupole l
sc To leading order in kouta and kina assuming
jkoutaj and jkinaj where kin is the DPDW wavenumber inside the spherical
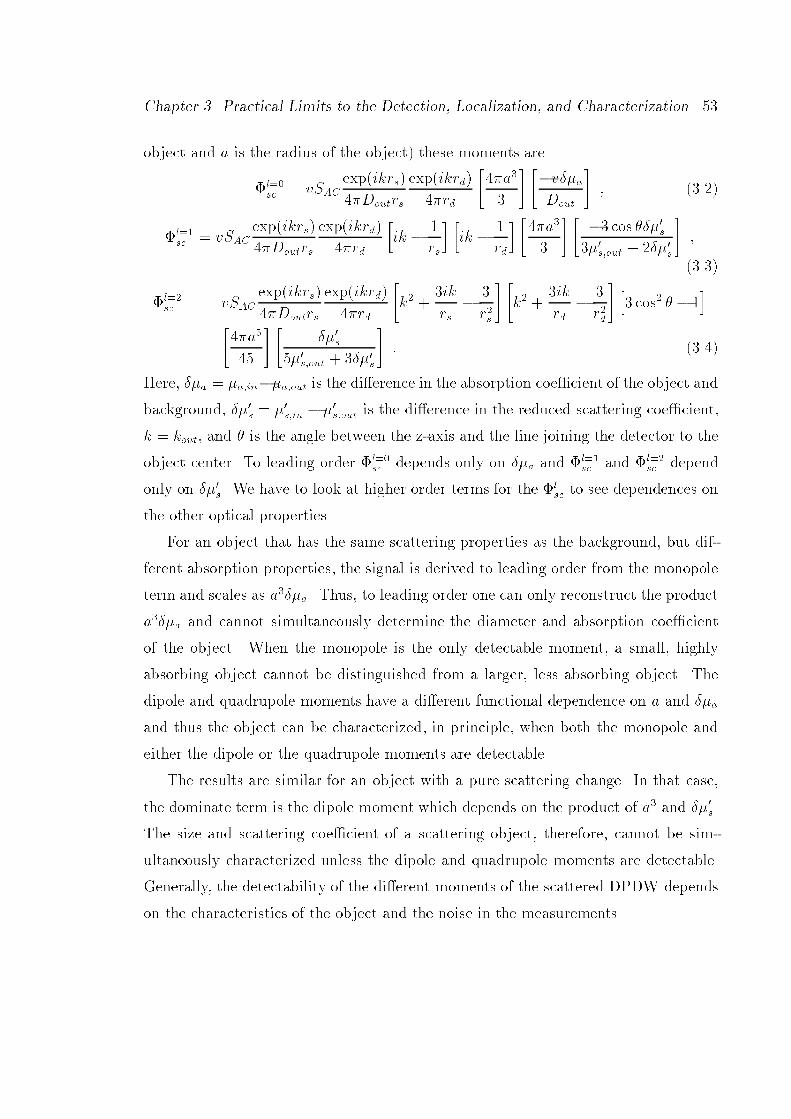
Chapter Practical Limits to the Detection Localization and Characterization
object and a is the radius of the object these moments are
lsc vSAC
expikrs
Doutrs
expikrd
rd
a
vaDout
lsc vSAC
expikrs
Doutrs
expikrd
rd
ik
rs
ik
rd
a
cos ssout s
lsc vSAC
expikrs
Doutrs
expikrd
rd
k
ik
rs
rs
k
ik
rd
rd
h cos
ia
s
sout s
Here a ainaout is the dierence in the absorption coecient of the object and
background s sin sout is the dierence in the reduced scattering coecient
k kout and is the angle between the zaxis and the line joining the detector to the
object center To leading order lsc depends only on a and l
sc and lsc depend
only on s We have to look at higher order terms for the lsc to see dependences on
the other optical properties
For an object that has the same scattering properties as the background but dif
ferent absorption properties the signal is derived to leading order from the monopole
term and scales as aa Thus to leading order one can only reconstruct the product
aa and cannot simultaneously determine the diameter and absorption coecient
of the object When the monopole is the only detectable moment a small highly
absorbing object cannot be distinguished from a larger less absorbing object The
dipole and quadrupole moments have a dierent functional dependence on a and a
and thus the object can be characterized in principle when both the monopole and
either the dipole or the quadrupole moments are detectable
The results are similar for an object with a pure scattering change In that case
the dominate term is the dipole moment which depends on the product of a and s
The size and scattering coecient of a scattering object therefore cannot be sim
ultaneously characterized unless the dipole and quadrupole moments are detectable
Generally the detectability of the dierent moments of the scattered DPDW depends
on the characteristics of the object and the noise in the measurements
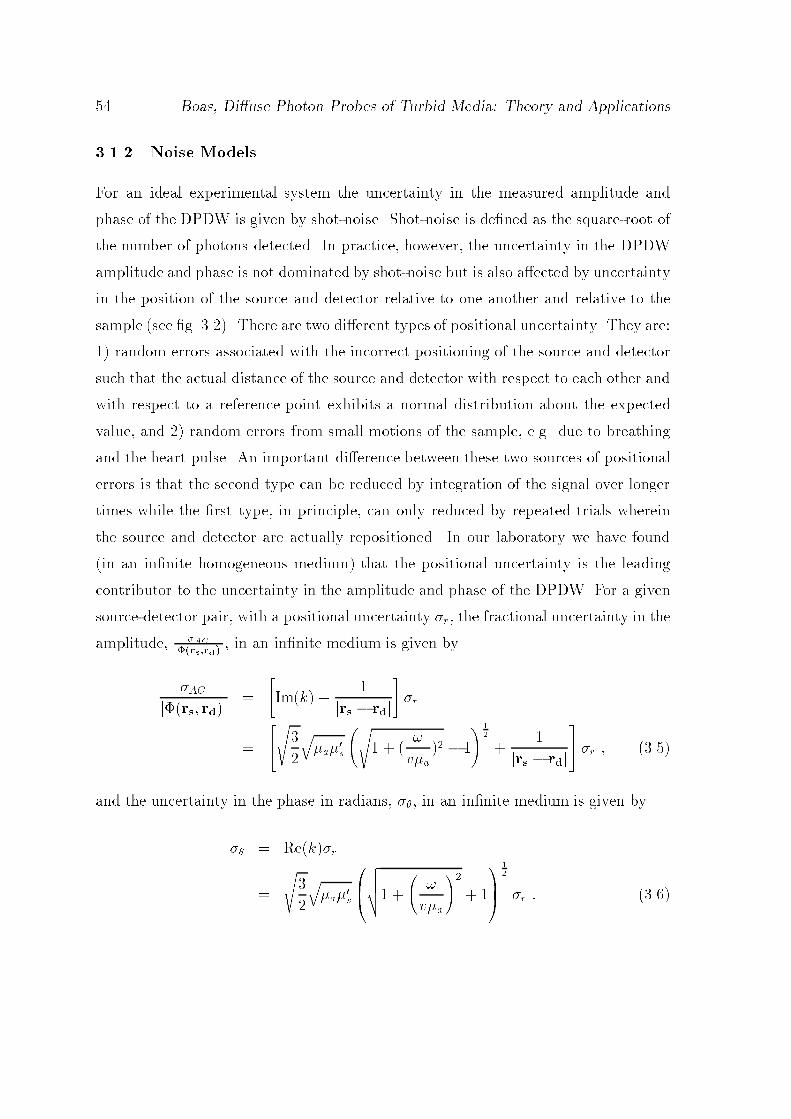
Boas Diuse Photon Probes of Turbid Media Theory and Applications
Noise Models
For an ideal experimental system the uncertainty in the measured amplitude and
phase of the DPDW is given by shotnoise Shotnoise is dened as the squareroot of
the number of photons detected In practice however the uncertainty in the DPDW
amplitude and phase is not dominated by shotnoise but is also aected by uncertainty
in the position of the source and detector relative to one another and relative to the
sample see g There are two dierent types of positional uncertainty They are
random errors associated with the incorrect positioning of the source and detector
such that the actual distance of the source and detector with respect to each other and
with respect to a reference point exhibits a normal distribution about the expected
value and random errors from small motions of the sample eg due to breathing
and the heart pulse An important dierence between these two sources of positional
errors is that the second type can be reduced by integration of the signal over longer
times while the rst type in principle can only reduced by repeated trials wherein
the source and detector are actually repositioned In our laboratory we have found
in an innite homogeneous medium that the positional uncertainty is the leading
contributor to the uncertainty in the amplitude and phase of the DPDW For a given
sourcedetector pair with a positional uncertainty r the fractional uncertainty in the
amplitude ACjrsrdj
in an innite medium is given by
ACjrs rdj
Imk
jrs rdj
r
s
qas
s
va
jrs rdj
r
and the uncertainty in the phase in radians in an innite medium is given by
Rekr
s
qas
Bvuut
va
CA
r
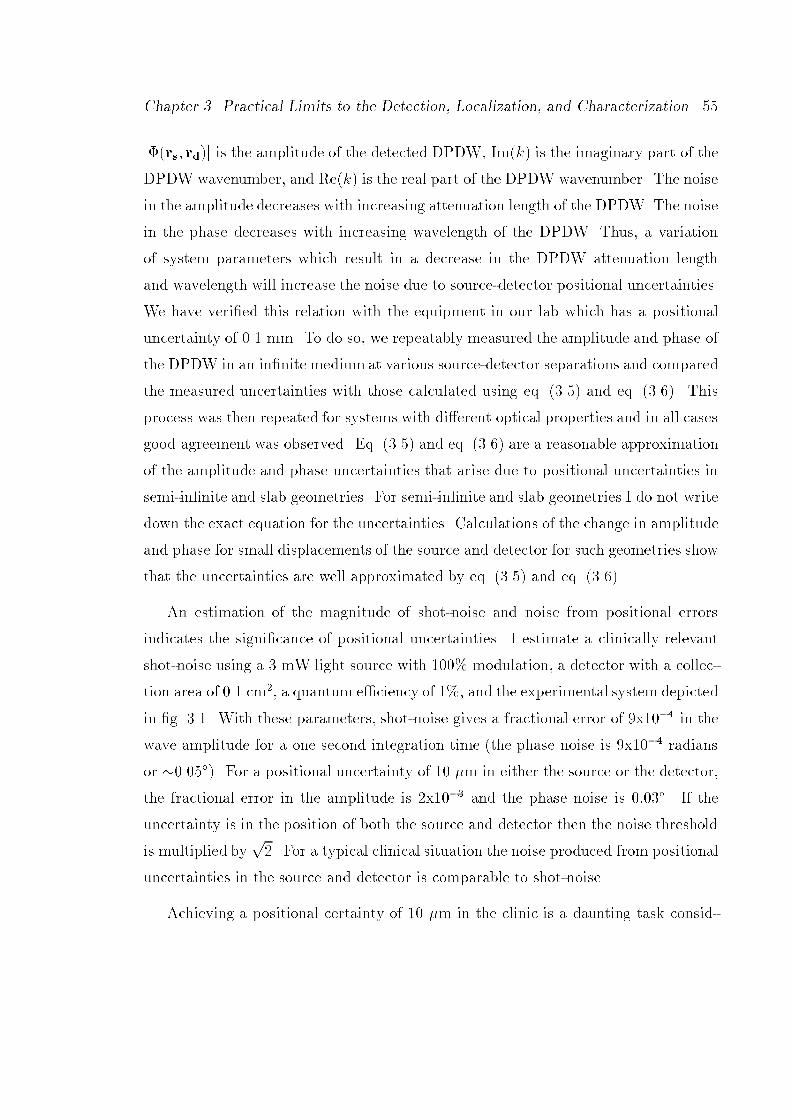
Chapter Practical Limits to the Detection Localization and Characterization
jrs rdj is the amplitude of the detected DPDW Imk is the imaginary part of the
DPDW wavenumber and Rek is the real part of the DPDW wavenumber The noise
in the amplitude decreases with increasing attenuation length of the DPDW The noise
in the phase decreases with increasing wavelength of the DPDW Thus a variation
of system parameters which result in a decrease in the DPDW attenuation length
and wavelength will increase the noise due to sourcedetector positional uncertainties
We have veried this relation with the equipment in our lab which has a positional
uncertainty of mm To do so we repeatably measured the amplitude and phase of
the DPDW in an innite medium at various sourcedetector separations and compared
the measured uncertainties with those calculated using eq and eq This
process was then repeated for systems with dierent optical properties and in all cases
good agreement was observed Eq and eq are a reasonable approximation
of the amplitude and phase uncertainties that arise due to positional uncertainties in
semiinnite and slab geometries For semiinnite and slab geometries I do not write
down the exact equation for the uncertainties Calculations of the change in amplitude
and phase for small displacements of the source and detector for such geometries show
that the uncertainties are well approximated by eq and eq
An estimation of the magnitude of shotnoise and noise from positional errors
indicates the signicance of positional uncertainties I estimate a clinically relevant
shotnoise using a mW light source with modulation a detector with a collec
tion area of cm a quantum eciency of and the experimental system depicted
in g With these parameters shotnoise gives a fractional error of x in the
wave amplitude for a one second integration time the phase noise is x radians
or For a positional uncertainty of m in either the source or the detector
the fractional error in the amplitude is x and the phase noise is If the
uncertainty is in the position of both the source and detector then the noise threshold
is multiplied byp For a typical clinical situation the noise produced from positional
uncertainties in the source and detector is comparable to shotnoise
Achieving a positional certainty of m in the clinic is a daunting task consid

Boas Diuse Photon Probes of Turbid Media Theory and Applications
rσSource
Detector
DetectorSourcerσ
(b)
(a)
Figure Errors from positional uncertainty can arise from an inaccurate positioningof the source and detector relative to each other as depicted in a andor relativeto the sample under study as shown in b These errors are random unless novibrations are present and no realignment of the source and detector are made formultiple measurements In a clinical environment vibrations will be present due tobreathing and the heart beat In case a and b r is reduced by making repeatedmeasurements Positional uncertainties induced by sample vibrations of type b arereduced by longer integration times

Chapter Practical Limits to the Detection Localization and Characterization
ering the motional artifacts arising from the respiration and pulse of the subjects A
more realistic positional uncertainty of m will result in a uncertainty in the
amplitude and degree uncertainty in the phase These results are for a best case
scenario and are based on the shotnoise arising under the above described conditions
and the additional noise arising from a positional uncertainty of m These two
types of noise will be reduced by thepN where N is the number of independent
measurements averaged to obtain a single value for the amplitude and the phase
Description of Simulations
All results in this chapter for the detection and characterization of optical inhomogen
eities using DPDWs are based on analytic calculations of the distorted DPDW with
appropriate levels of random noise The sample is an innite slab cm thick random walk steps thick which is homogeneous except for a spherical heterogeneity
centered between the input and output planes of the slab Measurements are made in
transmission mode ie the source is on one side of the slab and the detector is on the
other side Two types of spherical objects are considered an absorbing object which
has the same scattering coecient as the background and a scattering object which
has the same absorption coecient as the background
To study the limits for detection and localization of these objects the source and
detector are scanned together along the surface of the slab The perturbation to the
amplitude and phase of the DPDW by the object can be described respectively by
the ratio of the amplitudes with and without the object and the dierence in the phase
with and without the object
In Section the detectability of the object is found by comparing this perturb
ation with the noise level If the perturbation is greater than the noise level the
object is deemed detectable A large portion of parameter space is studied by vary
ing the background optical properties the object optical properties and the DPDW
modulation frequency Note that at each detector position the signal is integrated for
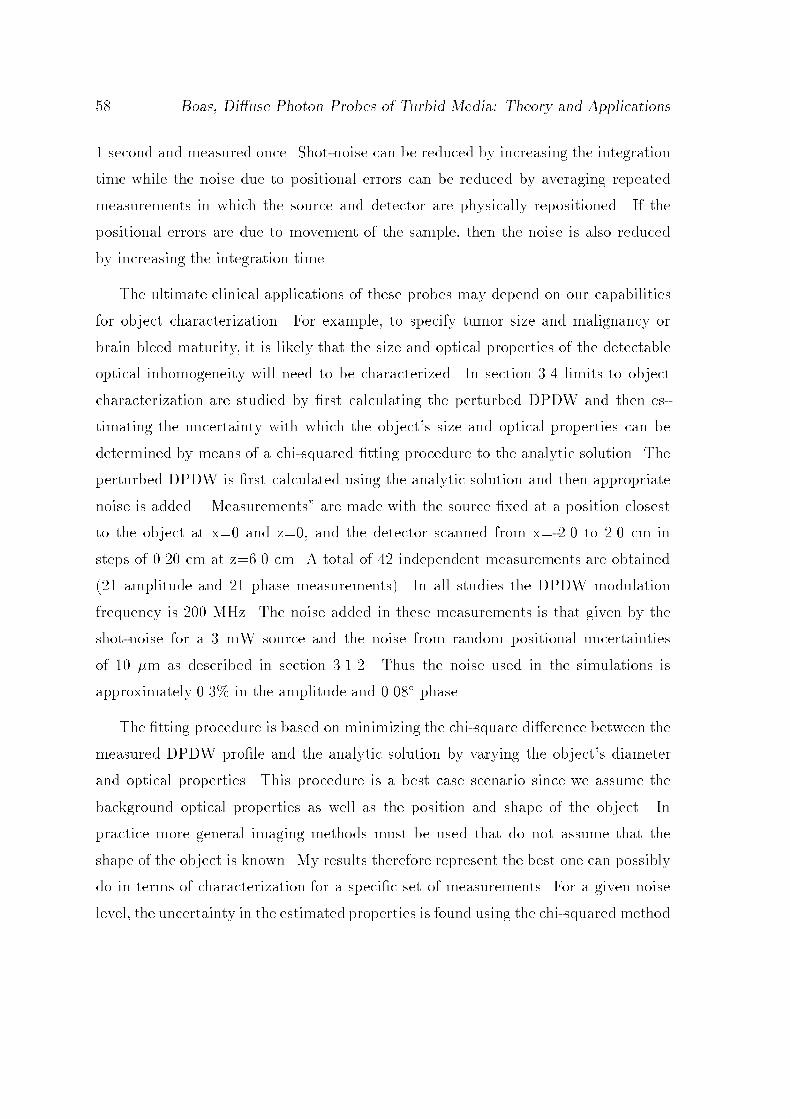
Boas Diuse Photon Probes of Turbid Media Theory and Applications
second and measured once Shotnoise can be reduced by increasing the integration
time while the noise due to positional errors can be reduced by averaging repeated
measurements in which the source and detector are physically repositioned If the
positional errors are due to movement of the sample then the noise is also reduced
by increasing the integration time
The ultimate clinical applications of these probes may depend on our capabilities
for object characterization For example to specify tumor size and malignancy or
brain bleed maturity it is likely that the size and optical properties of the detectable
optical inhomogeneity will need to be characterized In section limits to object
characterization are studied by rst calculating the perturbed DPDW and then es
timating the uncertainty with which the objects size and optical properties can be
determined by means of a chisquared tting procedure to the analytic solution The
perturbed DPDW is rst calculated using the analytic solution and then appropriate
noise is added Measurements are made with the source xed at a position closest
to the object at x and z and the detector scanned from x to cm in
steps of cm at z cm A total of independent measurements are obtained
amplitude and phase measurements In all studies the DPDW modulation
frequency is MHz The noise added in these measurements is that given by the
shotnoise for a mW source and the noise from random positional uncertainties
of m as described in section Thus the noise used in the simulations is
approximately in the amplitude and phase
The tting procedure is based on minimizing the chisquare dierence between the
measured DPDW prole and the analytic solution by varying the objects diameter
and optical properties This procedure is a best case scenario since we assume the
background optical properties as well as the position and shape of the object In
practice more general imaging methods must be used that do not assume that the
shape of the object is known My results therefore represent the best one can possibly
do in terms of characterization for a specic set of measurements For a given noise
level the uncertainty in the estimated properties is found using the chisquared method

Chapter Practical Limits to the Detection Localization and Characterization
described by Bevington In essence the uncertainty of a t parameter is found by
varying the parameter until the chisquare value increases by one from the value at the
global minimum Theoretically the uncertainty determined in this way is equivalent
to the uncertainty that would be found from multiple experiments
The chisquare dierence function to be minimized is
s a a NXi
ji
exprsi rd
ij jianalrs
i rdi sin ain aj
iAC
Argi
exprsi rd
iArgianalrs
i rdi sin ain a
i
Here the sum is over all measurements rsi and rd
i are the position of the source
and detector for the ith measurement iexprs
i rdi is the experimental photon !uence
for this pair and ianalrs
i rdi sin ain a is the !uence obtained from the analytic
solution eq using the optical characteristics of the object ie sin ain
and a Recall that iexprs
i rdi is obtained by adding random noise to the analytic
solution eq The vertical bars jj indicate the absolute value of the complex
number and Arg represents the phase of the complex number
The initial amplitude and phase of the source are known Uncertainty in the
amplitude and phase of the source introduces systematic errors further complicating
the characterization procedure If such uncertainty is present then the initial phase
and amplitude of the source can also be used as free parameters in the t at the
expense of increasing the uncertainty in the other tting parameters
Detection and Localization
Breast tumors and brain bleeds are optical inhomogeneities in the sense that their
optical scattering and absorption properties are dierent than that of the surrounding
media An understanding of the detection limits of these inhomogeneities is important
for designing optical screening techniques An optical inhomogeneity is said to be
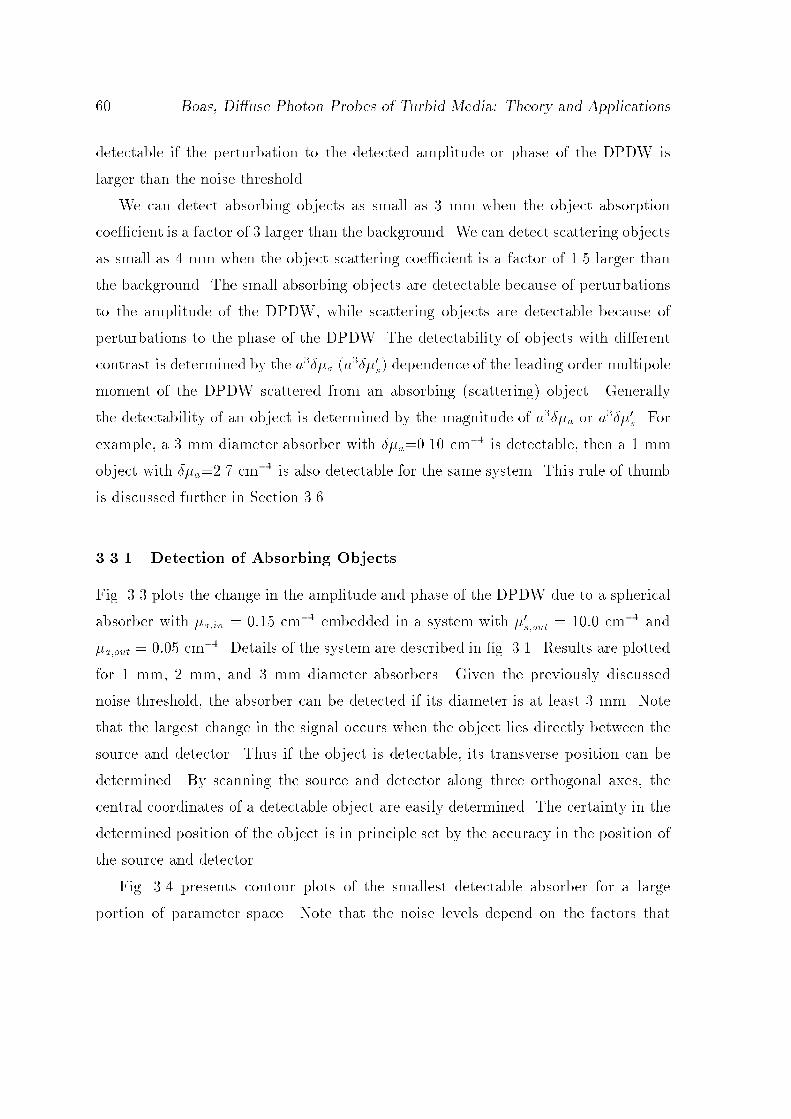
Boas Diuse Photon Probes of Turbid Media Theory and Applications
detectable if the perturbation to the detected amplitude or phase of the DPDW is
larger than the noise threshold
We can detect absorbing objects as small as mm when the object absorption
coecient is a factor of larger than the background We can detect scattering objects
as small as mm when the object scattering coecient is a factor of larger than
the background The small absorbing objects are detectable because of perturbations
to the amplitude of the DPDW while scattering objects are detectable because of
perturbations to the phase of the DPDW The detectability of objects with dierent
contrast is determined by the aa as dependence of the leading order multipole
moment of the DPDW scattered from an absorbing scattering object Generally
the detectability of an object is determined by the magnitude of aa or as For
example a mm diameter absorber with a cm is detectable then a mm
object with a cm is also detectable for the same system This rule of thumb
is discussed further in Section
Detection of Absorbing Objects
Fig plots the change in the amplitude and phase of the DPDW due to a spherical
absorber with ain cm embedded in a system with sout cm and
aout cm Details of the system are described in g Results are plotted
for mm mm and mm diameter absorbers Given the previously discussed
noise threshold the absorber can be detected if its diameter is at least mm Note
that the largest change in the signal occurs when the object lies directly between the
source and detector Thus if the object is detectable its transverse position can be
determined By scanning the source and detector along three orthogonal axes the
central coordinates of a detectable object are easily determined The certainty in the
determined position of the object is in principle set by the accuracy in the position of
the source and detector
Fig presents contour plots of the smallest detectable absorber for a large
portion of parameter space Note that the noise levels depend on the factors that

Chapter Practical Limits to the Detection Localization and Characterization
Detection of Absorbing Objects
Figure The fractional change in the amplitude and change in degrees of the phasedue to the presence of the absorbing object is given in a and b respectively as afunction of the lateral position of the sourcedetector The system is described in thecaption of g Results are given for mm dashed line mm dotted lineand mm solid line diameter absorbers The noise threshold is given by the solidhorizontal line in a and b Note that the signal does not exceed the noise thresholdunless the objects diameter is greater than or equal to mm and then it is onlythe change in the amplitude and not the phase that is detectable

Boas Diuse Photon Probes of Turbid Media Theory and Applications
are being varied in these graphs and are therefore not xed at the levels used in
g For example with a MHz modulation frequency with s cm and
a cm the fractional error in the amplitude is and the phase error is
With a MHz modulation frequency with s cm and a cm the
fractional error in the amplitude is and the phase error is Recall that with a
MHz modulation frequency with s cm and a cm the fractional
error in the amplitude is and the phase error is so that in g the noise
levels are varying by at least a factor of The noise levels are still determined using
a second integration time
In g a the contours indicating the diameter of the smallest detectable absorber
are drawn as a function of the background reduced scattering coecient and the
object absorption coecient The background absorption coecient was kept xed
and the object reduced scattering coecient was kept equal to the background reduced
scattering coecient Clearly as the object absorption coecient increases smaller
objects become detectable The background reduced scattering coecient has little
eect on absorber detectability indicating that the increasing noise resulting from
a larger sout is balanced by an increasing signal The noise increases because of
reduced photon transmission through the slab with increased s In g b contours
are drawn as functions of the background and object absorption coecients while
keeping the scattering coecients constant The detectability of absorbers diminishes
as the background absorption coecient rises because of an increase in shotnoise
due to increased photon absorption and the decrease in the absorption contrast of
the object In g c contours are given as a function of source modulation frequency
and object absorption coecient Surprisingly increasing the modulation frequency
actually decreases the detectability of absorbers This trend is observed because the
noise increases more rapidly than the signal as discussed further in section and
g

Chapter Practical Limits to the Detection Localization and Characterization
20
15
10
50.2 0.4 0.6
ua (inside)
us'
(ou
tsid
e)
(a)
0.24
0.20
0.16
0
0.12
0.14
0.10
0.08
0.06
0.04
0.02
ua
(o
uts
ide)
0.2 0.4 0.6
ua (inside)
(b)
0.20
0.16
0
800
1000
600
400
200
00.2 0.4 0.6
ua (inside)
mo
du
lati
on
fre
qu
ency
(c)
0.32
0.28
0.24
0.20
0.16
00.
40
0.36
0.36
0.32
0.56
0.24
0.28
Smallest Detectable Absorbing Object
Figure The diameter of the smallest detectable absorber is plotted as a functionof a sout and ain b aout and ain and c source modulation frequency andain The contours indicate the diameter of the smallest detectable absorber in unitsof centimeters The system and measurements are described in g In a f MHz aout cm and sin sout In b f MHz and sout sin cm In c sout sin cm and aout cm Thenoise levels are based on a positional uncertainty of m and a second integrationtime The dashed line in b indicates where aout ain
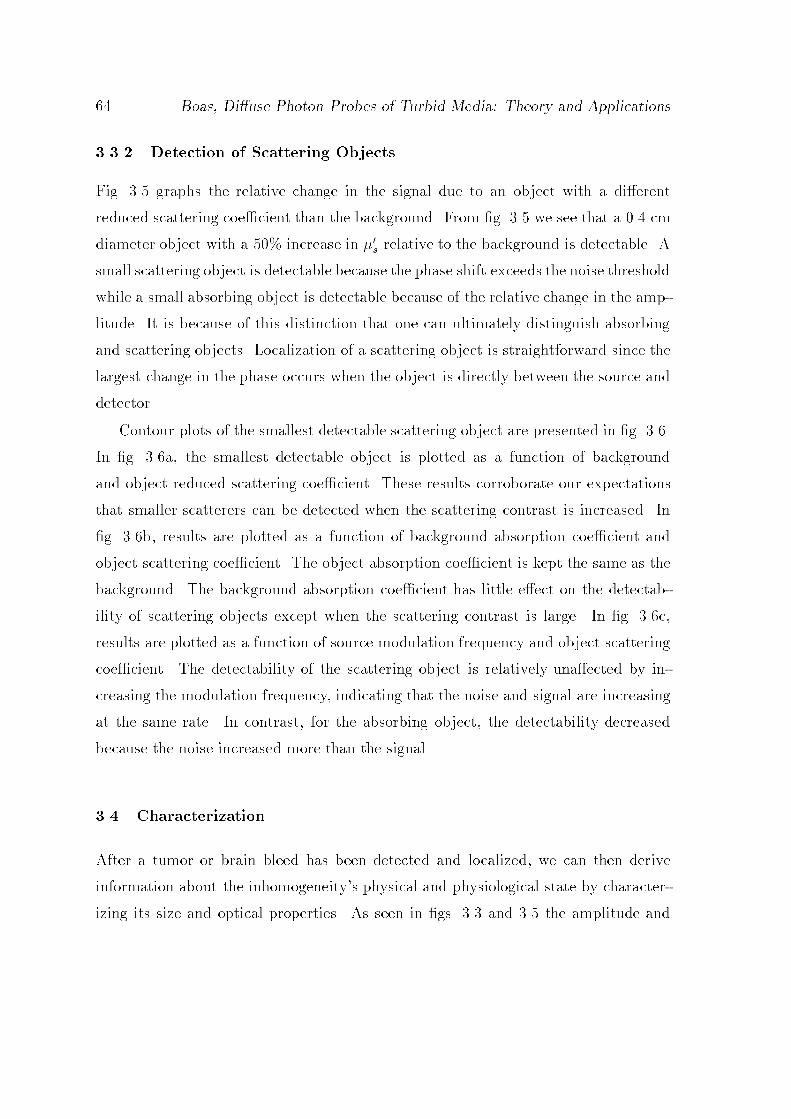
Boas Diuse Photon Probes of Turbid Media Theory and Applications
Detection of Scattering Objects
Fig graphs the relative change in the signal due to an object with a dierent
reduced scattering coecient than the background From g we see that a cm
diameter object with a increase in s relative to the background is detectable A
small scattering object is detectable because the phase shift exceeds the noise threshold
while a small absorbing object is detectable because of the relative change in the amp
litude It is because of this distinction that one can ultimately distinguish absorbing
and scattering objects Localization of a scattering object is straightforward since the
largest change in the phase occurs when the object is directly between the source and
detector
Contour plots of the smallest detectable scattering object are presented in g
In g a the smallest detectable object is plotted as a function of background
and object reduced scattering coecient These results corroborate our expectations
that smaller scatterers can be detected when the scattering contrast is increased In
g b results are plotted as a function of background absorption coecient and
object scattering coecient The object absorption coecient is kept the same as the
background The background absorption coecient has little eect on the detectab
ility of scattering objects except when the scattering contrast is large In g c
results are plotted as a function of source modulation frequency and object scattering
coecient The detectability of the scattering object is relatively unaected by in
creasing the modulation frequency indicating that the noise and signal are increasing
at the same rate In contrast for the absorbing object the detectability decreased
because the noise increased more than the signal
Characterization
After a tumor or brain bleed has been detected and localized we can then derive
information about the inhomogeneitys physical and physiological state by character
izing its size and optical properties As seen in gs and the amplitude and

Chapter Practical Limits to the Detection Localization and Characterization
Detection of Scattering Objects
Figure The fractional change in the amplitude and change in degrees of the phasedue to the scattering object is given in a and b respectively as a function of thelateral position of the sourcedetector The solid line corresponds to a cm diameterobject while the dotted and dashed lines correspond to a cm and cm diameterobject respectively System parameters are described in the caption of g Thenoise threshold is given by the solid horizontal line and is for the amplitudechange and degrees phase
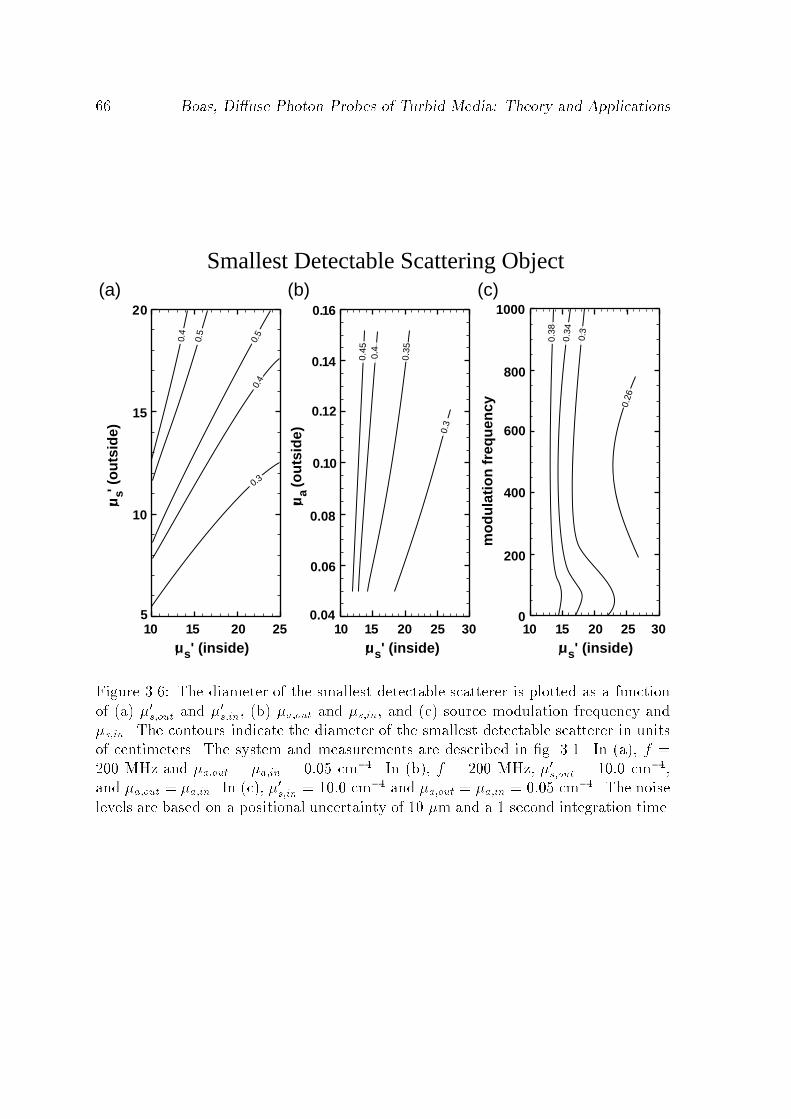
Boas Diuse Photon Probes of Turbid Media Theory and Applications
20
15
10
510 15 20 25
us' (inside)10 15 20 25 30
0.16
0.14
0.12
0.10
0.08
0.06
0.04
us' (inside)10 15 20 25 30
1000
800
600
400
200
0
us' (inside)
mo
du
lati
on
fre
qu
ency
us'
(o
uts
ide)
ua
(ou
tsid
e)
0.5
0.4
0.3
0.45
0.4
0.35
0.3
0.4
0.5
0.38
0.34
0.3
0.26
(a) (b) (c)
Smallest Detectable Scattering Object
Figure The diameter of the smallest detectable scatterer is plotted as a functionof a sout and sin b aout and sin and c source modulation frequency andsin The contours indicate the diameter of the smallest detectable scatterer in unitsof centimeters The system and measurements are described in g In a f MHz and aout ain cm In b f MHz sout cmand aout ain In c sin cm and aout ain cm The noiselevels are based on a positional uncertainty of m and a second integration time
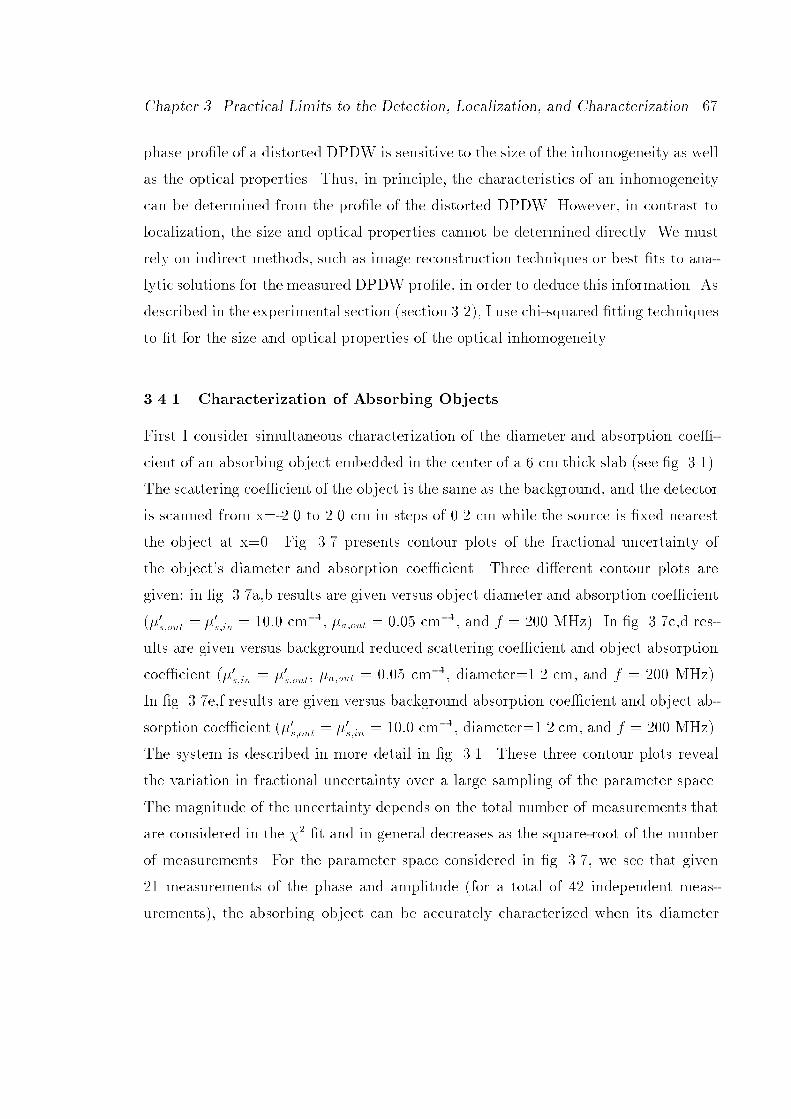
Chapter Practical Limits to the Detection Localization and Characterization
phase prole of a distorted DPDW is sensitive to the size of the inhomogeneity as well
as the optical properties Thus in principle the characteristics of an inhomogeneity
can be determined from the prole of the distorted DPDW However in contrast to
localization the size and optical properties cannot be determined directly We must
rely on indirect methods such as image reconstruction techniques or best ts to ana
lytic solutions for the measured DPDW prole in order to deduce this information As
described in the experimental section section I use chisquared tting techniques
to t for the size and optical properties of the optical inhomogeneity
Characterization of Absorbing Objects
First I consider simultaneous characterization of the diameter and absorption coe
cient of an absorbing object embedded in the center of a cm thick slab see g
The scattering coecient of the object is the same as the background and the detector
is scanned from x to cm in steps of cm while the source is xed nearest
the object at x Fig presents contour plots of the fractional uncertainty of
the objects diameter and absorption coecient Three dierent contour plots are
given in g ab results are given versus object diameter and absorption coecient
sout sin cm aout cm and f MHz In g cd res
ults are given versus background reduced scattering coecient and object absorption
coecient sin sout aout cm diameter cm and f MHz
In g ef results are given versus background absorption coecient and object ab
sorption coecient sout sin cm diameter cm and f MHz
The system is described in more detail in g These three contour plots reveal
the variation in fractional uncertainty over a large sampling of the parameter space
The magnitude of the uncertainty depends on the total number of measurements that
are considered in the t and in general decreases as the squareroot of the number
of measurements For the parameter space considered in g we see that given
measurements of the phase and amplitude for a total of independent meas
urements the absorbing object can be accurately characterized when its diameter

Boas Diuse Photon Probes of Turbid Media Theory and Applications
exceeds cm Here a uncertainty is considered to be accurate
The contour plots versus the objects diameter and absorption coecient g
ab show that the uncertainties diminish rapidly as the diameter increases and slowly
as the absorption coecient is increased The slower decrease in the uncertainties
for larger absorption coecients results from saturation of the signal In general the
error bar for the diameter is symmetric about the mean value while the error bar for
the absorption coecient of the object is asymmetric The asymmetry results from
the saturation of the signal for larger absorption coecients Thus the upper error
is always larger than the lower error The dierence is usually within In all
contour plots I plot the average of the lower and upper fractional uncertainties
From the contour plots versus the background reduced scattering coecient and
the object absorption coecient g cd we see a similar dependence on the ab
sorption coecient of the object and that the uncertainties initially decrease and then
increase as sout increases The explanation for this is that as sout increases the
DPDW wavelength decreases and as the ratio between the DPDW wavelength and the
object diameter gets smaller the fractional perturbation to the signal increases There
fore we would expect the uncertainties in the tting parameters to decrease However
the noise from positional errors is also increasing because the DPDW wavelength is
decreasing In addition the shotnoise is increasing because of the reduced transmis
sion through the slab as s is increased For the conditons in g cd the interplay
between the increasing signal and increasing noise is such that the uncertainties rst
decrease and then increase
From the contour plots versus the background absorption coecient and the object
absorption coecient g ef we see that the uncertainties increase as the back
ground absorption coecient is increased and they decrease as the object absorption
coecient is increased There are two factors contributing to the dependence on the
background absorption coecient rst more light absorption leads to an increase in
shot noise and second the decrease in the absorption contrast of the object results
in a smaller perturbation to the DPDW

Chapter Practical Limits to the Detection Localization and Characterization
1.6
1.4
1.2
1.0
0.8
0.4
0.1 0.2 0.3 0.4 0.5 0.6 0.7 0.1 0.2 0.3 0.4 0.5 0.6 0.7
ua (inside)
0.05
0.04
0.03
0.01
0.02
0.05
0.2
0.10.5
0.05
0.04
0.03
0.02
0.1
0.2
Absorption(b)
(d)
( f)
20
15
10
5
0.14
0.10
0.06
0.02
ua
(ou
tsid
e)u
s' (
ou
tsid
e)
ua (inside)
0.002
0.005
0.01
0.020.1
0.2
0.008
0.02
0.01
0.2
0.1
0.05 0.02
0.01
0.005
Diameterd
iam
eter
(a)
(c)
(e)
Fractional Error in
0
0.5
0.03
0.05
0.05
0.07
0.06
0.05
0
Figure The fractional uncertainty in the object diameter ace and object absorption coecient bdf are plotted in contour plots for a large range of parameterspace The labels on the contours indicate the fractional uncertainty In a andb uncertainties are plotted versus the diameter and absorption coecient of theobject In c and d the background scattering coecient and object absorptioncoecient are varied In e and f the background absorption coecient and object absorption coecient are varied The dashed lines in e and f indicate whereaoutsideainside

Boas Diuse Photon Probes of Turbid Media Theory and Applications
Although a cm diameter absorber can be detected and localized the absorber
cannot be characterized accurately unless its diameter is greater than cm This
result was obtained using measurements of amplitude and phase As discussed in
section this dierence between object detection and characterization arises from
the functional form of the dierent moments of the scattered DPDW Fig plots
the contribution of the monopole dipole and quadrupole moments of the scattered
DPDW to the total signal versus the diameter of the absorbing object That is I plot
the amplitude and phase of
lsc
inc
Note that this quantity accounts for the perturbation of each moment to the incident
DPDW If this perturbation is greater than the noise threshold the given moment of
the scattered wave is detectable The noise threshold is also indicated in the gure
In order to detect the object it is only necessary for the monopole term to exceed
the noise threshold This occurs when the objects diameter is cm which agrees
with the previous observation in g The dipole moment does not exceed the
noise threshold until the diameter is cm For absorber diameters cm
the monopole and dipole moments of the scattered wave are detectable and thus in
principle the absorber is characterizable The results in g indicate that the ab
sorber can be accurately characterized when the diameter exceeds cm Recall that
the uncertainty in the object parameters decrease with the square root of the number
of measurements and thus accurate characterization of smaller objects is possible by
increasing the number of measurements This may give an experimenter an improve
ment of cm if for example measurements are made of the scattered DPDW
over the same spatial region as the measurements This cm improvement is
estimated from g if the number of measurements is increased by a factor of
ten then the uncertainty will decrease by approximately a factor of three Thus from
g we see that the monopole and dipole contributions exceed the noise threshold
when the diameter of the absorber exceeds cm
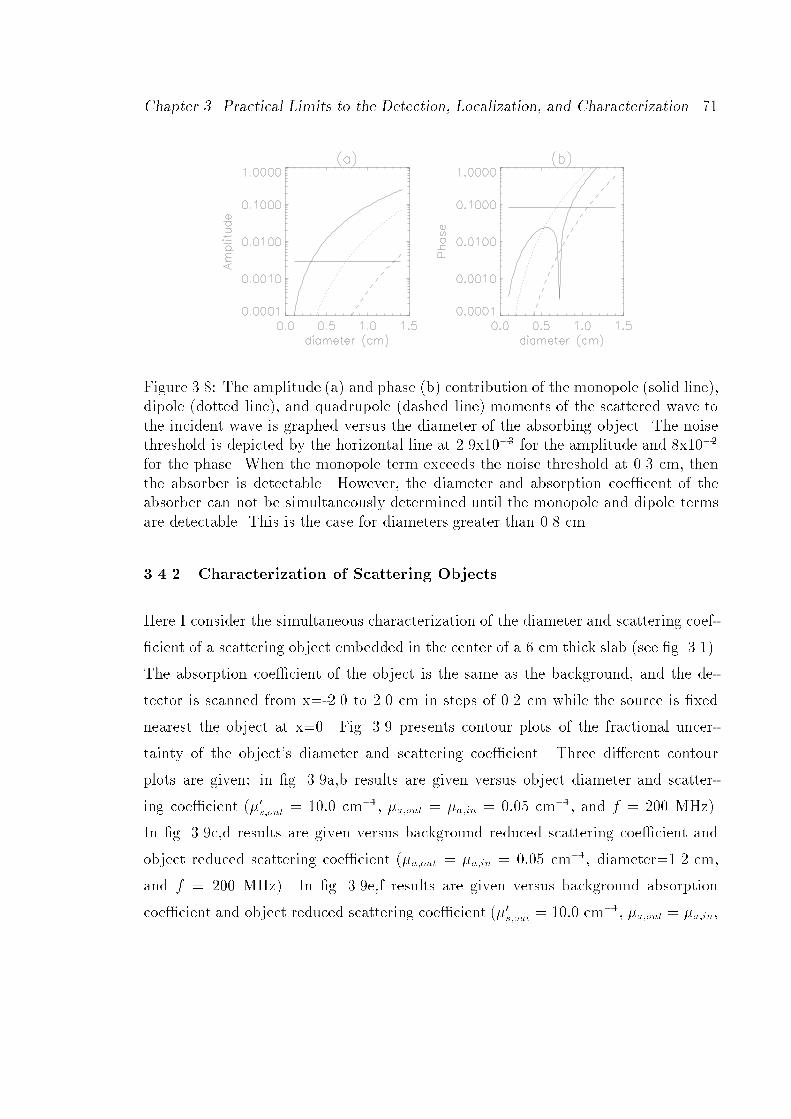
Chapter Practical Limits to the Detection Localization and Characterization
Figure The amplitude a and phase b contribution of the monopole solid linedipole dotted line and quadrupole dashed line moments of the scattered wave tothe incident wave is graphed versus the diameter of the absorbing object The noisethreshold is depicted by the horizontal line at x for the amplitude and x
for the phase When the monopole term exceeds the noise threshold at cm thenthe absorber is detectable However the diameter and absorption coecent of theabsorber can not be simultaneously determined until the monopole and dipole termsare detectable This is the case for diameters greater than cm
Characterization of Scattering Objects
Here I consider the simultaneous characterization of the diameter and scattering coef
cient of a scattering object embedded in the center of a cm thick slab see g
The absorption coecient of the object is the same as the background and the de
tector is scanned from x to cm in steps of cm while the source is xed
nearest the object at x Fig presents contour plots of the fractional uncer
tainty of the objects diameter and scattering coecient Three dierent contour
plots are given in g ab results are given versus object diameter and scatter
ing coecient sout cm aout ain cm and f MHz
In g cd results are given versus background reduced scattering coecient and
object reduced scattering coecient aout ain cm diameter cm
and f MHz In g ef results are given versus background absorption
coecient and object reduced scattering coecient sout cm aout ain
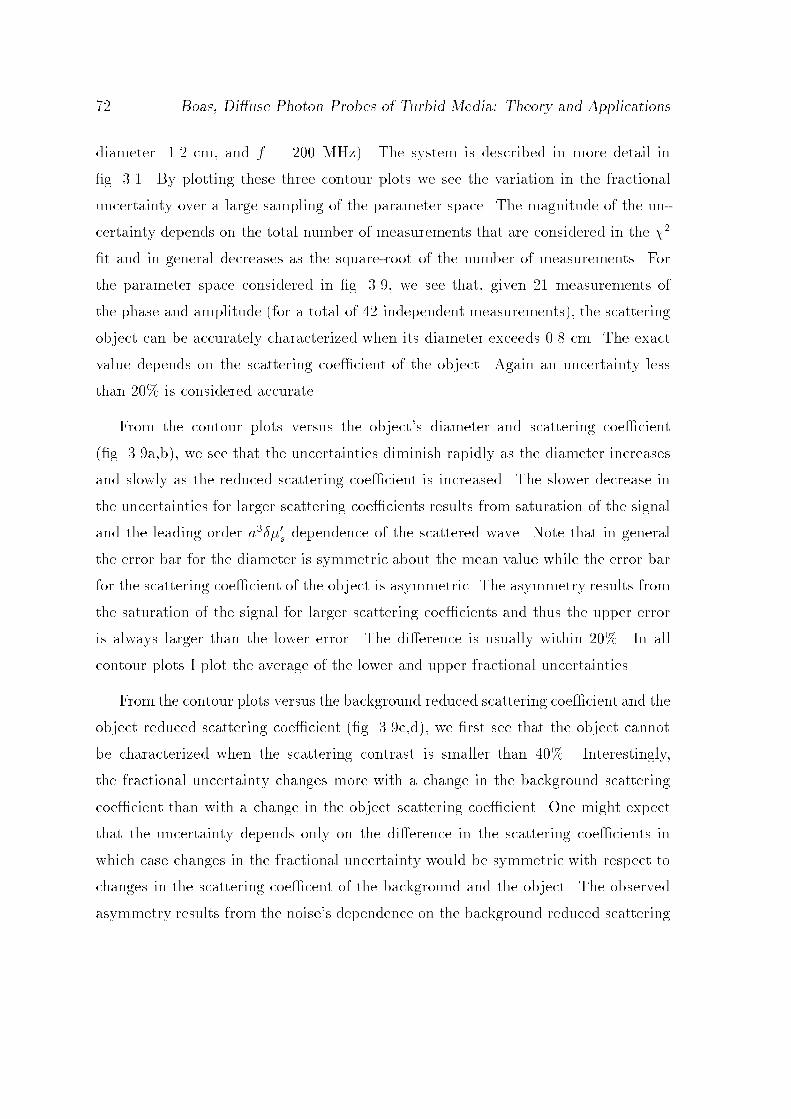
Boas Diuse Photon Probes of Turbid Media Theory and Applications
diameter cm and f MHz The system is described in more detail in
g By plotting these three contour plots we see the variation in the fractional
uncertainty over a large sampling of the parameter space The magnitude of the un
certainty depends on the total number of measurements that are considered in the
t and in general decreases as the squareroot of the number of measurements For
the parameter space considered in g we see that given measurements of
the phase and amplitude for a total of independent measurements the scattering
object can be accurately characterized when its diameter exceeds cm The exact
value depends on the scattering coecient of the object Again an uncertainty less
than is considered accurate
From the contour plots versus the objects diameter and scattering coecient
g ab we see that the uncertainties diminish rapidly as the diameter increases
and slowly as the reduced scattering coecient is increased The slower decrease in
the uncertainties for larger scattering coecients results from saturation of the signal
and the leading order as dependence of the scattered wave Note that in general
the error bar for the diameter is symmetric about the mean value while the error bar
for the scattering coecient of the object is asymmetric The asymmetry results from
the saturation of the signal for larger scattering coecients and thus the upper error
is always larger than the lower error The dierence is usually within In all
contour plots I plot the average of the lower and upper fractional uncertainties
From the contour plots versus the background reduced scattering coecient and the
object reduced scattering coecient g cd we rst see that the object cannot
be characterized when the scattering contrast is smaller than Interestingly
the fractional uncertainty changes more with a change in the background scattering
coecient than with a change in the object scattering coecient One might expect
that the uncertainty depends only on the dierence in the scattering coecients in
which case changes in the fractional uncertainty would be symmetric with respect to
changes in the scattering coecent of the background and the object The observed
asymmetry results from the noises dependence on the background reduced scattering

Chapter Practical Limits to the Detection Localization and Characterization
1.6
1.4
1.2
1.0
0.8
0.6
dia
met
er
20
15
10
5
us'
(ou
tsid
e)
0.14
0.12
0.10
0.08
0.06
0.04
0.0210 15 20 25 30
ua
(ou
tsid
e)
us' (inside)10 15 20 25 30
us' (inside)
0.01
0.2
0.1
0.05
0.02
0.05
0.1
0.2
0.5
0.07
0.10
0.13
0.05
0.20
0.07
0.10
0.200.20
0.07
0.10
0.13
0.07
0.05
0.100.13
0.20
0.02
0.05
0.02
0.15
0.2
0.12
0.10
0.08
0.06
(a)
(c)
(e)
(b)
(d)
(f)
Fractional Error in
Diameter Scattering
0.02
0.30.50.8
0.1
0.2
Figure The fractional uncertainty in the object diameter ace and object scattering coecient bdf are plotted in contour plots The labels on the contoursindicate the fractional uncertainty In a and b uncertainties are plotted versusthe diameter and scattering coecient of the object In c and d the backgroundscattering coecient and object scattering coecient are varied In e and f thebackground absorption coecient and object scattering coecient are varied Thedashed line in c and d indicates where soutside
sinside
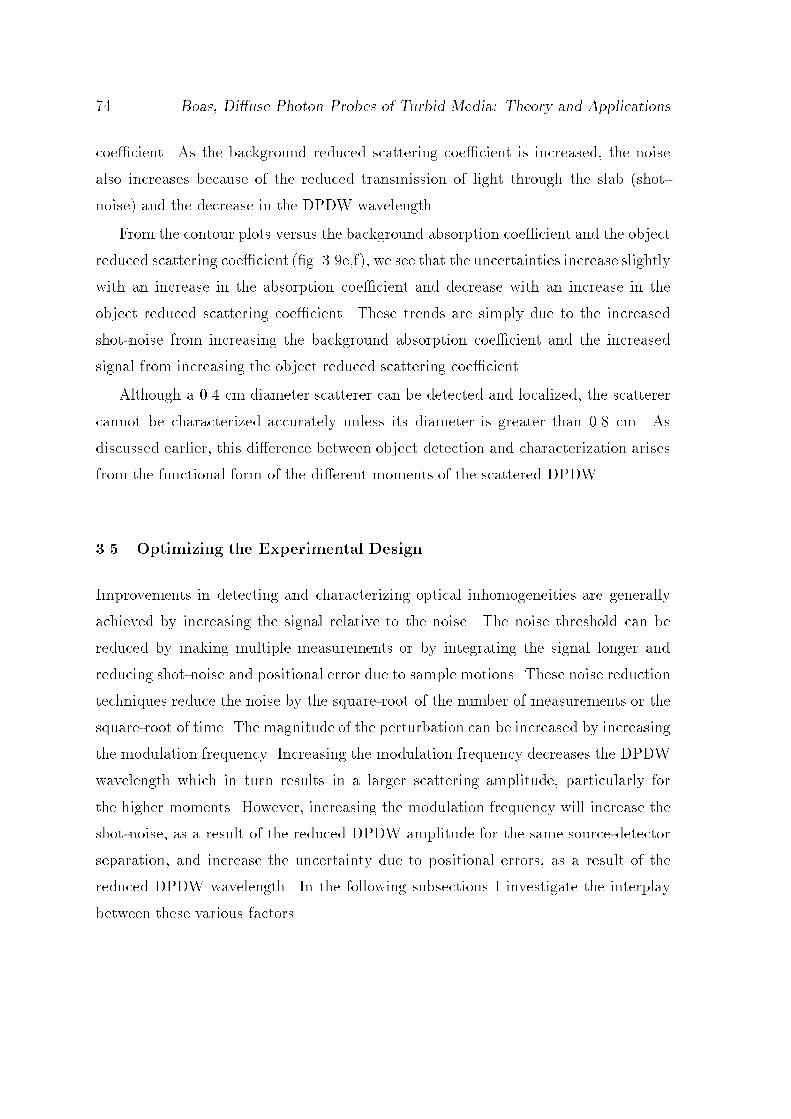
Boas Diuse Photon Probes of Turbid Media Theory and Applications
coecient As the background reduced scattering coecient is increased the noise
also increases because of the reduced transmission of light through the slab shot
noise and the decrease in the DPDW wavelength
From the contour plots versus the background absorption coecient and the object
reduced scattering coecient g ef we see that the uncertainties increase slightly
with an increase in the absorption coecient and decrease with an increase in the
object reduced scattering coecient These trends are simply due to the increased
shotnoise from increasing the background absorption coecient and the increased
signal from increasing the object reduced scattering coecient
Although a cm diameter scatterer can be detected and localized the scatterer
cannot be characterized accurately unless its diameter is greater than cm As
discussed earlier this dierence between object detection and characterization arises
from the functional form of the dierent moments of the scattered DPDW
Optimizing the Experimental Design
Improvements in detecting and characterizing optical inhomogeneities are generally
achieved by increasing the signal relative to the noise The noise threshold can be
reduced by making multiple measurements or by integrating the signal longer and
reducing shotnoise and positional error due to sample motions These noise reduction
techniques reduce the noise by the squareroot of the number of measurements or the
squareroot of time The magnitude of the perturbation can be increased by increasing
the modulation frequency Increasing the modulation frequency decreases the DPDW
wavelength which in turn results in a larger scattering amplitude particularly for
the higher moments However increasing the modulation frequency will increase the
shotnoise as a result of the reduced DPDW amplitude for the same sourcedetector
separation and increase the uncertainty due to positional errors as a result of the
reduced DPDW wavelength In the following subsections I investigate the interplay
between these various factors

Chapter Practical Limits to the Detection Localization and Characterization
Optimizing Measurement Geometry
To determine what role the position of the source and detector play in characterizing
an object I repeated the characterization simulation for two dierent measurement
geometries First the eect of xing the source closest to the object at x and
scanning the detector from x to cm in steps of cm was examined The
fractional uncertainty in the diameter and absorption coecient for this set of meas
urements is graphed in g along with the previous result obtained from scanning
the detector from x to cm in steps of cm These results indicate that
the characterization accuracy is decreased when the range over which the detector is
scanned is increased while keeping the number of measurements constant The second
measurement geometry was chosen to examine the eect of scanning the source and
detector together from x to cm For comparison these results are also plotted
in g The characterization accuracy is decreased further when the source and
detector are scanned together From g we see that the measurement geometry
is optimized for object characterization by keeping the source and detector near the
absorbing object This result applies to scattering objects as well
These observations are easily understood within the context of the moments ana
lysis Fig graphs the contribution of each moment to the total signal eq
versus the transverse position of the detector Results are plotted for two cases the
source is scanned with the detector and the source is xed at x The moments
are calculated for a cm diameter absorber From g we see that overall the
moments make a larger contribution to the scattered wave when the source is xed
near the object In particular the perturbation is larger for transverse displacements
of the detector from x and therefore it is detectable for a greater number of measure
ments By concentrating the measurements where the perturbation is strongest we are
increasing the average signaltonoise ratio resulting in a more accurate determination
of an objects characteristics
This result suggests that the most accurate characterization will arise from all
measurements coming from the source and detector xed nearest the object This
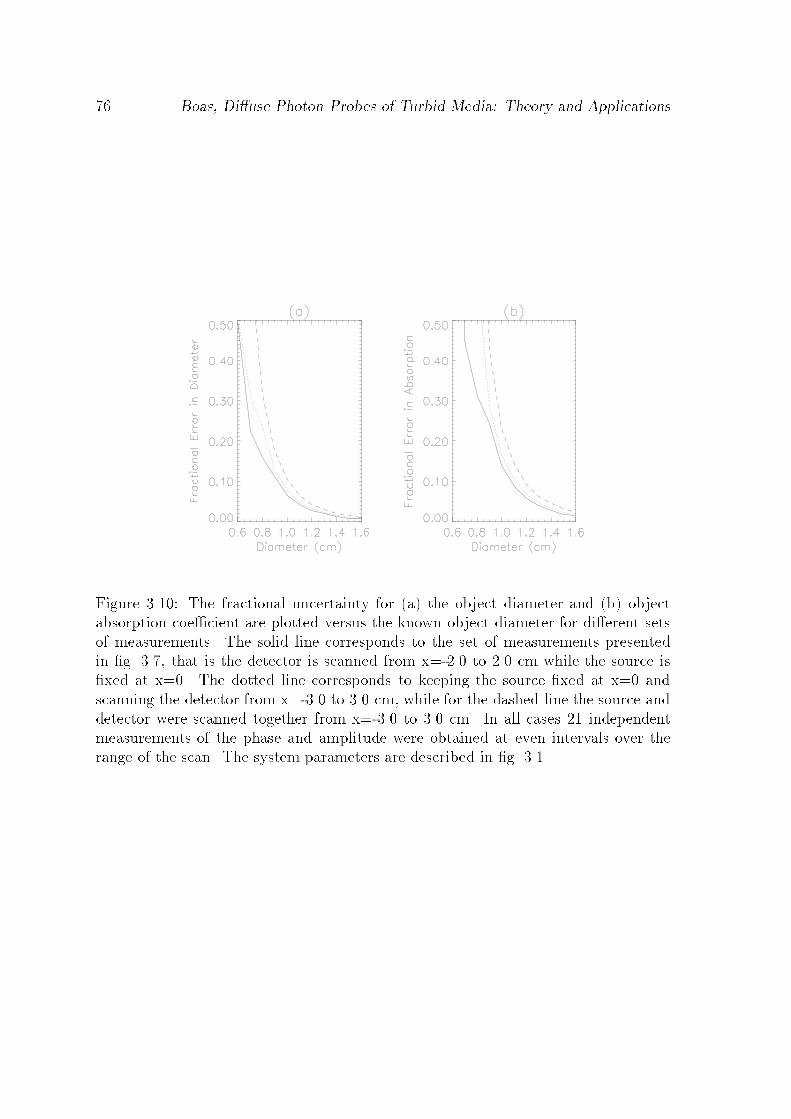
Boas Diuse Photon Probes of Turbid Media Theory and Applications
Figure The fractional uncertainty for a the object diameter and b objectabsorption coecient are plotted versus the known object diameter for dierent setsof measurements The solid line corresponds to the set of measurements presentedin g that is the detector is scanned from x to cm while the source isxed at x The dotted line corresponds to keeping the source xed at x andscanning the detector from x to cm while for the dashed line the source anddetector were scanned together from x to cm In all cases independentmeasurements of the phase and amplitude were obtained at even intervals over therange of the scan The system parameters are described in g
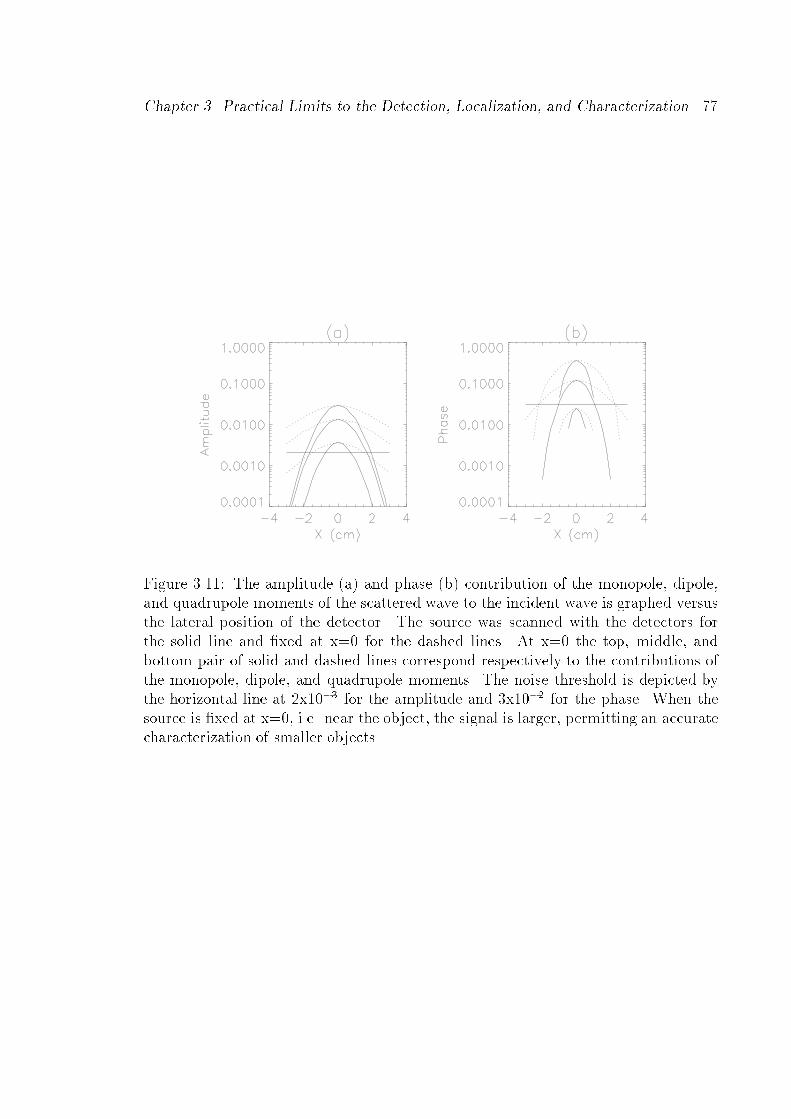
Chapter Practical Limits to the Detection Localization and Characterization
Figure The amplitude a and phase b contribution of the monopole dipoleand quadrupole moments of the scattered wave to the incident wave is graphed versusthe lateral position of the detector The source was scanned with the detectors forthe solid line and xed at x for the dashed lines At x the top middle andbottom pair of solid and dashed lines correspond respectively to the contributions ofthe monopole dipole and quadrupole moments The noise threshold is depicted bythe horizontal line at x for the amplitude and x for the phase When thesource is xed at x ie near the object the signal is larger permitting an accuratecharacterization of smaller objects

Boas Diuse Photon Probes of Turbid Media Theory and Applications
is indeed the case when there are only two unknowns eg diameter and absorption
coecient That is the amplitude and phase from one sourcedetector pair provides
sucient information to determine two unknowns However if there are more than two
unknowns eg initial amplitude and phase of the source object shape andor object
position in addition to the diameter and absorption coecient of the object then
the additional information provided from a spatially distributed set of sourcedetector
pairs is required
Usually the initial amplitude and phase of the source and the shape of the object
will not be known accurately and therefore measurements from a spatially distributed
set of sourcedetector pairs is optimal The signal to noise comparison in g
indicates which measurements provide information about the optical inhomogeneity
and therefore provides an approach for designing an optimal measurement geometry
Optimal Modulation Frequency
Comparing signaltonoise ratios for dierent DPDW modulation frequencies we can
determine the optimal frequency for detecting and characterizing dierent objects
Fig ab plots the change in the signal due to each moment relative to the incident
wave eq as a function of modulation frequency for an absorbing object Al
though the magnitude of each moment is increasing with frequency each moments
perturbation of the signal is not necessarily increasing because of interference between
the moment and the incident wave In fact as is seen in g ab at MHz the
quadrupole moment eects no phase shift and at MHz the quadrupole moment
eects no amplitude change These nulls in general do not decrease the ability to char
acterize an object because a null in either the amplitude or phase is compensated by a
large signal in the phase or amplitude respectively On the other hand the frequency
at which these nulls occur depends on the characteristics of the object and therefore
they may be exploited to improve object characterization A similar idea has been
suggested by Yao et al
The shotnoise and positional error as a function of modulation frequency are plot

Chapter Practical Limits to the Detection Localization and Characterization
ted in g c and d They exhibit an increase with modulation frequency as expec
ted For the model system the shotnoise exceeds the positional noise at frequencies
larger than MHz The crossover point for the amplitude noise occurs because the
amplitude of the DPDW is decreasing exponentially as approximately the squareroot
of the modulation frequency Thus the fractional error due to shotnoise is increasing
exponentially On the other hand the fractional error due to positional uncertainty
is increasing approximately with the squareroot of the modulation frequency Be
cause of the rapid increase in noise with modulation frequency measurements at high
modulation frequencies are undesirable Likewise measurements at low modulation
frequencies are undesirable because of the small perturbations
To determine the optimal frequency for detection and characterization I calculate
the signaltonoise ratio for the monopole dipole and quadrupole moments These
results are plotted in g e and f The best signal to noise is obtained around
MHz Although the signaltonoise ratio is smaller at higher modulation frequencies
it is possible to accurately characterize a cm diameter absorber at GHz because
the monopole and dipole perturbations still exceeds the noise threshold
Similar results were also obtained for the scattering objects see g The
main dierence is that the best signaltonoise ratio for scattering objects is obtained
around MHz
Modulation frequencies between and MHz are appropriate when considering
the characterization of single objects embedded in otherwise homogeneous systems
If multiple objects are present and resolution becomes an issue then measurements
at higher modulation frequencies are desirable By resolution I mean the ability to
distinguish signals that originate from dierent sources eg the waves scattered
from two distinct objects Resolution improves with higher modulation frequencies
because the DPDW wavelength decreases and we gain sensitivity to smaller length
scales The analytic techniques presented here permit us to determine the maximum
modulation frequencies that provide useful information but they do not provide a
simple framework for analyzing the resolving power of DPDWs The reader is referred
Boas Diuse Photon Probes of Turbid Media Theory and Applications
to Pattanayak for a discussion on the resolving power of DPDWs
Utilizing Spectral Information
It has been suggested that measurements of the amplitude and phase of diuse photon
density waves at several modulation frequencies may be used to enhance sensitivity
to the optical properties of a turbid medium I have investigated this possibility
by comparing fractional uncertainties obtained with three dierent sourcedetector
congurations The three congurations are modulation frequency held constant at
MHz modulation frequency scanned from to MHz in steps of MHz
and modulation frequency scanned from to MHz in steps of MHz
In each of the three cases the source was held xed closest to the object and the
detector was scanned from x to cm in steps of cm Also for each case the
total number of independent measurements was kept constant at measurements of
amplitude and phase ie at each position measurements were made of amplitude
and phase In this way any observed improvement in the characterization of the
object can be attributed to spectral measurements rather than an overall increase in
the number of measurements In case this required making measurements at
MHz at each spatial position while in case measurements where made at
each frequency and each spatial position
Fig ab plots the fractional uncertainty in the diameter and absorption coe
cient of an absorbing object versus the diameter of the object for the three dierent
sourcedetector congurations No improvement is observed in the fractional uncer
tainty of the diameter or the absorption coecient On the other hand for a scattering
object a decrease in the fractional uncertainty of s is observed when measurements
are made over a range of modulation frequencies see g cd Spectral measure
ments thus enhance the characterization of scattering objects as well as providing a
means of distinguishing scattering from absorbing objects

Chapter Practical Limits to the Detection Localization and Characterization
Absorbing Object
Figure The contribution of the monopole solid line dipole dotted line andquadrupole dashed line moments of the scattered wave to the amplitude a andphase b of the total wave is plotted versus the modulation frequency of the sourceThe source and detector are separated by cm with a cm diameter absorbing object centered between them The optical properties of the object are given ing The noise in the amplitude and phase is given in c and d respectively Thedotted dashed line corresponds to the positional shot noise The solid line is thecombination of positional and shot noise The signal to noise ratio for amplitude andphase is given respectively in e and f for the monopole solid line dipole dottedline and quadrupole dashed line moments
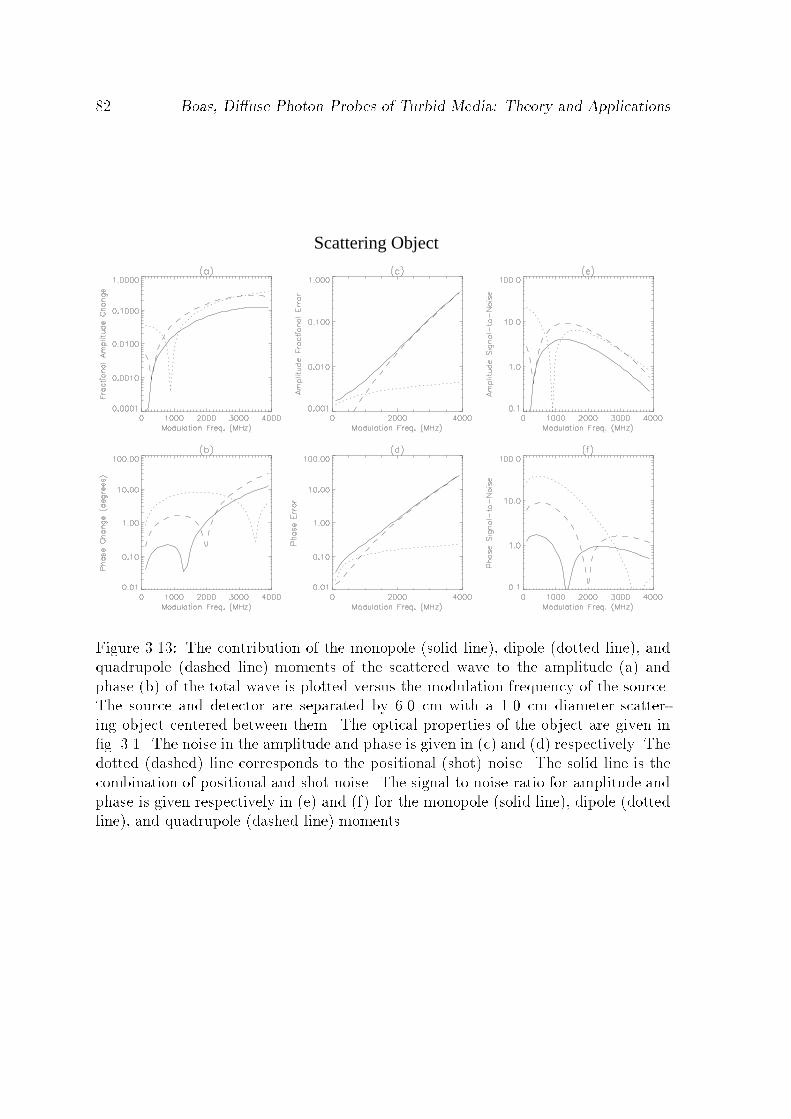
Boas Diuse Photon Probes of Turbid Media Theory and Applications
Scattering Object
Figure The contribution of the monopole solid line dipole dotted line andquadrupole dashed line moments of the scattered wave to the amplitude a andphase b of the total wave is plotted versus the modulation frequency of the sourceThe source and detector are separated by cm with a cm diameter scattering object centered between them The optical properties of the object are given ing The noise in the amplitude and phase is given in c and d respectively Thedotted dashed line corresponds to the positional shot noise The solid line is thecombination of positional and shot noise The signal to noise ratio for amplitude andphase is given respectively in e and f for the monopole solid line dipole dottedline and quadrupole dashed line moments

Chapter Practical Limits to the Detection Localization and Characterization
Figure The fractional uncertainty in the diameter and absorption coecient of anabsorbing object are given in a and b respectively versus the diameter of the objectIn c and d the fractional uncertainties are given for a scattering object Results aregiven for three dierent source detector congurations In all congurations the sourcewas held xed closest to the object at x and the detector was scanned from x to cm in steps of cm The solid lines corresponds to a modulation frequencyof MHz with measurements made at each position The dotted line resultsfrom the modulation frequency scanned from to MHz in steps of MHzwith measurements at each position Finally the dashed lines corresponds to measurement at each position with the frequency scanned from to MHz in stepsof MHz Note that the spectral measurements improve the characterization of thescatttering coecient of the scattering object but do not enhance the characterizationof the absorbing object

Boas Diuse Photon Probes of Turbid Media Theory and Applications
Measurements at Multiple Optical Wavelengths
It is reasonable to expect that measurements at multiple optical wavelengths will
improve our ability to characterize optical inhomogeneities I will show that this
additional information does not improve our ability to characterize the size and optical
properties of inhomogeneities
Consider two sets of measurements made on the same sample one at optical
wavelength and the other at optical wavelength For each set we can independ
ently characterize the size and absorption coecient of the object Assuming that a
common chromophore is the dominant absorber at the two optical wavelengths then
the size of the characterized absorber should be the same for each set Thus instead
of having four unknowns a a a and a we only have three and
three parameters can be characterized more accurately than four
This argument may sound reasonable but we have to be careful It is true that the
uncertainties in the three parameters will be smaller than the uncertainties determ
ined for the four parameters when the two data sets are characterized independently
However will the uncertainties be any smaller than if all measurements were made at
a single wavelength" Lets say that each data set has N measurements In the rst
case we are using N measurements to get a and a and N measurements to
get a and a In the second case we are using N measurements to determine
a a and a We would do better to use N measurements to nd just two
parameters a and a
What if we knew the absorption spectrum of the dominant chromophore at and
" In this case there would only be two unknowns since a and a would
have a known proportionality C This might lead to improved characterization To
see if this is possible we must consider the extended minima or valleys of the chi
squared surfaces for the dierent data sets For a two dimensional chisquare function
there is a valley which indicates the relation between systematic deviations in the two
tting parameters The valley for tting a and a may look like curve in
g This curve tells us what the deviation in a will be if we know the deviation

Chapter Practical Limits to the Detection Localization and Characterization
Radius
0 0.80.4
Abs
orpt
ion
2 =
C A
bsor
ptio
n 1
Abs
orpt
ion
1
0.10
0.18
0.10 C
0.18 CCurve 1 Curve 2
Figure Possible chisquared valleys for a two parameter t for the object radiusand absorption coecient at two dierent optical wavelengths
in a and vice versa For repeated measurements of the data set the determined a
and a values will always appear on curve For the valley may look like curve in
g Curve and curve intersect at the correct values for the object parameters
If we t both data sets simultaneously with the constraint that a a and
a Ca then the tting parameters will be drawn towards the intersection
point of the two curves decreasing the uncertainty If the valleys nearly overlap
then the tting parameters will not be strongly drawn towards the intersection point
Improved characterization is possible only if the dierent curves have signicantly
dierent slopes near the intersection point
Valleys for three spherical objects with dierent absorption coecients but the
same radius are shown in g The dotted dashed and dotdashed lines were
derived from simulations for mm diameter absorbers with absorption coecients
of and cm respectively relative to the background coecient of
cm The other system parameters are indicated in g These valleys
Boas Diuse Photon Probes of Turbid Media Theory and Applications
nearly overlap and therefore we cannot use multiple optical wavelengths to improve
object characterization Even if the curves were more perpendicular uncertainties
associated with the dominant chromophore assumption would reduce any gains in
object characterization
Summary
The interaction between DPDWs and optical inhomogeneities provides a staightfor
ward way of detecting and localizing inhomogeneities and a means for characterizing
the size and optical properties of the inhomogeneity If no noise were present in the
measurements then our ability to characterize these objects would only be limited by
the validity of the model used for the analysis Here I have used an exact analytic
model for the scattering of DPDWs from spherical inhomogeneities which is based on
the diusion approximation to the photon transport equation This model is valid on
length scales larger than the photon random walk step s which is around mm
for tissue Unfortunately noise is always present and as we have seen it diminishes
our ability to characterize inhomogeneities
Detecting and locating inhomogeneities is possible if the perturbation of the incid
ent DPDW the signal see eq is greater than the noise threshold The results
presented here demonstrated that mm diameter objects are detectable for realistic
parameters For small absorbing objects the signal is dominated by the monopole
moment while for small scattering objects the signal is dominated by the dipole and
quadrupole moments For transmission measurements the strongest signal occurs
when the object is directly between the source and detector and therefore a detectable
object is easily located Changing the modulation frequency does not greatly change
the detectability of absorbing or scattering objects except at high frequencies where
the signal is obscured by shotnoise see gs and The detect
ability of objects with dierent optical properties embedded in the same system as
described in g can be determined from the leading order form of the moments of

Chapter Practical Limits to the Detection Localization and Characterization
the scattered DPDW see eqs For instance the leading order signal from
a small absorbing object is proportional to aa This product aa indicates how
much larger a less absorbing object must be or how much smaller a more absorbing
object can be in order for it to still be detectable In particular the product shows
that the size of a detectable object scales as a For example given that an object
with a cm is detectable if a cm then an object with a cm
is detectable if a mm
Characterizing the size and optical properties of an object is not as straightforward
because an indirect method is required eg chisquared tting to determine the
parameters from measurements of the distorted DPDW Furthermore it is necessary
for more than one moment of the scattered DPDW to perturb the signal by a detectable
amount in order to distinguish the contributions from the objects size and optical
properties To determine the size and either the absorption or scattering coecient of
an object it is necessary for two moments to be detectable ie two unknowns and
two equations Likewise to accurately determine three parameters it is necessary
for at least three moments to be detectable Because of these additional requirements
inhomogeneities cannot be accurately characterized unless they are cm or larger in
diameter for realistic parameters
I have demonstrated that the measurement geometry can be optimized in order
to characterize smaller objects The only useful measurements are those for which
the perturbation is detectable Therefore for transmission through a slab geometry it
is best to make measurements with the source closest to the object and the detector
scanned near the point of closest approach to the object or viceversa I have also
demonstrated that MHz is the optimal frequency for detecting and characterizing
absorbing objects Scattering objects are best detected and characterized with mod
ulation frequencies near MHz Characterization of scattering objects is further
optimized using measurements at several modulation frequencies
Still smaller objects can be characterized if there is a priori knowledge of the size or
optical properties of the object For example knowledge of the structural properties
Boas Diuse Photon Probes of Turbid Media Theory and Applications
of the system obtained from a CAT scan or MRI aords an accurate determination
of the optical properties of tumors smaller than cm By reducing the number of un
knowns accurate tumor characterization becomes feasible with the detection of fewer
multipole moments If we know the size of an absorbing or scattering object then the
optical contrast can be determined as long as the contribution from a single moment is
detectable Likewise if the optical contrast is known and the size is sought Thus with
prior knowledge it is possible to accurately characterize detectable objects ie objects
on the order of mm in diameter Any uncertainty in the priorly known quantity will
result in a systematic error in the determined quantity For example if the size of the
object is measured using MRI to be mm and it is actually mm then the recon
structed absorption coecient will be systematically reduced by The systematic
deviation in the absorption scattering coecient of an absorbing scattering object
due to an incorrect previous determination of the size is described by the universal
curve presented in g The solid line derives from the aa as dependence
of the dominate contribution to the scattered wave from an absorbing scattering ob
ject and indicates that an overestimation of the size results in an underestimation of
the optical parameter and vice versa The dotted dashed and dotdashed lines were
derived from simulations for mm diameter absorbers with absorption coecients
of and cm respectively relative to the background coecient of
cm The observed deviation from the universal curve solid line arises from
the increased importance of higher order multipole moments This deviation is small
and thus the universal curve serves as a good rule of thumb Note that this result is
valid for objects of general shape by replacing a with the volume of the object
The limits discussed here for detecting and characterizing optical inhomogeneit
ies with diuse photon density waves are based on ideal systems where the noise is
governed by shotnoise and positional errors The results should thus be viewed as a
best case scenario In the clinical environment other sources of noise are expected to
exist that will further complicate the accurate characterization of optical inhomogen
eities For instance the intrinsic !uctuations of a biological sample about its average

Chapter Practical Limits to the Detection Localization and Characterization
Figure The fractional deviation in the optical parameter versus the fractionaldeviation in the diameter is graphed The optical paremeter represents either theabsorption coecient or scattering coecient

Boas Diuse Photon Probes of Turbid Media Theory and Applications
background value causes amplitude and phase shifts If the intrinsic heterogeneity is
not considered in imaging algorithms then the corresponding signal !uctuations are
essentially noise Quantication of the intrinsic heterogeneity of dierent biological
samples is necessary to determine if this type of noise is signicant Another source
of systematic noise is the discrepancy between diusion models and experiment A
discrepancy between models and experiment of amplitude and a few degrees phase
is not uncommon especially at higher modulation frequencies Further investigation
is required to determine the eect of this systematic noise on optical imaging
Chapter
Correlation Diusion
Introduction
In the previous two chapters I discussed the properties of diuse photon density waves
DPDWs and the use of these intensity waves to probe turbid media for variations
in optical properties In this chapter I show that diusing photons can also be used to
probe the dynamical properties of turbid media Information about the dynamics is
obtained from the Doppler broadening of the laser linewidth as it migrates through the
medium The broadening of the linewidth manifests itself in the intensity uctuations
of spatially coherent speckles of scattered light On the otherhand DPDWs manifest
themselves in the average intensity of scattered light
Although the physics for probing the dynamical properties is dierent I demon
strate a theoretical model for speckle uctuations that is completely analogous to
photon diusion The similarity in the mathematical form of the models suggests that
the observed properties of DPDWs should also be observed for speckle uctuations
The theoretical basis for this work dates back to the late s with the devel
opment of quasielastic light scattering theory QELS for optically dilute dynamical
systems which scatter light no more than once Extensions to highly scattering sys
tems was made in the s in various guises by Bonner and Nossal Pine et al
MacKintosh and John Maret and Wolf and Volkov and Romanov
The analogy of correlation transport to photon transport was rst made by Ackerson
Boas Diuse Photon Probes of Turbid Media Theory and Applications
et al in the s in order to better understand the behavior of correlation
functions in the regime between single scattering and multiple scattering
In section I review these theories and develop a diusion theory for predicting
speckle uctuations The advantage of the correlation diusion theory over previous
theories is the ease with which predictions can be made for turbid media with spatially
varying dynamical and optical properties In the nal sections of this chapter I
present experimental and Monte Carlo results which demonstrate the accuracy of the
correlation diusion model for various systems In the next chapter I present two
biomedical applications for this work
Theory
When a beam of laser light with uniform intensity is incident on a rough surface the
reection of the beam will not have a uniform intensity but will instead be composed
of many bright and dark spots These spots are called speckles and are illustrated by
g The complex intensity prole arises because light is reected in many dier
ent directions from the rough surface and thus photons that have traveled dierent
path lengths interfere constructively and destructively at the detector The same hap
pens for light that has migrated through a turbid solid sample That is the photons
exit the sample traveling in dierent directions and dierent path lengths and thus
interfere constructively and destructively at the detector If the rough surface moves
or scattering particles in the turbid medium are moving the speckle pattern will then
uctuate in time The time scale of the intensity uctuations depends on the motion
of the surface and scattering particles
For the turbid medium the time scale of speckle intensity uctuations depends
on the number of interactions that detected photons have had with moving scattering
particles This section briey reviews the theory for temporal eld autocorrelation
functions of light scattered from optically dilute systems such that photons scatter no
more than once before being detected I then discuss the extension of single scat

Chapter Correlation Diusion
Figure An illustration of a speckle pattern The light regions correspond toregions of strong light intensity and the dark regions correspond to regions of littleintensity
tering theory to systems which highly scatter light After a brief review of diusing
wave spectroscopy I describe in detail a new and more general method based on the
transportdiusion of correlation in optically dense systems
Single Scattering
Consider the system depicted in g A beam of coherent light is incident on a
dilute suspension of identical scattering particles The light scattered by an angle is
detected by a photodetector The electric eld reaching the detector is a superposition
of all the scattered electric elds
E EoF qNX
n
expikin rn expikout Rd rn
EoF q expikout RdNXn
expiq rn

Boas Diuse Photon Probes of Turbid Media Theory and Applications
Here E is the electric eld reaching the detector at positionRd Eo is the amplitude of
the incident eld and F q is the form factor for light to receive a moment transfer of
q kout kin where kout and kin are the output and input wavevectors respectively
and jqj ko sin where ko jkinj jkoutj For simplicity I neglect polarization
eects and assume randomly positioned and oriented scatterers Under these condi
tions the scattering dierential crosssection is only dependent on the magnitude of q
The summation is over the N particles in the scattering volume and rn is the position
of each particle We see from eq that the phase of each scattered wave depends
on the momentum transfer ie scattering angle and the position of the particle
In a disordered system the particles are randomly distributed resulting in random
constructive and destructive interference at the detector Displacing a single particle
changes the interference and thus the intensity reaching the detector
For particles which are undergoing random relative motion eg Brownian motion
the phases of the individual scattered waves are changing randomly independently
from the other scattered waves The intensity at the detector will thus uctuate The
time scale of the intensity uctuations is given by the rate at which the phase of the
scattered waves is changing and thus depends on the motion of the scattering particles
and the momentum transfer Therefore the intensity uctuations are more rapid at
larger scattering angles and for faster moving particles
By monitoring the intensity uctuations it is possible to derive information about
the motion of the scattering particles There are two standard approaches One entails
analysis of the power spectrum of the detected signal ie
S Z
dtIt cost
The other uses the unnormalized temporal autocorrelation of the intensity
G hItIt i
It is the intensity at time t and the hi denotes an ensemble average For an ergodic
system an ensemble average is equivalent to a time average and thus G can be

Chapter Correlation Diusion
CollimatedPin Holes
Photo-Detector
koutIncident Light
Scattered Light
k
θ
in
Figure Light is incident on a dilute suspension of scatterers The suspensionis dilute enough such that photons are scattered no more than once Light that isscattered by an angle is collimated by two pinholes and monitored with a photodetector
Boas Diuse Photon Probes of Turbid Media Theory and Applications
obtained by a temporal average of the correlation function The two methods are
related as discussed The exact relationship states that the intensity
power spectrum and eld correlation function form a Fourier transform pair
ie
S hIi
Z
cos g d
where g G hIi is the normalized temporal intensity correlation function
and hIi is the average intensity
I focus on the temporal correlation method Instead of calculating the temporal
intensity autocorrelation function G the standard approach is to derive the tem
poral eld correlation function G hEE i and note that the two are
related by the Siegert relation
G hIi jG j
where hIi is the ensemble averaged intensity is a parameter which depends on the
number of speckles detected and the coherence length and stability of the laser
thus depends on the experimental setup For an ideal experimental setup See
for more discussion on
The normalized temporal eld correlation function is
g hEE ihjEji
Using eq for the scattered electric eld and noting that the cross terms resulting
in eq average to zero when particle motions are uncorrelated we nd
g hexp iq r i
r r r is the displacement of a particle in time and the average is over
r weighted by the appropriate distribution In the case of Brownian motion the
average is weighted by
P r
DB exp
jr j
DB

Chapter Correlation Diusion
where P r is the probability of a particle being displaced a distance r in a
time Calculating the weighted average eq becomes
g exp
qDr
E
hr i DB is the mean squared displacement of the scattering particles in
time t where DB is the Brownian diusion coecient The correlation function thus
decays exponentially with a decay time on the order of the amount of time it takes
a scattering particle to move a wavelength of light That is the time scale of the
intensity uctuations is on the order of the time it takes a particle to move one light
wavelength q
The decay of g for systems with random ow can also be calculated In this
case r V and the average is over the velocity distribution For an isotropic
Gaussian velocity distribution the correlation function still decays as eq but
hr i hV i where hV i is the mean square velocity A Gaussian speed
distribution is assumed Shear ow and turbulence have also been studied
Multiple Scattering Diusing Wave Spectroscopy
When the concentration of scattering particles is increased light is scattered many
times before it exits the system see g The photons reaching the detector have
followed various trajectories of diering path lengths Under these conditions the
correlation function can be calculated using the framework of diusing wave spectro
scopy DWS Considering only those photons which have scattered N times before
detection the normalized eld correlation function has the form
gN
exp
i
NXn
qn rn
qr
hexp iq riNqr
exp
qDr
EN
q

Boas Diuse Photon Probes of Turbid Media Theory and Applications
exp
DqE D
r Esl
On the rst line the sum appears in the argument of the exponent to account for the
phase shift accumulated from each scattering event The hi denotes an average over
the momentum transfer and particle displacement The average over the scattering
angle momentum transfer is necessary because it is not constrained as it was in
the single scattering experiment The second line is derived assuming that successive
scattering events and neighboring particle motions are uncorrelated These assump
tions are valid in a disordered system with no particleparticle interactions Some care
must be taken when particle motions are correlated The third line results from the
ensemble average over the particle displacement where hr i is the mean square
displacement of the scattering particles see section The meansquare displace
ment has been assumed to be isotropic This is the case with Brownian motion and
random ow but not directional ows We next bring the qaverage inside the argu
ment of the exponential via a rst order cummulant expansion This approximation
is valid as long as q
hr i Finally we assume that there have been many
scattering events in which case N is well approximated by sl where s is the path
length and l s is the scattering length
The average over the momentum transfer is weighted by the normalized dierential
cross section That is
DqE
Z
fcos qdcos
ko
sin
ko hcos i ko
l
l
Here fcos is the normalized form factor and q ko sin Using the simil
arity relation discussed in section we see that ll hcos i where l s
is the photon random walk step length and the average over cos is also weighted
by the normalized dierential crosssection we see that hqi ko ll Therefore
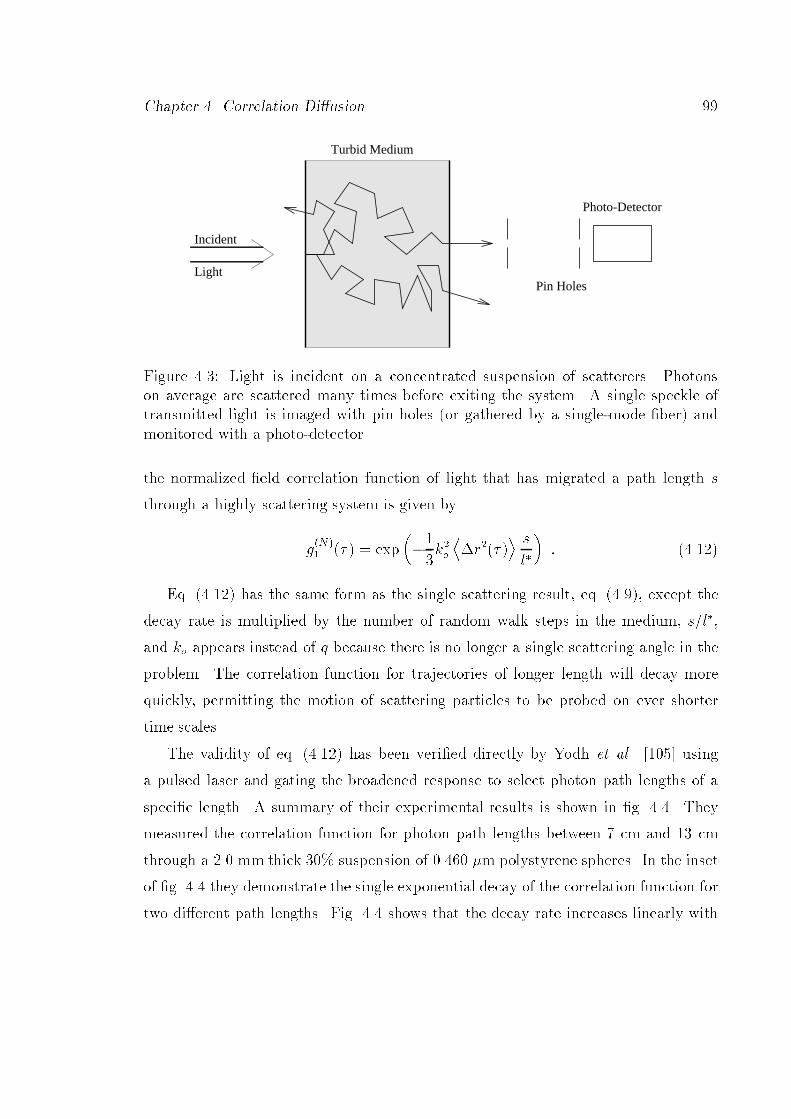
Chapter Correlation Diusion
Turbid Medium
Incident
Light
Photo-Detector
Pin Holes
Figure Light is incident on a concentrated suspension of scatterers Photonson average are scattered many times before exiting the system A single speckle oftransmitted light is imaged with pin holes or gathered by a singlemode ber andmonitored with a photodetector
the normalized eld correlation function of light that has migrated a path length s
through a highly scattering system is given by
gN exp
koDr
E s
l
Eq has the same form as the single scattering result eq except the
decay rate is multiplied by the number of random walk steps in the medium sl
and ko appears instead of q because there is no longer a single scattering angle in the
problem The correlation function for trajectories of longer length will decay more
quickly permitting the motion of scattering particles to be probed on ever shorter
time scales
The validity of eq has been veried directly by Yodh et al using
a pulsed laser and gating the broadened response to select photon path lengths of a
specic length A summary of their experimental results is shown in g They
measured the correlation function for photon path lengths between cm and cm
through a mm thick suspension of m polystyrene spheres In the inset
of g they demonstrate the single exponential decay of the correlation function for
two dierent path lengths Fig shows that the decay rate increases linearly with
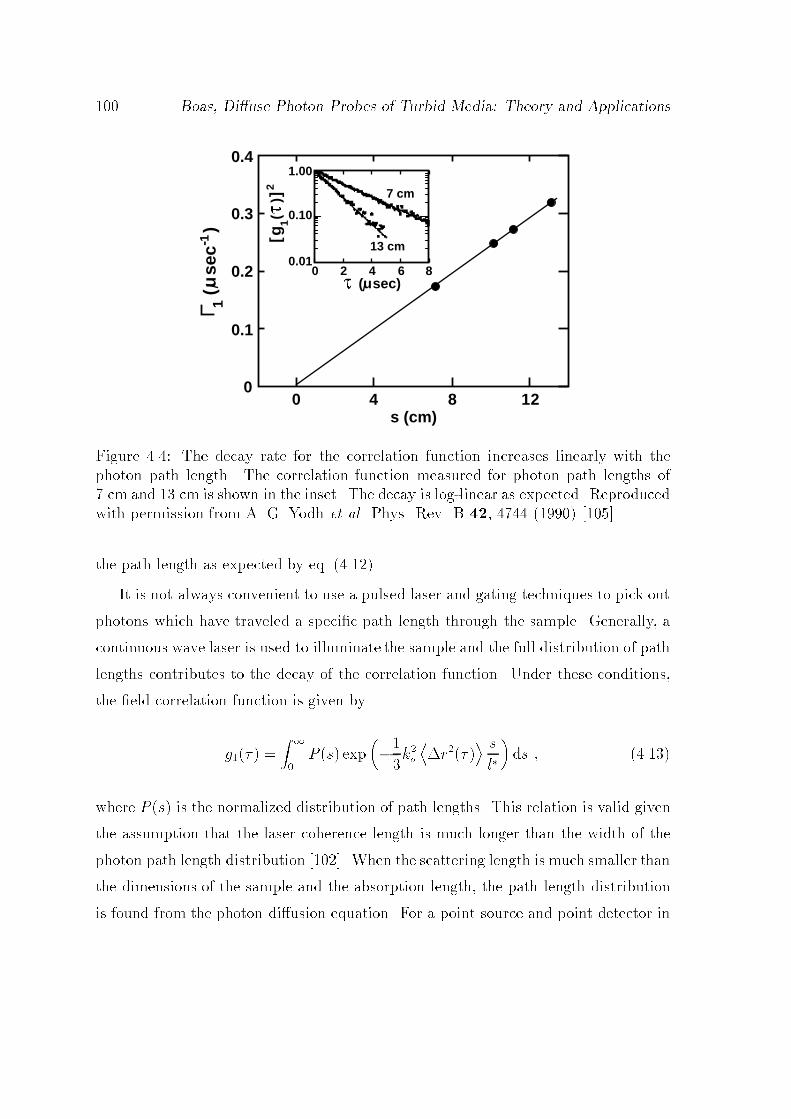
Boas Diuse Photon Probes of Turbid Media Theory and Applications
0.4
0.3
0.2
0.1
0
[g
1(
)]2
7 cm
13 cm
0 2 4 6 8
1.00
0.10
0.01
(usec)
0 4 8 12
1 (u
sec-1
)
s (cm)
Figure The decay rate for the correlation function increases linearly with thephoton path length The correlation function measured for photon path lengths of cm and cm is shown in the inset The decay is loglinear as expected Reproducedwith permission from A G Yodh et al Phys Rev B
the path length as expected by eq
It is not always convenient to use a pulsed laser and gating techniques to pick out
photons which have traveled a specic path length through the sample Generally a
continuous wave laser is used to illuminate the sample and the full distribution of path
lengths contributes to the decay of the correlation function Under these conditions
the eld correlation function is given by
g Z
P s exp
koDr
E s
l
ds
where P s is the normalized distribution of path lengths This relation is valid given
the assumption that the laser coherence length is much longer than the width of the
photon path length distribution When the scattering length is much smaller than
the dimensions of the sample and the absorption length the path length distribution
is found from the photon diusion equation For a point source and point detector in
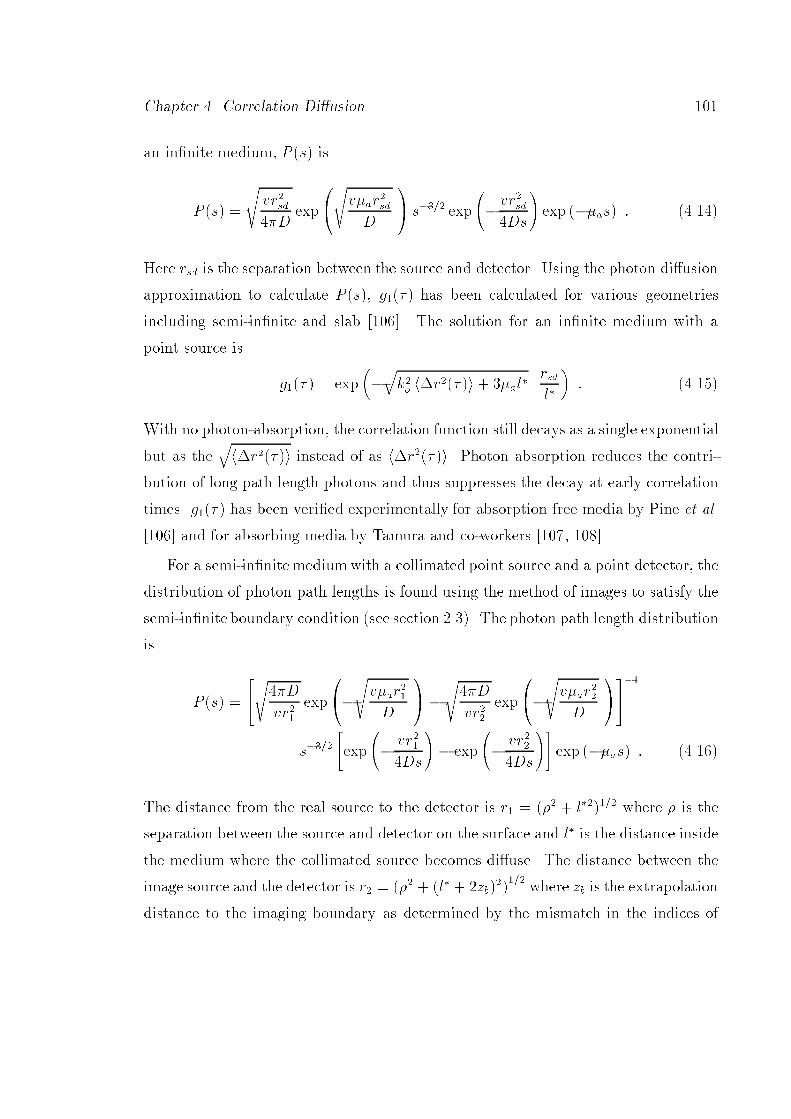
Chapter Correlation Diusion
an innite medium P s is
P s
svrsdD
exp
svarsdD
A s exp
vrsdDs
exp as
Here rsd is the separation between the source and detector Using the photon diusion
approximation to calculate P s g has been calculated for various geometries
including semiinnite and slab The solution for an innite medium with a
point source is
g expqko hr i al
rsdl
With no photonabsorption the correlation function still decays as a single exponential
but as theqhr i instead of as hr i Photon absorption reduces the contri
bution of long path length photons and thus suppresses the decay at early correlation
times g has been veried experimentally for absorption free media by Pine et al
and for absorbing media by Tamura and coworkers
For a semiinnitemediumwith a collimated point source and a point detector the
distribution of photon path lengths is found using the method of images to satisfy the
semiinnite boundary condition see section The photon path length distribution
is
P s
sD
vrexp
svarD
A
sD
vrexp
svarD
A
sexp
vrDs
exp
vrDs
exp as
The distance from the real source to the detector is r l where is the
separation between the source and detector on the surface and l is the distance inside
the medium where the collimated source becomes diuse The distance between the
image source and the detector is r l zb
where zb is the extrapolation
distance to the imaging boundary as determined by the mismatch in the indices of

Boas Diuse Photon Probes of Turbid Media Theory and Applications
refraction see section With this P s the eld correlation function is
g exp
qko hr i al
rl
exp
qko hr i al
rl
exp
pal
rl
exp
pal
rl
Other important geometries include plane wave transmission through a slab and
diuse backscattering of a plane wave These solutions are discussed by Pine et al
For plane wave transmission through a slab
g
Ll
qDBko
DBko
sinh
hLl
qDBko
i
qDBko cosh
hLl
qDBko
i
where L is the thickness of the slab For backscattering of a plane wave from a slab
g sinh
hqDBko
Ll
i
qDBko cosh
hqDBko
Ll
i
DBkosinh
hLl
qDBko
i
qDBko cosh
hLl
qDBko
i
For a slab of innite thickness eq becomes
g exp
hqDBko
i
qDBko
To summarize within the framework of diusing wave spectroscopy the decay of
g is found by rst considering photon trajectories of a given length through the
sample and calculating the average phase uctuations by averaging over the particle
displacements and the momentum transfer per scattering event The distribution of
path lengths through the sample is then used to determine the overall decay of g
Similar equations for the eld correlation function arising from highly scattering
systems have been obtain using eld theory For discussions on the derivation using
eld theory see MacKintosh and John Maret and Wolf and Volkov and
Romanov
Correlation Transport and Correlation Diusion
A dierent approach for nding g has been proposed by Ackerson et al
that does not rely on the assumptions made by DWS This new approach treats the
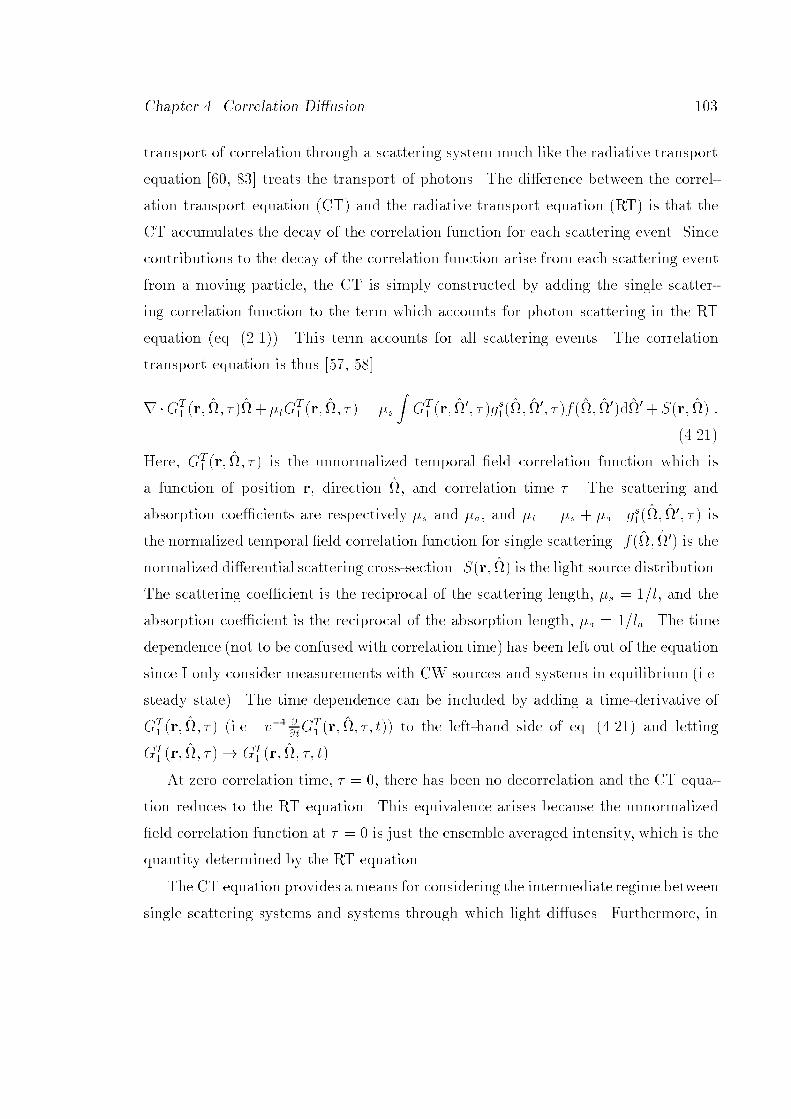
Chapter Correlation Diusion
transport of correlation through a scattering system much like the radiative transport
equation treats the transport of photons The dierence between the correl
ation transport equation CT and the radiative transport equation RT is that the
CT accumulates the decay of the correlation function for each scattering event Since
contributions to the decay of the correlation function arise from each scattering event
from a moving particle the CT is simply constructed by adding the single scatter
ing correlation function to the term which accounts for photon scattering in the RT
equation eq This term accounts for all scattering events The correlation
transport equation is thus
rGT r tG
T r s
ZGT
r gs
f dSr
Here GT r is the unnormalized temporal eld correlation function which is
a function of position r direction and correlation time The scattering and
absorption coecients are respectively s and a and t s a gs is
the normalized temporal eld correlation function for single scattering f is the
normalized dierential scattering crosssection Sr is the light source distribution
The scattering coecient is the reciprocal of the scattering length s l and the
absorption coecient is the reciprocal of the absorption length a la The time
dependence not to be confused with correlation time has been left out of the equation
since I only consider measurements with CW sources and systems in equilibrium ie
steady state The time dependence can be included by adding a timederivative of
GT r ie v
tGT
r t to the lefthand side of eq and letting
GT r GT
r t
At zero correlation time there has been no decorrelation and the CT equa
tion reduces to the RT equation This equivalence arises because the unnormalized
eld correlation function at is just the ensemble averaged intensity which is the
quantity determined by the RT equation
The CT equation provides a means for considering the intermediate regime between
single scattering systems and systems through which light diuses Furthermore in

Boas Diuse Photon Probes of Turbid Media Theory and Applications
the limit of single scattering it reduces to the standard single scattering correlation
function discussed in section and as I will discuss solutions in the photon
diusion regime are the same as obtained from DWS see section The CT
equation is useful because its validity ranges from single scattering to multiple scat
tering systems does not require the assumptions made within DWS and aords a
straightforward approach to considering systems with spatiallyvarying optical and
dynamical properties A drawback to the CT equation is the diculty in obtaining
analytical and numerical solutions The RT equation is plagued by the same problem
Because of the similarity between the CT equation and the RT equation we should be
able to apply the same approximation methods to the CT equation as we applied to
the RT equation
Using the standard diusion approximation the CT equation reduces to the follow
ing correlation diusion equation see appendix ADr va
vsk
o
Dr
EGr vSr
Here D vs is the photon diusion coecient v is the speed of light in
the medium and s s hcos i l is the reduced scattering coecient
Recall that for Brownian motion hr i DB and for random ow hr i hV i
To obtain the correlation diusion equation it is necessary to assume that the
photons are diusing and that the scattering phase function f and the single
scattering correlation function gs only depend on the scattering angle
and that ko hr i The photon diusion assumption is valid if the photon
random walk step length is smaller than the dimensions of the sample and the photon
absorption length The scattering angle assumption ie is valid for systems
with randomly oriented scatterers and isotropic dynamics eg Brownian motion
and random ow The short time assumption requires the correlation time to
be much smaller than the time it takes a scatterer to move a wavelength of light
When the photon wavelength is nm and the dynamics are Brownian motion with
DB x cms then the short time assumption requires x s The

Chapter Correlation Diusion
breakdown of this approximation is explored in section In an innite homo
geneous system the breakdown of this approximation is observable at s and is
independent of the photon absorption coecient The deviation increases with source
detector separation and reduced scattering coecient For a sourcedetector separa
tion of cm the deviation is and increases to for a cm sourcedetector
separation
Eq can be recast as a Helmholtz equation for the eld correlation function
ie r K
Gr vS
Dr rs
where K va
sk
o hr i
D Here I have taken the light source
to be point like ie CW and located at position rs Note that
sk
o hr i
is a loss term similar to a While a represents losses due to photon absorption
sk
o hr i represents the absorption of correlation due to dynamic processes
When there is no dynamic absorption and eq reduces to the steadystate
photon diusion equation eq
For an innite homogeneous system with no photon absorption ie a the
solution to eq has the well known form
Gr vS exp
qs k
o hr i jr rsj
D jr rsj
This same solution has been derived within the context of DWS and from the
scalar wave equation for the electric eld propagating in a medium with a uctuating
dielectric constant In contrast to these two approaches the correlation
diusion equation provides a simple framework for considering turbid media with
large scale spatially varying dynamics and optical properties
With some diculty such systems can be considered with diusingwave spec
troscopy I have considered this and found that diusingwave spectroscopy requires
the computation of complicated integrations of photon dwell times in localized voxels
convolved with a volume integral On the other hand the correlation diusion equa
tion requires the solution of a simple dierential equation Because the correlation
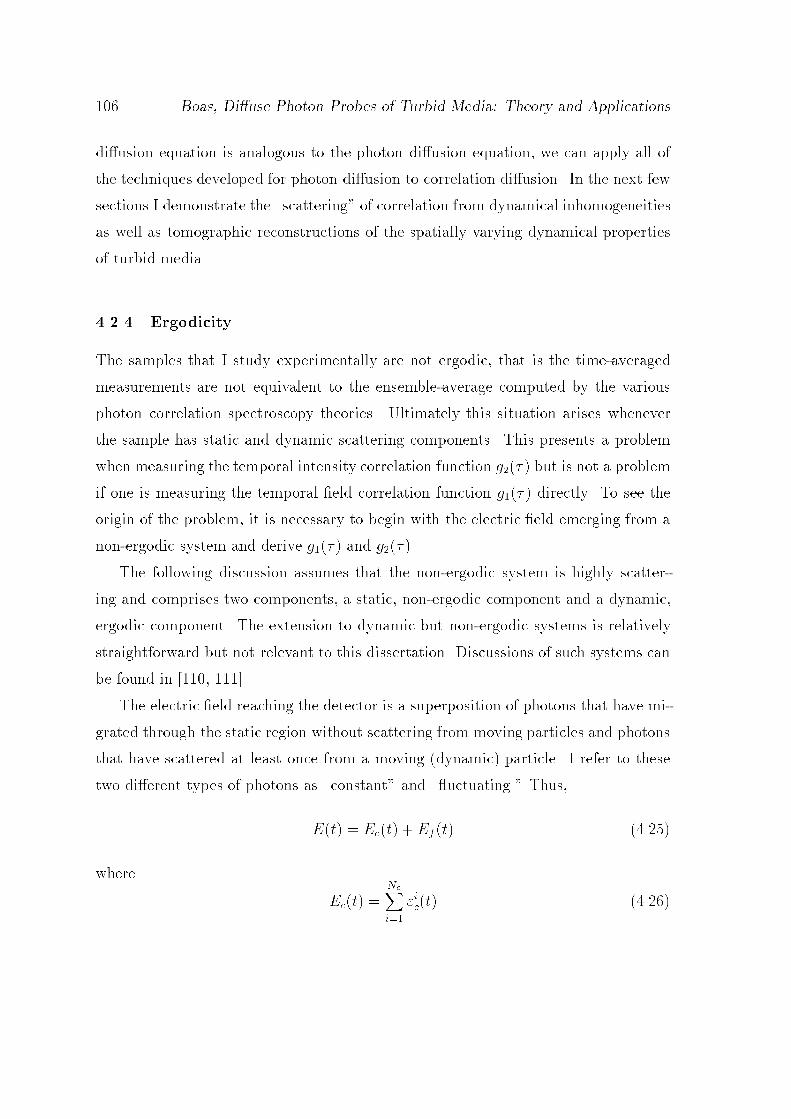
Boas Diuse Photon Probes of Turbid Media Theory and Applications
diusion equation is analogous to the photon diusion equation we can apply all of
the techniques developed for photon diusion to correlation diusion In the next few
sections I demonstrate the scattering of correlation from dynamical inhomogeneities
as well as tomographic reconstructions of the spatially varying dynamical properties
of turbid media
Ergodicity
The samples that I study experimentally are not ergodic that is the timeaveraged
measurements are not equivalent to the ensembleaverage computed by the various
photon correlation spectroscopy theories Ultimately this situation arises whenever
the sample has static and dynamic scattering components This presents a problem
when measuring the temporal intensity correlation function g but is not a problem
if one is measuring the temporal eld correlation function g directly To see the
origin of the problem it is necessary to begin with the electric eld emerging from a
nonergodic system and derive g and g
The following discussion assumes that the nonergodic system is highly scatter
ing and comprises two components a static nonergodic component and a dynamic
ergodic component The extension to dynamic but nonergodic systems is relatively
straightforward but not relevant to this dissertation Discussions of such systems can
be found in
The electric eld reaching the detector is a superposition of photons that have mi
grated through the static region without scattering from moving particles and photons
that have scattered at least once from a moving dynamic particle I refer to these
two dierent types of photons as constant and uctuating Thus
Et Ect Ef t
where
Ect NcXi
ict
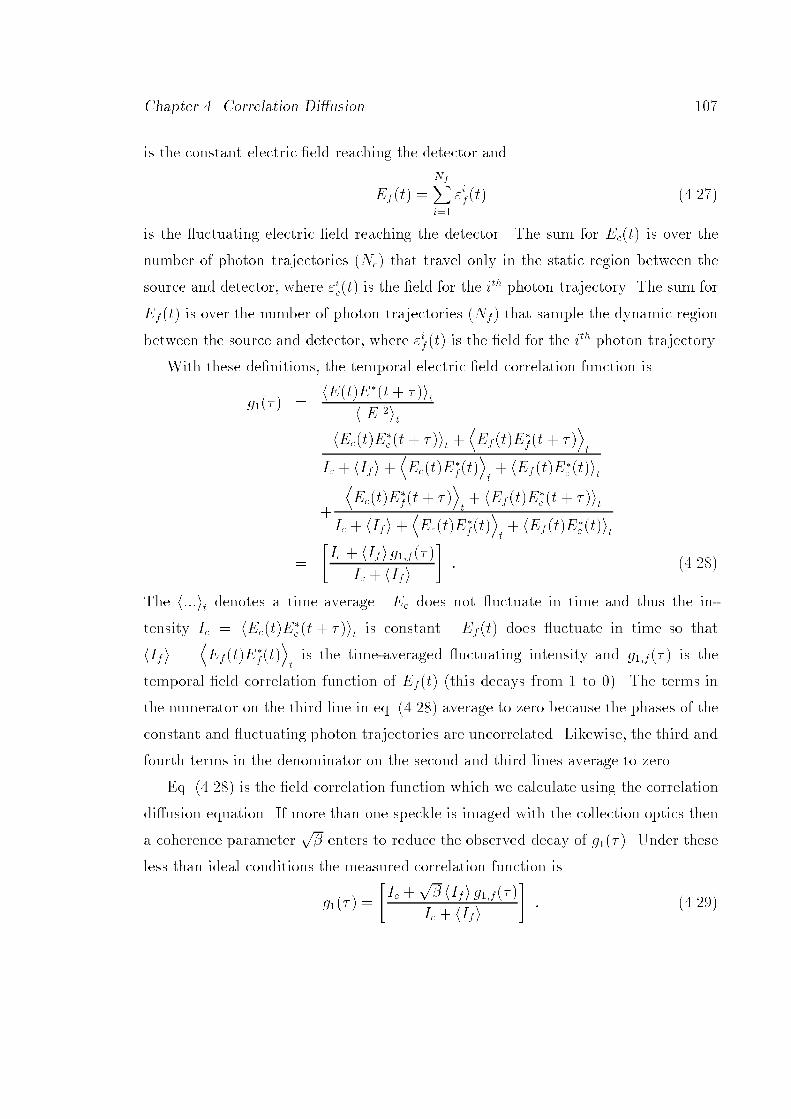
Chapter Correlation Diusion
is the constant electric eld reaching the detector and
Ef t NfXi
ift
is the uctuating electric eld reaching the detector The sum for Ect is over the
number of photon trajectories Nc that travel only in the static region between the
source and detector where ict is the eld for the ith photon trajectory The sum for
Ef t is over the number of photon trajectories Nf that sample the dynamic region
between the source and detector where if t is the eld for the ith photon trajectory
With these denitions the temporal electric eld correlation function is
g hEtEt it
hjEjit
hEctE
c t it DEf tE
ft Et
Ic hIfi DEctE
ftEt hEf tE
c tit
DEctE
ft Et hEf tE
c t itIc hIfi
DEctE
ftEt hEf tE
c tit
Ic hIf i gf
Ic hIfi
The hit denotes a time average Ec does not uctuate in time and thus the in
tensity Ic hEctEc t it is constant Ef t does uctuate in time so that
hIf i DEf tE
ftEtis the timeaveraged uctuating intensity and gf is the
temporal eld correlation function of Eft this decays from to The terms in
the numerator on the third line in eq average to zero because the phases of the
constant and uctuating photon trajectories are uncorrelated Likewise the third and
fourth terms in the denominator on the second and third lines average to zero
Eq is the eld correlation function which we calculate using the correlation
diusion equation If more than one speckle is imaged with the collection optics then
a coherence parameterp enters to reduce the observed decay of g Under these
less than ideal conditions the measured correlation function is
g
Ic
p hIfi gf Ic hIfi

Boas Diuse Photon Probes of Turbid Media Theory and Applications
The factorp is easily removed from g The eld correlation function is expected
to decay from and plateau at a value of B IcIc hIfi The less than ideal
experimental conditions will result in g decaying from a value less than to B
In nonideal conditions the total decay will bep A
p hIf i Ic hIfi when it
was expected to be A AB and B is found from the value of g as
We can thus obtain the correct eld correlation function using
gCorrect BgMeasured B
gMeasured B
B
As we will see problems arise when measuring g because the value of B and A
cannot be determined
Deriving the explicit form for the temporal intensity correlation function is a little
more involved In this case
G hItIt it hEtEtEt Et it Ic Ict hIfi EctE
c t
DE
f tEft Et
Ec tEct
DEf tE
ft
Et hIf i Ic
DEf tE
ftEf t E
f t E
The product on the rst line of eq results in terms of which average to
zero The remaining terms are given on the rd th and th lines Although Ec and
Ic are independent of time the argument is given to indicate the origin of the dierent
terms The rd and th terms are the heterodyne terms arising from the beating of Ec
with Ef t ie
EctEc t
DE
f tEf t Et E
c tEct DEf tE
ft
Et Ic hIfi gf
The th term is more complicated The summations over dierent trajectories
giving rise to Ef t eq must be included and the timeaverage of the products

Chapter Correlation Diusion
of the dierent trajectories must be considered The th term is thus
DEf tE
ftEft E
ft Et
NfXijkl
Dif t
jf tkft lf t
Et
NfX
ijkl
Dift
jf tkft lf t
Et
NfX
ijklik
Dif t
jf tkft lf t
Et
hIfi hIfiN
f Nf
Nf
jgf j
hIf i hIfi jgf j
The rst term hIfi derives from the Nf i j terms multiplied by the Nf k l
terms The second term results from i l and j k excluding the Nf terms where
i j k l The reasonable assumption Nf Nf is made The other combinations
of i j k and l average to zero because the phases are uncorrelated
The temporal intensity correlation function for the described nonergodic system
is thus
g p Ic hIfi jgf j hIfi jgf j
Ic hIfi
This correlation function has a heterodyne term Ic hIf i jgf j and a homodyne
term hIfi jgf j I have included the coherence factor which depends on the
number of speckles averaged and the laser coherence length When measuring a single
speckle created by a stable long coherence length laser then Unfortunately
experimentally usually varies between and and must be measured It is safe to
assume that will remain constant for measurements made on dierent speckles since
only depends on the laser and detection optics However Ic will vary changing the
relative importance of the homodyne and heterodyne terms
The standard method to obtain the eld correlation function that which we cal
culate from the intensity correlation function that which we measure is to use the
Siegert relation
g jg j
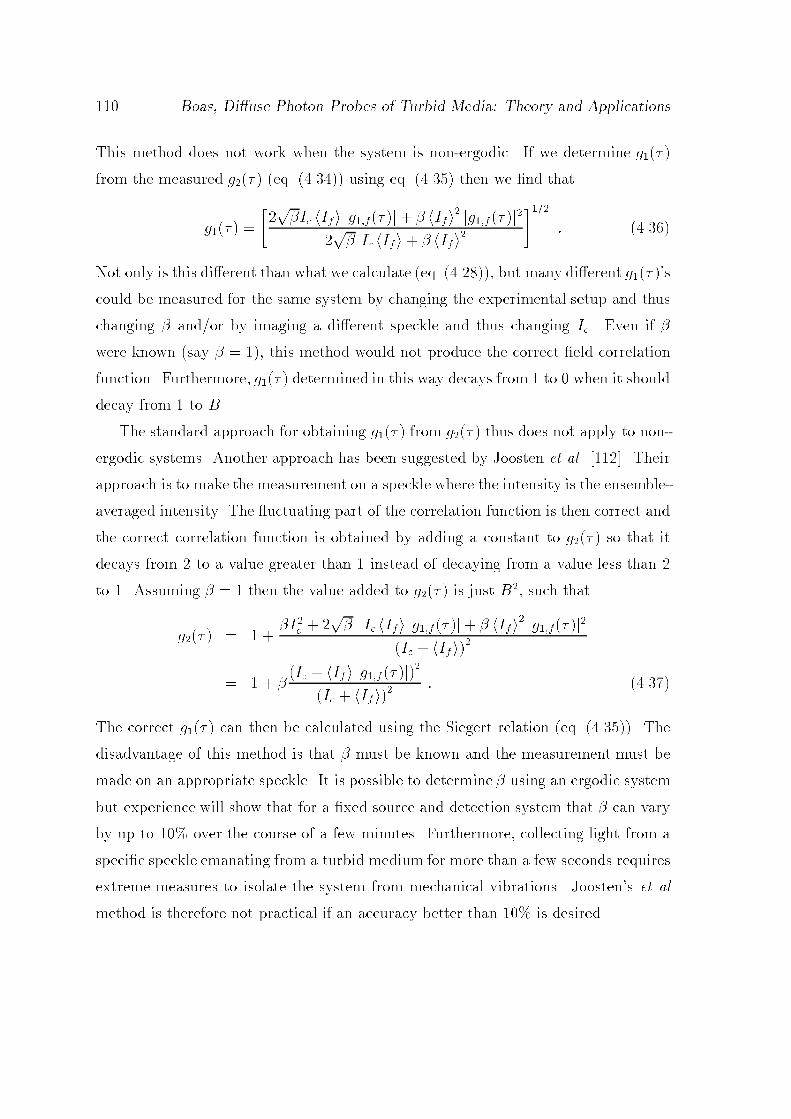
Boas Diuse Photon Probes of Turbid Media Theory and Applications
This method does not work when the system is nonergodic If we determine g
from the measured g eq using eq then we nd that
g
pIc hIfi jgf j hIfi jgf j
p Ic hIfi hIfi
Not only is this dierent than what we calculate eq but many dierent g s
could be measured for the same system by changing the experimental setup and thus
changing andor by imaging a dierent speckle and thus changing Ic Even if
were known say this method would not produce the correct eld correlation
function Furthermore g determined in this way decays from to when it should
decay from to B
The standard approach for obtaining g from g thus does not apply to non
ergodic systems Another approach has been suggested by Joosten et al Their
approach is to make the measurement on a speckle where the intensity is the ensemble
averaged intensity The uctuating part of the correlation function is then correct and
the correct correlation function is obtained by adding a constant to g so that it
decays from to a value greater than instead of decaying from a value less than
to Assuming then the value added to g is just B such that
g Ic
p Ic hIfi jgf j hIfi jgf j
Ic hIfi
Ic hIf i jgf j
Ic hIf i
The correct g can then be calculated using the Siegert relation eq The
disadvantage of this method is that must be known and the measurement must be
made on an appropriate speckle It is possible to determine using an ergodic system
but experience will show that for a xed source and detection system that can vary
by up to over the course of a few minutes Furthermore collecting light from a
specic speckle emanating from a turbid medium for more than a few seconds requires
extreme measures to isolate the system from mechanical vibrations Joostens et al
method is therefore not practical if an accuracy better than is desired
Chapter Correlation Diusion
Figure The ensemble average correlation function from a nonergodic turbidmedium is shown The medium is a solid highly scattering slab with a cylindricalvein through which a highly scattering colloid ows The early decay correspondsto the ow dynamics while the long decay results from the ensemble averagingThe three curves come from three dierent ow speeds the soliddotteddashed linescorrespond to ow speeds of cm s respectively The early decayrate increases with the ow speed The longer decay depends only on the rateof ensemble averaging which is held constant The intermediate plateau reveals therelative magnitudes of hIci and hIfi and tells us what fraction of the detected photonshave sampled the dynamic region This is independent of the ow speed as expected

Boas Diuse Photon Probes of Turbid Media Theory and Applications
In general for a nonergodic system from a measurement of g it is not possible
to independently determine Ic hIfi and Therefore the proper temporal electric eld
correlation function cannot be determined In order to obtain the proper correlation
function I ensemble average during the acquisition of the intensity correlation function
This method has been described in detail by Xue et al The technique for
ensemble averaging that I use is explained in section Basically the idea is to
move the detector from speckle to speckle during the course of the measurement In
this way Ect will uctuate on a time scale given by the motion of the detector from
speckle to speckle Eq thus becomes
G hEctEc tEct E
c t i hEctEc t i
DE
f tEft E
hEc tEct i
DEf tE
ft
E hIf i hIci
DEf tE
ftEf t E
f t E
hIci hIfi hIci jgc j hIf i jgf j
where hIci is the average intensity of the constant component of the speckles gc
is the correlation function of the uctuating Ect and all hi are time averages The
normalized intensity correlation function is thus
g hIci jgc j hIf i jgf j
hIci hIfi
gc decays in a loglinear fashion on a time scale that is proportional to the amount
of time it takes to move the detector from one speckle to the next If the decay
time of gc is much longer than that of gf then the measured correlation func
tion will look like that shown in g and the uctuations due to sample dynamics
are easily separated from ensemble averaging uctuations The correlation function
at early times when gc is then
g hIci hIfi jgf j
Ic hIfi
and from the Siegert relation
g jg j
Chapter Correlation Diusion
we nd that
g hIci hIf i jgf j
hIci hIfi
This is exactly the temporal eld correlation function which we calculate with the
correlation diusion theory There is no need to separate hIfi jgf j from hIci Fromthe plateau in the correlation function that occurs when gf it is possible to
determine hIci and thus hIf i and jgf j However for comparisons with solutions
of the correlation diusion equation it is not necessary to make this separation it is
only necessary that gc for the temporal region of interest
Experimental Results
Validity of Diusion Equation for Media with Spatially Varying
Brownian Motion
This section compares experimental and theoretical results to verify the validity of the
correlation diusion equation for turbid media with spatially varying dynamical and
optical properties The experiments are performed on a turbid slab which is static
and homogeneous except for a spherical region which is dynamic Dynamic regions
with dierent magnitudes of Brownian motion and dierent scattering coecients are
considered
Before discussing the experiment I briey review the solution to eq for a
mediumwhich is homogeneous except for a spherical region with radius a character
ized by dierent optical and dynamical properties than the surrounding medium The
spherical region can also be characterized by dierent optical properties The analytic
solution of the correlation diusion equation for this system reveals that the measured
correlation function outside the sphere can be interpreted as a superposition of the
incident correlation plus a term which accounts for the scattering of the correlation
Boas Diuse Photon Probes of Turbid Media Theory and Applications
from the sphere ie
Gout rs rd
S exp iKout jrd rsjD jrd rsj
Xl
Alhl Kout rdY
l
Here hl are Hankel functions of the rst kind and Y
l are spherical harmonics
The sphere is centered on the origin and the source is placed on the zaxis to exploit
azimuthal symmetry The coecient Al is the scattering amplitude of the lth partial
wave and is found by matching the appropriate boundary conditions on the surface
of the sphere The boundary conditions are similar to that for the photon diusion
equation discussed in section Specically the correlation must be continuous
across the boundary as well as the net ux normal to the boundary ie Gout a
Gin a and Dout
r rGout r jra Din
r rGin r jra on the surface of the
sphere Gin r is the correlation function inside the spherical object and r is the
normal vector to the sphere Applying these boundary conditions we nd
Al ivSKout
Dout
hl KoutzsY
l
Dout
xjlxjlyDin yjlxj
ly
Dout xh
l xjlyDin
yhl xjly
where jl are the spherical Bessel functions of the rst kind x Kouta y K ina a is
the radius of the sphere rs is the position of the source and jl and hl are the rst
derivatives of the functions jl and hl with respect to the argument This solution has
been discussed in detail for DPDWs in section By viewing the perturb
ation of temporal correlation as a scattering process simple algorithms adapted from
scattering theory can be applied to reconstruct images of spatially varying dynamics
in turbid media
I demonstrate the scattering of temporal correlation by a dynamical inhomogeneity
in an experiment shown in g In this experiment the temporal intensity correla
tion function is measured in remission from a semiinnite highlyscattering solid slab
of TiO suspended in resin DB The slab contains a spherical cavity lled with a
turbid uctuating suspension of m polystyrene balls DB x cms
The measured temporal intensity correlation function g for three dierent source
detector separations is presented in g g is plotted for the system with no

Chapter Correlation Diusion
AutocorrelatorPMT
Ar-Ion LaserInput Fiber
Output Fiber
Figure The nm line from an argon ion laser operated at W with an etalonis coupled into a multimode ber optic cable and delivered to the surface of a solidslab of TiO suspended in resin The slab has dimensions of xx cm A sphericalcavity with a diameter of cm is located cm below the center of the upper surfaceThe cavity is lled with a suspension of m diameter polystyrene spheresat C resulting in s cm a cm and DBx cmsFor the solid s cm and a cm A singlemode ber collects lightat a known position and delivers it to a photomultiplier tube PMT whose outputenters a digital autocorrelator to obtain the temporal intensity correlation functionThe temporal intensity correlation function is related to the temporal eld correlationfunction by the Siegert relation The bers can be moved to any positionon the sample surface
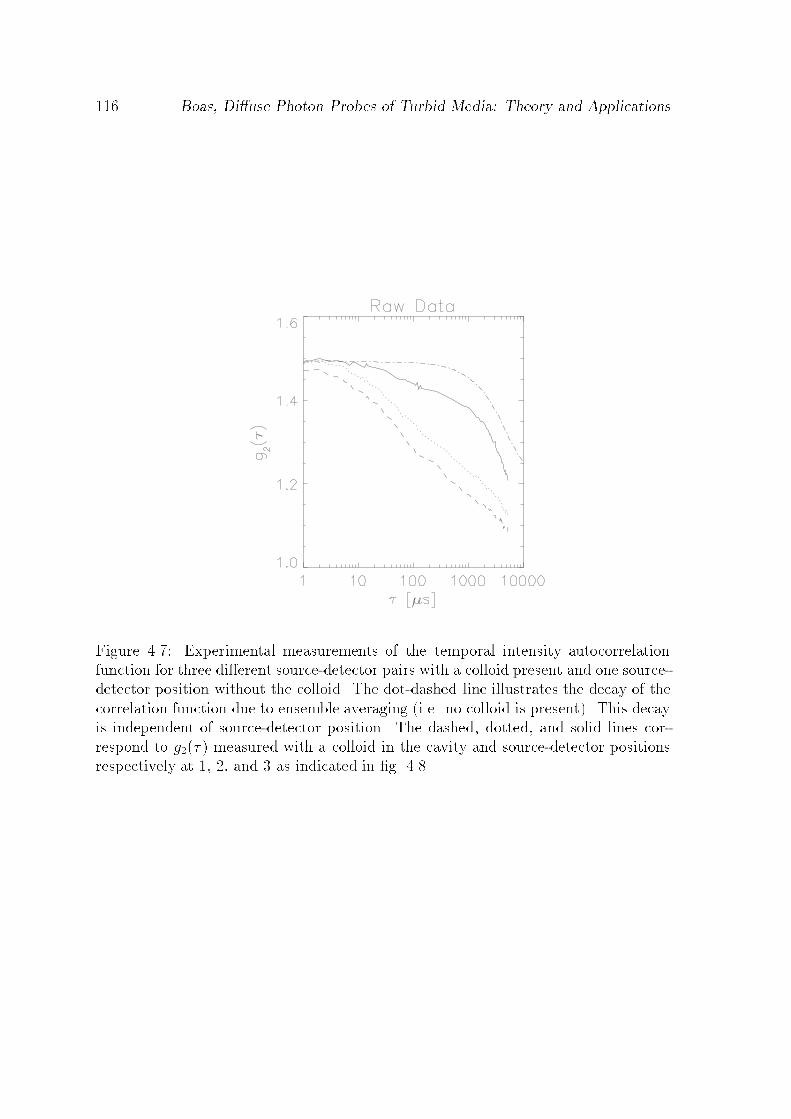
Boas Diuse Photon Probes of Turbid Media Theory and Applications
Figure Experimental measurements of the temporal intensity autocorrelationfunction for three dierent sourcedetector pairs with a colloid present and one sourcedetector position without the colloid The dotdashed line illustrates the decay of thecorrelation function due to ensemble averaging ie no colloid is present This decayis independent of sourcedetector position The dashed dotted and solid lines correspond to g measured with a colloid in the cavity and sourcedetector positionsrespectively at and as indicated in g

Chapter Correlation Diusion
Brownian motion ie no colloid is present to illustrate the time scale introduced by
ensemble averaging From the raw data we see that as expected since we
are using a singlemode ber that propagates the two orthogonal polarizations We
also observe the short time decay of the correlation function due to Brownian motion
and the long time decay due to ensemble averaging The decay due to ensemble av
eraging is signicant for s and is not dependent on sourcedetector position
or separation
Fig plots the decay of the normalized temporal eld correlation function g
obtained from g and compares these results to theoretical predictions based on
eq The expected trend is observed When the source and detector are closer
to the dynamical region there is more decay in the correlation function and the rate
of decay is greater Here the largest fraction of detected photons have sampled the
dynamical region and on average have had more scattering events in the dynamical
region The agreement between experiment and theory is NOT good In order to get
good agreement the Brownian diusion coecient must be reduced by a factor of
to For the theoretical results presented in g DB x cms which
is a factor of smaller than the expected DB x cms The cause of this
discrepancy is discussed below
Although quantitative agreement is not observed qualitative agreement is ob
served Correlation functions were measured for dierent reduced scattering coe
cients and Brownian diusion coecients for the dynamical region Fig plots the
measured correlation functions for dierent s compared with theory Three dierent
concentrations of m diameter polystyrene microspheres where used to obtain
reduced scattering coecients of and cm for the dynamical region The
rest of the system is the same as the previous experiment see g Using the
Brownian diusion coecient as a free parameter to t the theory to experiment
good agreement was obtained In all cases the Brownian diusion coecient had to
be reduced by a factor of For m diameter polystyrene microspheres the
expectedDB is x cms For s and cm the ts for DB where
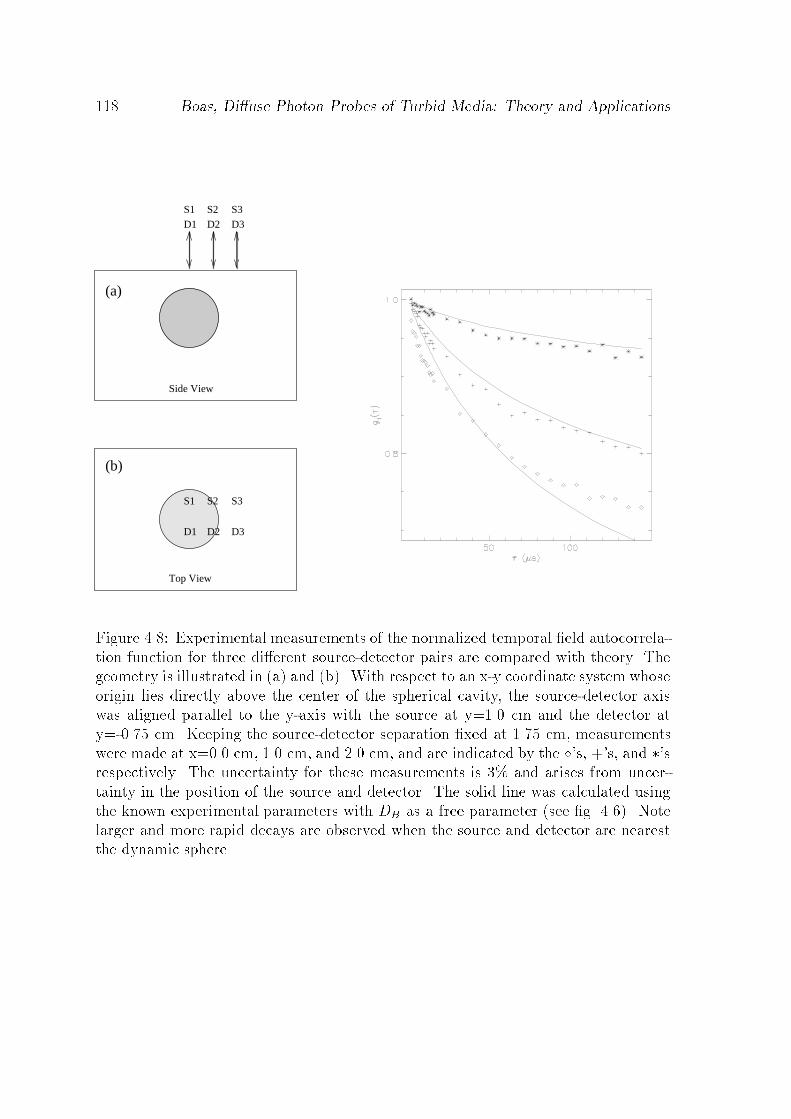
Boas Diuse Photon Probes of Turbid Media Theory and Applications
(b)
(a)
Side View
S1 S2 S3
Top View
D3D2D1
D3
S3
D2
S2
D1
S1
Figure Experimental measurements of the normalized temporal eld autocorrelation function for three dierent sourcedetector pairs are compared with theory Thegeometry is illustrated in a and b With respect to an xy coordinate system whoseorigin lies directly above the center of the spherical cavity the sourcedetector axiswas aligned parallel to the yaxis with the source at y cm and the detector aty cm Keeping the sourcedetector separation xed at cm measurementswere made at x cm cm and cm and are indicated by the s s and srespectively The uncertainty for these measurements is and arises from uncertainty in the position of the source and detector The solid line was calculated usingthe known experimental parameters with DB as a free parameter see g Notelarger and more rapid decays are observed when the source and detector are nearestthe dynamic sphere
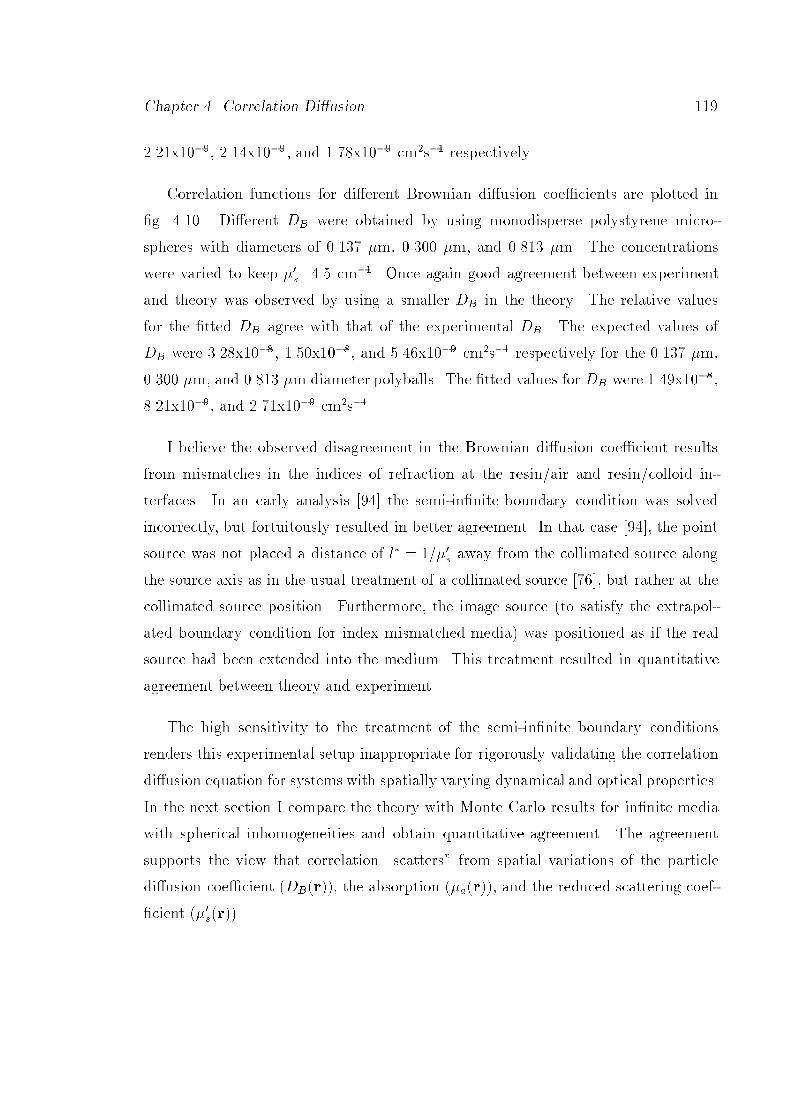
Chapter Correlation Diusion
x x and x cms respectively
Correlation functions for dierent Brownian diusion coecients are plotted in
g Dierent DB were obtained by using monodisperse polystyrene micro
spheres with diameters of m m and m The concentrations
were varied to keep s cm Once again good agreement between experiment
and theory was observed by using a smaller DB in the theory The relative values
for the tted DB agree with that of the experimental DB The expected values of
DB were x x and x cms respectively for the m
m and m diameter polyballs The tted values for DB were x
x and x cms
I believe the observed disagreement in the Brownian diusion coecient results
from mismatches in the indices of refraction at the resinair and resincolloid in
terfaces In an early analysis the semiinnite boundary condition was solved
incorrectly but fortuitously resulted in better agreement In that case the point
source was not placed a distance of l s away from the collimated source along
the source axis as in the usual treatment of a collimated source but rather at the
collimated source position Furthermore the image source to satisfy the extrapol
ated boundary condition for index mismatched media was positioned as if the real
source had been extended into the medium This treatment resulted in quantitative
agreement between theory and experiment
The high sensitivity to the treatment of the semiinnite boundary conditions
renders this experimental setup inappropriate for rigorously validating the correlation
diusion equation for systems with spatially varying dynamical and optical properties
In the next section I compare the theory with Monte Carlo results for innite media
with spherical inhomogeneities and obtain quantitative agreement The agreement
supports the view that correlation scatters from spatial variations of the particle
diusion coecient DBr the absorption ar and the reduced scattering coef
cient sr
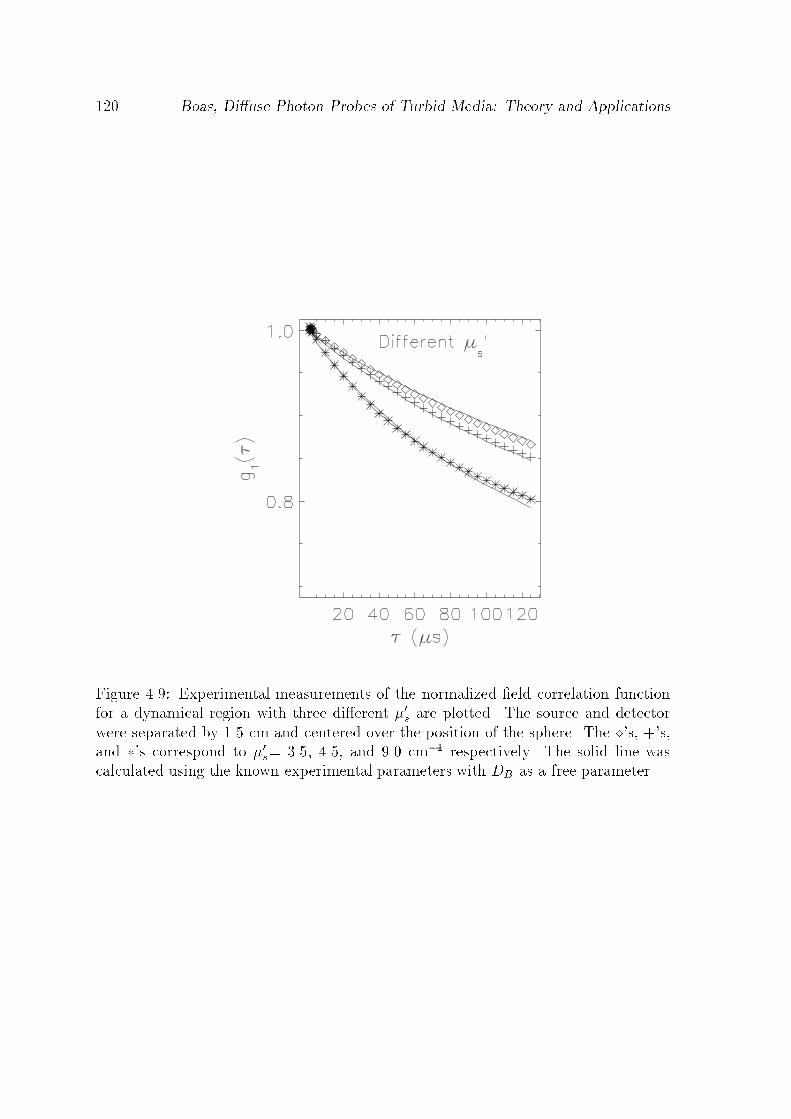
Boas Diuse Photon Probes of Turbid Media Theory and Applications
Figure Experimental measurements of the normalized eld correlation functionfor a dynamical region with three dierent s are plotted The source and detectorwere separated by cm and centered over the position of the sphere The s sand s correspond to s and cm respectively The solid line wascalculated using the known experimental parameters with DB as a free parameter

Chapter Correlation Diusion
Figure Experimental measurements of the normalized eld correlation functionfor a dynamical region with three dierent DB are plotted The source and detectorwere separated by cm and centered over the position of the sphere The s sand s correspond to a and m respectively The solid line wascalculated using the known experimental parameters with DB as a free parameter
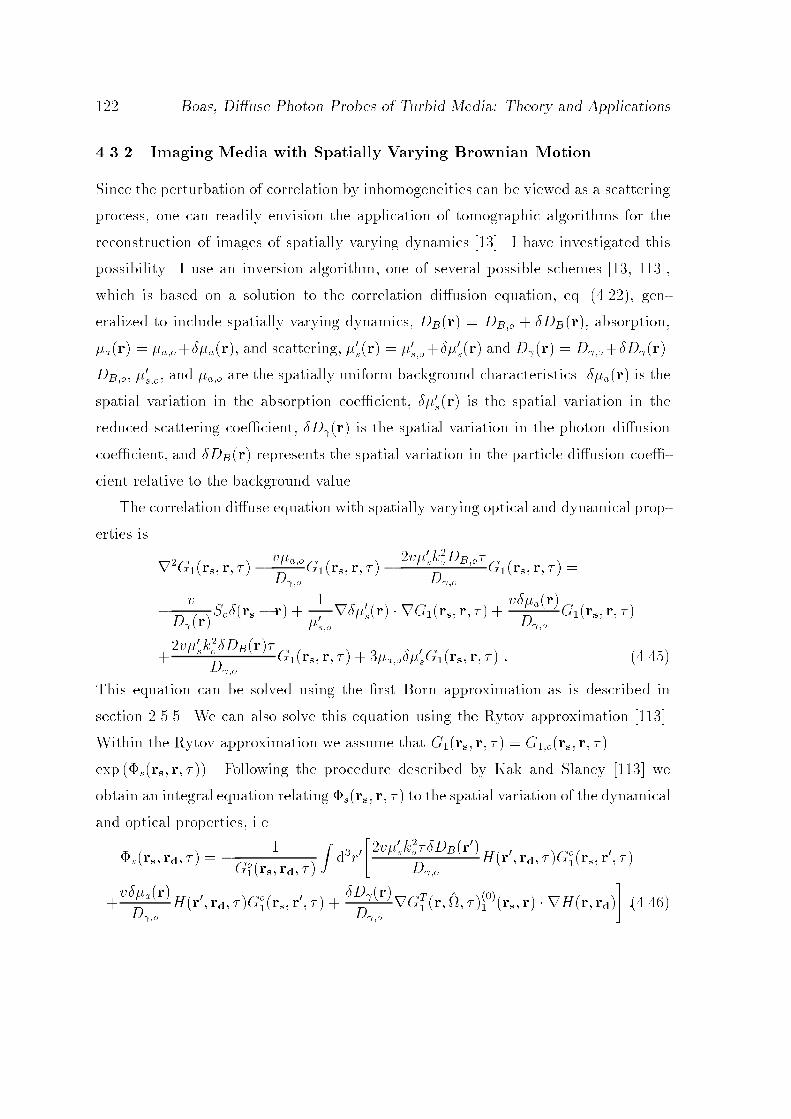
Boas Diuse Photon Probes of Turbid Media Theory and Applications
Imaging Media with Spatially Varying Brownian Motion
Since the perturbation of correlation by inhomogeneities can be viewed as a scattering
process one can readily envision the application of tomographic algorithms for the
reconstruction of images of spatially varying dynamics I have investigated this
possibility I use an inversion algorithm one of several possible schemes
which is based on a solution to the correlation diusion equation eq gen
eralized to include spatially varying dynamics DBr DBo DBr absorption
ar aoar and scattering sr sosr and Dr DoDr
DBo so and ao are the spatially uniform background characteristics ar is the
spatial variation in the absorption coecient sr is the spatial variation in the
reduced scattering coecient Dr is the spatial variation in the photon diusion
coecient and DBr represents the spatial variation in the particle diusion coe
cient relative to the background value
The correlation diuse equation with spatially varying optical and dynamical prop
erties is
rGrs r vaoDo
Grs r vskoDBo
Do
Grs r
v
DrSors r
sorsr rGrs r
var
DoGrs r
vsk
oDBr
DoGrs r ao
sGrs r
This equation can be solved using the rst Born approximation as is described in
section We can also solve this equation using the Rytov approximation
Within the Rytov approximation we assume that Grs r Gors r
exp !srs r Following the procedure described by Kak and Slaney we
obtain an integral equation relating !srs r to the spatial variation of the dynamical
and optical properties ie
!srs rd
Gors rd
Zdr
vsk
oDBr
DoHr rd G
ors r
var
Do
Hr rd Gors r
Dr
Do
rGT r
rs r rHr rd
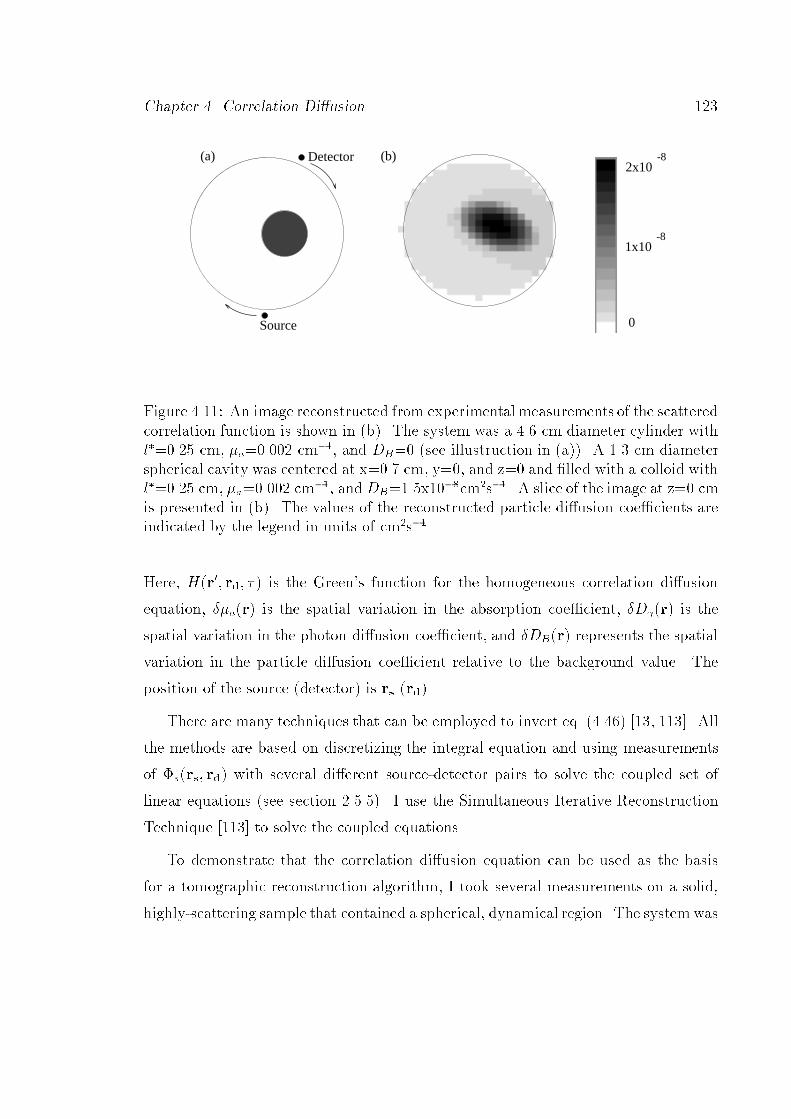
Chapter Correlation Diusion
-82x10
Detector
Source
(b)(a)
0
-81x10
Figure An image reconstructed from experimentalmeasurements of the scatteredcorrelation function is shown in b The system was a cm diameter cylinder withl cm a cm and DB see illustruction in a A cm diameterspherical cavity was centered at x cm y and z and lled with a colloid withl cm a cm andDBxcms A slice of the image at z cmis presented in b The values of the reconstructed particle diusion coecients areindicated by the legend in units of cms
Here Hr rd is the Greens function for the homogeneous correlation diusion
equation ar is the spatial variation in the absorption coecient Dr is the
spatial variation in the photon diusion coecient and DBr represents the spatial
variation in the particle diusion coecient relative to the background value The
position of the source detector is rs rd
There are many techniques that can be employed to invert eq All
the methods are based on discretizing the integral equation and using measurements
of !srs rd with several dierent sourcedetector pairs to solve the coupled set of
linear equations see section I use the Simultaneous Iterative Reconstruction
Technique to solve the coupled equations
To demonstrate that the correlation diusion equation can be used as the basis
for a tomographic reconstruction algorithm I took several measurements on a solid
highlyscattering sample that contained a spherical dynamical region The system was

Boas Diuse Photon Probes of Turbid Media Theory and Applications
a solid cylinder of TiO suspended in resin The cylinder was homogeneous except
for a cm diameter spherical cavity which was lled with an aqueous suspension of
m polystyrene balls DB x cms and centered at z the zaxis is
the axis of the cylinder The optical properties of the colloid matched that of the solid
so that we are only imaging variations in the dynamical properties Measurements
were made every at the surface of the cylinder for z and cm with source
detector angular separations of and and correlation times of
and s Except where the measurements were made a highly reective
coating was applied to the surface so that the cylindrical medium could be treated as
innite This approximation has been discussed by Haskell et al and its validity
permits us to obtain accurate reconstructions of the dynamical properties
The image of DBr in g was reconstructed from measurements of the
scattered correlation function !srs rd using iterations of the Simultaneous
Iterative Reconstruction Technique The z slice of the image is shown in
g b From this image the center in the xy plane of the dynamic region and
the magnitude of the particle diusion coecient are determined The center of the
object in the image is within mm of the actual center of the dynamic sphere This
discrepancy scales with the uncertainty in the position of the source and detector
The sphere diameter cm and particle diusion coecient x cms
obtained from the imaging procedure also agree reasonably well with experimentally
known parameters cm and x cms
Validity of Diusion Equation for Media with Spatially Varying
Flow Properties
The experiments described thus far demonstrate the diusion and scattering of correl
ation in turbid samples where the dynamics are governed by Brownian motion The
correlation diusion equation can be modied to account for other dynamical pro
cesses In the cases of random ow and shear ow the correlation diusion equation

Chapter Correlation Diusion
becomes
DrvavsDBk
o
vs
DV
Eko
vs "
effko
Gr vSr
The fourth and fth terms on the lefthand side of eq arise from random and
shear ows respectively hV i is the second moment of the particle speed distribu
tion assuming the velocity distribution is isotropic and Gaussian and "eff
is the eective shear rate Notice that the dynamical absorption for ow in
eq increases as compared to the increase for Brownian motion because
particles in ow elds travel ballistically# also DB hV i and "eff appear separately
because the dierent dynamical processes are uncorrelated The form of the dynam
ical absorption term for random ow is related to that for Brownian motion Both
are of the form v
s hr i where hr i is the mean square displacement of
a scattering particle For Brownian motion hr i DB and for random ow
hr i hV i The derivation of the dynamical absorption term for shear
ow is more complex and the reader is referred to Wu et al for a complete
discussion
Flow in turbid media is an interesting problem that has received some attention
In these measurements experimenters typically determine a correlation function that
may be a compound of many decays representing a weighted average of ow within the
sample For example Bonner and Nossal have developed an approach for measuring
random blood ow in homogeneous tissue Wu et al have applied DWS to
study uniform shear ow and Bicout and coworkers have applied DWS to
study inhomogeneous ow and turbulence In all cases a priori
knowledge of the ow is used in the analyses The application of correlation diusion
imaging will further clarify information about heterogeneous ows in turbid media
I conducted experiments to examine the correlation signal arising from a solid
highly scattering medium with a single cylindrical vein containing a highly scattering
liquid under Poiseuille ow The experimental system is depicted in g In this
experiment the correlation function is measured in remission from a semiinnite
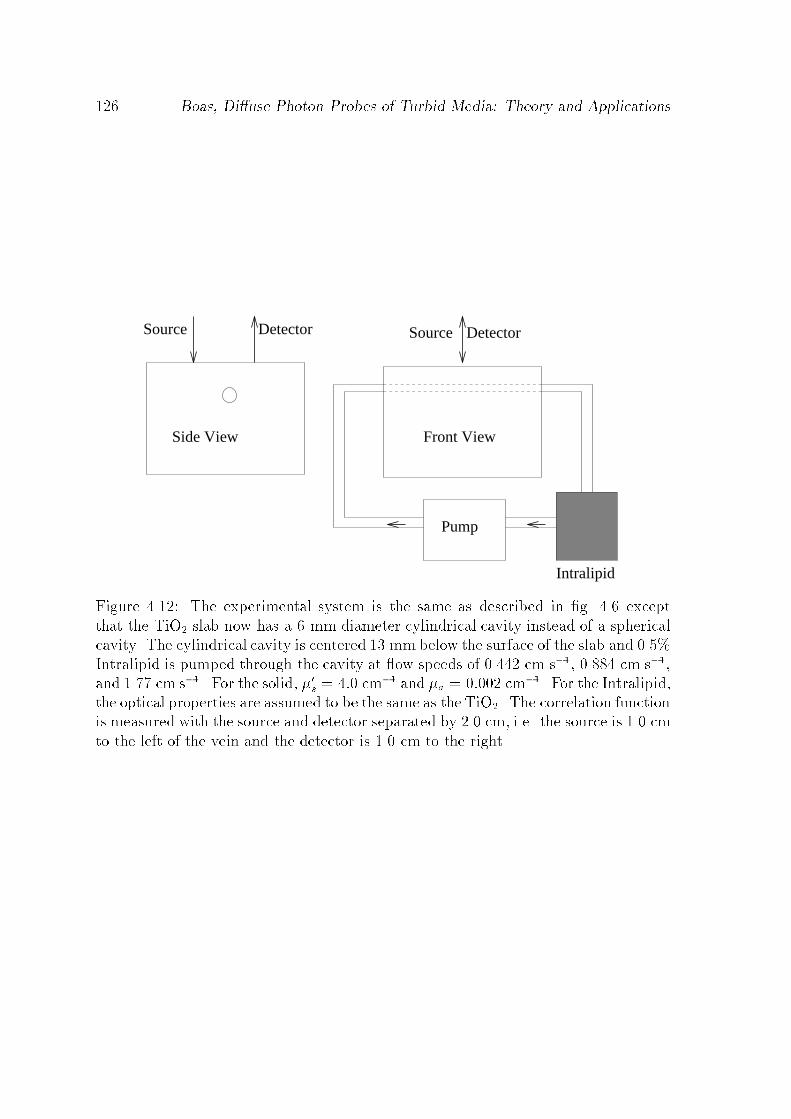
Boas Diuse Photon Probes of Turbid Media Theory and Applications
Pump
Intralipid
Source DetectorSource Detector
Side View Front View
Figure The experimental system is the same as described in g exceptthat the TiO slab now has a mm diameter cylindrical cavity instead of a sphericalcavity The cylindrical cavity is centered mm below the surface of the slab and Intralipid is pumped through the cavity at ow speeds of cm s cm sand cm s For the solid s cm and a cm For the Intralipidthe optical properties are assumed to be the same as the TiO The correlation functionis measured with the source and detector separated by cm ie the source is cmto the left of the vein and the detector is cm to the right
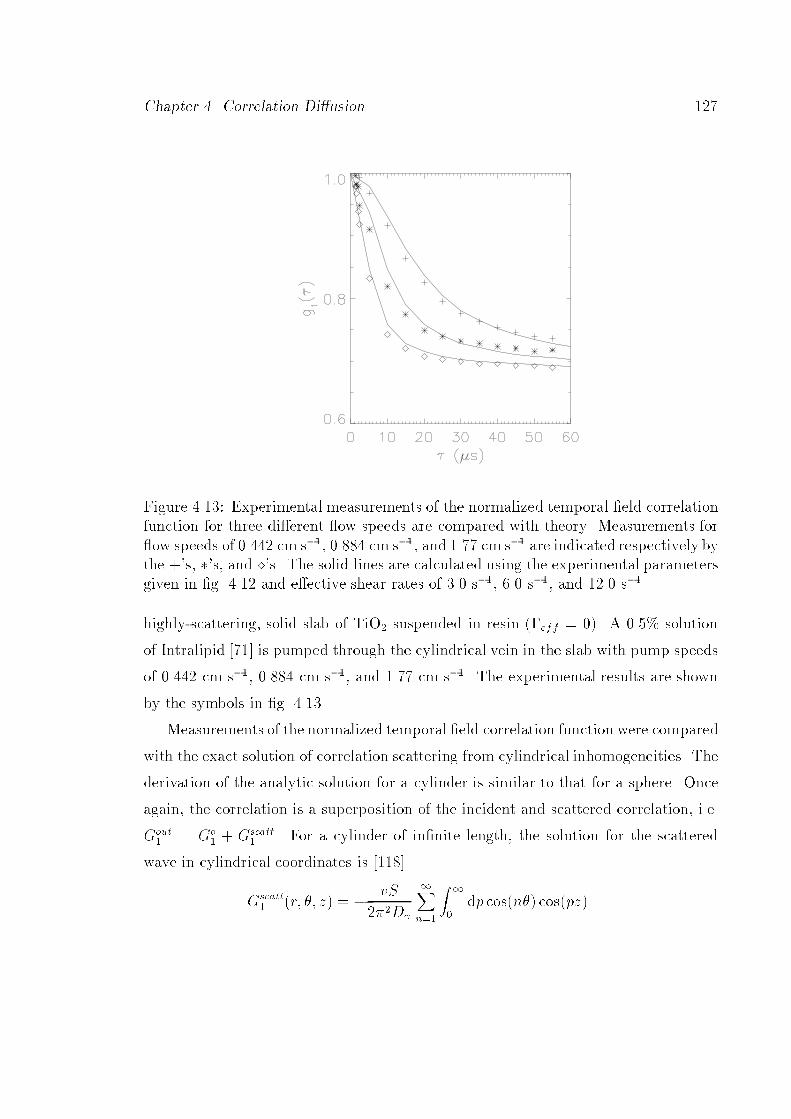
Chapter Correlation Diusion
Figure Experimental measurements of the normalized temporal eld correlationfunction for three dierent ow speeds are compared with theory Measurements forow speeds of cm s cm s and cm s are indicated respectively bythe s s and s The solid lines are calculated using the experimental parametersgiven in g and eective shear rates of s s and s
highlyscattering solid slab of TiO suspended in resin "eff A solution
of Intralipid is pumped through the cylindrical vein in the slab with pump speeds
of cm s cm s and cm s The experimental results are shown
by the symbols in g
Measurements of the normalized temporal eld correlation function were compared
with the exact solution of correlation scattering from cylindrical inhomogeneities The
derivation of the analytic solution for a cylinder is similar to that for a sphere Once
again the correlation is a superposition of the incident and scattered correlation ie
Gout Go
Gscatt For a cylinder of innite length the solution for the scattered
wave in cylindrical coordinates is
Gscatt r z vS
D
Xn
Z
dp cosn cospz

Boas Diuse Photon Probes of Turbid Media Theory and Applications
Knqp Kout rKn
qp Kout rs
Dout xI nxInyDin
yInxIny
Dout xKnxInyDin
yKnxIny
where In and Kn are modied Bessel functions x qp Kout a
y qp K in a and a is the radius of the cylinder The solution has been
simplied by taking the zaxis as the axis of the cylinder and assuming that the source
is at z and
The comparison between experiment symbols and theory solid lines shown
in g indicates a good agreement The parameters used in the calculation
except for "eff were the known parameters The eective shear rate "eff was
determined by tting the analytic solution to the data with the constraint that "eff
had to scale linearly with the ow speed The best t to the data indicates that "eff
is approximately cm times the ow speed Since the shear rate is given by the
change in speed per unit length in the direction perpendicular to the ow one might
expect that the eective shear rate would be the ow speed divided by the radius of
the vein This simple calculation gives an eective shear rate that is a factor of two
smaller than the measured "eff This dierence is not yet understood but could result
from the mismatches in optical indices of refraction and sensitivity to the semiinnite
boundary condition
Monte Carlo Simulations
This section presents the results of various Monte Carlo simulations of correlation
diusion I used the results from Monte Carlo simulations to check the accuracy of
the correlation diusion equation when the accuracy of my experimental results was
questionable or I did not have the experimental data In many cases these simulations
provide a signaltonoise ratio that is dicult to achieve in the laboratory and therefore
permit a more accurate test of the validity of the correlation diusion theory
I rst present simulation results for an innite homogeneous system compared
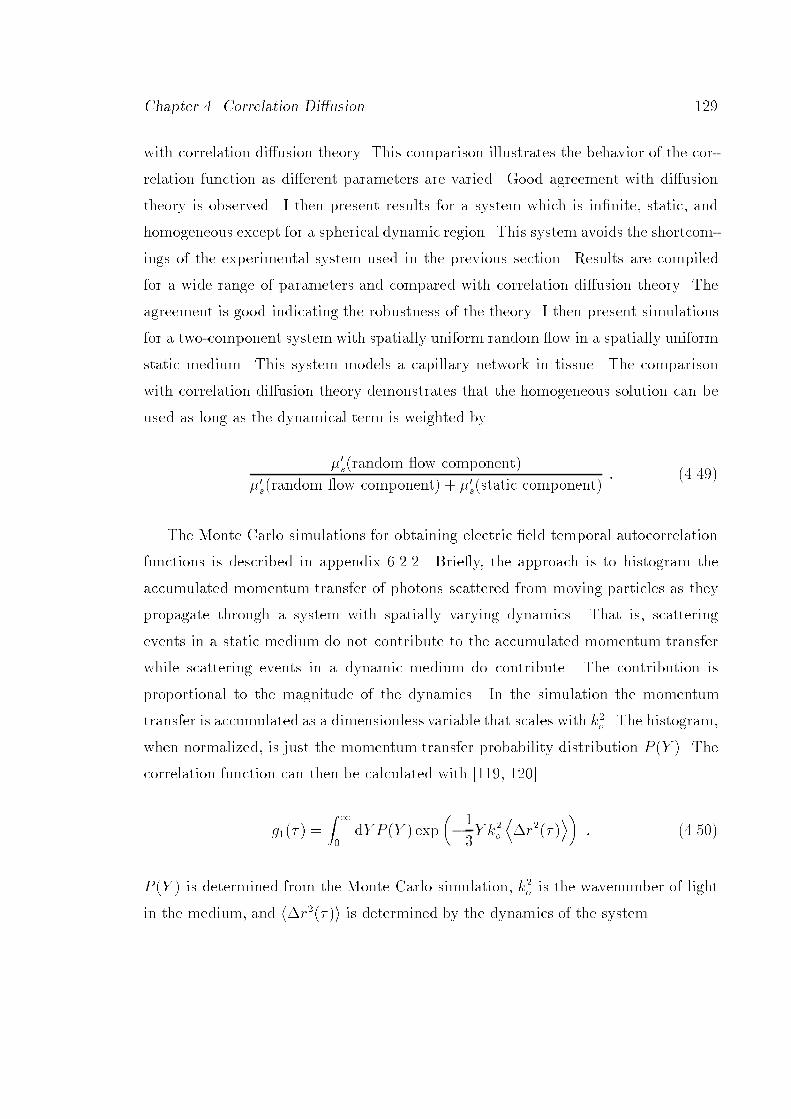
Chapter Correlation Diusion
with correlation diusion theory This comparison illustrates the behavior of the cor
relation function as dierent parameters are varied Good agreement with diusion
theory is observed I then present results for a system which is innite static and
homogeneous except for a spherical dynamic region This system avoids the shortcom
ings of the experimental system used in the previous section Results are compiled
for a wide range of parameters and compared with correlation diusion theory The
agreement is good indicating the robustness of the theory I then present simulations
for a twocomponent system with spatially uniform random ow in a spatially uniform
static medium This system models a capillary network in tissue The comparison
with correlation diusion theory demonstrates that the homogeneous solution can be
used as long as the dynamical term is weighted by
srandom ow component
srandom ow component sstatic component
The Monte Carlo simulations for obtaining electric eld temporal autocorrelation
functions is described in appendix Briey the approach is to histogram the
accumulated momentum transfer of photons scattered from moving particles as they
propagate through a system with spatially varying dynamics That is scattering
events in a static medium do not contribute to the accumulated momentum transfer
while scattering events in a dynamic medium do contribute The contribution is
proportional to the magnitude of the dynamics In the simulation the momentum
transfer is accumulated as a dimensionless variable that scales with ko The histogram
when normalized is just the momentum transfer probability distribution P Y The
correlation function can then be calculated with
g Z
dY P Y exp
Y ko
Dr
E
P Y is determined from the Monte Carlo simulation ko is the wavenumber of light
in the medium and hr i is determined by the dynamics of the system

Boas Diuse Photon Probes of Turbid Media Theory and Applications
Figure Monte Carlo simulations for correlation diusion in a homogeneous medium are compared with theory for dierent a sourcedetector separations babsorption coecients and c reduced scattering coecients Unless otherwisestated the sourcedetector separation is cm s cm a cm andDB cms The Monte Carlo results are given by the symbols The solidlines are calculated from diusion theory

Chapter Correlation Diusion
Homogeneous Media with Brownian Motion
Comparisons of eq with experimental measurements of absorptionfree media
has been made by Pine et al Good agreement is found except in regimes where
the photon diusion approximation breaks down Here I compare solutions of the
correlation diusion equation with photon absorption to Monte Carlo simulations In
this case the solution is
Gr S exp
qas s DBko jr rsj
D jr rsj
At early correlation times the behavior is governed by photon absorption and at later
times it is governed by dynamical processes The transition time is given by c
asDBko At shorter the correlation function will plateau while at longer it
will decay exponentially as the squareroot of with the same rate as if there were no
photon absorption
Fig a plots the Monte Carlo results for dierent sourcedetector separations
The optical and dynamical properties are held constant at s cm a
cm and DB x cms The decay rate of g increases linearly with
as expected Next we see the plateau at early and that the transition time is
independent of Finally g calculated using correlation diusion theory for the
dierent sourcedetector separations is given by the solid lines In all cases good
agreement is observed
Results for varying a and s while keeping the sourcedetector separation xed are
given in g b and g c respectively In g b we see that c increases as
the absorption coecient is increased while the decay rate at c is not changed In
g c we see that increasing the reduced scattering coecient increases the decay
rate of the correlation function and decreases c In all cases good agreement with
diusion theory is observed
Fig plots the same correlation functions plotted in g for dierent source
detector separations but the abscissa is extended from s to s At these
longer correlation times the correlation diusion equation is expected to break down
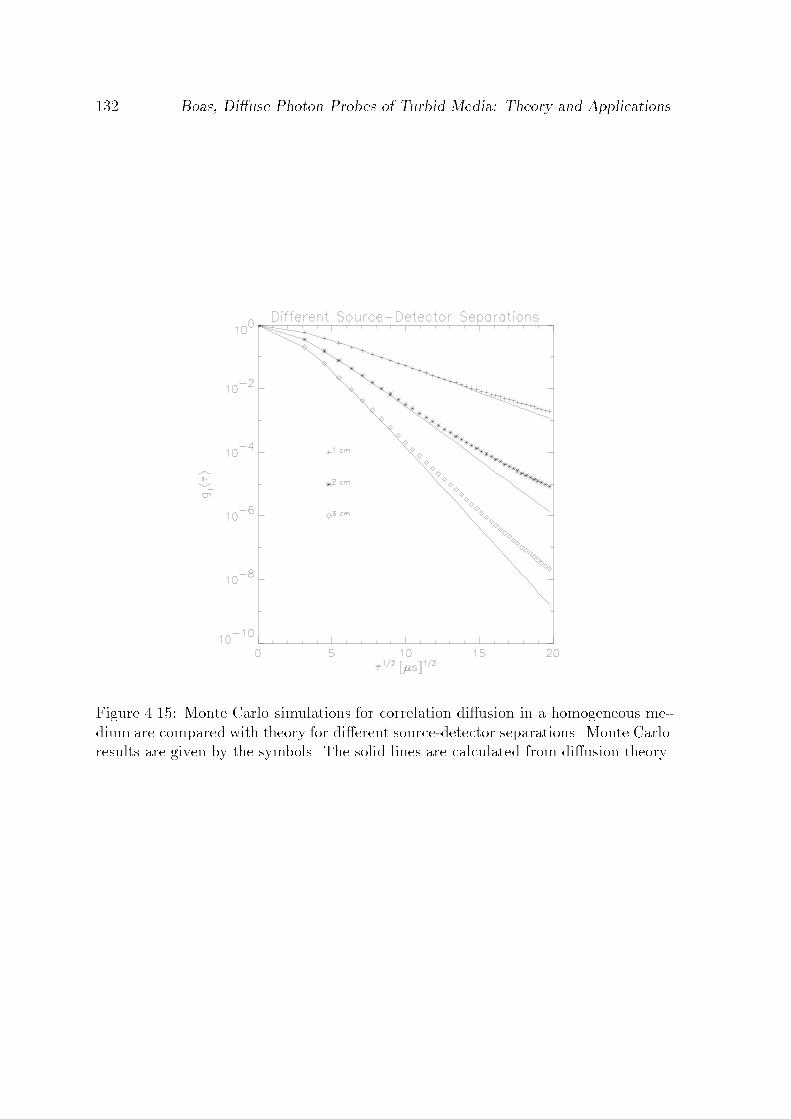
Boas Diuse Photon Probes of Turbid Media Theory and Applications
Figure Monte Carlo simulations for correlation diusion in a homogeneous medium are compared with theory for dierent sourcedetector separations Monte Carloresults are given by the symbols The solid lines are calculated from diusion theory
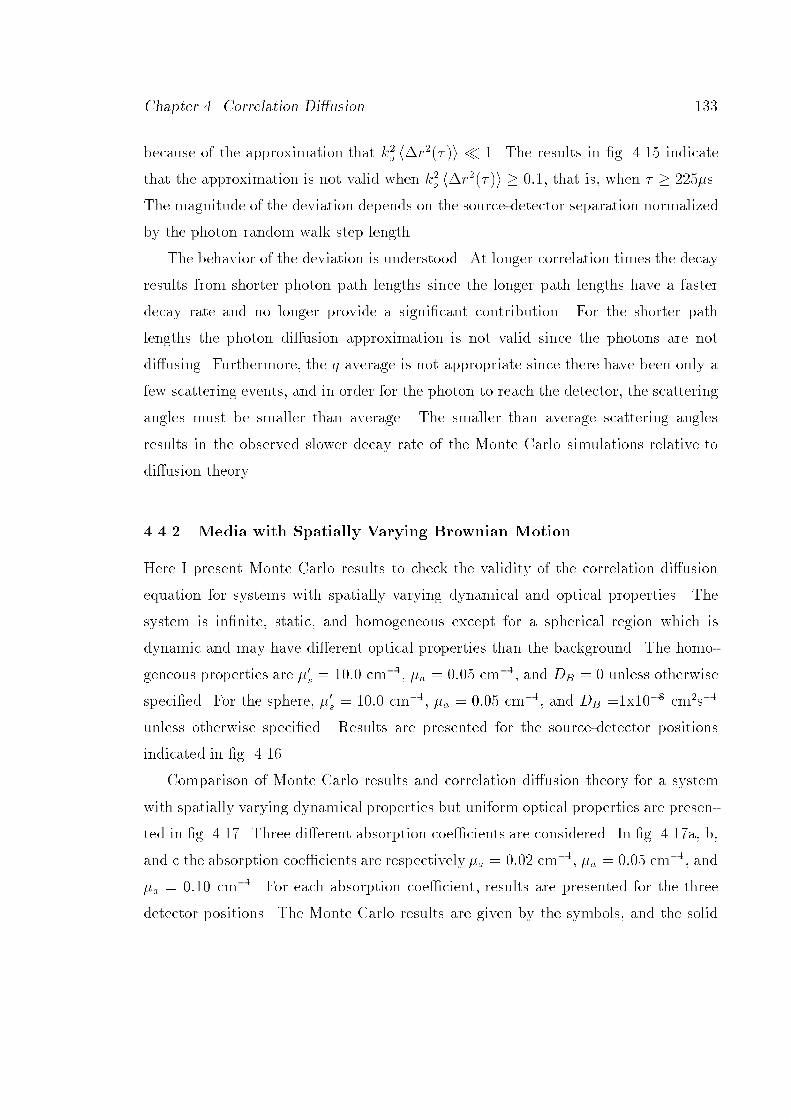
Chapter Correlation Diusion
because of the approximation that ko hr i The results in g indicate
that the approximation is not valid when ko hr i that is when s
The magnitude of the deviation depends on the sourcedetector separation normalized
by the photon random walk step length
The behavior of the deviation is understood At longer correlation times the decay
results from shorter photon path lengths since the longer path lengths have a faster
decay rate and no longer provide a signicant contribution For the shorter path
lengths the photon diusion approximation is not valid since the photons are not
diusing Furthermore the q average is not appropriate since there have been only a
few scattering events and in order for the photon to reach the detector the scattering
angles must be smaller than average The smaller than average scattering angles
results in the observed slower decay rate of the Monte Carlo simulations relative to
diusion theory
Media with Spatially Varying Brownian Motion
Here I present Monte Carlo results to check the validity of the correlation diusion
equation for systems with spatially varying dynamical and optical properties The
system is innite static and homogeneous except for a spherical region which is
dynamic and may have dierent optical properties than the background The homo
geneous properties are s cm a cm and DB unless otherwise
specied For the sphere s cm a cm and DB x cms
unless otherwise specied Results are presented for the sourcedetector positions
indicated in g
Comparison of Monte Carlo results and correlation diusion theory for a system
with spatially varying dynamical properties but uniform optical properties are presen
ted in g Three dierent absorption coecients are considered In g a b
and c the absorption coecients are respectively a cm a cm and
a cm For each absorption coecient results are presented for the three
detector positions The Monte Carlo results are given by the symbols and the solid

Boas Diuse Photon Probes of Turbid Media Theory and Applications
1 cm 1 cm 1 cm
1 cm
Sz
Dz
Figure An isotropic point source is positioned Sz cm from the center of a spherical inhomogeneity The sphere has a diameter of cm Detectors are positionedDz cm away along the zaxis and displaced o of the zaxis at and cm
lines indicate the prediction using correlation diusion theory The agreement is fairly
good Similar results are found for other Brownian diusion coecients# actually the
results are the same except that scales inversely with DB
The small discrepancies are most likely due to a signicant fraction of the uc
tuating photons having scattered from the dynamical region only a few times before
detection By uctuating photons I mean those photons which have sampled the dy
namic region as opposed to the static photons which have not seen the dynamic region
The distribution of the total momentum transfer with moving particles for the photons
detected at cm is plotted in g for a cm The distribution has
a discontinuity at ko which is the maximummomentum transfer per scattering event
The diusion approximation is NOT valid in the regime of a few scattering events
The contribution to P Y for Y thus leads to the observed discrepancy This
was checked by noting a correlation between a reduction in the discrepancy with a
reduction in the discontinuity for results which are not presented
In g I present results for a sphere with dierent a and DB than the back
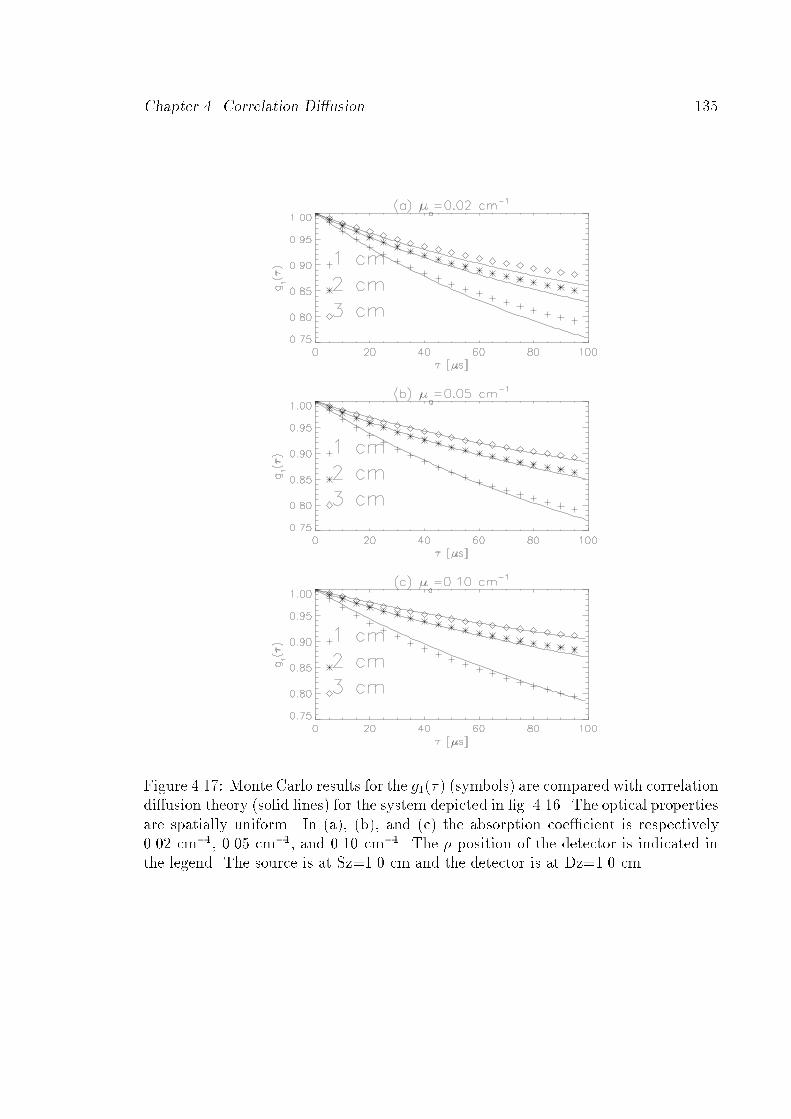
Chapter Correlation Diusion
Figure Monte Carlo results for the g symbols are compared with correlationdiusion theory solid lines for the system depicted in g The optical propertiesare spatially uniform In a b and c the absorption coecient is respectively cm cm and cm The position of the detector is indicated inthe legend The source is at Sz cm and the detector is at Dz cm

Boas Diuse Photon Probes of Turbid Media Theory and Applications
Figure Distribution of the total momentum transfer frommoving scatterers Thegeometry of the system is depicted in g

Chapter Correlation Diusion
ground For the background DB while for the sphere DBx For the
background a cm For the results presented in g a b and c the
object absorption coecient is respectively a cm a cm and
a cm When the absorption coecient of the object is the same as the
background then the agreement betweenMonte Carlo and correlation diusion is good
However the agreement is not as good when the absorption coecient of the object
is dierent than the background This discrepancy results from the breakdown of
the photon diusion equation for systems with spatially varying optical properties
As observed in g and g there are many photons which only have a few
scattering events in the sphere The diusion approximation overestimates the path
lengths of these photons in the object Thus when the absorption coecient of the
object is larger than the background diusion theory overestimates the number of
absorbed photons fewer uctuating photons reach the detector and the correlation
function does not decay as much For objects with smaller absorption coecients
diusion theory overestimates the amount of decay in the correlation function These
are the trends observed in g
Fig presents results for a sphere with dierent s and DB than the back
ground For the background DB while for the sphere DBx For the
background s cm For the results presented in g a b and c the
object reduced scattering coecient is respectively s cm s cm
and s cm When the reduced scattering coecient of the object is the same
as the background then the agreement between Monte Carlo and correlation diusion
is good However the agreement is not as good when the reduced scattering coecient
of the object is dierent than the background This discrepancy also results from the
breakdown of the photon diusion equation for systems with spatially varying optical
properties
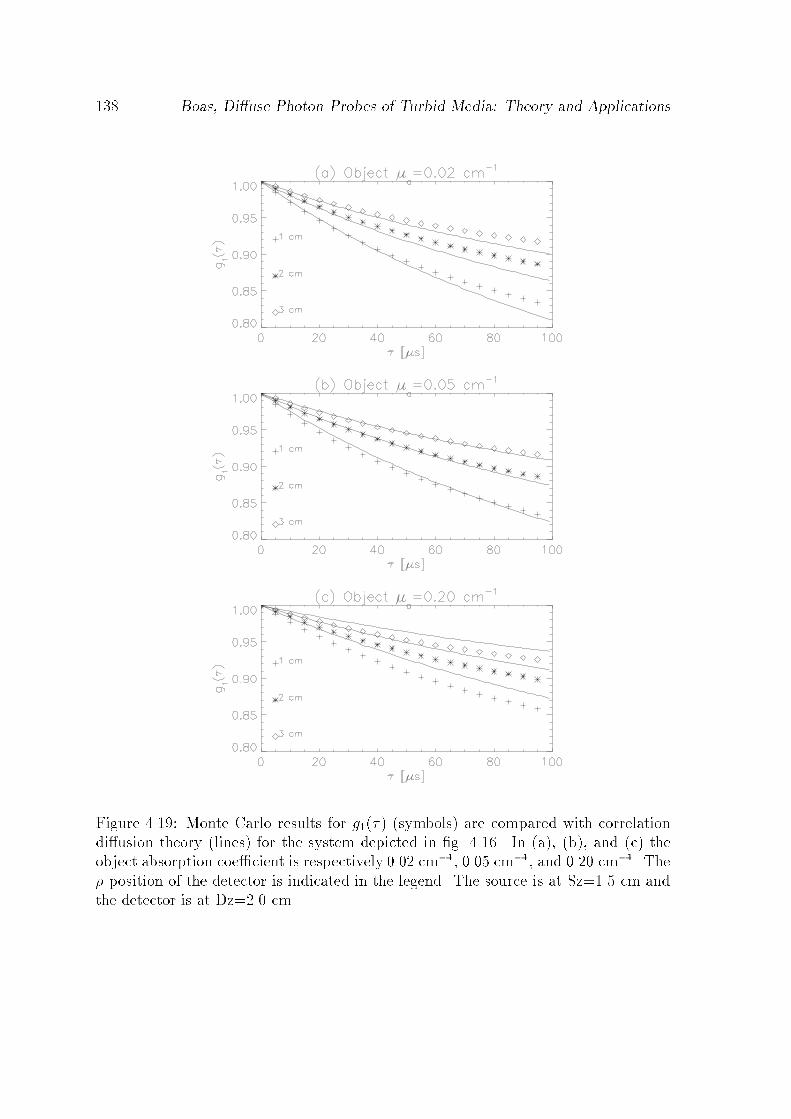
Boas Diuse Photon Probes of Turbid Media Theory and Applications
Figure Monte Carlo results for g symbols are compared with correlationdiusion theory lines for the system depicted in g In a b and c theobject absorption coecient is respectively cm cm and cm The position of the detector is indicated in the legend The source is at Sz cm andthe detector is at Dz cm
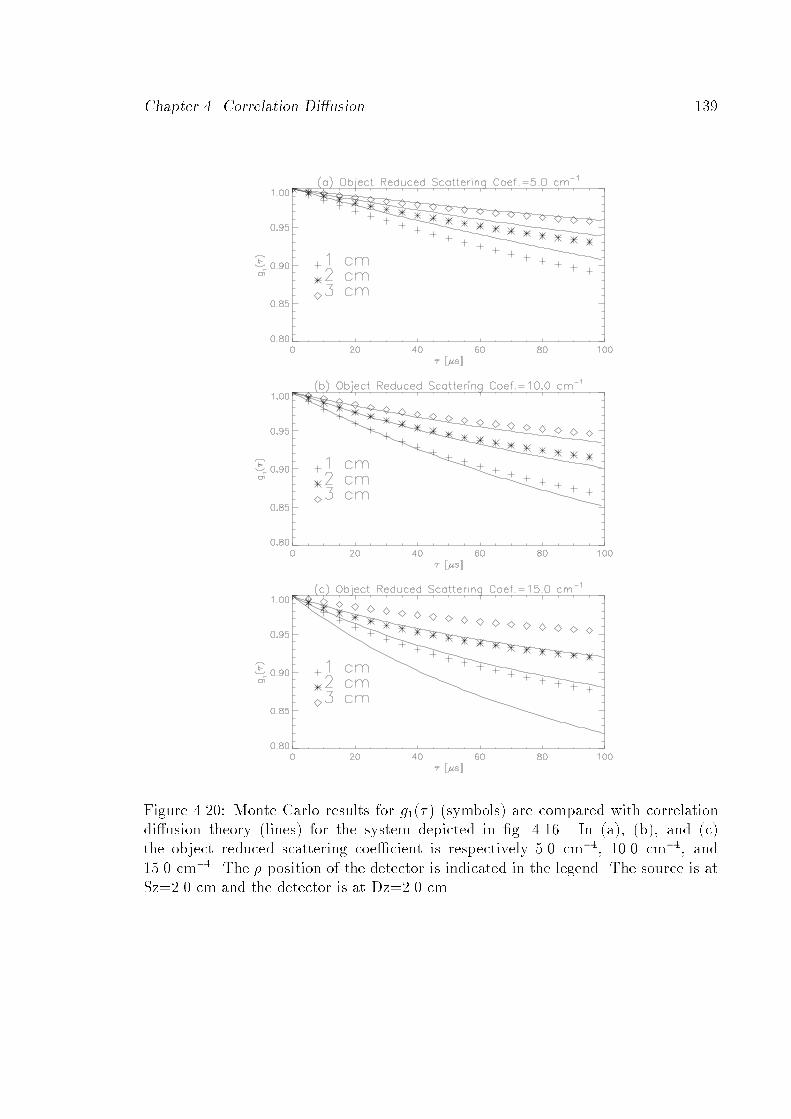
Chapter Correlation Diusion
Figure Monte Carlo results for g symbols are compared with correlationdiusion theory lines for the system depicted in g In a b and cthe object reduced scattering coecient is respectively cm cm and cm The position of the detector is indicated in the legend The source is atSz cm and the detector is at Dz cm

Boas Diuse Photon Probes of Turbid Media Theory and Applications
Media with Random Flow
Tissue blood ow is a good example of a turbid medium with random ow Capillary
networks are generally randomly oriented on length scales set by the photon random
walk step length When the capillary ow is oriented as it is in muscle the photon
generally scatters times between interactions with blood such that the photons
direction is randomized between blood interactions Thus the ow is eectively ran
dom Tissue blood ow can be modeled as a two component system the static tissue
matrix and the randomly owing blood Monte Carlo results for this system are
compared to correlation diusion theory predictions
Because the system is composed of two uniformly distributed components it is
necessary to modify the correlation diusion equation to account for the volume frac
tion of blood This is done by simply weighting the dynamical absorption term by the
probability of scattering from a red blood cell ie
Dr va
Pbloodv
sk
o
DV
E Gr vSr
Pblood is the probability of scattering from a red blood cell and is given by
Pblood sblood
sblood sstatic component
The other optical parameters in eq account for the combined contribution from
the tissue matrix and the blood
A comparison of the Monte Carlo results and correlation diusion theory is presen
ted in g for Pblood The optical properties are s cm and
a cm The mean square speed of the red blood cells is hV i mms
The agreement is quite good when ko hV i indicating that the diusion the
ory can be used to quantify blood ow in particular and random ow in turbid media
in general The discrepancy observed for times greater than s arises from the
ko hV i assumption note that ko hV i s Comparisons were
made for other Pblood and in all cases good agreement was observed

Chapter Correlation Diusion
Figure Comparison of Monte Carlo simulations and correlation diusion theoryfor random ow in a static tissuelike matrix The probability of scattering from aow particle blood is

Boas Diuse Photon Probes of Turbid Media Theory and Applications
Summary
I have shown that the transport of temporal electric eld correlation through turbid
media can be modeled using a diusion equation and is thus completely analogous
to photon diusion The properties of diusing correlation are thus expected to be
similar to the properties of photon diusion presented in chapter I demonstrated
this experimentally by showing that the migration of correlation in a turbid medium
with spatially varying dynamical and optical properties can be viewed as a macro
scopic scattering of correlation waves This concept was shown in the context of
both forward and inverse problems The inverse problem otherwise known as image
reconstruction methods oers exciting possibilities for studying dynamical variations
in heterogeneous turbid media In biomedical optics for example this approach oers
a simple framework for analyzing the complex signals obtained from uid ow in the
body Two dierent biomedical applications are discussed in the next chapter

Chapter
Biomedical Applications for Correlation Diusion
Blood Flow Monitoring
Nearinfrared spectroscopy NIRS has long been used to noninvasively measure pulse
rate and blood oxygenation and recently to measure blood ow
The advantage of NIRS over laser Doppler blood owmetry LDBF to
measure blood ow is that ow in larger volumes of tissue can be monitored LDBF
can only be used to interrogate mm volumes of tissue whereas NIRS can interrogate
to cm volumes of tissue LDBF is restricted to small volumes because quantitative
information on blood ow is only available if detected photons have scattered from
moving blood cells no more than once LDBF can be used to quantify blood ow in
larger volumes if the blood volume fraction Pblood see eq is known however
the signaltonoise is generally prohibitively low for optode separations of mm or
larger The signaltonoise is limited by the maximum allowed tissue exposure to laser
light ANSI sets this maximum at W cm at nm for exposures between
and seconds NIRS is not restricted in this way since large aperature
detectors can be used to collect more diuse light However NIRS methods do make
certain assumptions about metabolic activity during blood ow measurements
After briey reviewing the NIRS and LDBF methods for measuring blood ow and
discussing their shortcomings I demonstrate the use of correlation diusion equation
as a new tool for quantifying blood ow This approach is only applicable in the

Boas Diuse Photon Probes of Turbid Media Theory and Applications
regime where there have been multiple scattering events from moving particles As
in the case of LDBF the volume fraction of blood ie Pblood must be known and
the signaltonoise is prohibitively low for optode separations mm The advantage
of using correlation diusion analysis over LDBF is that blood ow variations on
macroscopic ie mm length scales can be quantitatively modeled In this section
I demonstrate the similarity of correlation diusion to LDBF and in the next section
I address the modeling of spatially varying ow
The concept behind using light to monitor the pulse rate is quite simple For
red light nm the dominate absorber in the body is blood During a heart
beat the local blood volume increases in the vascular system thus increasing the light
absorption By monitoring uctuations in the intensity of light that diuses through
the tissue one is eectively measuring the pulse rate
Optical measurements of blood oxygen saturation is more sophisticated and relies
on spectroscopic dierences between oxy and deoxy hemoglobin The absorption
spectrum of hemoglobin is shown in g Because of the isosbestic point
at nm it is possible to measure blood volume independent of oxygenation The
oxygenation is determined by dierencing absorption measurements above and below
nm For instance the absorption coecients at nm a and nm
a are
a Hb Hb HbOHb
a Hb Hb HbOHb
where Hb is the extinction coecient of deoxyhemoglobin at nm HbOis the
extinction coecient of oxyhemoglobin at nm etc The concentrations of deoxy
and oxyhemoglobin are respectively Hb and HbO The oxygen saturation is given
by
Y HbO
Hb HbO
Solving eq and eq for Hb and HbO we nd that the oxygen saturation
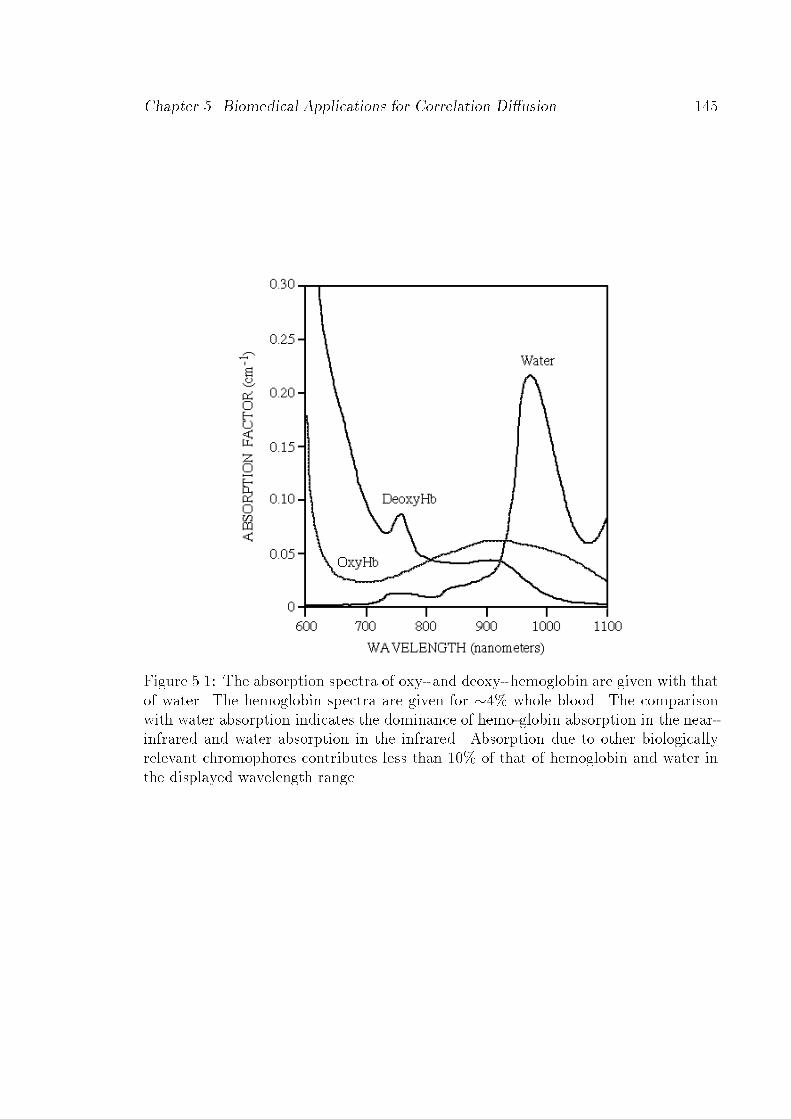
Chapter Biomedical Applications for Correlation Diusion
Figure The absorption spectra of oxy and deoxy hemoglobin are given with thatof water The hemoglobin spectra are given for whole blood The comparisonwith water absorption indicates the dominance of hemoglobin absorption in the nearinfrared and water absorption in the infrared Absorption due to other biologicallyrelevant chromophores contributes less than of that of hemoglobin and water inthe displayed wavelength range
Boas Diuse Photon Probes of Turbid Media Theory and Applications
of hemoglobin can be related to a and a ie
Y a Hb a Hb
a Hb a Hb
where Hb HbO Hb This method for determining blood oxygen saturation is
valid when oxy and deoxyhemoglobin are the dominant absorbers If the absorption
by other chromophores is important then the concentration of those other chromo
phores must also be considered
NIRS measurements of blood ow derive from Ficks principle and use changes
in oxyhemoglobin concentration as an intravascular tracer Ficks principle
states that the rate of accumulation of a tracer is equal to the dierence in the rate of
arrival and rate of departure of the tracer If the tracer is oxyhemoglobin then Ficks
principle is
tHbO FHb
hHbO HbO
i
where HbO is the concentration of oxyhemoglobin FHb is the ow of hemoglobin
in units of per second HbO is the concentration of oxyhemoglobin arriving and
HbO is the concentration departing If a sudden change in the arterial oxygen
saturation occurs the measurement is made before oxygenation change is observed in
the venous eux ie HbO and during the course of the measurement there
is no change in ow then the hemoglobin ow can be found from
FHb SaOtR t
SaOt dt
SaOt is the total change in arterial blood oxygenation saturation at time t relative
to a baseline measurement at t before the oxygen tracer is introduced This
quantity can be measured continuously using NIRS assuming the venous oxygenation
is constant Sudden changes in arterial oxygenation can be induced by changing
the oxygennitrogen mixture delivered to the subject through a ventilator and thus
eq suggests a straightforward method to measure arterial blood ow using NIRS
This method has been used to measure arterial blood ow in the forearm and
in the brain The accuracy of the method has been checked by simultaneous

Chapter Biomedical Applications for Correlation Diusion
plethysmographic measurements Plethysmography is the determination of blood
ow by measuring the volume increase in an organ during venous occlusion This NIR
method has been fairly successful in wellcontrolled situations With the development
of diusing wave optical tomography it may even permit tomographic imaging of
ow
However the method does have shortcomings which prevent general applicability
First this approach requires the subject to control hisher respiration either volun
tarily or involuntarily through a respirator so that the oxyhemoglobin tracer can be
introduced Second the metabolic activity must be stable so that measured oxygen
saturation changes can be ascribed to tracer accumulation These two restrictions
limit the conditions under which blood ow can be measured Although generally
ideal for bedside monitoring ow cannot be measured during subject activity such
as exercise which may be required for the diagnosis of dierent vascularrelated dis
eases Furthermore questions have been raised as to whether blood ow is perturbed
by the varying blood oxygenation Finally independent measurements of ow and oxy
genation cannot be correlated to obtain additional physiological information because
of the required control of the oxygenation
Laser Doppler blood owmetry provides a dierent approach with dierent limit
ations In laser Doppler blood owmetry the Doppler shift of light that has scattered
from moving particles is used to derive information about blood ow This method
does not place any restrictions on the subject Therefore measurements can be made
under any conditions With LDBF laser light is directed to the tissue through which
it scatters ocassionally scattering from a moving red blood cell It then exits the tis
sue and is detected by a photodetector The beating of Dopplershifted photons with
other shifted and unshifted photons results in a uctuating intensity at the detector
The power spectrum or temporal autocorrelation function of these uctuations can be
used to determine the ow
The tissue matrix is static relative to the red blood cells and thus does not signic
antly contribute to any Doppler shift of the light frequency The blood volume fraction

Boas Diuse Photon Probes of Turbid Media Theory and Applications
is generally smaller than excluding muscles liver and other highly perfused or
gans which can have a blood volume fraction of up to Thus photons experience
Dopplershifting events infrequently If the optode separation is small mm then
detected photons have generally been Dopplershifted no more than once LDBF is
thus similar to quasielastic light scattering except that the scattering angle of the
Doppler scattering event is not known Since more than Doppler shifted photons
are generally detected per second the scattering angle is eectively an average over
the dierential cross section
The major shortcoming of LDBF is the poor signaltonoise ratio for optode sep
aration greater than mm Once again the signaltonoise ratio is limited by the
maximum laser exposure that tissue can endure The lack of signal prevents the non
invasive determination of ow in deep tissues Another disadvantage of LDBF is that
the blood volume fraction ie Pblood must be known in order to quantify ow if
multiple scattering events have occurred
The correlation diusion equation is the multiple scattering limit of LDBF except
that the correlation diusion equation provides a simple framework for considering
systems with spatially varying ow and optical properties To demonstrate the simil
arity of diusing temporal correlation spectroscopy and LDBF I used it to monitor
blood ow in the arm during cu ischemia Cu ischemia refers to the use of a pres
sure cu to occlude blood ow in a limb thus preventing the delivery of oxygen to
the limb The measurements clearly show blood ow changes with cu pressures
including the hyperemic overshoot after cu release The blood ow measurements
are also correlated with changes in blood volume and blood oxygen saturation that
were measured using NIRS The NIRS and correlation measurements were obtained
simultaneously
The experimental system is diagrammed in g A TiSapphire laser was used
to produce CW nm light The beam was coupled into a m multimode ber
NA and delivered to the subjects arm Remission of the light was collected
from the sample by a singlemode ber in order to observe the intensity uctuations
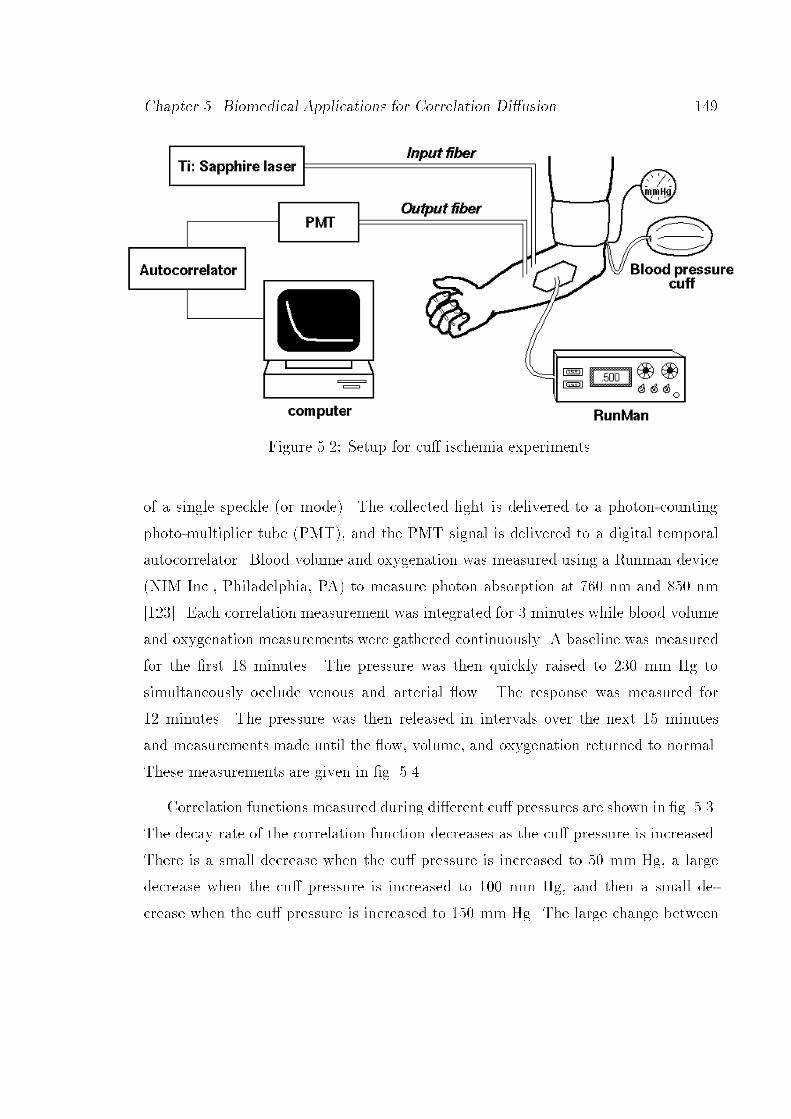
Chapter Biomedical Applications for Correlation Diusion
Figure Setup for cu ischemia experiments
of a single speckle or mode The collected light is delivered to a photoncounting
photomultiplier tube PMT and the PMT signal is delivered to a digital temporal
autocorrelator Blood volume and oxygenation was measured using a Runman device
NIM Inc Philadelphia PA to measure photon absorption at nm and nm
Each correlation measurement was integrated for minutes while blood volume
and oxygenation measurements were gathered continuously A baseline was measured
for the rst minutes The pressure was then quickly raised to mm Hg to
simultaneously occlude venous and arterial ow The response was measured for
minutes The pressure was then released in intervals over the next minutes
and measurements made until the ow volume and oxygenation returned to normal
These measurements are given in g
Correlation functions measured during dierent cu pressures are shown in g
The decay rate of the correlation function decreases as the cu pressure is increased
There is a small decrease when the cu pressure is increased to mm Hg a large
decrease when the cu pressure is increased to mm Hg and then a small de
crease when the cu pressure is increased to mm Hg The large change between
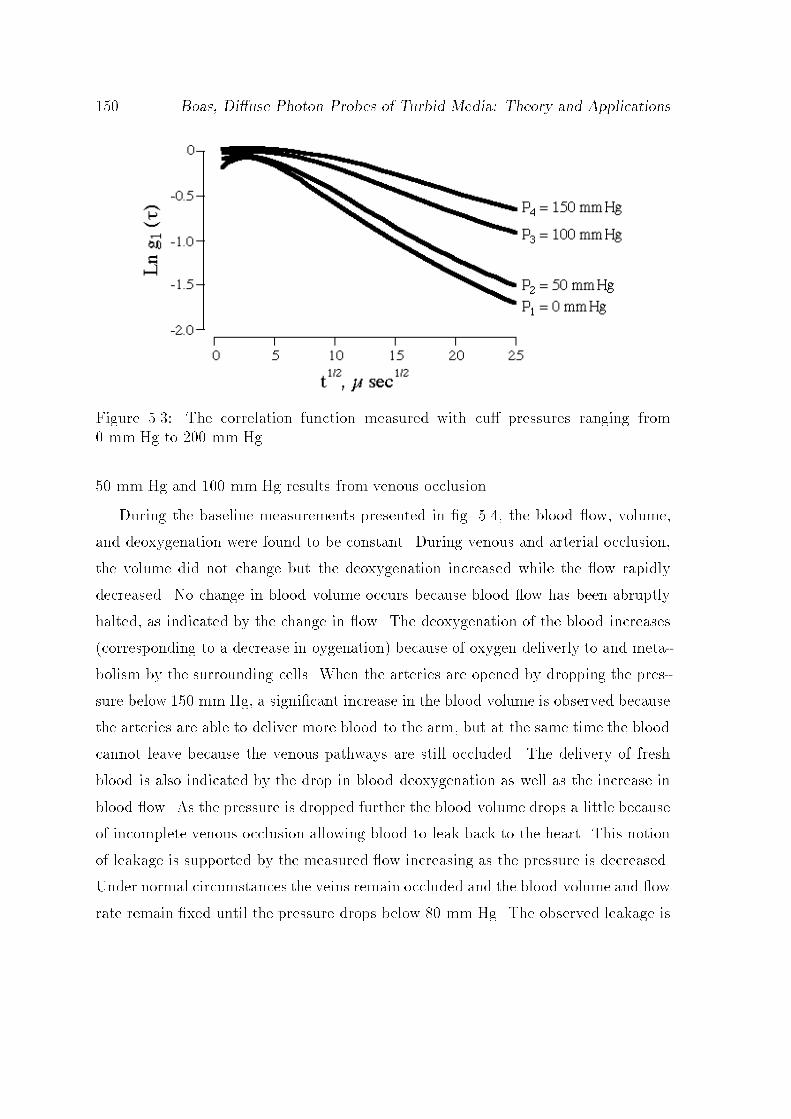
Boas Diuse Photon Probes of Turbid Media Theory and Applications
Figure The correlation function measured with cu pressures ranging from mm Hg to mm Hg
mm Hg and mm Hg results from venous occlusion
During the baseline measurements presented in g the blood ow volume
and deoxygenation were found to be constant During venous and arterial occlusion
the volume did not change but the deoxygenation increased while the ow rapidly
decreased No change in blood volume occurs because blood ow has been abruptly
halted as indicated by the change in ow The deoxygenation of the blood increases
corresponding to a decrease in oygenation because of oxygen deliverly to and meta
bolism by the surrounding cells When the arteries are opened by dropping the pres
sure below mm Hg a signicant increase in the blood volume is observed because
the arteries are able to deliver more blood to the arm but at the same time the blood
cannot leave because the venous pathways are still occluded The delivery of fresh
blood is also indicated by the drop in blood deoxygenation as well as the increase in
blood ow As the pressure is dropped further the blood volume drops a little because
of incomplete venous occlusion allowing blood to leak back to the heart This notion
of leakage is supported by the measured ow increasing as the pressure is decreased
Under normal circumstances the veins remain occluded and the blood volume and ow
rate remain xed until the pressure drops below mm Hg The observed leakage is

Chapter Biomedical Applications for Correlation Diusion
Figure The measured decay rate of the correlation function for dierent cupressures applied continuously over an hour is graphed in the top gure The bloodvolume and deoxygenation were measured simultaneously and are graphed in the bottom gure

Boas Diuse Photon Probes of Turbid Media Theory and Applications
perhaps a result of our subjects high blood pressure When the pressure is dropped
to zero the blood volume and oxygenation is seen to return to normal but the blood
ow rst increases above the baseline because of a hyperemic response
Similar observations have been made using laser Doppler blood owmetry
In the next section I show how the correlation diusion spectroscopy can
be used to quantify heterogeneous ow
Burn Diagnosis
The noninvasive determination of the depth of severe burns has been a tantalizing
problem for several years A robust solution would oer medical practitioners a valu
able tool for diagnosing and treating severe burns Burned tissue is essentially a
turbid medium with spatially varying dynamics ie light is multiply scattered by the
tissue and layers of burned tissue are characterized by a lack of blood ow that is
blood ow ceases in severly burned tissue The dynamical properties of turbid media
can be probed by monitoring the temporal uctuations of the intensities of dierent
speckles emanating from the turbid media Generally information on a systems dy
namics is obtained from the temporal autocorrelation function of these uctuations
In chapter I showed that the correlation diusion equation accurately
predicts the temporal correlation function for turbid systems with spatially varying
dynamics and that the dynamical properties of such systems can be imaged using
reconstruction algorithms based on the correlation diusion equation In this sec
tion I investigate the sensitivity of temporal eld correlation measurements to burn
thickness and the applicability of the correlation diusion equation to absolute de
termination of burn thickness Measurements on burn phantoms indicate that m
sensitivity is obtainable and that the correlation diusion equation predicts the ob
served correlation function fairly well These positive results motivated animal studies
at the Wellman Institute Our measurements of various burns on a living pig conrm
that m sensitivity is achievable

Chapter Biomedical Applications for Correlation Diusion
Teflon
Intralipid
Thickness d
DetectorSource
Figure Schematic of the burn phantom
Experiments on Phantoms
The burn phantom is drawn in g It consists of a layer of teon resting on
a solution of Intralipid The teon mimics tissue that has been severely burned in
that the teon scatters light and the scattering particles are static The Intralipid
simulates the scattering and dynamical properties of the healthy tissue underlying
the burned tissue For the teon s cm and a is negligibly small A
solution of Intralipid was used for which s cm and a is negligibly small For
both the teon and Intralipid solution the absorption was taken to be cm
The eective Brownian diusion coecient of the globules in the Intralipid solution
is approximately cms as determined from the mean diameter of m for
the globules Thicknesses of teon ranging from mm to mm are used in
the experiments to mimic burns of dierent depths
The experimental apparatus for probing the dynamical properties of this burn
phantom is diagrammed in g Two dierent lasers are used the nm line of
an argon ion laser and a heliumneon laser The laser is coupled into a multimode
optical ber core diameter m This ber delivers the light to the phantom
Several single mode bers are positioned with the source ber to collect light at

Boas Diuse Photon Probes of Turbid Media Theory and Applications
HeNe Laser 8mW
PMT
Multiplexer
Digital
CorrelatorProbe
Figure Schematic of the experimental setup Details are given in the text
distances of mm to mm from the source The light collected with the single
mode bers is then delivered to a photoncounting photomultiplier tube PMT and
analyzed using a digital temporal autocorrelator In the experiments presented here
approximately mW of light is incident on the sample and the signal is integrated for
minutes Higher powers are avoided to prevent pulse pile up ie the photon count
rate is already at the upper end of the linear response for the PMT The multimode
ber has a numerical aperture of and the single mode bers are designed for
nm light A better signaltonoise ratio is obtainable by reducing the numerical
aperture of the source ber and using single mode bers for nm light
The normalized eld correlation function measured for dierent sourcedetector
separations on the burn phantom with a teon thickness of mm is graphed in
g The decay of the correlation function arises from the dephasing of photons that
have traveled dierent path lengths through the sample Long path lengths contribute
to the decay of the correlation function at short times while short path lengths dominate
at long times For an innite homogeneous system where the dynamics are governed
by Brownian motion the correlation function decays exponentially as the squareroot
of the correlation time This decay would appear as a straight line in g The

Chapter Biomedical Applications for Correlation Diusion
Figure The natural log of the normalized eld correlation function is plottedversus the squareroot of the correlation time for dierent sourcedetector separationsThe teon sheet is mm The solid line is for a separation of mm and the otherlines in order of decreasing slope come from separations of and mm

Boas Diuse Photon Probes of Turbid Media Theory and Applications
decay is the same for semiinnite homogeneous systems except at short times where
the decay is inhibited by the loss of long path length photon trajectories The data
presented in g is nearly linear between and s The deviation from
linearity at longer times arises from the teon layer Specically the decay at longer
times comes from photons that have traveled short path lengths In the burn phantom
the short path length photons dwell mostly in the static teon layer thus inhibiting
the decay of the correlation function
In addition to the deviation from linearity the rate of decay in the linear region is
also perturbed by the presence of the static layer Fig plots the normalized eld
temporal correlation function for dierent teon thicknesses with a sourcedetector
separation of mm A signicant dierence is observed in the rates of decay for
dierent teon thicknesses Fig indicates that these correlation measurements are
sensitive to changes in the teon thickness smaller than m
To summarize the data for all teon thicknesses and sourcedetector separations
I plot the slope of the correlation function in the linear region versus sourcedetector
separation for dierent thicknesses g a and versus thickness for dierent sep
arations g b In all cases the linear region is taken to be between s and
s
First consider the slope as a function of sourcedetector separation for dierent
thicknesses g a When no static layer is present both theory and experiment
not shown demonstrate that the slope of the correlation function grows linearly with
sourcedetector separation As seen in g a the slope does not grow lineary with
when a static layer of sucient thickness is present However when the static layer is
suciently small in this case when d mm the slope is observed to increase
linearly with This observed behavior is expected Photons in general spend a
negligible amount of time in the static layer when its thickness is small The static
layer is thus eectively not there and we observe that the slope increases linearly with
For thicker static layers however photons spend a signicant amount of time in the
static layer and thus the correlation function does not decay as rapidly As the source
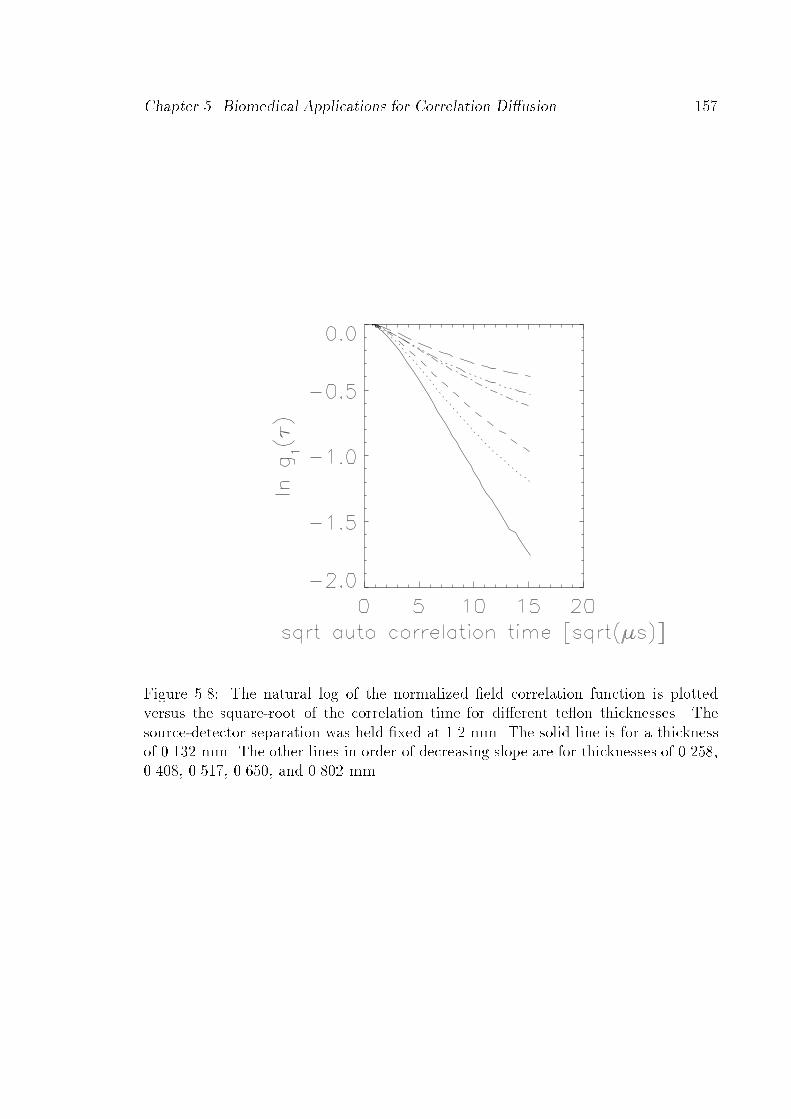
Chapter Biomedical Applications for Correlation Diusion
Figure The natural log of the normalized eld correlation function is plottedversus the squareroot of the correlation time for dierent teon thicknesses Thesourcedetector separation was held xed at mm The solid line is for a thicknessof mm The other lines in order of decreasing slope are for thicknesses of and mm

Boas Diuse Photon Probes of Turbid Media Theory and Applications
Figure Slopes of the experimental data in the nearly linear region between and s are given versus sourcedetector separation and teon thickness In a theslope is plotted versus separation for dierent thicknesses The solid line correspondsto a thickness of mm and the other lines moving from the solid line are forthicknesses of and mm In b the slope is plottedversus teon thickness for dierent separations The solid line corresponds to a separation of mm The other lines moving from the solid line are for separations of and mm
detector separation is increased the photons are spending a smaller percentage of the
time in the static layer and thus the slope is seen to increase faster than linear For
larger sourcedetector separations the slopes are expected to asymptotically approach
the value expected for a system with no static layer This is observed for separations
greater than mm when using teon sheets less than mm thick not shown
The slope versus thickness is plotted in g b for dierent This graph indicates
that the slope decreases rapidly over a short range of thicknesses and that the center of
this range depends on the sourcedetector separation At smaller thicknesses the slope
attens as seen for mm because the photons dwell mostly in the dynamical
region The slope also attens at larger thicknesses as seen for and
mm since the photons are then spending most of the time in the static region
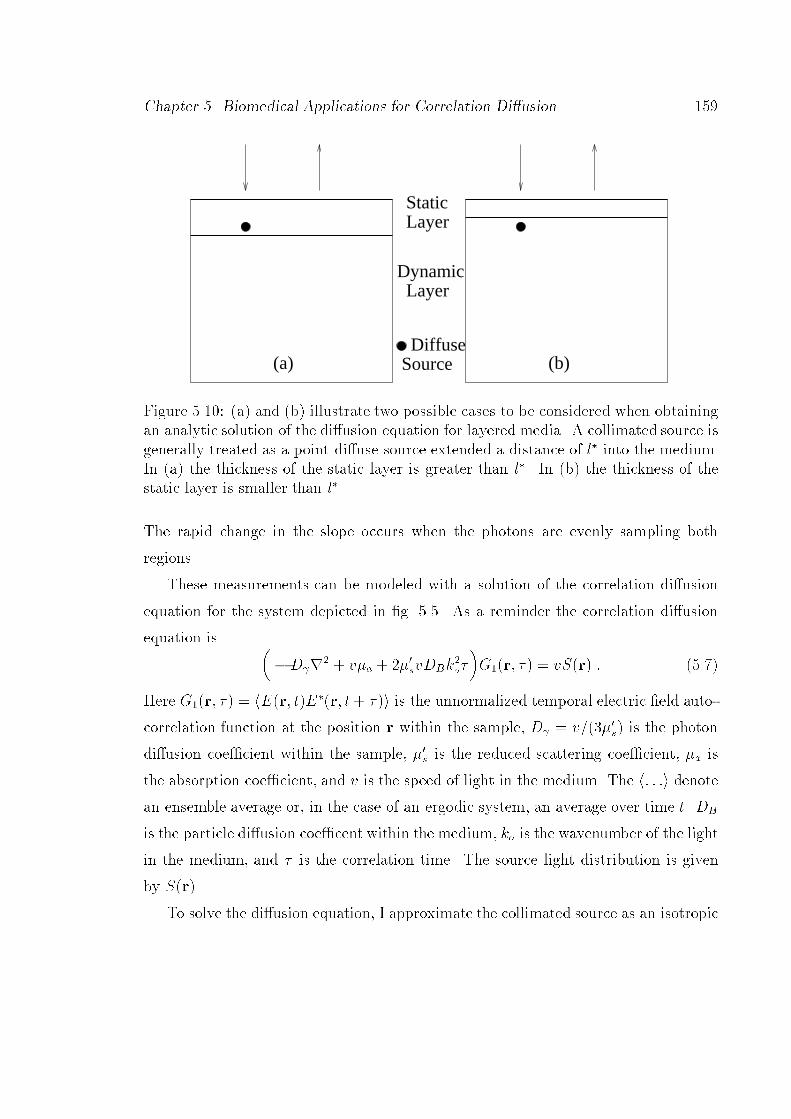
Chapter Biomedical Applications for Correlation Diusion
StaticLayer
LayerDynamic
DiffuseSource(a) (b)
Figure a and b illustrate two possible cases to be considered when obtainingan analytic solution of the diusion equation for layered media A collimated source isgenerally treated as a point diuse source extended a distance of l into the mediumIn a the thickness of the static layer is greater than l In b the thickness of thestatic layer is smaller than l
The rapid change in the slope occurs when the photons are evenly sampling both
regions
These measurements can be modeled with a solution of the correlation diusion
equation for the system depicted in g As a reminder the correlation diusion
equation is Dr
va svDBkoGr vSr
Here Gr hEr tEr t i is the unnormalized temporal electric eld auto
correlation function at the position r within the sample D vs is the photon
diusion coecient within the sample s is the reduced scattering coecient a is
the absorption coecient and v is the speed of light in the medium The h i denote
an ensemble average or in the case of an ergodic system an average over time t DB
is the particle diusion coecent within the medium ko is the wavenumber of the light
in the medium and is the correlation time The source light distribution is given
by Sr
To solve the diusion equation I approximate the collimated source as an isotropic

Boas Diuse Photon Probes of Turbid Media Theory and Applications
point source displaced a distance zo s into the medium along the axis of the
collimated source I also use the approximate extrapolatedzero boundary condition
instead of the exact zeroux boundary condition partial ux in the case of an index
mismatch For the extrapolatedzero boundary condition the eld correlation is
taken to be zero at z zb s where the physical boundary is at z
The diusion equation must be solved for two cases when the point source is in
the static layer and when the point source is displaced into the dynamic region
see g In the rst case Gr measured on the surface of the static layer a
distance from the source is given by
Gr exp
k
q zo
q zo
exp
k
q zo zb
q zo zb
Z
dAJ
sinq
k z zb
qk
Here k va D is the correlation wavenumber in the static layer Jx
is a cylindrical Bessel function and A is a constant that depends on the thickness
of the static layer and the properties of the dynamical medium This constant is
A exp iXd zo exp iXd zb zo
D Y D
X
D X cos Xd zb iD
Y sin Xd zb
X qk and Y
qk where k
va vs DBkoD
is the correlation wavenumber in the dynamical me
dium
The solution for the second case is
Gr Z
dJ
iD exp iY zo d sin Xzb
D X cos X d zb iD
Y sin X d zb
Comparisons between experiment and diusion theory are made in g The
parameters used in the calculation are given in the text discussing g The

Chapter Biomedical Applications for Correlation Diusion
agreement between experiment and theory although not perfect is pretty good and
certainly captures the trend as a function of sourcedetector separation and static layer
thickness It is interesting to note that the agreement is better at larger thicknesses
where the diusion theory is expected to be more valid in the static layer The larger
disagreement at smaller thicknesses is most likely a result of the breakdown of the
diusion approximation in the small static layer In this regime comparison with a
solution of the correlation transport equation would be more appropriate
As seen from gs a and b measurements of the temporal eld correlation
function are sensitive to variations of less than m in the teon thickness Fur
thermore there is a correspondence between the thickness of the burn and the slope
of the correlation function versus the sourcedetector separation see g a Burn
thickness can thus in principle be determined from correlation measurements with
an accuracy of better than m However an accurate determination depends
on the established correspondence which in general is a function of the optical and
dynamical properties of the burned tissue It is thus important to investigate nu
merically and experimentally the dependence of the curves in g a on the optical
and dynamical properties For instance we might nd that a ratio of the slope of
the correlation function measured on the burn to that measured over healthy tissue is
relatively independent of the optical properties
Fig b suggests that these measurements would be suitable in a feedback loop
for controlling an automatic laser ablation system By rst choosing a large source
detector separation such that the sensitivity of the slope of the correlation function
to the burn depth is optimized we can observe the preliminary layers of necrotic
tissue being removed As the burn thickness is decreased smaller and smaller source
detector separations are monitored to maintain optimal sensitivity For correlation
measurements to be eective in a feedback system a decent signal must be obtainable
in a second The measurements presented here were integrated for minutes to obtain
the best signaltonoise ratio for presentation purposes In fact a sucient signalto
noise ratio is achieved after only a few seconds for the parameters used in the phantom
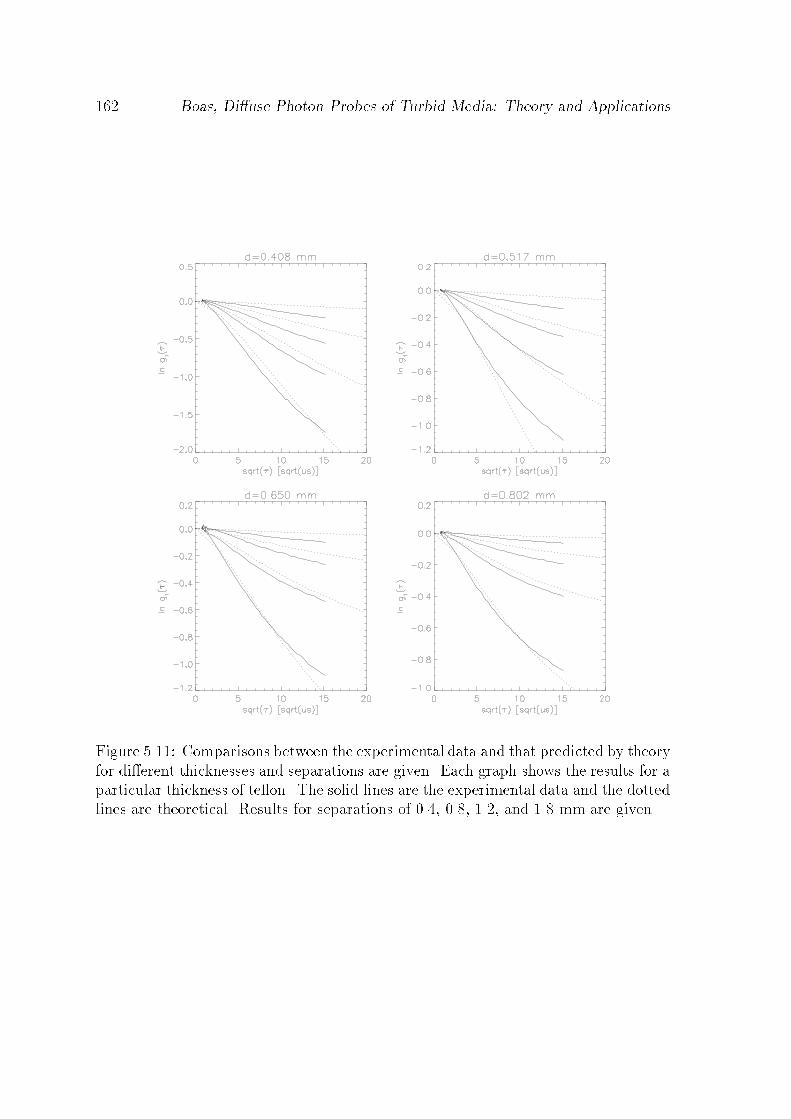
Boas Diuse Photon Probes of Turbid Media Theory and Applications
Figure Comparisons between the experimental data and that predicted by theoryfor dierent thicknesses and separations are given Each graph shows the results for aparticular thickness of teon The solid lines are the experimental data and the dottedlines are theoretical Results for separations of and mm are given

Chapter Biomedical Applications for Correlation Diusion
trials As mentioned a better signaltonoise ratio can be achieved by optimizing the
ber optics In addition since the photon count rate is so high analog measurements
of the correlation function may be possible Analog measurements provide a higher
duty cycle and thus a better signaltonoise ratio
The reduced scattering coecient of the teon and Intralipid is approximately
cm and cm respectively The reduced scattering coecient for tissue is
around cm The absorption of tissue is cm Measurements on tissue
may not signicantly alter the conclusions but the accuracy of the correlation diusion
equation on the length scales of interest will be jeopardized because of the smaller
reduced scattering coecient
The agreement between the correlation diusion theory and the experimental res
ults is encouraging This theory will permit measurements of burn thickness to be
quantied
Clinical Work
After verifying with measurements on phantoms that photon correlation techniques
are sensitive to dierences in thickness of m and that the correlation diusion
equation eq can be used to model the correlation function my next step was
to apply the technique clinically The clinical work was done with Norm Nishioka and
Kevin Schomacker at the Wellman Institute in Boston We used their pig burn model
for the clinical trials
This work was made possible by an Army grant to develop and investigate the
ecacy of a laser debridement system Debridement refers to the removal of dead
tissue Their debridement system is operational and is currently being tested with pigs
since the skin of pigs closely resembles that of humans As part of the Army grant
the Wellman Institute has been investigating possible optical feedback techniques for
controlling the debridement The idea is to use an optical technique to identify severely
burned tissue and then provide feedback during the debridement process to determine
when the severly burned tissue has been completely removed Diuse reectance
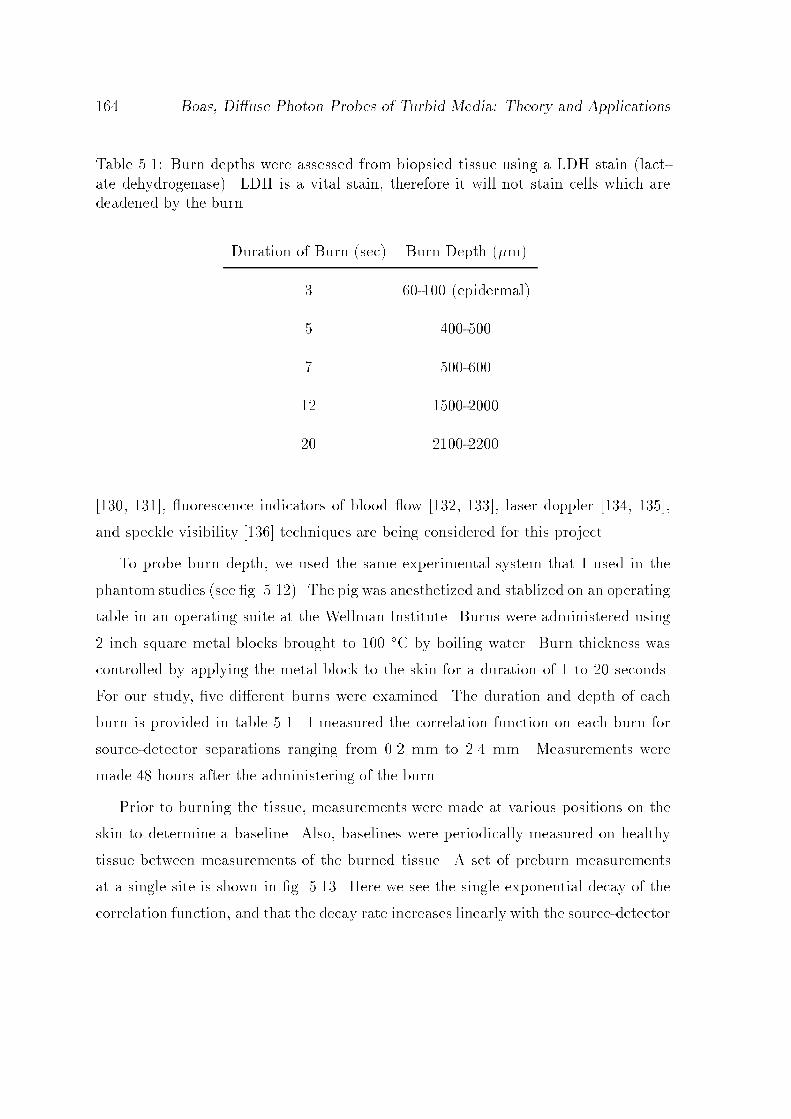
Boas Diuse Photon Probes of Turbid Media Theory and Applications
Table Burn depths were assessed from biopsied tissue using a LDH stain lactate dehydrogenase LDH is a vital stain therefore it will not stain cells which aredeadened by the burn
Duration of Burn sec Burn Depth m
epidermal
uorescence indicators of blood ow laser doppler
and speckle visibility techniques are being considered for this project
To probe burn depth we used the same experimental system that I used in the
phantom studies see g The pig was anesthetized and stablized on an operating
table in an operating suite at the Wellman Institute Burns were administered using
inch square metal blocks brought to C by boiling water Burn thickness was
controlled by applying the metal block to the skin for a duration of to seconds
For our study ve dierent burns were examined The duration and depth of each
burn is provided in table I measured the correlation function on each burn for
sourcedetector separations ranging from mm to mm Measurements were
made hours after the administering of the burn
Prior to burning the tissue measurements were made at various positions on the
skin to determine a baseline Also baselines were periodically measured on healthy
tissue between measurements of the burned tissue A set of preburn measurements
at a single site is shown in g Here we see the single exponential decay of the
correlation function and that the decay rate increases linearly with the sourcedetector

Chapter Biomedical Applications for Correlation Diusion
Multiplexer
PMT
DigitalCorrelator
HeNe Laser 8mW
Figure Experimental setup for the pig experiments The shaded areas on thepig indicate burns of various depths
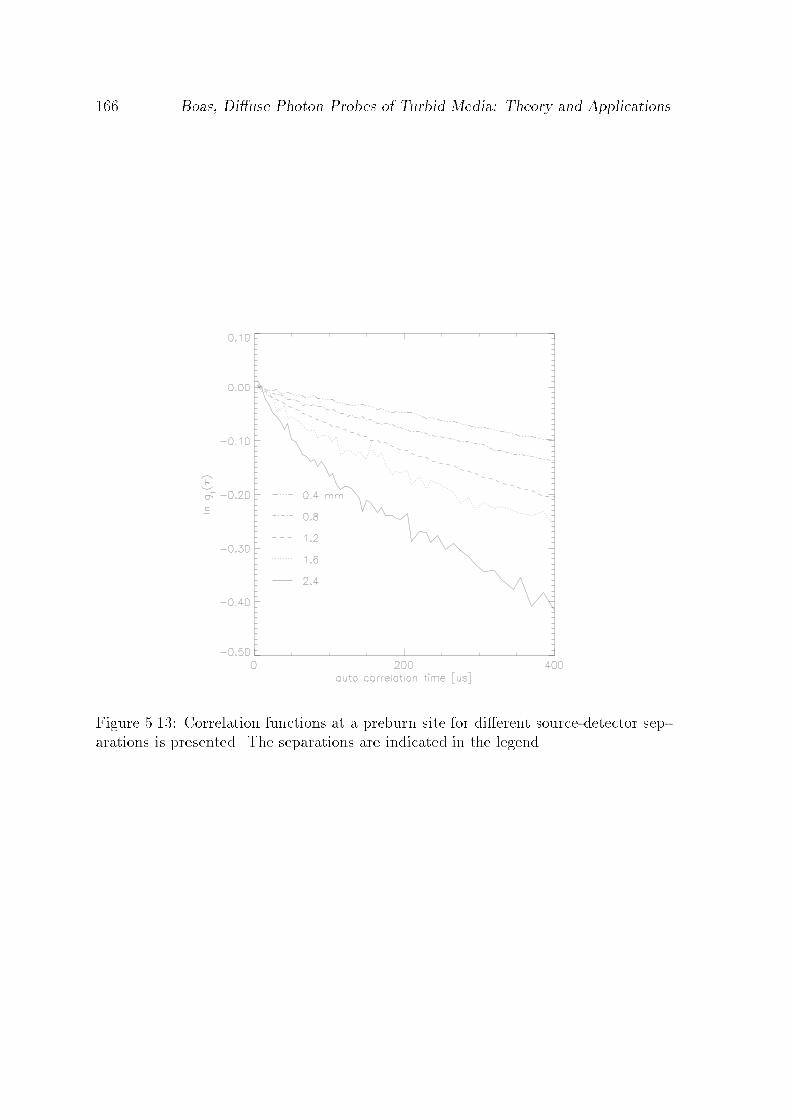
Boas Diuse Photon Probes of Turbid Media Theory and Applications
Figure Correlation functions at a preburn site for dierent sourcedetector separations is presented The separations are indicated in the legend

Chapter Biomedical Applications for Correlation Diusion
Figure The temporal eld correlation functions obtained from the hour oldburns for a sourcedetector separation of m are plotted The correlation functionsfor the s solid line s dotted line s dashed line s dotdash line andthe s dotdotdotdash line burns are presented
separation
Fig plots the temporal eld correlation functions obtained from the hour
old burns for a sourcedetector separation of m As expected the decay rate of
the correlation function decreases as the burn thickness increases These data indicate
that the and second burns are easily distinguished To summarize the
data for all sourcedetector separations I determined the decay rate of the correlation
function for s by tting a line to the data and plot the decay rate as
a function of sourcedetector separation for dierent burns These results are given
in g and indicate that it is possible to distinguish burns that vary in thickness
by only m The behavior of the decay rate is expected For shallow burns
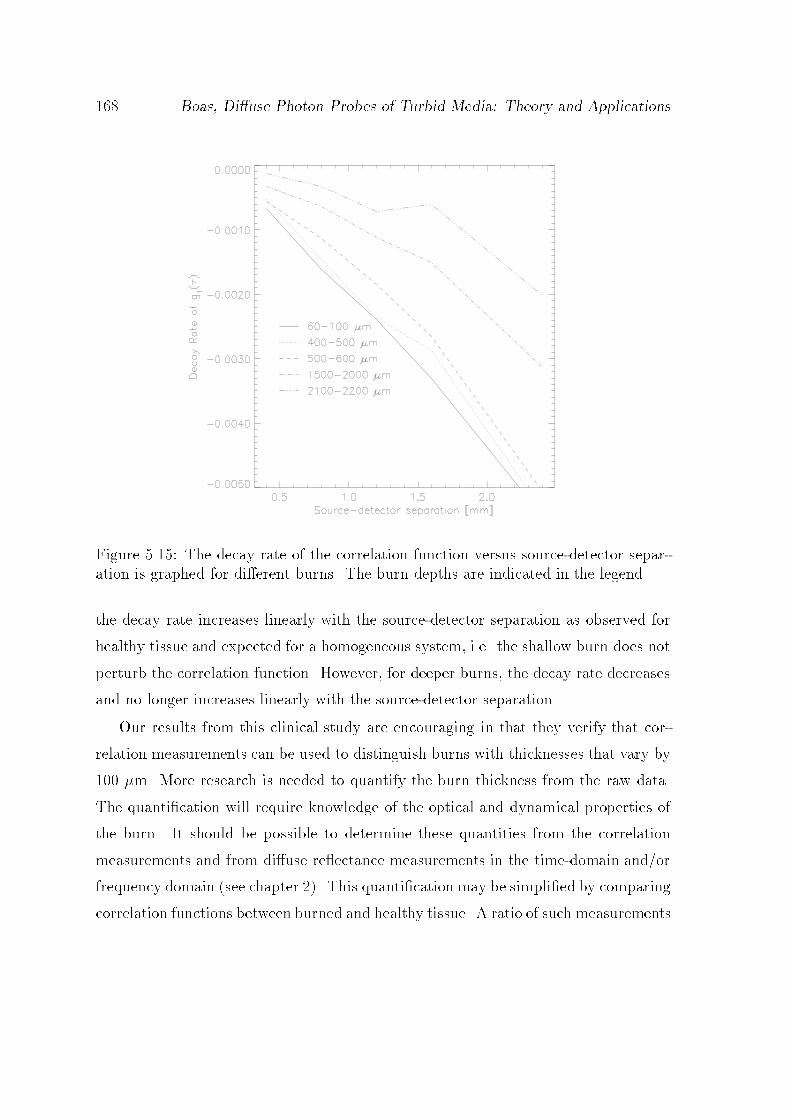
Boas Diuse Photon Probes of Turbid Media Theory and Applications
Figure The decay rate of the correlation function versus sourcedetector separation is graphed for dierent burns The burn depths are indicated in the legend
the decay rate increases linearly with the sourcedetector separation as observed for
healthy tissue and expected for a homogeneous system ie the shallow burn does not
perturb the correlation function However for deeper burns the decay rate decreases
and no longer increases linearly with the sourcedetector separation
Our results from this clinical study are encouraging in that they verify that cor
relation measurements can be used to distinguish burns with thicknesses that vary by
m More research is needed to quantify the burn thickness from the raw data
The quantication will require knowledge of the optical and dynamical properties of
the burn It should be possible to determine these quantities from the correlation
measurements and from diuse reectance measurements in the timedomain andor
frequency domain see chapter This quantication may be simplied by comparing
correlation functions between burned and healthy tissue A ratio of such measurements
Chapter Biomedical Applications for Correlation Diusion
may be insensitive to blood ow thus reducing the number of unknowns in the de
termination of the burn depth Finally the behavior of the burns during the rst few
hours must be studied more carefully to determine if correlation techniques can be
used to diagnose the severity of young burns To be a suitable diagnostic tool our
technique must be able to characterize burns during the rst day preferably within
the rst six hours This research is in progress
Boas Diuse Photon Probes of Turbid Media Theory and Applications
Chapter
Experimental Methods
This chapter describes the two dierent techniques utilized in this dissertation for ob
serving the behavior of diusing photons in turbid media In the rst I measure the
average intensity and phase of light generated by an intensity modulated source and
investigate the properties of the photon density as it diuses through highly scattering
media Media with and without spatially varying optical properties are considered In
the second I indirectly measure the temporal uctuations of diuse electric elds em
anating from highly scattering media From the time scale of the temporal uctuations
it is possible to derive information about the dynamical properties of the scattering
media Media with spatially varying dynamical and optical properties are considered
Measuring Diuse Photon Density Waves
When photons are introduced into a highly scattering medium they undergo a random
walk Some photons will scatter only a few times before exiting the system while
others will experience a thousand or more scattering events The average number of
scatter events for an innite homogeneous medium is estimated as rl where r
is the sourcedetector separation and l is the photon random walk step When the
source of photons is intensity modulated at a frequency f then the photon uence in
the medium will also modulate with a frequency f This modulation in the photon
uence can be thought as a traveling wave propagating outwards from the source and
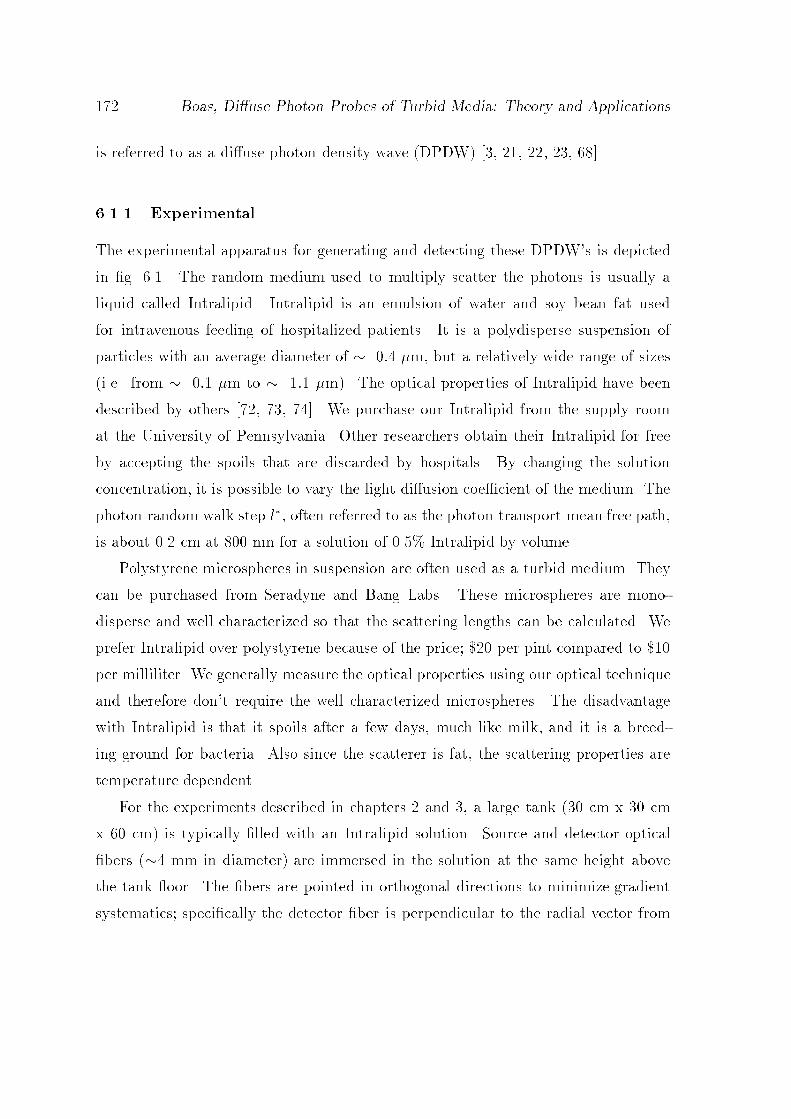
Boas Diuse Photon Probes of Turbid Media Theory and Applications
is referred to as a diuse photon density wave DPDW
Experimental
The experimental apparatus for generating and detecting these DPDWs is depicted
in g The random medium used to multiply scatter the photons is usually a
liquid called Intralipid Intralipid is an emulsion of water and soy bean fat used
for intravenous feeding of hospitalized patients It is a polydisperse suspension of
particles with an average diameter of m but a relatively wide range of sizes
ie from m to m The optical properties of Intralipid have been
described by others We purchase our Intralipid from the supply room
at the University of Pennsylvania Other researchers obtain their Intralipid for free
by accepting the spoils that are discarded by hospitals By changing the solution
concentration it is possible to vary the light diusion coecient of the medium The
photon random walk step l often referred to as the photon transport mean free path
is about cm at nm for a solution of Intralipid by volume
Polystyrene microspheres in suspension are often used as a turbid medium They
can be purchased from Seradyne and Bang Labs These microspheres are mono
disperse and well characterized so that the scattering lengths can be calculated We
prefer Intralipid over polystyrene because of the price per pint compared to
per milliliter We generally measure the optical properties using our optical technique
and therefore dont require the well characterized microspheres The disadvantage
with Intralipid is that it spoils after a few days much like milk and it is a breed
ing ground for bacteria Also since the scatterer is fat the scattering properties are
temperature dependent
For the experiments described in chapters and a large tank cm x cm
x cm is typically lled with an Intralipid solution Source and detector optical
bers mm in diameter are immersed in the solution at the same height above
the tank oor The bers are pointed in orthogonal directions to minimize gradient
systematics specically the detector ber is perpendicular to the radial vector from

Chapter Experimental Methods
Lock-in Amplifier
|R| φ
200 MHzDriver
Mixer
200.025 MHZOscillator
DiodeLaser
Mixer
PMTIntralipidSample
Figure A known concentration of Intralipid solution lls a glass tank The sourceis a diode laser that is amplitude modulated by a MHz driver Light is deliveredinto the sample through a source ber and picked up by a movable detector berThe bers are pointed in orthogonal directions to minimize gradient systematics Thesignal at the photomultiplier tube PMT is heterodyned down to kHz by modulating the second PMT dynode at MHz and then fed into a lockin amplierStanford model SRS The kHz lockin reference signal is derived fromthe MHz driver by standard mixing techniques The twophase lockin amplierprovides amplitude jRj and phase output signals
the source ber
The source light is derived from a mW diode laser operating at nm The
light is coupled into the source ber by butting the ber bundle up to the surface of
the laser diode The source ber position in the tank is xed
Diuse light is collected with the detector ber which can be positioned anywhere
in a plane parallel to the bottom of the tank by using a homebuilt translation stage
driven by stepper motors described below The ber delivers the collected light
to a photomultiplier tube PMT We use an R PMT from Hamamatsu The
PMT is modied to facilitate the phase and amplitude measurements Basically the
voltage at the second dynode is modulated at MHz Modied this way the
PMT acts both as a detector and a mixer The PMT signal thus has a MHz
modulation and a kHz modulation We use a notch lter to pick out the kHz
signal A kHz reference is generated from the MHz and MHz oscillators
by a mixer and low pass lter The low frequency signals are then measured using
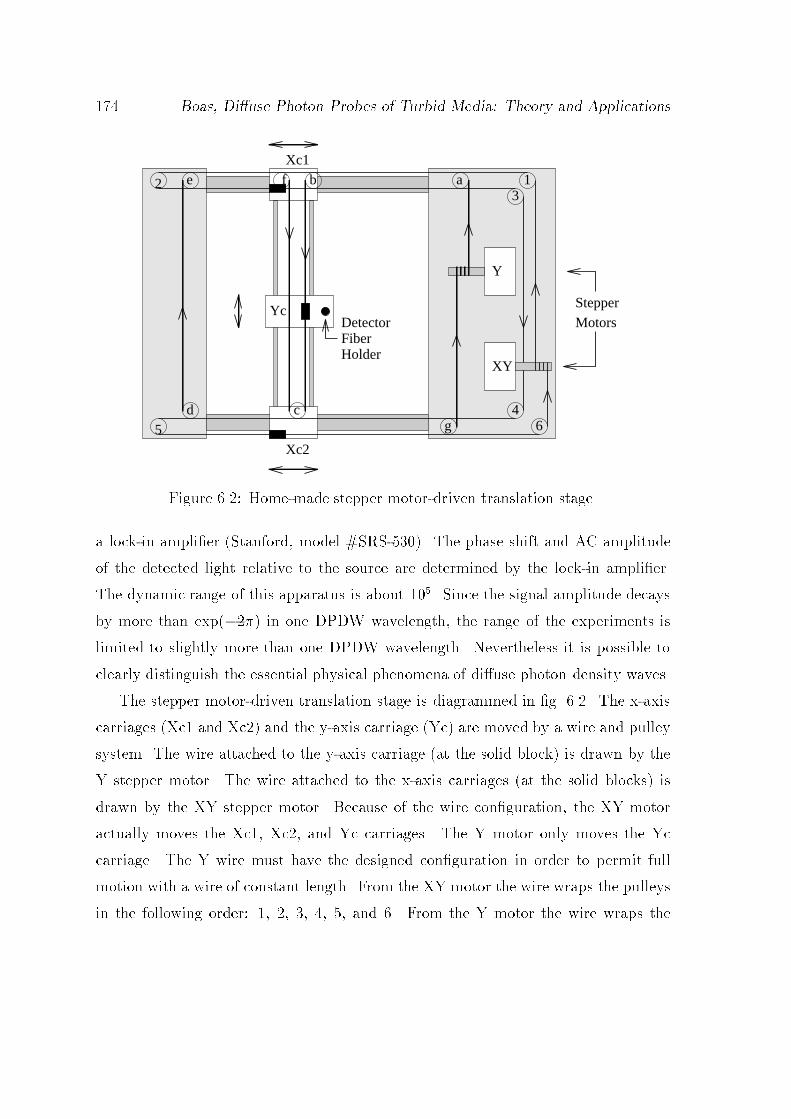
Boas Diuse Photon Probes of Turbid Media Theory and Applications
Y
Yc
Xc2
Xc112
3
45 6
ab
cd
e f
g
XYHolderFiberDetector
StepperMotors
Figure Homemade stepper motordriven translation stage
a lockin amplier Stanford model SRS The phase shift and AC amplitude
of the detected light relative to the source are determined by the lockin amplier
The dynamic range of this apparatus is about Since the signal amplitude decays
by more than exp in one DPDW wavelength the range of the experiments is
limited to slightly more than one DPDW wavelength Nevertheless it is possible to
clearly distinguish the essential physical phenomena of diuse photon density waves
The stepper motordriven translation stage is diagrammed in g The xaxis
carriages Xc and Xc and the yaxis carriage Yc are moved by a wire and pulley
system The wire attached to the yaxis carriage at the solid block is drawn by the
Y stepper motor The wire attached to the xaxis carriages at the solid blocks is
drawn by the XY stepper motor Because of the wire conguration the XY motor
actually moves the Xc Xc and Yc carriages The Y motor only moves the Yc
carriage The Y wire must have the designed conguration in order to permit full
motion with a wire of constant length From the XY motor the wire wraps the pulleys
in the following order and From the Y motor the wire wraps the

Chapter Experimental Methods
1
2
3
4
5
6
7
8 9
10
11
12
13
14
15
16
Voltage Supply (+)Stepper Motor
Stepper Motor
+5V
DirectionControl
UCN-5804B
Step Input
Figure Circuit diagram for stepper motor controller Pin is the logic supplyPin is the output enable when set high the chip turns o Pin is for directioncontrol Pin is for step control The chip number is UCNB
pulleys in the order a b c d e f c g There are two pulleys in position c All
pulleys are on appropriate levels to keep wires from intersecting The detector ber
is held in place by the Yc carriage
We use phase stepper motors with steps per revolution The motors are
driven using a specially designed inexpensive integrated circuit Herbach and Rade
man HR Q A schematic of a simple circuit using
this chip for controlling the motor is given in g The chip requires TTL pulses
to advance the motor one step and to control the step direction These pulses are
provided by the parallel port LPT of an IBM clone PC We use Qbasic to directly
assigning values to the parallel port The base address for LPT is decimal and
the Qbasic command for assigning a value to address is out n where n is a
value between and see table and is the decimal value of the binary word
represented at the base address by pins through For example if you want pins
and to be high and through to be low then n would be in binary which

Boas Diuse Photon Probes of Turbid Media Theory and Applications
Table Conguration of the parallel port on an IBMclone PC The numberscorrespond to pins on the pin Dshell parallel port connector Logic is invertedfor numbers with a bar x means that the bit is not used The base address for portLPT is decimal Pins are logic ground
Address MSB LSB function
base output
base x x x input
base x x x inout
is in decimal
Experiments are performed in several dierent geometries and are discussed in
chapter
In section measurements of the propagation of DPDWs in a homogeneous
approximately innite medium are described For these measurements the phase
shift and AC amplitude of the detected diusive wave is measured with respect to the
source at each point on a cm square planar grid The measurements are made
suciently far from the edges of the tank such that the medium could be approximated
as being innite
In section measurements of the refraction and diraction of DPDWs are de
scribed Experiments include measurements of the refraction by a planar interface
between dierent concentrations of Intralipid and the refraction and diraction by
spherical objects with dierent optical properties than the surrounding medium The
planar interface is created by a mm thick sheet of acrylic which separated the two
dierent solutions of Intralipid The spherical objects are created by containing dif
ferent concentrations of Intralipid and black ink in a cm diameter glass bulb The
wall of the glass bulb is approximately mm
In section measurements of the scattering of DPDWs from spherical objects
is described Perfectly absorbing spheres and spheres with dierent scattering coef
Chapter Experimental Methods
cients were measured The perfectly absorbing spheres are wooden spheres from
a hobby shop painted matte black The scattering spheres are made by suspending
titanium dioxide in casting resin and letting it cure in hemispherical molds Titanium
dioxideresin phantoms have been described in detail by Firbank et al and
are briey discussed in section
Monte Carlo
In addition to experimental measurements of DPDWs I use Monte Carlo simulations
of migrating photons to analyze certain properties with a signaltonoise ratio that is
dicult to achieve in the laboratory Simulations are performed for a point source in an
innite homogeneous medium Results are obtained for dierent source modulation
frequencies and medium absorption coecients These simulations permit a detailed
examination of the breakdown of the photon diusion approximation and the validity
of higher order transport approximations for large photon absorption coecient and
modulation frequencies see section
The Monte Carlo code that I developed comprises only lines of C code this
includes components for spherical objects see appendix C The basic idea is to
launch N photons into the medium at time t and histogram partial photon ux
in radial and temporal channels For my simulations N is typically million to
million and the code takes hours to run on a Sun Sparc Model MHz
processor or a MHz Pentium Once the temporal response to a pulse is found
a fast Fourier transform of the result into the frequency domain is performed for
analyzing the properties of diuse photon density waves
There are many techniques for propagating and histogramming photons within
Monte Carlo calculations To keep the code simple I mimic the physical
process as closely as possible instead of relying on reduction techniques that purport
to increase statistics while reducing computation see for discussions of
dierent reduction techniques The algorithm is charted in g To propagate
a photon from one interaction event to the next the program calculates a scattering

Boas Diuse Photon Probes of Turbid Media Theory and Applications
in Direction ΩIncrement Time by Ls/v
Propagate Distance Ls
Calculate the New PropagationDirection using the Henyey-GreensteinPhase Function
CalculateLs and La
Crossed and Score Inward
Channels
Temporal and Radial
Checkwhich Detection
Shells have been
or Outward Flux in Appropriate
in Direction ΩPropagate Distance La
Increment Time by La/vPhoton is Absorbed
Number PhotonsGreater than
Total Numberto Propagate
Ls<La La<Ls
Photon Absorbed
Ls<La
Random Directionx=y=z=t=0New PhotonLaunch
or Time > Tgate
END
Results
Save
No
Yes
Figure Flow chart for Monte Carlo simulations for a point source in innitehomogeneous medium

Chapter Experimental Methods
length and an absorption length based on the exponential distributions derived from
the scattering and absorption coecients respectively If the absorption length is
shorter than the scattering length then the photon is propagated the absorption length
scored if necessary terminated and a new photon is launched at time t from the
source position If the scattering length is shorter then the photon is propagated the
scattering length scored if necessary the scattering angle is calculated based on the
HenyeyGreenstein phase function and then a new scattering length
and absorption length are calculated Photon propagation continues until the photon
is absorbed escapes or the time exceeds a maximum set by Tgate
To exploit the spherical symmetry of the problem the source is isotropic spherical
shell detectors are centered on the point source and the crossing of photons across
each shell is scored in the appropriate temporal and radial channel The width of each
temporal channel is ps Inward and outward crossings are scored separately so that
the Monte Carlo simulation can report the radial components of the photon ux In
this way we can obtain the photon uence r and the net photon ux Dr r
from the data For my analyses I use the photon uence
Photon Correlation Spectroscopy Techniques
Photons scattered by moving particles have their frequency Dopplershifted by an
amount proportional to the particles speed the photons wavenumber and the scat
tering angle The frequency shifts are generally a very small fraction of the absolute
frequency typically ranging from to These relatively small shifts are
dicult to measure directly Instead they are usually determined indirectly by meas
uring the beating of dierent frequencies as revealed in the uctuating intensities of
a single coherence area ie speckle of the scattering light These uctuations can
be analyzed by looking at the power spectrum or temporal autocorrelation function
of the uctuations I measure the temporal intensity autocorrelation function of the
uctuating speckles This method is prefered over measuring the power spectrum for
Boas Diuse Photon Probes of Turbid Media Theory and Applications
two reasons First the correlation function is the quantity which is derived in the
correlation diusion equation see chapter Second using digital correlators and
photon counting techniques it is possible to analyze smaller signals
There is one major advantage of direct measurements Indirect measurements of
the Doppler broadening of the laser linewidth requires that single or only a few
coherence areas of scatter light be detected For systems which multiply scatter light
these coherence areas are on the order of m Small aperture light collectors are
thus necessary resulting in the collection of small numbers of photons This is not the
case for systems which scatter light no more than once since then the coherence area
is then given by the laser beam size and coherence length For direct measurements
of Doppler broadening it is not necessary to collect light from a single coherence area
and thus the number of photons collected can be increased by at least a factor of
Low signaltonoise ratio applications would benet from the development of better
lters for directly measuring these relatively small Dopper shifts
Experimental
A schematic of the experimental apparatus for measuring the temporal intensity auto
correlation function discussed in chapters and of a speckles intensity uctuations
is presented in g For the initial experiments the nm line of an Argonion
laser operating with an etalon is used because of its long coherence length and strong
power In later human subject experiments the nm line of a TiSapphire laser
is used to coincide with the isosbestic point in the absorption spectra of oxy and
deoxyhemoglobin For the animal experiments the nm line of a HeNe laser is
used because of its portability In the future it will be desirable to utilize laser diodes
with stable single longitudinal mode operation
The laser beam is coupled into a multimode ber using a ber launch system
purchased from Thor Labs part MDT Fibers with core diameters ranging
from to m and various numerical aperatures NA are used Generally
for large sourcedetector separations the diameter and NA are not critical although

Chapter Experimental Methods
Fiber OpticCoupler
SingleModeFiber
Multi-ModeFiber
Argon Ion Laser
Disc.Amp/
Digital Correlator
PMT
Sample
Figure Experimental setup for photon correlation spectroscopy
coupling with the laser beam is easier with large diameters and NAs For the smaller
sourcedetector separations used on the human subject and animal trials it is best to
use a small NA This minimizes the divergence of the beam from the output of the
ber to the sample thus reducing the possibility of detecting light that has reected
at the surface of the sample For these measurements I use m core diameter ber
with an NA of Thor Labs FGLAT
Measurements are made on various samples with many sourcedetector separations
The sourcedetector positions are controlled by repositioning the source and detector
bers Diuse back reection is measured from turbid homogeneous and solid slabs
with either a spherical cavity containing a turbid colloid or a cylindrical vein through
which a colloid is pumped Transmission and reection measurements are made on
solid cylinders with spherical cavities Human and animal subjects are also employed
These various samples are described in more detail in the appropriate chapters
Single speckles of the diuse light emanating from the sample are collected with a
single mode ber I use dierent single mode bers all from Thor Labs Basically it
is best to use a single mode ber designed for the wavelength of light to be detected
Boas Diuse Photon Probes of Turbid Media Theory and Applications
Single mode bers designed for short wavelengths will not propagate the desired longer
wavelength thus killing the signal Single mode bers designed for longer wavelengths
will pass many more modes speckles increasing the photon count rate but decreasing
the relative magnitude of the uctuations resulting in a decreased signaltonoise ratio
This tradeo can be exploited if the photon count rate with the appropriate single
mode ber is near the dark current The dark current is a constant noise source
independent of the photon count rate and thus the signaltonoise ratio decreases
more than expected as the photon count rate approaches the dark current In this
case a better signaltonoise ratio can be achieved by using a ber for a longer photon
wavelength which increases the photon count rate to a level such that the dark current
is insignicant To be more quantitative we must look at the relative tradeo between
a signicant dark current associated with the correct single mode ber and the reduced
relative magnitude of the uctuations associated with using a single mode ber for a
longer wavelength
A single mode ber does not actually collect light from a single speckle but from
a single spatial mode Actually the single mode ber propagates both polarizations so
that it is really a dual mode ber The dierence between observing a speckle and a
mode is best demonstrated by comparing the measured correlation function for dier
ent distances between the single mode ber and the sample Because of the nonzero
NA of the single mode bers the area from which light is collected increases with the
distance between the sample and collecting ber The number of observed speckles
increases with the collection area and thus the observed intensity uctuations should
decrease relative to the average intensity because of the averaging of uncorrelated
uctuating speckles In addition the average intensity should increase However the
uctuations are observed not to decrease and the average intensity remains constant
This result perhaps surprising arises because a single mode ber projects the collec
ted light onto a single spatial mode which by denition is coherent The use of single
mode bers for observing speckles has been discussed by Ricka and Van Keuren
et al

Chapter Experimental Methods
The collected light is delivered to a photon counting photomultiplier tube Hama
matsu HC The dark count is less than counts per second at room temperature
Smaller dark counts are achieved by cooling the PMT to C Afterpulsing can occur
for up to ns and the response of the PMT is linear up to counts per
second The signal from the PMT is amplied and then discriminated using an amp
lierdiscriminator package supplied by Brookhaven Instruments Corporation The
TTL signal from the discriminator goes to the digital correlator card housed in a
computer The correlator is from Brookhaven Instruments Corporation BI To
measure correlation functions faster than ns it is necessary to crosscorrelate the
signal from two PMTs This is best achieved by using a ber optic beam
divider to split the beam between two PMTs and operate the digital correlator in
crosscorrelation mode
Since the decay of the correlation function depends on the position of the source
and detector relative to the dynamical regions of the sample it is necessary to optimize
the range of correlation times for which data is collected It is important to choose
the minimum correlation time to capture the early time decay However it is not good
to set this minimum arbitrarily low since smaller minimum correlation times reduce
the signaltonoise ratio The maximum correlation time must be chosen so that the
full decay and thus the baseline of the correlation function is recorded
The samples used in my experiments are nonergodic a time average is not equal
to an ensemble average As described in the theory section on photon correlation spec
troscopy and ergodicity section care must be taken with nonergodic samples
in order to obtain repeatable measurements Basically for nonergodic samples each
speckle has a constant component and a uctuating component The constant com
ponent is comprised of photons which have not scattered from any moving particles
The uctuating component arises from the photons which have scattered from at least
one moving particle If we x the source and compare speckles in a localized region
some distance from the source then we will see that the uctuating component is
the same from speckle to speckle the ensemble average equals the time average but
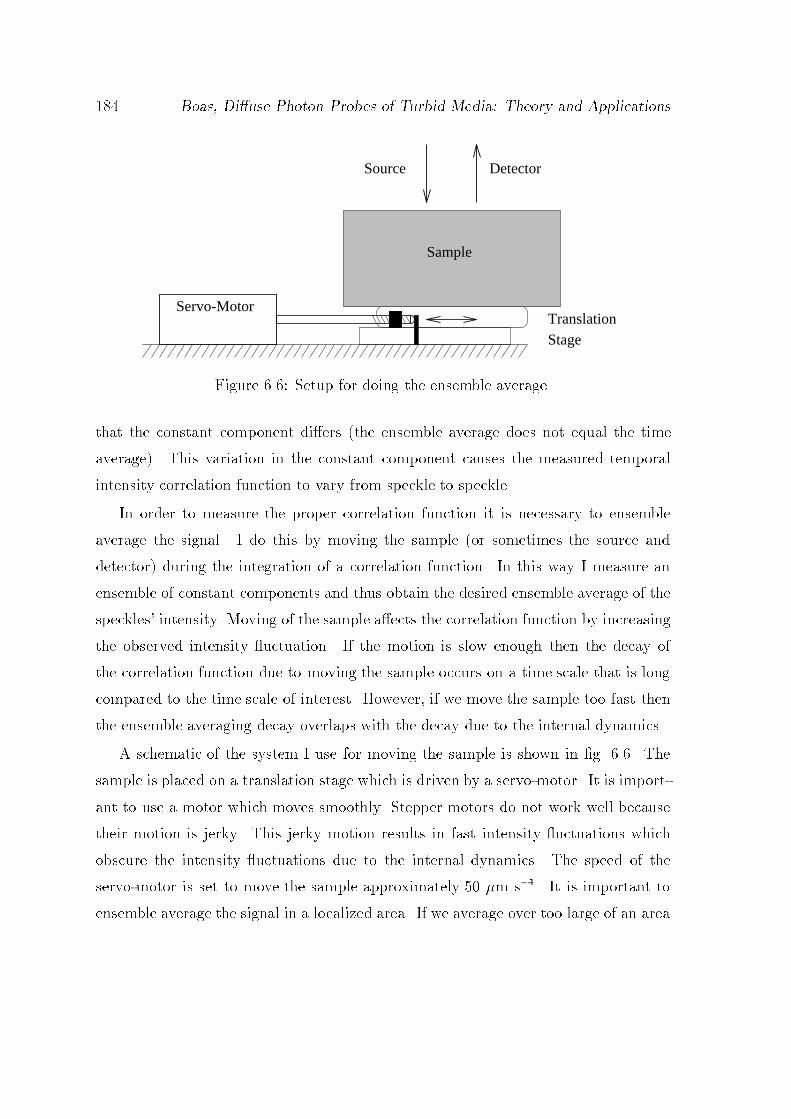
Boas Diuse Photon Probes of Turbid Media Theory and Applications
Servo-MotorTranslationStage
Sample
Source Detector
Figure Setup for doing the ensemble average
that the constant component diers the ensemble average does not equal the time
average This variation in the constant component causes the measured temporal
intensity correlation function to vary from speckle to speckle
In order to measure the proper correlation function it is necessary to ensemble
average the signal I do this by moving the sample or sometimes the source and
detector during the integration of a correlation function In this way I measure an
ensemble of constant components and thus obtain the desired ensemble average of the
speckles intensity Moving of the sample aects the correlation function by increasing
the observed intensity uctuation If the motion is slow enough then the decay of
the correlation function due to moving the sample occurs on a time scale that is long
compared to the time scale of interest However if we move the sample too fast then
the ensemble averaging decay overlaps with the decay due to the internal dynamics
A schematic of the system I use for moving the sample is shown in g The
sample is placed on a translation stage which is driven by a servomotor It is import
ant to use a motor which moves smoothly Stepper motors do not work well because
their motion is jerky This jerky motion results in fast intensity uctuations which
obscure the intensity uctuations due to the internal dynamics The speed of the
servomotor is set to move the sample approximately m s It is important to
ensemble average the signal in a localized area If we average over too large of an area

Chapter Experimental Methods
then sourcedetector positions relative to objects in the sample are not welldened
and accurate comparisons with theory cannot be made I use limit switches on the
servomotor to make it oscillate along a m path
Monte Carlo
When the accuracy of my experimental results was questionable or I did not have
the experimental data I used the results from Monte Carlo simulations to check the
accuracy of the correlation diusion equation see section In many cases these
simulations provide a signaltonoise ratio that is dicult to achieve in the laboratory
and therefore permit a more accurate test of the validity of the correlation diusion
theory I run simulations for a point source in an innite medium Media with dierent
dynamical properties are considered I rst gather data for a system with spatially
uniform Brownian motion The correlation diusion equation is known to be valid
for this system at short correlation times Therefore these rst simulations worked
as a test for the Monte Carlo code at early correlation times and to demonstrate the
breakdown of the diusion equation at long correlation times
Next I ran simulations for a homogeneous solid system containing a spherical
region with scatterers undergoing Brownian motion The optical properties of the
spherical region are varied with respect to the background optical properties These
simulations are necessary to unravel systematic discrepancies between experimental
data and correlation diusion theory
Finally simulations are executed for a homogeneous system with dierent volume
fractions of random ow This is a model of tissue blood ow All simulations are
performed assuming isotropic scattering ie g
The theoretical details pertinent to the Monte Carlo simulation are reviewed here
A complete discussion of deriving temporal electric eld correlation functions g
ie given in section The correlation function of light that scatters once from a

Boas Diuse Photon Probes of Turbid Media Theory and Applications
dilute suspension of noninteracting uncorrelated particles is
gs exp
qD!r
E
where q koutkin is the momentum transfer imparted by the scattering event see
g and h!r i is the mean square displacement of the scattering particles in
time The magnitude of the momentum transfer is q ko sin When photons
are multiply scattered by noninteracting uncorrelated particles the correlation func
tion is computed for a given photon path with n uncorrelated scattering events
as
g exp
nXj
qjD!r
EA
qj is the momentum transfer experienced along path at scattering site j
The general procedure for considering multiple paths is to rst relate the total
dimensionless momentum transfer Y Pn
j qjk
o
Pnj cos j to the
dimensionless path length S sl Here s is the length of the photon trajectory
through the sample and l is the photon random walk step length For large n Y is
accurately approximated by the average over the scattering form factor and thus
Y n h cos i nl
l
s
l S
Here hi denotes the average over the scattering form factor and l is the photon
scattering length which equals the photon random walk step length when the scattering
is isotropic Next the total correlation function is obtained from the weighted average
of eq over the distribution of path lengths ie
g Z
P S exp
koD!r
ES
Although P S can be determined using Monte Carlo simulations it is usually found
with the help of the photon diusion equation
This procedure has built into it two assumptions the relation between Y and S
and that P S is accurately given by the photon diusion equation For the purposes
of the Monte Carlo simulations it is desirable to take a dierent approach that doesnt
Chapter Experimental Methods
make these two assumptions As suggested by Middleton and Fisher and Durian
the total correlation function can be obtained from a weighted average over the
total dimensionless momentum transfer experienced by all photon trajectories ie
g Z
P Y exp
Y ko
D!r
E
There are no assumptions in this formulation other than the standard noninteracting
uncorrelated particles assumption The drawback is that P Y cannot be analytically
calculated However Monte Carlo simulations provide a simple numerical approach
to nding P Y for dierent geometries Such Monte Carlo simulations are described
by Middleton and Fisher Durian and Koelink et al
The Monte Carlo simulation follows the trajectory of a photon using the algorithm
described in section with the addition that the dimensionless momentum transfer
Y is incremented in dynamic regions When the photon reaches a detector the Y
associated with that photon is scored in a P Y histogram After sucient statistics
have been accumulated for P Y typically million to million photons g can
then be calculated using eq
Making Resin Phantoms
Intralipid and India ink phantoms are often insucient Either a more permanent
phantom is required or a system with spatially varying optical properties is desired
These properties are not available with Intralipid phantoms since Intralipid spoils
after a few days very much like milk and since it is a liquid it is necessary to use a
physical barrier that perturbs the light eld to separate regions with dierent optical
properties Both of these limitations are overcome with polyester resin phantoms
Polyester resin phantoms are solid and inert The scattering and absorption coef
cients of the solid can be controlled by mixing dierent amounts of scatterer we use
titaniumoxide and dye to the liquid resin before the curing process The resin can
be formed into any shape using an appropriate mold Optical heterogeneities can be
Boas Diuse Photon Probes of Turbid Media Theory and Applications
introduced before or after the curing process The recipe for making a resin phantom
follows

Chapter Experimental Methods
Recipe for Resin Phantoms
Ingredients
Polyester Resin aka Castin Resin from Creative Wholesale
per gallon
Catalyst Creative Wholesale
TitaniumOxide Powder TiO from Sigma Chemical Co product
T per kg
Dye ICI plc product name Pro jet NP
Ethanol
Equipment
Scale with mg accuracy
Test tube with a cap
Sonicator
Ventilation hood
Disposable container for mixing resin titanium oxide and catalyst
Molds
Procedure
Warning all work with polyester resin should be done in a ventilation hood
Find an appropriate mold molds are discussed below
Determine the desired value of s and a for the phantom
Weigh mg of TiO powder for every ml of polyester resin to obtain a s of
cm Put the weighed quantity into a test tube that can be capped
Boas Diuse Photon Probes of Turbid Media Theory and Applications
Weigh mg of dye for every liter of resin to obtain a a of cm Put
the weighed quantity with the TiO
Add ethanol to the TiO and dye Use a volume of ethanol that is to
of the volume of resin to be used
Stir and then sonicate the mixture Stir occasionally to resuspend any clumps
that settle to bottom The mixture needs to be sonicated until the TiO is
completely suspended as well as the dye This takes minutes
Pour the desired amount of resin into the mold or a mixing container if the mold
is not appropriate for mixing
Pour the ethanol TiO and dye mixture into the resin
Stir until uniform
Add catalyst to the resin mixture and stir well For resin volumes greater than
ml use drops of catalyst per liter of resin For smaller volumes you can
use more catalyst eg use drops for ml of resin
If the resin mixture is not yet in the mold then pour it into the mold
Let the sample cure for hours in a ventilation hood
Remove solid resin sample from mold
Machine if desired
Molds
It is important to choose the right mold for forming the resin sample The mold has to
be made of a material that will not react with resin as it is catalyzed Furthermore the
mold has to have smooth surfaces so as to release the resin once it has hardened In
our lab we have found that Tupperware containers PVC and teon make good molds

Chapter Experimental Methods
We use Tupperware when we want a semiinnite medium with a at interface and
the shape of the sides and bottom is not important The at interface comes from the
surface of the resin that is exposed to air We use sheets of PVC to make rectangular
molds when the shape of the edges is important To make cylindrical molds we use
PVC tubing When making large samples ie volumes greater than liters the
resin tends to crack during the curing process We have found that the large diameter
PVC tubing reduces the risk of cracking over rectangular molds Finally we use teon
blocks for hemispherical molds to make spheres The hemispherical molds are drilled
in the teon using ball end mills
Sometimes it is desirable to make resin phantoms with spatially varying optical
properties There are a couple of techniques for doing so One approach is to place
a previously made solid resin object with dierent optical properties in the mold for
the background medium before curing the background medium This works well as
long as care is taken to stabilize the inserted object and to remove any air bubbles
that remain at the liquidsolid interface Phantoms with capillary networks are easy
to make by using teon tubing in the mold to dene the network The tubes are then
easy to remove after the resin has cured provided they dont form too many loops that
greatly increase the resistance to being removed Another approach is to machine the
homogeneous phantom after the curing and then introduce media with dierent optical
properties
Machining
Hardened resin is a soft material that machines well in the lathe mill and drill press
Care must be taken with the band saw to prevent binding of the material with the
blade The ageold advice of cutting away small amounts of material backing up and
repeating is sucient for successfully using the band saw on hardened resin I often
use the lathe to atten the face of a resin block or cylinder I recommend removing
no more than inches of material per cut Removing more material will result in
divots Some people prefer to use the mill to make a at surface but I nd that the

Boas Diuse Photon Probes of Turbid Media Theory and Applications
lathe gives a smoother nish In some instances however the sample is too large for
the lathe and the mill must be used
I next describe the technique for making resin samples with spherical cavities see
section A block with cavity is made by rst squaring o the faces of the block
Then I cut cm of material o the top of the block atten the newly cut surfaces so
that the smaller piece is cm thick use a inch ball end mill to cut a hemisphere
in the center of each of the two newly attened surfaces and drill a mm lling hole
through the thicker block to the hemisphere Next I glue the two pieces together with
resin and catalyst It is necessary to use resin as the glue so as to match the indices
of refraction between the two pieces With other glues the interface is clearly visible
indicating that light propagation is severly perturbed by the interface whereas when
using resin as the glue the interface disappears Note that some glue will seep into the
cavity For this reason I let the glue cure so that gravity will cause seeping resin to
ow into the lling hole I can then remove this material by redrilling the lling hole
after the glue has cured
A cylinder with a cavity is made in a similar way First the cylinder is made
smooth in the lathe Then it is cut in half and the two faces are attened in the lathe
A inch ball end mill is used to cut hemispheres into each piece a mm lling hole
is drilled parallel to the axis of the cylinder and the two pieces are glued together
with resin
Warnings
There are several mistakes that one can make that will ruin the sample Here I list
the ones that I know personally
Use ethanol to suspend the TiO and dye Water does not mix with resin
and TiO has a high anity for water Therefore if the ethanol contains water then
the TiO will preferentially suspend in the water and separate from the resin while the
ethanol easily mixes with the resin This suggests an interesting demonstration Pre
pare identical samples except in one case use ethanol and in the other use

Chapter Experimental Methods
Another interesting demonstration is to mix just water and resin This produces a
highly scattering emulsion that is stable for days if the volume fraction of water is
small enough Unfortunately this emulsion cannot be hardened
Incomplete sonication of the TiO and dye will result in an inhomogeneous sample
This warning holds especially for the TiO The sonication breaks large aggregates
of TiO into submicron crystallites Incomplete sonication will leave behind large
aggregates which when mixed with the resin will quickly settle In addition after
complete sonication it is important not to shake or stir the ethanolTiO mixture
since this often leads to aggregation If the aggregation happens before you have
added the TiO to the resin then simply resonicate Note that even under the best
of circumstances that some settling of TiO will occur during the curing process I
have not seen deviations in the scattering coecient from the top of the sample to
the bottom of the sample any greater than This deviation can be minimized by
stirring the resinTiO and catalyst approximately hour after the initial mixing of
the resin and catalyst The quoted optical properties of TiO and dye in resin are only
approximate Therefore the properties should be measured optically once the sample
has hardened
Note that suspending the TiO in the alcohol can be dicult Add more alcohol if
necessary but not more than the volume of resin to be used If too much ethanol
is used then the resin will not harden but will instead become spongy
We have had diculty making polyester resin samples that were larger than
liters because of sample cracking during the curing process This cracking oc
curs because the polyester resin has a large exothermic reaction with the catalyst
which can result in signicant volume changes Firbank et al have suggested using
an epoxy resin which produces less heat during the curing process
Finally we have observed that xrays will change the absorption coecient of the
resin This was found accidentally when an xray was taken of a sample in the hospital

Boas Diuse Photon Probes of Turbid Media Theory and Applications
Chapter
Summary
Diusing photons can be used to detect localize and characterize optical and dynam
ical spatial inhomogeneities embedded in turbid media Measurements of the intensity
of diuse photons reveals information about the optical properties of a system while
speckle uctuations carry information about the dynamical and optical properties In
this dissertation I have shown that simple diusion theories can be used to accurately
model the intensity signals and speckle correlation signals that diuse through turbid
media with spatially varying properties This work is thus a unication of intensity
and speckle probes of turbid media since the analogous theoretical models allow ideas
and concepts developed for one probe to be easily applied to the other probe I have
also discussed possible biomedical applications for these techniques
The photon diusion equation has an interesting wave solution when the intensity
of the light source is sinusoidally modulated Under these conditions the diusion
equation reduces to a Helmholtz equation For a point source in an innite homo
geneous medium the solution is a scalar intensity wave that propagates spherically
outwards from the source The spherical wave has a complex wavenumber that de
pends on the optical properties and modulation frequency This spherical wave has
been observed and is called a diuse photon density wave DPDW
The theoretical consequence of this solution is that we can neglect the details of the
migration of individual photons and instead focus on the behavior of well understood
classical scalar waves Classical wave theory indicates that waves refract at interfaces
Boas Diuse Photon Probes of Turbid Media Theory and Applications
between media with dierent optical properties eg scattering and absorption in this
case and refractive index in the case of ray optics and are diracted by absorbing
objects
I experimentally demonstrated the refraction and diraction of diuse photon dens
ity waves and showed that standard refraction and diraction models agreed well with
observations I also showed that the interaction of diuse photon density waves with
localized optical inhomogeneities can be treated as a standard scattering problem
whereby the wave detected outside of the object is a superposition of the incident and
scattered waves The scattering solution for diuse photon density waves is analogous
to a scalar version of the Mie scattering theory for electromagentic waves and agrees
well with experimental observation
The photon diusion equation is not valid if the absorption coe cient is larger
than one tenth of the reduced scattering coe cient or if the DPDW modulation fre
quency approahces or exceeds the scattering frequency ie v
s I showed that
higher order approximations to the radiative transport equation give better agreement
with experimental observations under these conditions and that the solutions of these
higher order approximations are still DPDWs but with dierent functional forms for
the wavenumber
Because the scattering of diuse photon density waves is understood inverse scat
tering algorithms can be developed that permit optical inhomogeneities to be localized
and characterized Using realistic models for the intrinsic noise in a measurement I
performed a detailed signaltonoise analysis which reveals the limits to the detection
localization and characterization of optical inhomogeneities I found that dominant
sources of noise are shot noise and noise due to the uncertainties in the positions of
the sources detectors and objects
With best case estimates for these noise levels I found that optical inhomogen
eities representing breast tumors eg contrast in absorption or contrast
in scattering as small as mm can be detected and localized but that the size
and optical properties of the tumor cannot be accurately characterized unless the

Chapter Summary
diameter exceeds cm This signaltonoise analysis can be used to determine the
optimal measurement geometry for object characterization such as determining the
best measurement positions and frequencies The best modulation frequencies are
between and MHz Scattering objects are better characterized with measure
ments at multiple frequencies while no such gain is obtained for absorbing objects
Measurements close to the object give the strongest object signature but a spatially
distributed set of measurements is required for full characterization
The optimal spatial extent for the measurements depends in a detailed way on the
system parameters and is best determined for each specic case With full optimiza
tion it is possible in a best case scenario to characterize tumors as small as mm
embedded in cm of breast tissue Although this length scale cannot compete with
magnetic resonance imaging MRI and xray mammography it may still be clinic
ally useful because of its potential for superior specication Furthermore there are
applications for imaging large scale anomalies such as brain hematomas
The correlation diusion equation provides a simple framework for predicting and
quantifying the speckle correlation functions that are measured on highly scattering
systems with spatially varying dynamical and optical properties Because the correl
ation diusion equation is analogous to the photon diusion equation all concepts
and ideas developed for DPDWs can be directly applied to the diusion of correla
tion I showed experimentally and with Monte Carlo simulations that the diusion of
correlation can be viewed as a correlation wave that propagates spherically outwards
from the source and scatters from macroscopic spatial variations in dynamical andor
optical properties I also demonstrated the utility of inverse scattering algorithms for
reconstructing images of the spatially varying dynamical properties of a turbid media
After laying the theoretical foundation for correlation diusion I illustrated its bio
medical applicability with examples of monitoring blood ow and probing the depth of
burned tissue Combining diuse photon and diuse correlation methods to monitor
noninvasively the behavior of blood during venous and arterial occlusion provides
useful physiological information In particular we saw expected changes in blood

Boas Diuse Photon Probes of Turbid Media Theory and Applications
volume blood oxygen saturation and blood ow including hyperemia during dier
ent stages of venous and arterial occlusion The combination allows us to monitor
oxygen delivery and metabolism noninvasively This technique may be useful for the
diagnosis of various vascular diseases such as thrombosis Correlation diusion may
be used to quantify the depth of severely burned tissue I demonstrated this applic
ation on phantom systems and in the clinic using a pig model My results indicate
that burn thicknesses diering by m can be distinguished both in phantoms and
in the clinic Furthermore I found that the correlation diusion equation accurately
predicts experimental measurements on a layered burn model This suggests that an
inversion algorithm could be developed to quantify burn depth clinically The realiza
tion of this goal will require the combined use of diuse correlation and diuse photon
probes
In this dissertation I have given a complete account of the theory behind photon
diusion and correlation diusion aimed to convince my audience that these diu
sion models are accurate for systems with spatially varying properties and exemplify
the application of these diuse probes to clinical problems There are bound to be
numerous clinical and industrial applications that are yet to be discovered and I hope
that this work stimulates and aids their development
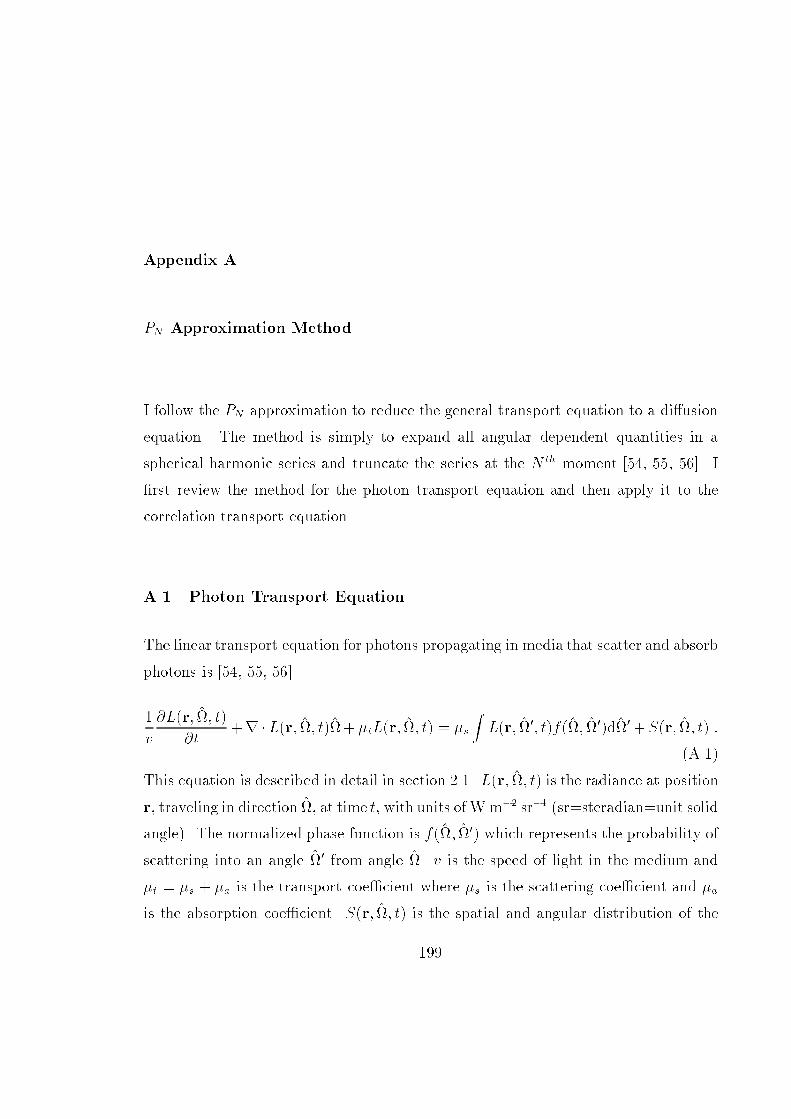
Appendix A
PN Approximation Method
I follow the PN approximation to reduce the general transport equation to a diusion
equation The method is simply to expand all angular dependent quantities in a
spherical harmonic series and truncate the series at the N th moment I
rst review the method for the photon transport equation and then apply it to the
correlation transport equation
A Photon Transport Equation
The linear transport equation for photons propagating in media that scatter and absorb
photons is
v
Lr t
trLr t tLr t s
ZLr tf d Sr t
A
This equation is described in detail in section Lr t is the radiance at position
r traveling in direction at time t with units of Wm sr srsteradianunit solid
angle The normalized phase function is f which represents the probability of
scattering into an angle from angle v is the speed of light in the medium and
t s a is the transport coecient where s is the scattering coecient and a
is the absorption coecient Sr t is the spatial and angular distribution of the

Boas Diuse Photon Probes of Turbid Media Theory and Applications
source with units of W m sr The photon uence is given by
r t Zd Lr t A
while the photon ux or current density is given by
Jr t Zd Lr t A
Both the uence and the ux have units of W m
Within the PN approximation the radiance and source distribution are expanded
as
Lr t NXl
lXml
lmr tYlm A
and
Sr t NXl
lXml
qlmr tYlm A
The photon uence r t is given by see eq A and the components of the
ux Jr t are given by m see eq A The qlmr t are the amplitudes of the
dierent angular moments of the source at position r and time t
For the phase function we make the reasonable assumption that the probability
amplitude is only dependent on the change in direction of the photon and thus
f Xl
l
glPl
Xl
lXml
glY
lm Ylm A
where Plx is a Legendre Polynomial and the second line is obtained using the angular
addition rule The phase function is normalized and therefore g
Substituting these expansions into the photon transport equation eq A we
obtain
NXl
lXml
v
t r t
lmr tYlm qlmYlm
sZd lmr tYlm
Xl
lXml
glY
lm Ylm
A

Appendix A PN Approximation Method
Here t sa is the transport coecient The integral over is calculated using
the orthogonality relation for the spherical harmonics ie
Zd Ylm Y
lm llmm A
The transport equation then becomes
NXl
lXml
v
t r
lt
lmr t qlm
Ylm A
where lt s gl a is the reduced transport coecient
Next we multiply eq A by Y
and integrate over We can use the
orthogonality relation for spherical harmonics eq A on all the terms except the
term with rlmr t The result is
v
t
t
NXl
lXml
Zd rlmYlm Y
q A
The r and t dependence of lm and qlm is assumed
We now focus on the remaining integral First take the dot product between
and the gradient operator so that we have the components xx y
y and z
z The
components of Ylm can be written in terms of spherical harmonics specically
xY
sin cosY
Y
Y
Y
Y
A
yY
sin sinY
i
Y
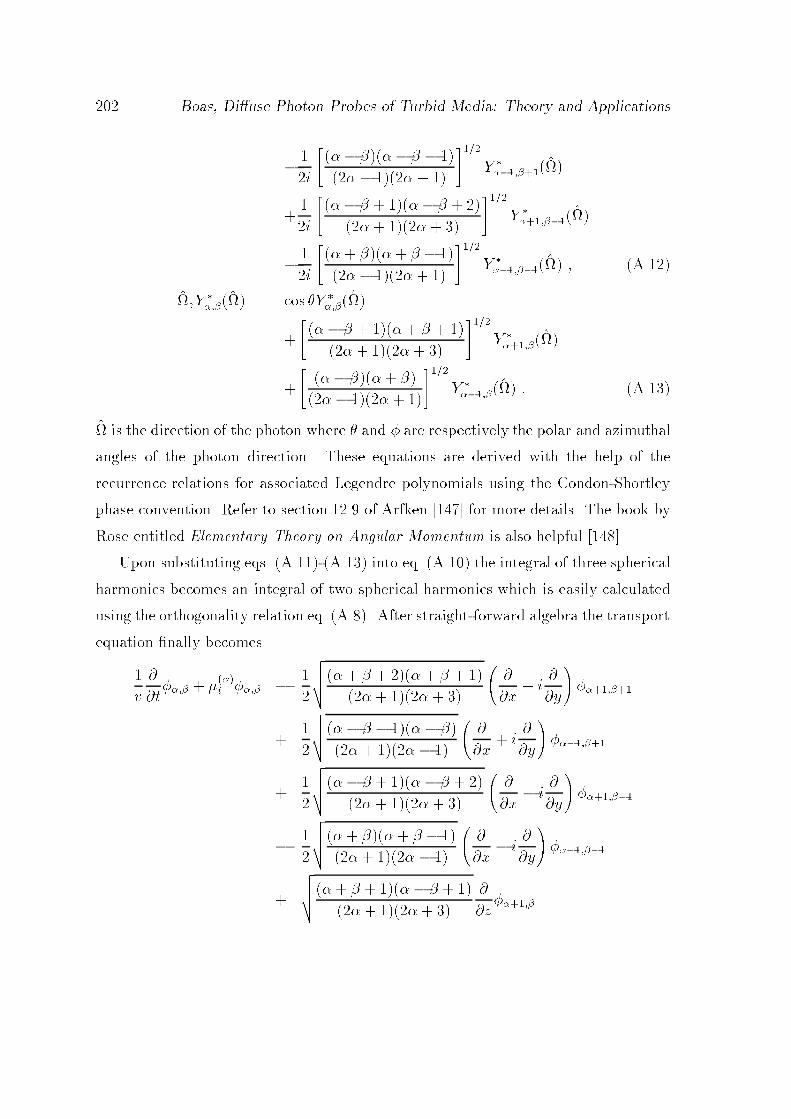
Boas Diuse Photon Probes of Turbid Media Theory and Applications
i
Y
i
Y
i
Y
A
zY
cos Y
Y
Y
A
is the direction of the photon where and are respectively the polar and azimuthal
angles of the photon direction These equations are derived with the help of the
recurrence relations for associated Legendre polynomials using the CondonShortley
phase convention Refer to section of Arfken for more details The book by
Rose entitled Elementary Theory on Angular Momentum is also helpful
Upon substituting eqs AA into eq A the integral of three spherical
harmonics becomes an integral of two spherical harmonics which is easily calculated
using the orthogonality relation eq A After straightforward algebra the transport
equation nally becomes
v
t
t
vuut
x i
y
vuut
x i
y
vuut
x i
y
vuut
x i
y
vuut
z

Appendix A PN Approximation Method
vuut
z q A
This is a coupled set of linear dierential equations for The PN approximation
is obtained by neglecting all and g for N
A P and Diusion Approximation
Within the P approximation the equation gives
v
ta
s
x i
y
s
x i
y
s
z q
A
and the equations give
v
t
t
s
z q A
v
t
t
s
x i
y
q A
v
t
t
s
x i
y
q A
We now transform and the ms in eqs AA into the uence r t
and net ux Jr t The uence is
r t Zd Lr t
Xl
lXml
lm
Zd Ylm
p A
The ms can be gathered in appropriate linear combinations to give the components
of the net ux J The appropriate linear combinations are obtained from the denition
of the net ux recall eq A They are
Jr t Zd Lr t
Xl
lXml
lm
Zd sin cosx sin siny cos zYlm
Boas Diuse Photon Probes of Turbid Media Theory and Applications
s
Xl
lXml
lm
Zd
s
Y
Y
x
is
Y
Y
y
Y
z
Ylm
s
s
x i
s
y z
A
Eqs AA are thus equivalent to
v
tr t ar t r Jr t Sr t A
v
tJr t
t Jr t
rr t Sr t A
Here Sr t and Sr t are respectively the monopole and dipole moments of the
source at position r and time t as dened in eq
Eq A and eq A constitute the P approximation to the photon transport
equation The derivation of the diusion equation from these equations is discussed
in section starting with eq and eq which correspond to eq A
and eq A respectively
A P Approximation
With the P approximation we had four coupled dierential equations to decouple
The P approximation will give us coupled dierential equations In general the
PN approximation will have N coupled dierential equations To simplify
the derivation we can approximate the onedimensional transport equation obtain
a dierential equation for the uence and then extend the onedimensional result to
three dimensions In onedimension we need only concern ourselves with the m
equations and therefore the PN approximation will have N coupled dierential
equations This simplication works because the photon transport equation does
not have a prefered direction and thus all dierential operators that appear in the PN
Appendix A PN Approximation Method
equations will be symmetric under rotations eg r and r We can thus transform
the onedimensional equation to a higher dimension equation by replacing n
znto rn
where n is an integer and r is the dierential operator for the desired dimensional
space In three dimensions r xx
yy
zz This simplication does not work
if the optical properties are spatially varying In this case spatial derivatives of the
optical properties appear that are not spherically symmetric
In one dimension the equation is
v
t a
s
z q A
The equation is
v
t
t
s
z
s
z q A
The equation is
v
t
t
s
z
s
z q A
The equation is
v
t
t
s
z q A
We can decouple these equations to nd an equation for by backsubstitution
First rewrite the equations as
A B q
C D E q
F G H q
I J q
A
The coecientsA through J are given by eq A through eq A First multiply
the third line by J switch the order of J and H and substitute for J from line

Boas Diuse Photon Probes of Turbid Media Theory and Applications
Transposing J and H is okay since we are assuming the optical properties are
spatially uniform The third line of eq A becomes
JF JG HJ Jq
JF JG Hq HI Jq
JF JGHI Jq Hq
A
Next multiply the second line of eq A by JGHI transpose JGHI and
E and substitute for JGHI from the third line of eq A The second line
of eq A becomes
JGHIC JGHID EJG HI
JGHIq
JGHIC JGHID EJq EHq EJF
JGHIq
JGC HIC JGD HID EJF
JGHIq EJq EHq
A
Finally multiply the rst line of eq A by L JGDHIDEJF transpose
L and B and substitute for L from the third line of eq A The rst line of

Appendix A PN Approximation Method
eq A becomes
LA BL
Lq
LA BJGBHIqBEJqBEHq BJGC BHIC
Lq
JGDA HIDA EJFABJGC BHIC
JGD HID EJF q BHI BJGqBEJqBEHq
A
Finally replace the coecients with their denitions from eq A change
z
to r and
zto r and we obtain
r r r Wqr Xqr Y qr Zqr
A
where
v i
v
a
t t t
a
t a
t t
t
A
i v ai
v
t i
v
t i
v
t A
The righthandside of eq A contains the moments of the source distribution
where
W i
v
t
i
v
t
i
v
t
i
v
t
r
i
v
t
r A
X
s
z
s
i
v
t
i
v
t
zA
Y
s
i
v
t
r A
Z
s
zA
Boas Diuse Photon Probes of Turbid Media Theory and Applications
Solutions to the P equation and comparisons with the diusion equation are made
in section
A Correlation Transport Equation
The PN approximation as described for the photon transport equation can be applied
to the correlation transport equation with only a few modications The correlation
transport equation is
rGT r tG
T r s
ZGT r
gs f d Sr
A
Here GT r is the unnormalized temporal eld correlation function which is
a function of position r direction and correlation time The scattering and
absorption coecients are respectively s and a and t s a is the trans
port coecient Furthermore gs is the normalized temporal eld correlation
function for single scattering f is the normalized dierential crosssection and
Sr is the source distribution The scattering coecient is the reciprocal of the
scattering length s l and the absorption coecient is the reciprocal of the ab
sorption length a la The time dependence not to be confused with correlation
time has been left out of the equation since I am only considering measurements with
CW sources The time dependence can be included by adding a timederivative of
GT r ie v
tGT r to the lefthand side of eq A
In analogy to photon transport the correlation uence is
Gr t Zd GT
r A
while the correlation ux is given by
Jgr t Zd GT
r A
The main dierence between the correlation transport equation and the photon
transport equation is the appearance of gs in the integral as discussed in

Appendix A PN Approximation Method
section The appearance of this angular dependent quantity will result in integ
rals of three spherical harmonics which are handled in a fashion similar to the handling
of rlmr t in the photon transport equation see section AWithin the PN approximationGT
r and the source distribution are expanded
as
GT r
NXl
lXml
lmr Ylm A
and
Sr NXl
lXml
qlmrYlm A
For the phase function we make the reasonable assumption that the amplitude is
only dependent on the change in direction of the photon and thus
f Xl
l
glPl
Xl
lXml
glY
lm Ylm A
where Pl is a Legendre Polynomial and the second line is obtained using the angular
addition rule The phase function is normalized and therefore g
The single scattering temporal eld correlation function is
gs exp
qDr
E exp
koDr
E
A
where hr i is the mean square displacement of the scattering particles and q
ko sin is the momentum transfer for the scattered photon where is the angle
between and For particles undergoing Brownian motion hr i DB
whereDB is the Brownian diusion coecient When DBko then eq A
is Taylor expanded to
gs DBk
o DBk
o
DBko DBk
o
Xm
Y
m Ym A

Boas Diuse Photon Probes of Turbid Media Theory and Applications
The second line is obtained using the angular addition rule Note that DBko
s when DB x cm s and the wavelength of light is nm
Substituting these expansions into the correlation transport equation eq A
we obtain
NXl
lXml
h r t
ilmr Ylm qlmYlm
sZd lmr Ylm
NXl
lXml
glY
lm Ylm
DBk
o DBk
o
Xm
Y
m Ym
A
The integral over can be calculated for the rst two terms between the s on the
third line using the spherical harmonic orthogonality relation eq A Integrating
gives
NXl
lXml
h r
lt glkc
ilmr Ylm qlmYlm
kcZd lmr Ylm
NXl
lXml
glY
lm Ylm
Xm
Y
m Ym
A
New notation is introduced to simplify eq A lt sgla is the reduced
transport coecient note t a and kc sDBko is a dynamic absorption
coecient
The Y
m Y
lm and Ym Ylm can be rewritten in terms of single
spherical harmonics given see Arfken section
Ylm Y
s
Bml Ylm
s
Bml Ylm A
Ylm Y
s
AmlYlm
s
Aml Ylm A
Ylm Y
s
Bml Ylm
s
Bml Ylm A
Appendix A PN Approximation Method
The coecients Aml and B
ml are given by
Aml
lml m
l l
A
Bml
lmlm l l
A
The product of spherical harmonics in the integral of eq A can be rewritten
as
Xlm
glYm
l Y m
l X
m
Y m
Y m
Xlm
gl
Bm
l Y m
l Bm
l Y m
l
Bm
l Y m
l Bm
l Y m
l
Am
lYm
l Am
l Ym
l
Am
lYm
l Am
l Ym
l
Bm
l Y m
l Bm
l Yml
Bm
l Y m
l Bm
l Yml
A
Doing the nal integral over we obtain
NXl
lXml
h r
lt glkc
ilmr Ylm qlmYlm
kclm
glB
ml
hBml Y
ml Bm
l Y ml
i
glB
ml
hBmlY
ml Bm
l Y ml
i
glA
ml
hAml Y
ml Am
lYml
i
glA
ml
hAmlY
ml Am
lYml
i
glB
ml
hBm
l Y ml Bm
l Y ml
i
glB
ml
hBm
lYml Bm
l Y ml
i A

Boas Diuse Photon Probes of Turbid Media Theory and Applications
Next we multiply eq A by Y
and integrate over Using the ortho
gonality relations for the spherical harmonics eq A we arrive at
t gkc
kc
hgB
B
gB
B
i
hgB
B
gB B
i
hgA
A
gA
A
i
hgA
A
gA
A
i
hgB
B gB
B
i
hgB
B gB
B
i
B
x i
y
B
x i
y
B
x i
y
B
x i
y
A
z A
z q A
This is a coupled set of linear dierential equations for
To obtain the correlation diusion equation we neglect all and g for
The equation is
a kc g
s
x i
y
s
x i
y
s
z q A
and the equations are
t
g
kc
s
x i
y
q A
t
g
kc
s
z q A

Appendix A PN Approximation Method
t
g
kc
s
x i
y
q A
Using the denition for the correlation uence Gr eq A and the cor
relation ux Jgr eq A the and equations can be rewritten
as
aGr
sk
o
Dr
EGr r Jgr Sr A
t Jgr
s
g
koDr
EJgr
rGr Sr A
Recall that we have assumed that the correlationGT r is nearly isotropic and that
the scattering particles have moved a distance that is much smaller than a wavelength
of light The rst assumption is satised when a s and the scattering is not
too anisotropic The second assumption is satised when ko hr i To keep
our equations consistent with these approximations it is necessary to drop terms from
eq A in particular
sJgr
rGr Sr A
Decoupling eq A and eq A for Gr we arrive at the correlation diusion
equation
r
vDr
a
sk
o
Dr
EGr Srr
vDSr
A
where D vs is the photon diusion coecient

Boas Diuse Photon Probes of Turbid Media Theory and Applications
Appendix B
HenyeyGreenstein Phase Function
The normalized HenyeyGreenstein phase function is
f fcos g
g g cos B
where is the angle between the input direction and the output direction and g
is the scattering anisotropy The angle is in the interval This phase function
is unique because the average cosine of the scattering angle is g
hcos i Z
fcos cos sin d g B
and higher moments of the scattering angle are gl
Z
fcos Plcos sin d gl B
Plcos is a Legendre polynomial of order l
Boas Diuse Photon Probes of Turbid Media Theory and Applications
Appendix C
Monte Carlo Code
Following is the listing of the Monte Carlo code that I used to simulate the propagation
of diuse photon density waves and temporal correlation through turbid media The
code is written to handle innite and semiinnite media which is either homogeneous
or contains a spherical inhomogeneity with dierent optical and dynamical properties
When running simulations with a spherical object the optical properties of the back
ground and object can be anything The background is assumed static and the object
is dynamic
This code is compiled using
gcc o monte montec ranc ranc ranc lm
or an equivalent Parameters for the simulation are entered on the command line using
the following format
unix prompt monte nphotons musp mua musp mua radius sz dz DeltaYmax
DeltaYstep output file
nphotons is the number of photons to run in the simulation musp and mua are
the reduced scattering and absorption coecent of the background medium musp
mua and radius are the reduced scattering and absorption coecent and radius
of the spherical object if it exists sz and dz are the z coordinates of the source
and detector DeltaYmax and DeltaYstep determine the range over which the total
momentum transfer from moving particles is histogrammed output file is the le
name for the data generated by the simulation

Boas Diuse Photon Probes of Turbid Media Theory and Applications
The code can be compiled in many dierent modes each of which runs a sim
ulation for a dierent geometry Which mode the code runs in is determined by
the dene statements for HOMOGENEOUS INFINITE COLLIMATED SPHER
ICAL DETECTOR and PARTIAL DYNAMIC in the beginning of the program If
HOMOGENEOUS is dened then the medium is homogeneous otherwise a spher
ical object is centered at the origin If INFINITE is dened then the medium is
innite otherwise it is semiinnite The source is collimated in the z direction
if COLLIMATED is dened otherwise the source is isotropic If INFINITE and
HOMOGENEOUS are dened and COLLIMATED is not dened then the spherical
symmetry of the geometry can be exploited by using spherical detectors This is
done by dening SPHERICAL DETECTOR otherwise ring detectors which lie in
a plane are used For ring detectors the detection plane is in the xy plane at the
zcoordinate dz and the source is at xy and zsz For spherical detectors the
source is at xyz Finally the medium can be homogeneous with a uniformly
distributed static and dynamic component This is a model of capillary blood ow
This geometry is set by dening PARTIAL DYNAMIC where VOL FRAC is dened
as the volume fraction actually Pblood see section of the dynamic component
If PARTIAL DYNAMIC is not dened then the system is ! dynamic
Two dierent sets of output are generated The rst set contains the time domain
data A le is generated for each detector position The le names are
output file tdd where the indicates the detector position and tdd
indicates time domain data The second set contains the total momentum transfer
data Once again a le is generated for each detector position The le names are
output file DelY where the indicates the detector position and DelY
indicates momentum transfer data The formats are self explanatory
C montec
includestdiohincludestdlibh
includemathh
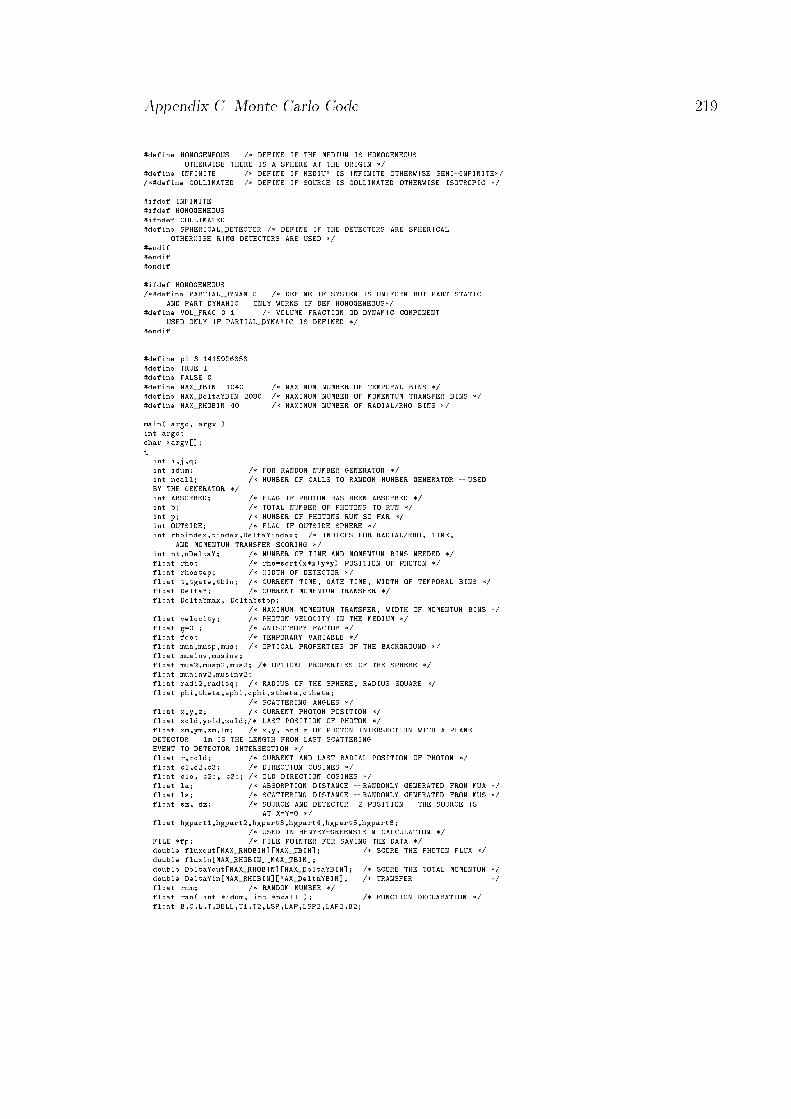
Appendix C Monte Carlo Code
define HOMOGENEOUS DEFINE IF THE MEDIUM IS HOMOGENEOUSOTHERWISE THERE IS A SPHERE AT THE ORIGIN
define INFINITE DEFINE IF MEDIUM IS INFINITE OTHERWISE SEMIINFINITEdefine COLLIMATED DEFINE IF SOURCE IS COLLIMATED OTHERWISE ISOTROPIC
ifdef INFINITEifdef HOMOGENEOUSifndef COLLIMATEDdefine SPHERICALDETECTOR DEFINE IF THE DETECTORS ARE SPHERICAL
OTHERWISE RING DETECTORS ARE USED endifendifendif
ifdef HOMOGENEOUSdefine PARTIALDYNAMIC DEFINE IF SYSTEM IS UNIFORM BUT PART STATIC
AND PART DYNAMIC ONLY WORKS IF DEF HOMOGENEOUSdefine VOLFRAC VOLUME FRACTION OD DYNAMIC COMPONENT
USED ONLY IF PARTIALDYNAMIC IS DEFINED endif
define pi define TRUE define FALSE
define MAXTBIN MAXIMUM NUMBER OF TEMPORAL BINS define MAXDeltaYBIN MAXIMUM NUMBER OF MOMENTUM TRANSFER BINS define MAXRHOBIN MAXIMUM NUMBER OF RADIALRHO BINS
main argc argv int argcchar argv
int ijqint idum FOR RANDOM NUMBER GENERATOR int ncall NUMBER OF CALLS TO RANDOM NUMBER GENERATOR USEDBY THE GENERATOR int ABSORBED FLAG IF PHOTON HAS BEEN ABSORBED int b TOTAL NUMBER OF PHOTONS TO RUN int p NUMBER OF PHOTONS RUN SO FAR int OUTSIDE FLAG IF OUTSIDE SPHERE int rhoindextindexDeltaYindex INDICES FOR RADIALRHO TIME
AND MOMENTUM TRANSFER SCORING int ntnDeltaY NUMBER OF TIME AND MOMENTUM BINS NEEDED float rho rhosqrtxxyy POSITION OF PHOTON float rhostep WIDTH OF DETECTOR float ttgatetbin CURRENT TIME GATE TIME WIDTH OF TEMPORAL BINS float DeltaY CURRENT MOMENTUM TRANSFER float DeltaYmax DeltaYstep
MAXIMUM MOMENTUM TRANSFER WIDTH OF MOMENTUM BINS float velocity PHOTON VELOCITY IN THE MEDIUM float g ANISOTROPY FACTOR float foo TEMPORARY VARIABLE float muamuspmus OPTICAL PROPERTIES OF THE BACKGROUND float muainvmusinvfloat muamuspmus OPTICAL PROPERTIES OF THE SPHERE float muainvmusinvfloat radiradisq RADIUS OF THE SPHERE RADIUS SQUARE float phithetasphicphisthetactheta
SCATTERING ANGLES float xyz CURRENT PHOTON POSITION float xoldyoldzold LAST POSITION OF PHOTON float xmymzmlm xy and z OF PHOTON INTERSECTION WITH A PLANEDETECTOR lm IS THE LENGTH FROM LAST SCATTERINGEVENT TO DETECTOR INTERSECTION float rrold CURRENT AND LAST RADIAL POSITION OF PHOTON float ccc DIRECTION COSINES float co co co OLD DIRECTION COSINES float la ABSORPTION DISTANCE RANDOMLY GENERATED FROM MUA float ls SCATTERING DISTANCE RANDOMLY GENERATED FROM MUS float sz dz SOURCE AND DETECTOR Z POSITION THE SOURCE IS
AT XY float hgparthgparthgparthgparthgpart hgpart
USED IN HENYEYGREENSTEIN CALCULATION FILE fp FILE POINTER FOR SAVING THE DATA double fluxoutMAXRHOBINMAXTBIN SCORE THE PHOTON FLUX double fluxinMAXRHOBINMAXTBIN
double DeltaYoutMAXRHOBINMAXDeltaYBIN SCORE THE TOTAL MOMENTUM double DeltaYinMAXRHOBINMAXDeltaYBIN TRANSFER float rnm RANDOM NUMBER float ran int idum int ncall FUNCTION DECLARATION float BCLTDELLTTLSPLAPLSPLAPB
Boas Diuse Photon Probes of Turbid Media Theory and Applications
USED FOR SPHERE INTERSECTION ROUTINE BC to be used in BAC calculation L T are also for cross passing entering sphere etc checks BBAC
TTT are for parameterizations DELLdelta L LSP ls temp LAP la temp
char filenm FILE NAME FOR DATA FILE
GET THE COMMAND LINE ARGUMENTS if argc printf usage monte nphotons musp mua musp mua radius sz dz DeltaYmax DeltaYstep outputfilen exit
GET THE NUMBER OF PHOTONS TO MIGRATE sscanf argv !f "foo b intfoo
GET THE OPTICAL PROPERTIES mua " musp are for background medium mua " musp are for the spherical tumor all variables with
## as the last character are for the tumor sscanf argv !f "musp mus muspg musinv mus
sscanf argv !f "mua muainv muasscanf argv !f "musp mus muspg musinv mussscanf argv !f "mua muainv mua
GET THE SPHERE RADIUS radi is the radius of the spherical tumor radisq is for cross pass calculation sscanf argv !f "radi radisqradiradi
SOURCE AND DETECTOR Z POSITION sscanf argv$ !f "sz sscanf argv !f "dz
RANGE OF MOMENTUM TRANSFERS AND BIN STEP sscanf argv !f "DeltaYmax sscanf argv !f "DeltaYstep
INITIALIZE OTHER PARAMETERS velocity $e PHOTON VELOCITY IN WATER g SCATTERING ANISOTROPY tbine tgatee TEMPORAL BIN WIDTH AND GATE rhostep DETECTOR WIDTH
CALCULATE THE NUMBER OF TEMPORAL AND MOMENTUM BINS THAT ARE NEEDED nt tgatetbinnDeltaY DeltaYmaxDeltaYstep
MAKE SURE THAT ENOUGH MEMORY HAS BEEN ALLOCATED FOR THE NEEDED BINS if ntMAXTBIN
printf Maximum number of time bins exceeded exit
if nDeltaYMAXDeltaYBIN printf Maximum number of DeltaY bins exceeded
exit
INITIALIZE THE FLUX TO BE ZERO for i iMAXRHOBIN i
for j jnt j fluxinij fluxoutij
INITIALIZE DeltaY TO ZERO for i iMAXRHOBIN i
for j jnDeltaY j DeltaYinij DeltaYoutij
NUMBER PHOTONS EXECUTED SO FAR p
SEED THE RANDOM NUMBER GENERATOR A LARGE NEGATIVE NUMBER IS REQUIRED idum ncall NUMBER OF CALLS MADE TO THE GENERATOR

Appendix C Monte Carlo Code
START MIGRATING THE PHOTONS GENERATING PHOTONS UNTIL NUMBER OF PHOTONS EXECUTED p IS EQUAL TO THE
NUMBER TO BE GENERATED b
while pbOUTSIDEFALSE START OUTSIDE THE OBJECT ABSORBEDFALSE PHOTON NOT ABSORBED YET
t START PHOTON AT TIME DeltaY NO SCATTERING FROM A MOVING PARTICLE YET
ZERO MOMENTUM TRANSFER p INCREMENT THE PHOTONS EXECUTED COUNTER
INITIAL SOURCE POSITION x y zsz CURRENT POSITION xoldx yoldy zoldz PREVIOUS POSITION
RADIAL POSITION OF PHOTONUSED FOR CHECKING FOR INTERSECTIONS WITH SPHERICAL DETECTORSAND THE SPHERICAL OBJECT
r sqrtxxyyzz RADIAL POSITION OF PHOTON rold r OLD RADIAL POSITION
INITIAL DIRECTION OF PHOTON
ifdef COLLIMATED COLLIMATED ALONG ZAXIS c cocc cocc coc
endififndef COLLIMATED
ISOTROPIC rnm ran"idum"ncallphipirnmcphicosphisphisinphirnm ran"idum"ncallthetaacosrnmcthetacosthetasthetasinthetac sthetacphi
c sthetasphic cthetaco cco cco c
endif
LOOP UNTIL TIME EXCEEDS GATE PHOTON IS ABSORBED OR PHOTON ESCAPES ifndef INFINITE SEMIINFINITE MEDIUM
while ttgate "" ABSORBEDFALSE "" zsz endififdef INFINITE INFINITE MEDIUM
while ttgate "" ABSORBEDFALSE endif
CALCULATE SCATTERING AND ABSORPTION LENGTHS
ifdef HOMOGENEOUS HOMOGENEOUS MEDIUM rnm ran"idum"ncallls musinv logrnmrnm ran"idum"ncallla muainv logrnmOUTSIDETRUEiflsla
Lls else
LlaABSORBEDTRUE
ACCUMULATE THE MOMENTUM TRANSFER FROM A MOVING PARTICLE ifndef PARTIALDYNAMIC
DeltaY ccoccoccoendif
ifdef PARTIALDYNAMICrnm ran"idum"ncallif rnmVOLFRAC DeltaY ccoccocco
endifendif

Boas Diuse Photon Probes of Turbid Media Theory and Applications
ifndef HOMOGENEOUS HETEROGENEOUS MEDIUM IE A SPHERE IS PRESENT CHECK IF WE ARE OUTSIDE THE SPHERE OR INSIDE THE SPHERE ifradir
rnm ran"idum"ncalllsmusinv logrnmrnm ran"idum"ncalllamuainv logrnmOUTSIDETRUE
else
INCREMENT TOTAL WAVEVECTOR TRANSFER IF INSIDE SPHEREDeltaY ccoccocco
rnm ran"idum"ncalllsmusinvlogrnmrnm ran"idum"ncalllamuainvlogrnmOUTSIDEFALSE
CHECK FOR INTERSECTIONS WITH THE SURFACE OF THE SPHERE
CALCULATE ABC
rold rBxoldcyoldczoldcCroldroldradisqBBBC
CALCULATE MINIMUM DISTANCE iflsla
Lls else
LlaABSORBEDTRUE
FINE TUNE if OUTSIDE
if B
TBsqrtBTBsqrtB
FIND IF WE INTERSECTED THE TUMOR IE ENTERED IT ifT "" TL %% T "" TL
FIND MINIMUM OF T Tif TT
DELLTTT
else
DELLTTT
LDELL
LSPlsDELLmusinvmuainvLAPlaDELLmuainvmuainv
CHECK IF WE CROSSED OUT THE TUMOR ifLSPTDELL "" LAPTDELL
LTLSPLSPTDELLmusinvmusinvLAPLAPTDELLmuainvmuainvifLSPLAP
LLSPABSORBEDFALSE
else
LLAPABSORBEDTRUE
STILL INSIDE THE TUMOR else
ifLSPLAPLLSPABSORBEDFALSE

Appendix C Monte Carlo Code
else
LLAPABSORBEDTRUE
END OF INTERSECTION WITH TUMOR
INSIDE TUMOR else
TBsqrtBTBsqrtB
FIND IF WE INTERSECTED THE TUMOR IE EXITED IT ifT "" TL %% T "" TL
FIND MAXIMUM OF T Tif TT
DELLT
elseDELLT
LDELLLSPlsDELLmusinvmusinvLAPlaDELLmuainvmuainv
ifLSPLAPLLSPABSORBEDFALSE
else
LLAPABSORBEDTRUE
END OF INSIDE TUMOR endif
CALCULATE THE NEW POSITION xold xyold yzold zrold r
xxoldLcyyoldLczzoldLcrsqrtxxyyzz
SCORE THE PHOTON
INCREMENT THE TIME tLvelocity
SCORE THE PHOTON WITH A RING DETECTOR ifndef SPHERICALDETECTOR
if zdz "" zolddz lmzolddzzoldzLxmxoldlmcymyoldlmcrhosqrtxmxmymymrhoindexintfloorrhorhostep tindex tlmvelocitytbintindex ttbinDeltaYindexintceilDeltaYDeltaYstepif rhoindexMAXRHOBIN "" tindexMAXTBIN
fluxoutrhoindextindexc THE EFFECTIVE WIDTH OF THEDETECTOR VARIES WITH THEANGLE OF INCIDENCE NORMALIZEOUT THIS DEPENDENCE ON ANGLE
fluxoutrhoindextindexif DeltaYindexMAXDeltaYBIN
DeltaYoutrhoindexDeltaYindex

Boas Diuse Photon Probes of Turbid Media Theory and Applications
ifdef INFINITEif zdz "" zolddz
lmzolddzzoldzLxmxoldlmcymyoldlmcrhosqrtxmxmymymrhoindexintfloorrhorhostep tindex tlmvelocitytbintindex ttbinDeltaYindexintceilDeltaYDeltaYstepif rhoindexMAXRHOBIN "" tindexMAXTBIN
fluxinrhoindextindexc THE EFFECTIVE WIDTH OF THEDETECTOR VARIES WITH THEANGLE OF INCIDENCE NORMALIZEOUT THIS DEPENDENCE ON ANGLE
fluxinrhoindextindexif DeltaYindexMAXDeltaYBIN
DeltaYinrhoindexDeltaYindex
endifendif
SCORE THE PHOTON WITH SPHERICAL DETECTORS
ifdef SPHERICALDETECTORtindex ttbinDeltaYindexintceilDeltaYDeltaYstepif rrold
rhoindex intceilrrhostepwhile floatrhoindexrhosteprold
if rhoindexMAXRHOBIN fluxinrhoindextindexif DeltaYindexMAXDeltaYBIN
DeltaYinrhoindexDeltaYindex rhoindex
if rrold
rhoindex intceilroldrhostepwhile floatrhoindexrhostepr
if rhoindexMAXRHOBIN fluxoutrhoindextindexif DeltaYindexMAXDeltaYBIN
DeltaYoutrhoindexDeltaYindex rhoindex
endif
CALCULATE THE NEW SCATTERING ANGLE ASSUMING ISOTROPIC SCATTERING rnm ran"idum"ncallphipirnmcphicosphisphisinphirnm ran"idum"ncall
thetaacosrnmcthetacosthetasthetasintheta
CALCULATE THE NEW SCATTERING ANGLE USING HENYEYGREENSTEIN phipirnm
cphicosphisphisinphirnm ran"idum"ncallhgpartgghgpartgghgpartggrnmhgparthgparthgparthgpart ghgparthgparthgpartfoo hgparthgparthgparthgpart thetaacosfoosthetasintheta
cthetacostheta
co cco cco c

Appendix C Monte Carlo Code
c sthetacphic sthetasphic ctheta
LOOP UNTIL END OF SINGLE PHOTON LOOP UNTIL ALL PHOTONS EXHAUSTED
SAVE TIME DOMAIN DATA USING A FORMAT UNDERSTOOD BY PMI for q qMAXRHOBIN q
rho rhostep floatqsprintf filenm !s! ftdd argv rho fpfopen filenm wfprintf fp !d !e n nt tgate fprintf fp !f !d nsz b
ifndef SPHERICALDETECTORfprintf fp !f !fn rhorhostep dz
endififdef SPHERICALDETECTOR
fprintf fp !f n rhoendif
for tindex tindexnt tindex ifndef SPHERICALDETECTOR
fprintffp!lfnfloatfluxinqtindexfluxoutqtindexpirhosteprhosteppirhosteprhoendififdef SPHERICALDETECTOR
fprintffp!lfnfloatfluxinqtindexfluxoutqtindexpirhorhoendif
fclosefp
SAVE MOMENTUM TRANSFER DATA for q qMAXRHOBIN q
rho rhostep floatqsprintf filenm !s! fDelY argv rho fpfopen filenm wfprintf fp !d !e !en nDeltaY DeltaYmax DeltaYstep fprintf fp !f !d nsz b
ifndef SPHERICALDETECTORfprintf fp !f !fn rhorhostep dz
endififdef SPHERICALDETECTOR
fprintf fp !f n rhoendif
for DeltaYindex DeltaYindexnDeltaY DeltaYindex ifndef SPHERICALDETECTOR
fprintffp!lfnfloatDeltaYinqDeltaYindexDeltaYoutqDeltaYindexpirhosteprhosteppirhosteprho
endififdef SPHERICALDETECTOR
fprintffp!lfnfloatDeltaYinqDeltaYindexDeltaYoutqDeltaYindexpirhorhoendif
fclosefp
C ranc
I use a combination of two random number generators from Numerical Recipes in
C This particular routine was strongly suggested by Dr Murray Penney at
GECRD in Schenectady NY Dr Penney has thoroughly tested the randomness of
this routine
include stdioh
include mathh
Boas Diuse Photon Probes of Turbid Media Theory and Applications
static long idum
float ran int idum int ncall
float rnfloat ran int idum float ran long idum
ncall ncall if ncall idum idum$if fmodncalle idumran"idumrn ranidum
if rne rneranidumif rn rne
return rn
C ranc
This routine is from Numerical Recipes in C
include mathh
define M $ define IA define IC
float ranidumlong idumstatic long iyirstatic int iffint jvoid nrerror
if idum %% iff iffif idumICidum ! M idum idumfor jj$j idumIAidumIC ! Mirjidum idumIAidumIC ! Miyidum j $iyMif j $ %% j nrerrorRAN This cannot happeniyirjidumIAidumIC ! Mirjidumreturn float iyM
undef Mundef IAundef IC
C ranc
This routine is from Numerical Recipes in C
define MBIG define MSEED define MZ define FAC MBIG

Appendix C Monte Carlo Code
float ranidumint idumstatic int inextinextpstatic long ma static int ifflong mjmkint iiik
if idum %% iff iffmjMSEEDidum & idum idummj ! MBIGma mjmkfor ii i iii ! maiimkmkmjmkif mk MZ mk MBIGmjmaii for kkkfor ii i
mai mai ! if mai MZ mai MBIG inextinextpidum if inext inextif inextp inextpmjmainextmainextpif mj MZ mj MBIGmainextmjreturn mjFAC
undef MBIGundef MSEED
undef MZundef FAC
Boas Diuse Photon Probes of Turbid Media Theory and Applications

Bibliography
B Chance ed Photon Migration in Tissues Plenum Press
A Yodh and B Chance Spectroscopy and imaging with diusing light Physics
Today
B J Tromberg L O Svaasand T Tsay and R C Haskell Properties of photon
density waves in multiplescattering media Applied Optics
M S Patterson B Chance and B C Wilson Time resolved reectance and
transmittance for the noninvasive measurement of tissue optical properties Ap
plied Optics
G A Millikan Experiments on muscle haemoglobin in vivo The instantaneous
measurement of muscle metabolism Proc Roy Soc London B
G A Millikan The oximeter an instrument for measuring continuously the
oxygen saturation of arterial blood in man Rev Sci Instrum
F F Jobsis Nonivasive infrared monitoring of cerebral and myocardial oxygen
suciency and circulatory parameters Science
J M Schmitt Simple photon diusion analysis of the eects of multiple scatter
ing on pulse oximetry IEEE Transaction on Biomedical Engineering
M R Neuman Pulse oximetry physical principles technical realization and
present limitations Adv Exp Med Biol
Boas Diuse Photon Probes of Turbid Media Theory and Applications
J W Severinghaus History and recent developments in pulse oximetry Scand
inavian J of Clinical and Laboratory Investigations
W F Cheong S A Prahl and A J Welch A review of the optical propeties
of biological tissues IEEE J Quantum Electronics
B C Wilson E M Sevick M S Patterson and B Chance Timedependent
optical spectroscopy and imaging for biomedical applications Proceedings of the
IEEE
See related works by S R Arridge et al J P Kaltenbach et al and R L
Barbour et al in G Muller et al edsMedical Optical Tomography Functional
Imaging and Monitoring SPIE Optical Engineering Press Bellingham WA
Vol IS pp
S R Arridge P ven der Zee M Cope and D T DelpyReconstruction methods
for infrared absorption imaging SPIE
S P Gopinath C S Robertson R G Grossman and B Chance Nearinfrared
spectroscopic localization of intracranial hematomas J Neurosurg
A P Shepherd and P A Oberg eds LaserDoppler Blood Flowmetry Kluwer
Academic Press Boston
L E Drain in The Laser Doppler Technique J Wiley New York
G V Belcaro U Homann A Bollinger and A N Nicolaides eds Laser
Doppler MedOrion Publishing Company London
A D Edwards C Richardson P van der Zee M Cope and D T Delpy
Measurement of hemoglobin ow and blood ow by nearinfrared spectroscopy
Journal of Applied Physiology
Bibliography
E M Sevick B Chance J Leigh S Nioka and M Maris Quantitation of
time and frequencyresolved optical spectra for the determination of tissue oxy
genation Analytical Biochemistry
J B Fishkin and E Gratton Propagation of photon density waves in strongly
scattering media containing an absorbing semiinnite plane bounded by a
straight edge J Opt Soc of Am A
M A OLeary D A Boas B Chance and A G Yodh Refraction of diuse
photon density waves Phys Rev Lett
B W Pogue and M S Patterson Frequencydomain opticalabsorption spectro
scopy of nite tissue volumes using diusiontheory Phys Med Biol
S J Matcher C E Elwell C E Cooper M Cope and D T Delpy Per
formance comparison of several published tissue nearinfrared spectroscopy al
gorithms Analytical Biochemistry
H Liu D A Boas Y Zhang A G Yodh and B Chance Determination of
optical properties and blood oxygenation using continuous NIR light Phys Med
Biol
V G Peters D R Wyman M S Patterson and G L Frank Optical properties
of normal and diseased human breast tissues in the visible and near infrared
Phys Med Biol
A table of published optical properties compiled by Lihong Wang and Steve
Jacques is available at
ftp""lasermdauthtmcedu"pub"tissue"Cheongmsw or
ftp""lasermdauthtmcedu"pub"tissue"Cheongps
Boas Diuse Photon Probes of Turbid Media Theory and Applications
D A Boas M A OLeary B Chance and A G Yodh Scattering and
wavelength transduction of diuse photon density waves Phys Rev E
R
D A Boas M A OLeary B Chance and A G Yodh Scattering of diuse
photon density waves by spherical inhomogeneties within turbid media analytic
solution and applications Proc Natl Acad Sci USA
P N den Outer T M Nieuwenhuizen and A Lagendijk Location of objects
in multiplescattering media J Opt Soc Am A
S Feng F Zeng and B Chance Photon migration in the presence of a single
defect a perturbation analysis Appl Opt
J M Schmitt A Knuttel and J R Knutson Interference of diusive light
waves J Opt Soc Am A
B Chance K Kang L He J Weng and E Sevick Highly sensitive object loc
ation in tissue models with linear inphase and antiphase multielement optical
arrays in one and two dimensions Proc Natl Acad Sci USA
J Maier and E Gratton Frequency domain methods in optical tomography
Detection of localized absorbers and a backscattering reconstruction scheme in
B Chance and R R Alfano eds Proceedings of Photon Migration and Imaging
in Random Media and Tissues SPIE Optical Engineering Press Bellingham
WA Vol pp
A Knuttle J M Schmitt and J R Knutson Spatial Localization of Absorbing
Bodies by Interfering Diusive Photon Density Waves Applied Optics
N A Clark J H Lunacek and G B Benedek A study of Brownian motion
using light scattering American Journal of Physics

Bibliography
P J Berne and R Pecora in Dynamic Light Scattering Wiley New York
B J Berne and R Pecora in Dynamic Light Scattering with Applications
to Chemistry Biology and Physics Robert Krieger Publishing Co Florida
W Brown ed Dynamic Light Scattering The Method and Some Applications
Clarendon Press New York
G G Fuller J M Rallison R L Schmidt and L G Leal The measurement
of velocity gradients in laminar ow by homodyne lightscattering spectroscopy
J Fluid Mech
P Tong W I Goldburg C K Chan and A Sirivat Turbulent transition by
photoncorrelation spectroscopy Phys Rev A
M Bertolotti B Crosignani P Di Porto and D Sette Light scattering by
particles suspended in a turbulent uid J Phys A
P J Bourke J Butterworth L E Drain P A Egelsta E Jakeman and E R
Pike A study of the spatial structure of turbulent ow by intensityuctuation
spectroscopy J Phys A
T Tanaka C Riva and I BenSira Blood velocity measurements in human
retinal vessels Science
M Stern In vivo evaluation of microcirculation by coherent light scattering
Nature
R Bonner and R Nossal Model for laser Doppler measurements of blood ow
in tissue Applied Optics

Boas Diuse Photon Probes of Turbid Media Theory and Applications
H Z Cummings and E R Pike eds Photon Correlation and LightBeating
Spectroscopy Vol of NATO Advanced Study Institute Series B Physics
Plenum New York
D J Pine D A Weitz P M Chaikin and Herbolzheimer Diusingwave
spectroscopy Phys Rev Lett
F C MacKintosh and S John Diusingwave spectroscopy and multiple scat
tering of light in correlated random media Phys Rev B
G Maret and P E Wolf Multiple light scattering from disordered media The
eect of brownian motion of scatterers Z Phys B
A Y Valkov and V P Romanov Sov Phys JETP Zh Eksp
Teor Fiz
J D Briers Laser Doppler and timevarying speckle A reconciliation J Opt
Soc of Am A
M A OLeary D A Boas B Chance and A G Yodh Experimental images of
heterogeneous turbid media by frequencydomain diusingphoton tomography
Optics Letters
K M Case and P F Zweifel in Linear Transport Theory AddisonWesley
MA
B Davison and J B Sykes in Neutron Transport Theory Oxford Unversity
Press London
S Glasstone and M C Edlund in the Elements of Nuclear Reactor Theory D
van Nostrand Co Princeton NJ
B J Ackerson R L Dougherty N M Reguigui and U Nobbman Correlation
transfer Application of radiative transfer solution methods to photon correla
tion problems J Thermophys and Heat Trans
Bibliography
R L Dougherty B J Ackerson N M Reguigui F DorriNowkoorani and
U Nobbmann Correlation transfer Development and application J Quant
Spectrosc Radiat Transfer
J E Fernandez and V G Molinari Diusion of polarized photons in the frame
of the transport theory Nuclear Instruments and Methods in Physics Research
S Chandrasekhar in Radiative Transfer Dover New York
R Aronson Subcritical problems in spherical geometry Nuclear Science and
Engineering
M D Alexandrov V S Remizovich and D B Rogozkin Multiple light scat
tering in a twodimensional medium with large scatterers J Opt Soc Am A
J D Jackson in Classical Electrodynamics Wiley and Sons Inc New York
K Furutsu and Y Yamada Diusion approximation for a dissipative random
medium and the applications Phys Rev E
A H Gandjbakhche R F Bonner and R Nossal Scaling relationships for
anisotropic random walks J Stat Phys
A H Gandjbakhche R Nossal and R F Bonner Scaling relationships for
theories of anisotropic random walks applied to tissue optics Applied Optics
R Graa M H Koelink F F M de Mul W G Zijlstra A C M Dassel
and J G Aarnoudse Condensed Monte Carlo simulations for the description
of light transport Applied Optics
Boas Diuse Photon Probes of Turbid Media Theory and Applications
E Gratton W Mantulin M J van de Ven J Fishkin M Maris and B
Chance in Proceedings of the Third International Conference Peace through
MindBrain Science Hamamatsu Photonics KK Hamamatsu p
For an interesting example of a diusion wave in the context of heat conduc
tion see A Sommerfeld in Partial Dierential Equations in Physics Academic
Press NY p
A M Zhabotinsky M D Eager and I R Epstein Refraction and reection
of chemical waves Phys Rev Lett
The Intralipid used here can be obtained from Kabi Pharmacia in Clayton
North Carolina
H J van Staveren C J M Moes J van Marle S A Prahl and M J C van
Gemert Light scattering in Intralipid in the wavelength range of
nm Applied Optics
S T Flock S L Jacques B C Wilson W M Star and M J C van Ge
mert Optical properties of Intralipid A phantom medium for light propagation
studies Lasers in Surgery and Medicine
C J M Moes M J C van GemertW M Star J P A Marijnissen and S A
Prahl Measurements and calculations of the energy uence rate in a scattering
and absorbing phantom at nm Applied Optics
C M Hale and M R Querry Applied Optics
R C Haskell L O Svaasand T Tsay T Feng M S McAdams and B J
Tromberg Boundary conditions for the diusion equation in radiative transfer
J Opt Soc of Am A
R Aronson Boundary conditions for diusion of light J Opt Soc of Am A

Bibliography
S Glasstone and M C Edlund in The Elements of Nuclear Reactor Theory
D van Nostrand Co New York Chap #
K M Case and P F Zweifel in Linear Transport Theory AddisonWesley
MA Chap
E Hecht in Optics AddisonWesley Reading MA Chapters
J D Jackson in Classical Electrodynamics Wiley and Sons Inc New York
ch
H S Carslaw and J Jaeger in Conduction of heat in solids Oxford University
Press New York
A Ishimaru inWave Propagation and Scattering in Random Media Academic
Press New York
J D Jackson in Classical Electrodynamics Wiley and Sons Inc New York
Chap #
K A Kang D F Bruley J M Londono and B Chance Highly scattering op
tical system identication via frequency response analysis of NIRTRS spectra
Annals of Biomedical Engineering
H Liu M Miwa B Beauvoit N G Wang and B Chance Characterization
of absorption and scattering properties of smallvolume biological samples using
timeresolved spectroscopy Analytical Biochemistry
J M Kaltenbach and M Kaschke Frequency and time domain modelling of
light transport in random media Medical Optical Imaging Functional Imaging
and Monitoring SPIE IS
W M Star Comparing the Papproximation with diusion theory and with
monte carlo calculations of light propagation in a slab geometry SPIE Institute
Series SPIE IS
Boas Diuse Photon Probes of Turbid Media Theory and Applications
D Pattanayuk General Electric Consumer Research and Development Report
on Resolution of optical images formed by diusive waves in highly scattering
media
J A Moon and J Reintjes Image resolution by use of multiply scattered light
Optics Letters
A H Gandjbakhche R Nossal and R F Bonner Resolution limits for optical
transillumination of abnormalities deeply embedded in tissues Med Phys
M Essenpreis C E Elwell M Cope v P S R Arridge and D T Delpy
Spectral dependence of temporal point spread functions in human tissues Appl
Opt
D G Papaioannou G W Thooft J J M Baselmans and M J C Vange
mert Image quality in time resolved transillumination of highly scattering me
dia Appl Opt
D A Boas L E Campbell and A G Yodh Scattering and imaging with
diusing temporal eld correlations Phys Rev Lett
P R Bevington in Data Reduction and Error Analysis for the Physical Sciences
McGrawHill Book Company NY
Y Yao Y Wang R L Barbour H L Graber and J Chang Scattering
characteristics of photon density waves from an object embedded in a spherically
twolayer turbid medium Proc SPIE
P N Pusey and J M Vaughan Light Scattering and Intensity Fluctuation
Spectroscopy in M Davies ed Dielectric and Related Molecular Processes
vol Specialist Periodical Report London The Chemical Society
Bibliography
H Z Cummings and H L Swinney Light beating spectroscopy Prog Opt
W B Davenport and W L Root in An Introduction to the Theory of Random
Signals and Noise McGrawHill New York
S O Rice in N Wax ed Noise and Stochastic Processes New York Dover
p
P N Pusey J M Vaughan and D V Willets Eect of spatial incoherence of
the laser in photoncounting spectroscopy J Opt Soc Am
T Bellini M A Glaser N A Clark and V Degiorgio Eects of nite laser
coherence in quasielastic multiple scattering Phys Rev A
R Nossal S H Chen and C C Lai Use of laser scattering for quantitative
determinations of bacterial motility Optics Communications
X L Wu D J Pine P M Chaikin J S Huang and D A Weitz Diusing
wave spectroscopy in a shear ow J Opt Soc Am B
A G Yodh P D Kaplan and D J Pine Pulsed diusingwave spectroscopy
High resolution through nonlinear optical gating Phys Rev B
D J Pine D A Weitz J X Zhu and E Herbolzheimer Diusingwave
spectroscopy Dynamic light scattering in the multiple scattering limit J Phys
France
K Katayama G Nishimura M Kinjo and M Tamura Absorbance measure
ments in turbid media by the photon correlation method Appl Optics
G Nishimura K Katayama M Kinjo and M Tamura Diusingwave absorp
tion spectroscopy in the homogeneous turbid media to be published in Optics
Communications

Boas Diuse Photon Probes of Turbid Media Theory and Applications
M J Stephen Temporal uctuations in wave propagation in random media
Phys Rev B
J Z Xue D J Pine S T Milner X L Wu and P M Chaikin Nonergodicity
and light scattering from polymer gels Phys Rev A
K Schatzel Accuracy of photon correlation measurements on nonergodic
samples Applied Optics
J G H Joosten E T F Gelade and P N Pusey Dynamic light scattering
by nonergodic media Brownian particles trapped in polyacrylamide gels Phys
Rev A
A C Kak and M Slaney in Principles of Computerized Tomographic Imaging
IEEE Press New York
D Bicout and R Maynard Diusing wave spectroscopy in inhomogeneous ows
Physica A
D Bicout and G Maret Multiple light scattering in TaylorCouette ow Phys
ica A
D J Bicout and R MaynardMultiple light scattering in turbulent ow Physica
B
D Bicout Nonnewtonian behavior of colloidal suspensions from multiple light
scattering Physics Letters A
H C van de Hulst in Light Scattering by Small Particles Dover Publications
Inc NY
D J Durian Accuracy of diusingwave spectroscopy theories Phys Rev E
Bibliography
A A Middleton and D S Fisher Discrete scatterers and autocorrelations of
multiply scattered light Phys Rev B
C E Elwell M Cope A D Edwards J S Wyatt D T Delpy and E O R
Reynolds Quantication of adult cerebral hemodynamics by nearinfrared spec
troscopy J Applied Physiology
American National Standards Institute American National Standard for Safe
Use of Lasers The Laser Institute of America see table and g a
B Chance M T Dait C Zhang T Hamaoka and F Hagerman Recovery from
excerciseinduced desaturation in the quadriceps muscles of elite competitive
rowers Am J Physiol C
P D Line K K Sorensen and K Kvernebo Postocclusive hyperemia in skin
measured in pigs by laser Doppler Inuence of state of arterialstenosis in the
limb European Journal of Surgery
D Colin and J L Saumet Inuence of externalpressure on transcutaneous
oxygentension and laserDoppler owmetry on sacral skin Clinical Physiology
N C Abbot and J S Beck Biological zero in laser Doppler measurements in
normal ischemic and inamed human skin International Journal of Microcir
culation Clinical and Experimental
R Pecora in Dynamic Light Scattering Applications of Photon Correlation
Spectroscopy Plenum Press New York
P N Pusey and R J A Tough in Dynamic Light Scattering Plenum New
York
H A Green E E Burd N S Nishioka and C C Compton Skingraft take
and healing following nm excimer continuouswave carbon dioxide CO
Boas Diuse Photon Probes of Turbid Media Theory and Applications
pulsed CO or pulsed HolmiumYAG laserablation of the graft bed Archives
of Dermatology
M A Afromowitz G S Van Liew and D Heimbach Clinical evaluation of
burn injuries using an optical reectance technique IEEE Trans Biomed Eng
M A Afromowitz J B Callis D M Heimbach L A DeSoto and M K
Norton Multispectral imaging of burn wounds A new clinical instrument for
evaluating burn depth IEEE Trans Biomed Eng
J E Gatti D LaRoosa D G Silverman and C E Hartford Evaluation of
the burn wound with perfusion uorometry Journal of Trauma
H A Green D Bua R R Anderson and N S NishiokaBurn depth estimation
using indocyanine green uorescence Arch Dermatol
J Micheels B Alsbjorn and B Sorensen Clinical use of laser Doppler ow
metry in a burns unit Scand J Plast Reconstr Surg
K Waxman N Lefcourt and B Achauer Heated laser Doppler ow measure
ments to determine depth of burn injury Am J Surg
A Sadhwani K T Schomacker G J Tearney and N S Nishioka Determin
ation of Burn Depth using Laser Speckle I Experiments in Tissue Phantoms
submitted to Applied Optics
M Firbank and D T Delpy A design for a stable and reproducible phantom
for use in near infrared imaging and spectroscopy Phys Med Biol
M Firbank M Oda and D T Delpy An improved design for a stable and re
producible phantom material for use in nearinfrared spectroscopy and imaging
Phys Med Biol
Bibliography
S L Jacques and L Wang Monte Carlo modeling of light transport in tissues
in A J Welch and M J C van Gemert eds OpticalThermal Response of
LaserIrradiated Tissue Plenum Press New York pp
L Wang S L Jacques and L Zheng MCMLMonte Carlo modeling of light
transport in multilayered tissues Computer Methods and Programs in Bio
medicine
L G Henyey and J L Greenstein Diuse radiation in the galaxy Astrophys
J
J Ricka Dynamic light scattering with singlemode and multimode bers Ap
plied Optics
E R Van Keuren H Wiese and D Horn Diusingwave spectroscopy in con
centrated latex dispersions An investigation using singlemode bers Colloids
and Surfaces A
M H Koelink F F M de Mul J Greve R Graa A C M Dassel and
J G Aarnoudse Laser Doppler blood owmetry using two wavelengths Monte
Carlo simulations and measurements Appl Opt
C S Robertson S P Gopinath and B Chance A new application for near
infrared spectroscopy Detection of delayed intracranial hematomas after head
injury Journal of Neurotrauma
S P Gopinath C S Robertson C F Contant R K Narayan R G Grossman
and B Chance Early detection of delayed traumatic intracranial hematomas
using nearinfrared spectroscopy J Neurosurg
G B Arfken in Mathematical Methods for Physicists Academic Press Or
lando
Boas Diuse Photon Probes of Turbid Media Theory and Applications
M E Rose in Elementary Theory of Angular Momentum Wiley and Sons Inc
New York
W H Press S A Teukolsky W T Vetterling and B P Flannery in Numerical
Recipes in C The Art of Scientic Computing Cambridge University Press
New York