discovery information and high performance computing (eleg 667) spring, 2002 electrical and computer...
Post on 21-Dec-2015
214 views
TRANSCRIPT

Discovery Information and High Performance Computing (ELEG 667) Spring, 2002
Electrical and Computer Engineering, University of Delaware
Comparative study of clustering algorithms
Li Liao
DuPont Central Research & Development

Road Map
1. Overview of clustering methods
2. Product of p-value and effective size1. Graph-based clustering method
2. PCA
3. SVM algorithm
4. Genetic networks

Definitions and Concepts
• Clustering: to group a set of objects into a cluster of subgroups of similar objects based on a measure of similarity or “distance” between the objects.
• Machine Learning– Unsupervised
• One stage: train and test are not quite separable
• Product: classification of instances. To classify new instances, need to repeat whole process.
– Supervised • Two stages: train and test
• Product: a hypothesis that interprets labeled instances and predicts unseen instances

Credit:Alessandro Verri (MIT)

Elements of Clustering methods
• Measurement of “distance”– Distance ( d(i,j) >= 0; d(i,i) = 0; d(i,j) = d(j,i); d(i,j) <= d(i,k) + d(k,j) ) – Density– Topology– Probability– …
• Optimization algorithms– Bottom-up vs.Top-down– Iterative vs. recursive– Maximum Likelihood vs. Expectation Maximization ( Bayesian viewpoint)– …
• Product– Hierarchical vs. one-level– Exclusive vs. Overlapping (clustering)– Error tolerant (classification)– Discrete vs. continuous– generative vs. discriminative (classification) – …

Examples
K-means
UPGMA
Graph
Support Vector Machines (SVM)
Decision Trees (DT)
Hidden Markov Models (HMM)
Neural Networks (ANN)
Self Organizing Map (SOM)
Principal Component Analysis (PCA)
Naïve Bayes classifier (NB)
...

Product of (correlated) p-values
• Input: a set of clusters and a new date entry q• Task: to assign membership• POP algorithm:
– Compute p-values of pairwise “distance” between q and each member in a cluster
– Compute the product of these p-values and the likelihood (i.e., p-value) of this product
– Do it for each cluster and assign q to the cluster that gives the maximum p-value

Estimate the effective size of a cluster
ESIZE algorithm: a simulation method
1. Create n random query data
2. Minimize the following root mean square error between the observed and predicted p-values
where pi(m) is the i-th largest p-value (of the product of p-values) among matches between the given cluster and n random query data.

Discussions
• POP is an elegant idea to capture heterogeneity/homogeneity of a cluster.
• POP has been used (actually originated from) for protein family classification
• It shall generalize to other situation where p-values are available.
• Simulation method to obtain effective size may not be desirable (expansive).
• A connection to graph theoretic clustering was attempted.
• PCA

Attribute-value

Covert (by cut-off) to adjacent matrix
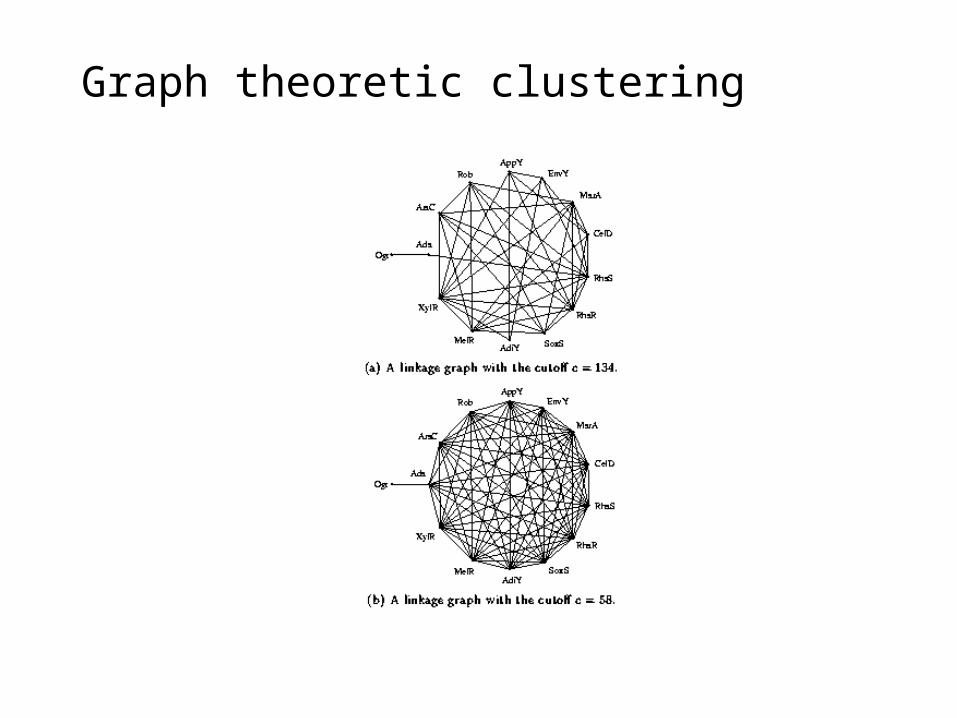
Graph theoretic clustering

Relationship to classifying proteins by families


Path forward
• Graph theoretic clustering– new heuristic for p-quasi method, e.g., add the most
connected node.
– Comparison of different graph theoretic methods• minimum cut (Hartuz & Shamir ‘99)
• articulation point (Kim ‘02)
• COGs (Tatusov et al ‘97)
• Explore relationship b/w graph properties (e.g., connectivity ratio) and effective family size
• PCA


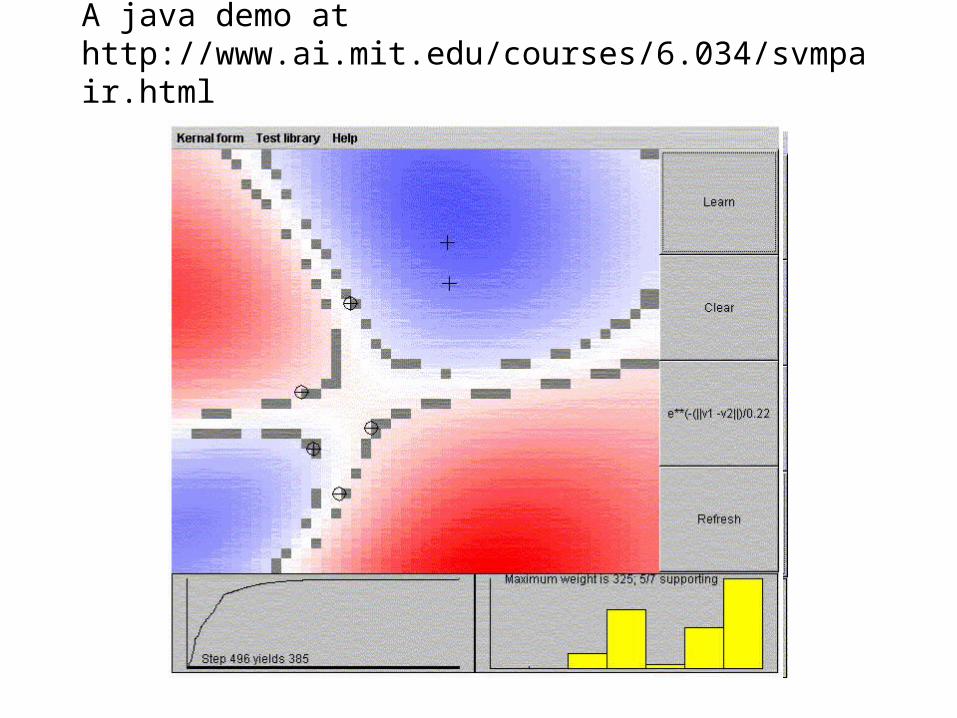
A java demo at http://www.ai.mit.edu/courses/6.034/svmpair.html
Applications to Protein Classification
1. SVM-Fisher: Combining SVMs with HMMs (by Jaakkola, Diekhans and Haussler)
2. SVM-Pairwise: Combining Pairwise Similarity with SVM (by Liao and Noble)
Two steps:
1. Vectorization: converting a give set of proteins into fixed-length vectors
2. SVM: train an SVM from the vectorized proteins

SVM-Fisher method
Protein homologs
HMMProtein non-
homologs
Positivegradientvectors
Negativegradientvectors
Support vector machine
Binary classification
Target protein of unknown function
1
2
34

SVM-Pairwise method
Protein homologs
Protein non-homologs
Positivepairwise score
vectors
Negativepairwise score
vectors
Support vector machine
Binary classification
Target protein of unknown function
1
23

Advantages of SVM-Pairwise over SVM-Fisher
• Score representation is simpler• Pairwise scoring does not require multiple
sequence alignment, which is not only costly, sometimes simple not possible (say a set of distantly related protein sequences)
• Discriminative power is tapped more thoroughly by involving negative train from the beginning.

Preparation of Training and Testing Data

Performance comparison (1)
RFP: rate of false positives is the fraction of negative test sequences that are mis-classified as positive. Median RFP is the RFP when 50% true positives
have been seen.

Applications to Gene Expression
http://www.soe.ucsc.edu/research/compbio/genex
X = (x1, x2 , …., xn)
xi = log (Ei / Ri ) /(j log2 (Ej / Rj ) )
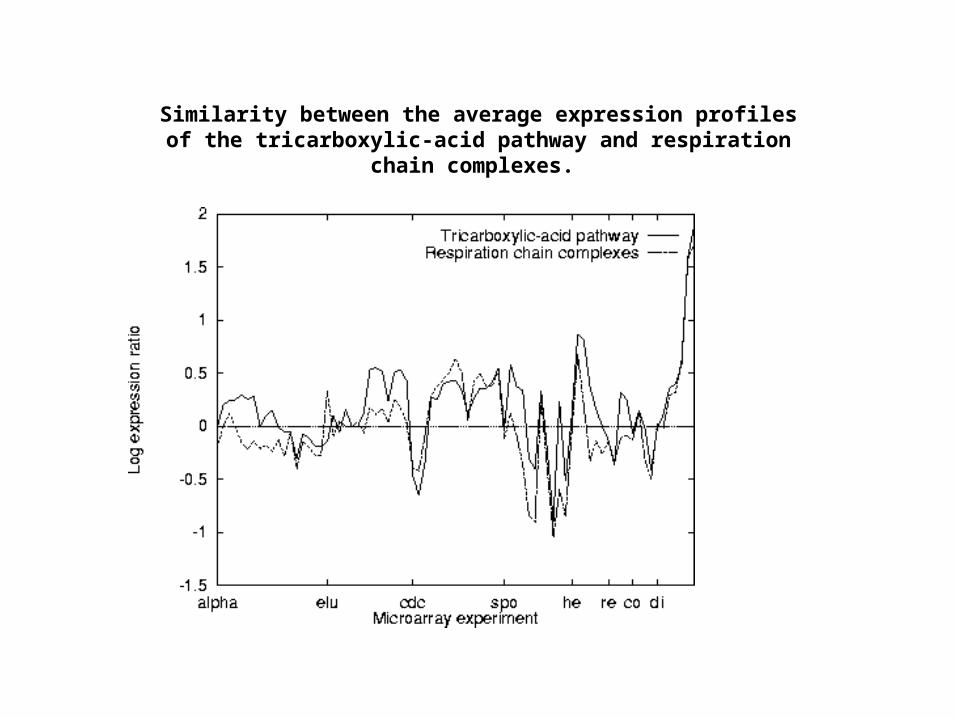
Similarity between the average expression profiles of the tricarboxylic-acid pathway and respiration chain complexes.

Path forward
• Parallel implementation of SVMs.• Dimension reduction (e.g, PCA)• SVM + POP => Clustering ?

Gene Networks
• Definition: A gene network is a set of molecular components such as genes and
proteins and interactions between them that collectively carry out some cellular function.
• Motivation: Using a known structure of such networks it is sometimes possible to
describe behavior of cellular processes, reveal their function and the role of specific genes and proteins in them
• Experiments
– DNA microarray : observe the expression of many genes simultaneously and monitor gene expression at the level of mRNA abundance.
– Protein chips: the rapid identification of proteins and their abundance is becoming possible through methods such as 2D polyacrylamide gel electrophoresis.
– 2-hybrid systems:

• Genetic Network Models: – Linear Model: proposed by D'haeseleer et. al. [5], assumes that expression level of a node in a
network depends on linear combination of the expression levels of its neighbors. – Boolean Model: The most promising technique to date is based on the view of gene systems
as a logical network of nodes that influence each other's expression levels. It assumes only two distinct levels of expression - 0 and 1. According to this model a value of a node at the next step is boolean function of the values of its neighbors. [1,2,3] .
– Bayesian Model: Due to Friedman et al. [6]. It attempts to give a more accurate model of
network behavior, based on Bayesian probabilities for expression levels.

An example
Reverse EngineeringInterpreting data

Inference and Experimental Design
• Predictor-chooser strategy of reverse engineering
– The predictor: infer the network architecture• For each node, build sets Sij of all other nodes whose expression levels also
differs between the two rows (i, j).
• For each node, identify Smin, the smallest set, that is able to explain the observed differences over all pairs of rows (i, j) and has at least one node in Smin from each set Sij.
• For each node, build a truth table using the levels of genes and/or stimuli in Smin by taking relevant levels directly from the Expression Matrix.
– The chooser: design new experiments

Discussions and Path forward
• Prototype– a model to describe gene network
– an effective procedure to infer and evaluate
– combine with clustering as preprocess
– benchmarks on simulation data and real data
• Further development – incorporate pre-existing information
– boolean to multi-levels
– cyclic networks
– noise tolerance

References• Matsuda, Ishihara, & Hashimoto, Theoretical Computer Science 210(1999)305
• Bailey & Grundy, “Classifying proteins by family using the product of correlated p-values”, RECOM99.
• Ben-Dor, Shamir, Yakhini, “Clustering gene expression patterns”, Journal of Computational Biology, 6:281-297, 1999
• C. Burges, “A Tutorial on Support Vector Machines for Pattern Recognition”, Data Mining and Knowledge Discovery 2(1998)1-47
• "Principal components analysis to summarize microarry experiments: application to sporulation time series" by Raychauduri, Stuart and Altman
• "Principal component analysis for clustering gene expression data" by Yeung and Ruzzo, Bioinformatics, 9(2001)763-774.
• "Analysis of gene expression data using self-organizing maps" by Toronen, Kolehmainen, Wong and Castren, FEBS Letters 451(1999)142-146
• http://www.people.memphis.edu/~zxu/report.html
• Interpreting gene expression with self-organizing maps: Methods and application to hematopoietic differentiation, Pablo Tamayo, Donna Slonim, Jill Mesirov, Qing Zhu, Sutisak Kitareewan, Ethan Dmitrovsky, Eric S. Lander, and Todd R. Golub, PNAS 96(6):2907-2912, March, 1999.
• GeneCluster at http://www-genome.wi.mit.edu/MPR/software.html