do on-line labor market intermediaries matter? the impact of
TRANSCRIPT
Do On-Line Labor Market Intermediaries Matter?
The impact of AlmaLaurea on University-to-Work Transition 1
Manuel F. Bagues
Universidad Carlos III
Mauro Sylos Labini
IMT Lucca Institute for Advanced Studies
ABSTRACT
This paper evaluates the impact of the availability of electronic labor markets
on university-to-work transition. In particular, we analyze the effect of the in-
termediation activity carried on by the interuniversity consortium AlmaLaurea
on graduates’ labor market outcomes. Different timing of universities’ enrolment
in AlmaLaurea produces counterfactuals that allow us to overcome the problems
faced by previous empirical investigations. The evaluation is performed apply-
ing the difference-in-differences method to a repeated cross section data set. It
is shown that, if the usual assumption concerning parallel outcomes holds, Al-
maLaurea reduces individual unemployment probability and improves matching
quality. Interestingly, it is also found that on-line intermediaries foster graduates’
geographical mobility.
JEL Classification: J64, J68, G14.
Keywords: Labor Markets Intermediaries, Job Search, Electronic Markets.
This version: October 22, 2007
1We thank David Autor and Anne Polivka for very helpful comments. We have also benefitted from
the comments of participants of seminars at University of Oviedo, University of Bologna, 4th IZA/SOLE
Transatlantic meeting, Bocconi University, S. Anna School of Advanced Studies, University of Alicante, 6th
Villa Mondragone Workshop, XI Spring Meeting of Young Economists, and NBER Conference on Labor
Market Intermediation. The usual disclaimers apply. The empirical analysis would not have been possible
without the data and help provided by ISTAT (the Italian Statistical Office). The econometric analysis was
carried out at the ADELE Laboratory. We also thank Michele Rostan for providing the data of the European
Project ”Careers after Higher Education: a European Research Study”. Corresponding author Mauro Sylos
Labini: [email protected].
– 2 –
1. Introduction
The internet and, more generally, electronic technologies have a great potential in chang-
ing the way employer-employee matches are made (Autor 2001). In fact, the last ten years
have seen a well documented increase in the number of internet job boards and corporate
web sites devoted to job applications, and in the shares of job seekers and recruiters using
on-line resources. For example, according to Taleo Research the incidence of Fortune 500
companies using their career web site as a corporate job board increased from 29 percent
in 1998 to 92 percent in 2002. Moreover, the importance of on-line technologies may be
underestimated since the possible uses of the internet in job search are multifaceted and
goes well beyond viewing ads or posting resumes (Kuhn 2000).2
Having said that, however, it has been extremely difficult to assess the impact of on-line
technologies on labor market outcomes. The internet is believed to increase the amount of
information available to recruiters and job seekers and at the same time to improve their
ability to screen on-line applications and opportunities. Both aspects are likely to decrease
the cost of job search and therefore to improve matching productivity (Pissarides 2000).
Nevertheless, it has also been noted that even if searching on-line had private individual
benefits, it does not follow that the equilibrium effects on labor market outcomes are socially
beneficial (Autor 2001). In a recent empirical investigation Kuhn and Skuterud (2004) also
find that – once individual observable characteristics are controlled for – internet seekers
do not have shorter unemployment duration than other searchers and in some specification
even longer duration. As acknowledged by the authors, these results may be contaminated
by selection into internet job search on unobservables that are negatively correlated with
employability. However, it is also possible that internet search is counterproductive at the
individual level because of the negative signal it might send to employers. Workers may still
use the internet, the authors argue, because it is very cheap and they are not aware of this
drawback.
Therefore, despite their rapid diffusion, whether on-line electronic technologies are ca-
pable of increasing the overall efficiency with which workers and jobs are matched or, con-
versely, they are mere cheaper substitutes for more traditional means (e.g. newspaper ads
or face-to-face intermediation) is still an open issue.
This paper evaluates the impact of the availability of electronic labor markets on
university-to-work transition. In particular, we study the effects of a specific electronic
2In a recent report, the US Congressional Budget Office has pointed out that ”internet job searching may
also have played a role in reducing the natural rate (of unemployment)” (CBO 2002).
– 3 –
intermediary, the interuniversity consortium AlmaLaurea, on graduates’ unemployment, mo-
bility, and matching quality. To put it in a nutshell, AlmaLaurea collects and organizes
on-line information concerning college graduates’ curricula and conditional on their permis-
sion sells it to firms in electronic format. Hence, similarly to other commercial job boards,
it makes information about searching candidates available on-line. However, it also contains
information on almost the entire universe of graduates from the institutions that it serves.
The present case study provides exceptional evidence on the effect of online labor market
intermediaries for two basic reasons: first, AlmaLaurea’s impact is observed during a time
period in which e-recruitment was almost non-existent in Italy. AlmaLaurea was founded
in 1994 and, to the best of our knowledge, untill 1999 there were no major internet job
boards operating in Italy. Second, different timing of universities’ enrolment in AlmaLaurea
produces counterfactuals that allow us to overcome the problems faced by previous empir-
ical investigations. Even if today most Italian universities are member of the consortium,
AlmaLaurea started to sell graduates curricula only in a subset of universities. We identify
the average effect of AlmaLaurea on graduates from this initial subset—i.e. the ones that
might have used its service—comparing their employment outcomes with the ones of grad-
uates from universities that were member. Hence, we estimate the effect of the availability
of electronic intermediaries and not the private benefits of using them.
More formally, the effect of AlmaLaurea is measured using the difference-in-differences
approach applied to a repeated cross section data set. This is built merging two distinct
(but almost identical) surveys run by the Italian Statistical Office (ISTAT) on representative
samples of two cohorts of university graduates interviewed three years after graduation.
Given that AlmaLaurea intermediation activity only started in a subset of universities in
between the graduation time of the two cohorts, we split the sample in two distinct groups
of graduates: those that completed their degree in a university that joined AlmaLaurea
in 1996 and 1997 (the treatment group) and those that graduated from universities that
did not belong to AlmaLaurea during such period (the control group). The subtleties of
envisaging academic institutions participation in AlmaLaurea as a quasi-natural experiment
are discussed more thoughtfully below. Here it suffices to say that, first, in the period
studied individual decisions concerning college enrolment were made before the existence
of AlmaLaurea; second, graduates and universities in the two groups are not statistically
different in observable characteristics; third, according to personal conversations with the
consortium director, AlmaLaurea early membership has been quite accidental and mostly
based on informal relationships among a few faculties.
AlmaLaurea, as we shall discuss more thoroughly below, displays a number of features
that make it likely to be effective: first, it collects official information concerning also individ-

– 4 –
uals who decide not to post their resumes on-line and partly discloses it to firms. Second, it
accomplishes very high enrolment rates among graduates. We conjecture that both features
are likely to reduce adverse selection.
According to our analysis, AlmaLaurea decreases unemployment probability by about 2
points and has a positive effect on wages and two self reported measures of job satisfaction.
Interestingly, we also find that it fosters graduates’ geographical mobility.
To check whether the above findings are robust, we test for pre treatment parallel out-
comes finding that graduates from the two groups of universities had similar employment
dynamics before AlmaLaurea started to operate. An additional threat to our results may
stem from the adverse consequence of AlmaLaurea for graduates of other universities. To
control for this possibility, we build alternative control and treatment groups based on geo-
graphical proximity. We do not find any evidence for the above negative effect.
Our work is related to the growing number of studies that investigate the effect of the
internet and electronic technologies on the labor market (Autor 2001; Freeman 2002). Kuhn
and Skuterud (2004) study the impact of Internet job search on the probability of finding a
job for the unemployed. No discernible differences between on-line and traditional searchers
makes them conclude that either on-line search is ineffective or Internet job searchers are
negatively selected. Stevenson (2007) investigates the importance of on-line technologies on
employed on-line job search. She finds that in the United States state-level rise in Internet
penetration is associated with state-level rise in employer-to-employer worker flows. In this
paper, we focus on university-to-work transition.
Our study is also significant for policy evaluation and guidance: to begin with, the
consortium AlmaLaurea is co-financed by the Italian Ministry of Education, therefore clear
evidence on its effectiveness is useful for evaluating how public money is spent.3 Moreover,
if AlmaLaurea proves to be an effective institutional arrangement, other European countries
might learn from its example improving public policy aimed at facilitating university-to-work
transition.
The rest of the paper is organized as follows. Section 2 provides an outlook of the
Italian university-to-work transition, describes in dept the AlmaLaurea consortium, and
briefly discusses the economics of on-line labor market intermediaries. Section 3 outlines
the identification assumptions needed for our empirical strategy to be valid. Section 4 is
3Given that we do not know the magnitude of public money put in AlmaLaurea, we are not able to
measure if AlmaLaurea is a worthwhile social investment, but simply if students from AlmaLaurea universities
benefited from it.
– 5 –
concerned with the description of the data used in the analysis. Section 5 presents the main
results. Sections 6 and 7 try to overcome the major threats faced by our empirical approach.
Finally, Section 8 concludes.
2. Background
2.1. University-to-Work transition in Italy
Labor market functioning is deeply affected by different kinds of information imperfec-
tions and asymmetries. Education-to-work transition is particulary exposed to such imper-
fections: first-time job seekers typically lack work experience and this negatively affects both
their outlooks concerning employment opportunities and jobs characteristics and employers’
screening options.
In most countries unemployment rates are lower for university graduates than for the
rest of labor force and highly educated people experience a smoother entry into working
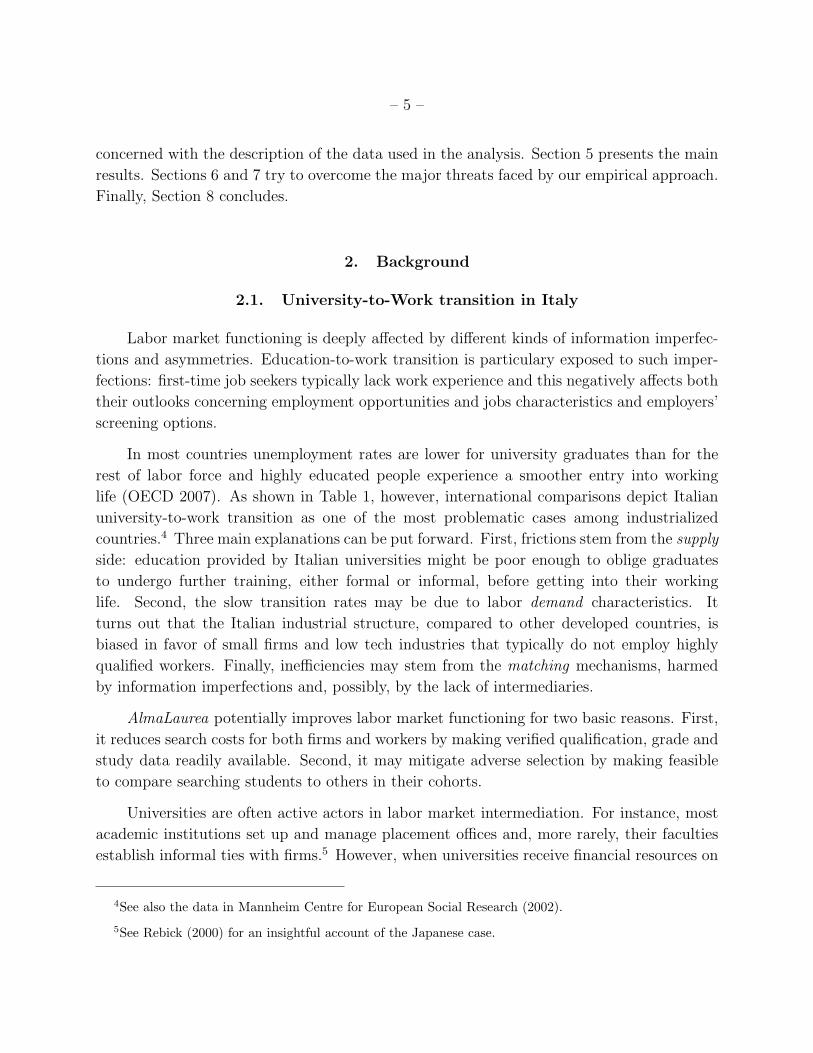
life (OECD 2007). As shown in Table 1, however, international comparisons depict Italian
university-to-work transition as one of the most problematic cases among industrialized
countries.4 Three main explanations can be put forward. First, frictions stem from the supply
side: education provided by Italian universities might be poor enough to oblige graduates
to undergo further training, either formal or informal, before getting into their working
life. Second, the slow transition rates may be due to labor demand characteristics. It
turns out that the Italian industrial structure, compared to other developed countries, is
biased in favor of small firms and low tech industries that typically do not employ highly
qualified workers. Finally, inefficiencies may stem from the matching mechanisms, harmed
by information imperfections and, possibly, by the lack of intermediaries.
AlmaLaurea potentially improves labor market functioning for two basic reasons. First,
it reduces search costs for both firms and workers by making verified qualification, grade and
study data readily available. Second, it may mitigate adverse selection by making feasible
to compare searching students to others in their cohorts.
Universities are often active actors in labor market intermediation. For instance, most
academic institutions set up and manage placement offices and, more rarely, their faculties
establish informal ties with firms.5 However, when universities receive financial resources on
4See also the data in Mannheim Centre for European Social Research (2002).
5See Rebick (2000) for an insightful account of the Japanese case.
– 6 –
Table 1: Employment Rates of University Graduates by Age Classess - 2004
Age Class
Country 25-29 30-34 35-39
Denmark 79.7 87.7 91.2
Finland 84.4 86.7 87.9
France 80.1 85.0 87.5
Greece 72.2 85.5 87.9
Italy 58.0 81.9 89.4
Spain 76.3 85.9 86.7
Sweden 76.6 88.2 88.3
UK 90.5 98.1 90.1
Source: Eurostat.
a relatively egalitarian basis and their graduates’ labor market performance does not affect
their financial endowments, they might lack incentives to be concerned about their students’
placement. In Italy before the existence of AlmaLaurea public universities were barely doing
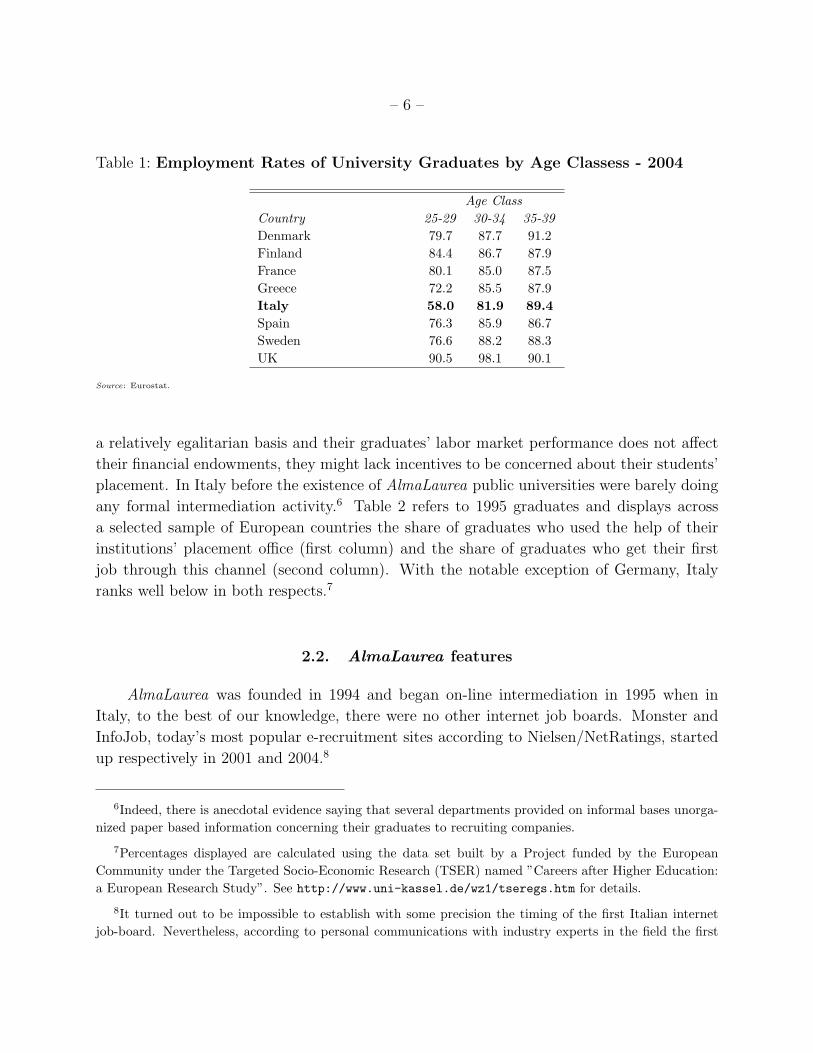
any formal intermediation activity.6 Table 2 refers to 1995 graduates and displays across
a selected sample of European countries the share of graduates who used the help of their
institutions’ placement office (first column) and the share of graduates who get their first
job through this channel (second column). With the notable exception of Germany, Italy
ranks well below in both respects.7
2.2. AlmaLaurea features
AlmaLaurea was founded in 1994 and began on-line intermediation in 1995 when in
Italy, to the best of our knowledge, there were no other internet job boards. Monster and
InfoJob, today’s most popular e-recruitment sites according to Nielsen/NetRatings, started
up respectively in 2001 and 2004.8
6Indeed, there is anecdotal evidence saying that several departments provided on informal bases unorga-
nized paper based information concerning their graduates to recruiting companies.
7Percentages displayed are calculated using the data set built by a Project funded by the European
Community under the Targeted Socio-Economic Research (TSER) named ”Careers after Higher Education:
a European Research Study”. See http://www.uni-kassel.de/wz1/tseregs.htm for details.
8It turned out to be impossible to establish with some precision the timing of the first Italian internet
job-board. Nevertheless, according to personal communications with industry experts in the field the first
– 7 –
Table 2: University Graduates Using University Placement Offices
Country Utilization rates (%) Used to get the first job (%)
Italy 10.3 1.42
Spain 39.3 3.96
France 18.1 3.21
United Kingdom 37.6 6.61
Germany 6.6 0.54
Notes: The relevant questions (asked in 1998 to graduates who obtained their degree between autumn 1994 and summer 1995) were: (i) ”How did
you search for your first job after graduation?”; (ii) ”Which method was most important for getting your first job after graduation?”. Multiple
options follow, among which ”I enlisted the help of a careers/placement office in my higher education institution”. The ratios displayed are
computed respectively over graduates who have sought a job and over those graduates that have been employed at least once.
Source: Authors’ calculation based on the data set produced by the Project funded by the European Community under the Targeted
Socio-Economic Research (TSER) ”Careers after Higher Education: a European Research Study”.
Details on the project and downloadable material can be found at http://www.uni-kassel.de/wz1/tseregs.htm.
Initially run by the Statistical Observatory of the University of Bologna, AlmaLaurea is
today managed by a consortium of 50 private and public universities with the support of the
Ministry of Education. Member universities pay a one-time association fee (ranging between
2582 and 5165 euros according to university dimensions) and an annual subscription fee for
the collection and the insertion of new data in the AlmaLaurea database (4.96 euros for each
student in the data base).
AlmaLaurea institutional objectives are twofold. First, it provides member academic in-
stitutions with reliable information concerning their graduates. Second, it aims at facilitating
graduates’ labor market transition.
As far as the first objective is concerned, AlmaLaurea manages a database which collects
information on graduates drawing it from three distinct sources. First, academic institu-
tions provide official data concerning grades, course durations, and degrees received by their
alumni. Second, undergrads provide several pieces of information including military service
obligations, periods of study abroad, work experience, and a self-evaluation concerning for-
eign languages and computer skills. Finally, graduates have the option to upload and update
on-line their curricula up to three years after graduation.9 In accordance with Italian privacy
law, only a subset of the information in the database can be disclosed to third parties.10
With respect to the second objective, AlmaLaurea manages a service that makes elec-
one was JobPilot, which was founded in 1999 and was acquired by Monster in 2005.
9Recently, such option has been extended up to five years.
10More information can be found on-line at http://www.almalaurea.it/eng/index.shtml
– 8 –
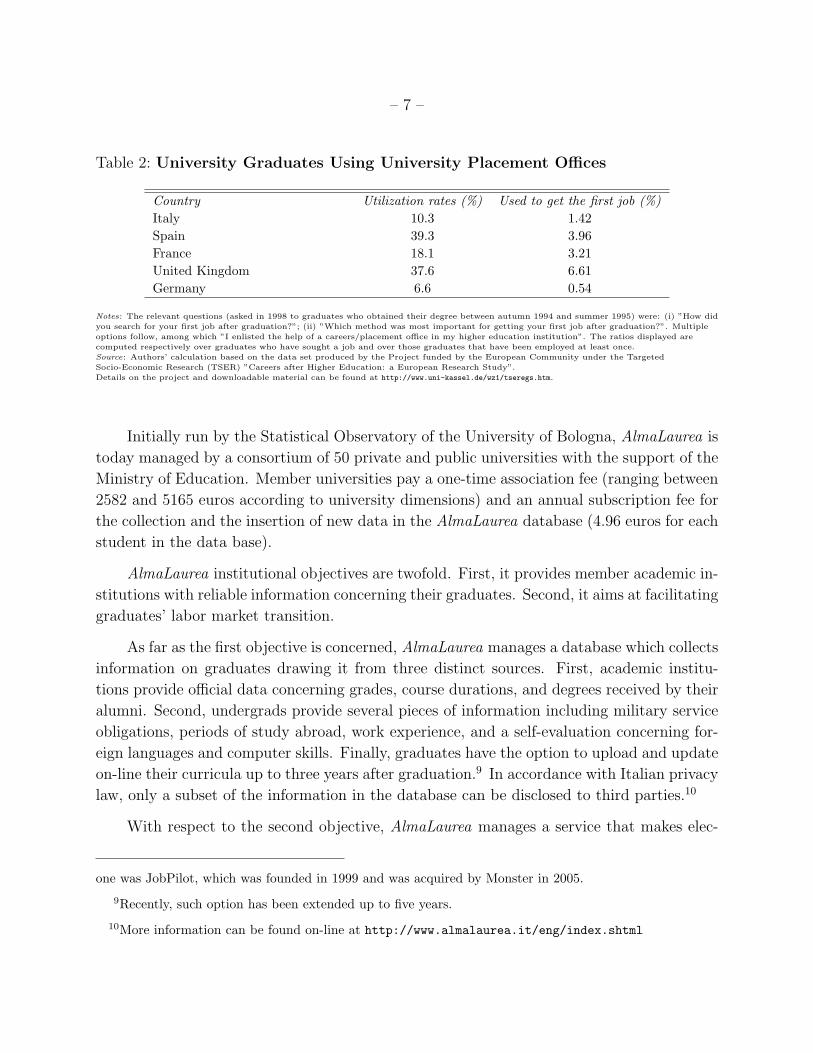
Table 3: The evolution of AlmaLaurea
1998 1999 2000 2001 2002 2003 2004 2005 2006 2007
Number of universities 15 20 22 25 25 27 37 39 44 50
Share of graduates .24 .31 .34 .39 .39 .37 .43 .51 .57 .67
Number of CV in AlmaLaurea 62745 105409 153843 213976 286345 367497 477282 624960 792575 900000
Number of CV sold 3973 15999 115603 194635 164209 271364 389625 - - -
CV sold in the same region (share) .55 .72 .50 .37 .35 .30 .30 - - -
Source: Authors’ calculation based on data provided by AlmaLaurea. ”Share of graduates” refers to the share of graduates in AlmaLaurea
universities with respect to the entire population of graduates in Italian universities. Data on CV sold for 2005, 2006, and 2007 are not available.
Data for 2007 are estimates calculated in June 2007.
tronically available to firms graduates’ CV. A CV is an electronic file containing biographical
information, graduation age, university and high school grades, information on eventual in-
ternships, experience abroad, post graduate education, language and computer skills, work
experience, and work preferences (i.e. kind of occupation desired, favorite location, and
preferred contract). Graduates may also add additional information and a cover letter.11
The service is free for graduates. Firms and other institutions may also freely browse
individual curricula and observe populational aggregate information, but need to pay if they
want to contact a given graduate. The price ranges between 0.5 and 10 Euros per CV,
depending on the type of subscription and the number of curricula acquired.12
Table 3 gives an outlook of AlmaLaurea’s history and performance. It displays the
number of universities enroled, the share of graduates from AlmaLaurea universities, the
number of resumes available for firms, and the ones sold by the consortium.
2.3. AlmaLaurea and the Economics of Electronic Labor Markets
The AlmaLaurea recruitment service turns out to be an insightful example concerning
how on-line communication technologies (coupled with more traditional forms of intermedia-
tion) might ameliorate the way in which employers and employees match in the labor market.
11A sample CV (in Italian) is available: http://www.almalaurea.it/info/aiuto/aziende/esempio cv.shtml.
12More specifically, firms can choose among two different modalities. First, the so-called self-service
modality can be used. After paying a fixed fee of 50 Euros, any number of CV can be acquired at the
cost of 10 Euros per CV. Second, firms can choose the subscription modality, which allows them to prepay
a whole package of CV downloadable during a period of one year. The offers range from 200 CV for
around 500Euros up to 5000CVs for 2600Euros. More detailed information is available (in Italian) at
http://www.almalaurea.it/info/condizioni/buono ordine abbonamenti.pdf.

– 9 –
To keep it simple, on-line labor market intermediaries are expected to decrease search costs
for both employers and employees. Standard search theory predicts that, everything equal,
this should lead to better matches. Conversely, the effects on unemployment duration are
ambiguous. In fact, even if Burdett and Ondrich (1985) suggest that this is unlikely, on-line
technologies might induce both job seekers and employers to be choosier and increase their
reservation wages and screening standards (Pissarides 2000). Finally, on-line labor market
intermediaries are also expected to weaken constraints posed by geographical distance (Au-
tor 2001). Consistently, in the AlmaLaurea case most graduates’ curricula are bought by
firms located in region different from the one where individual graduated (see Table 3).
On a different ground, a likely consequence of lower costs in distinct job search channels
is that job seekers ceteris paribus will apply for more jobs. Especially when employers
perceive such excess application as a problem, adverse selection is likely to undermine the
effectiveness of cheap search methods (Autor 2001).
Except for the time required to update personal information, AlmaLaurea is completely
free for students and therefore it is potentially exposed to the adverse selection problem
underlined above: employers might expect that individuals who upload and update their
resumes on-line are somehow negatively selected. However, AlmaLaurea’s organizational
features are likely to make its intermediation activity less exposed to the above risk for two
basic reasons.
First, as explained above, part of the information contained in AlmaLaurea data set
concerns the entire graduates population and it is provided directly by academic institutions.
This information is organized and freely available on-line on AlmaLaurea website.13 For
every member university and degree, the website provides information on average grades,
the share of students that completed on time their degree, and the share of individuals
that have studied abroad with a EU subsidized program. Therefore, employers who buy a
CV may detect relevant differences between a selected job seeker and the entire graduate
population. The adverse selection problem is hence considerably reduced.
Second, academic institutions that joined AlmaLaurea are able to enroll the overriding
majority of their graduates. For instance, more than 92% of 1998 graduates updated their
curriculum vitae at least once. High participation rates have been very effective in building
a good reputation and make adverse selection unlikely. To sum up, we expect that the
organizational features of AlmaLaurea prevent it from the usual shortcomings suffered by
on-line labor markets.
13See (in Italian) http://www.almalaurea.it/cgi-php/aziende/profilo/profilo.php.
– 10 –
3. The Empirical Strategy
The basic goal of this paper is to evaluate the impact of a treatment, i.e. the availability
of on-line labor market intermediaries, on an array of labor market outcomes, i.e. the
probability of being unemployed, mobility, and matching quality. This section formalizes
and explicitly discusses our empirical approach and outlines the strategies employed to assess
its validity.
One of the most serious empirical problems in assessing the impact of on-line intermedi-
aries is that job seekers and firms typically self select in the adoption of on-line technologies.
It is therefore difficult to identify to which extent the correlation between their use and labor
market outcomes stems from technology itself or from important and difficult to measure
individual characteristics.
In this paper we can rely on a transparent exogenous source of variation, i.e. the timing
of universities’ enrolment in AlmaLaurea. This heterogeneity allows to apply the difference-
in-differences (DID) method to a repeated cross-section data set. This helps to overcome
the above problem.
The simple DID framework can be described as follows. The causal effect of a treatment
on an outcome is defined as the difference between two potential outcomes (Rubin 1974;
Heckman 1990). Of course, it is impossible to observe such an effect for a given individual.
However, it is possible to identify an average effect if the population of interest is observed in
at least two distinct time periods, only a fraction of the population is exposed to treatment,
and parallel paths over time for treated and controls is assumed. The main intuition is that,
under this design, an untreated group of the population is used to identify time variation in
the outcome that is not due to treatment exposure.
More formally, each individual i belongs to one group, Gi ∈ {0, 1}, where for convenience
group 1 is the treatment group and 0 the control one. Moreover, individual i is observed only
in time period Ti ∈ {0, 1}. Let Ii = Gi ·Ti denote an indicator for the actual subministration
of treatment.14 Y N
i(t) and Y I
i(t) represent two potential outcomes: respectively, the one
that i would have attained at time t if not treated and the one if treated before t.
The fundamental problem to identify the treatment effect on individual i, defined as
Y I
i(t) − Y N
i(t), is that for any particular individual, one does not observe both potential
outcomes. What one does observe is in fact the realized one, that can be written as Yi(t) =
14Note that in our simple setting Ii assumes value 1 only for the treatment group (Gi = 1) in the post
treatment period (Ti = 1).
– 11 –
Y I
i(t) · Ii + Y N
i(t) · (1 − Ii).
If it is assumed that
E[Y N
i(1) − Y N
i(0)|Gi = 1] = E[Y N
i(1) − Y N(0)|Gi = 0], (1)
then, it easily follows that
E[Y I
i(1) − Y N
i(1)|Gi = 1] = E[Yi(1)|Gi = 1] − E[Yi(0)|Gi = 1]
−{E[Yi(1)|Gi = 0] − E[Yi(0)|Gi = 0]}.(2)
In words, if the average outcomes for treatment and control groups had parallel paths
over time in absence of the treatment, then the so-called average treatment effect on the
treated (ATT) can be expressed as something whose sample counterpart is observable, i.e.
as the average variation of the treatment group purged by the average variation of the control
one.
In the present study, it is hence assumed that in absence of AlmaLaurea the average
occupational outcomes of graduates from early joining universities (hereafter AlmaLaurea
universities) would have followed the same dynamics of the ones of graduates from universities
that either joined later or did not join (hereafter non-AlmaLaurea universities). Thus the
average effect of AlmaLaurea is simply obtained subtracting the dynamics of graduates of
the control group from the dynamics of those graduated from the treatment one.
The above estimator is easily obtained as
Yi = µ + γ · Gi + δ · Ti + α · (Gi · Ti) + ui , (3)
where α is the ATT and the assumption stated in equation 1 is equivalent to mean indepen-
dence.
The validity of our approach faces a number of threats. As far as the so-called internal
validity is concerned, i.e. the causal effect within the context of the study, two problems
can be spelled out.15 First, the compositional effect: the use of repeated cross-sections is
only valid when the composition of the target population does not change between the two
periods, i.e. ui ⊥ Ti | Gi. Given that individual decisions concerning college enrolment were
taken before the existence of AlmaLaurea, we can presume that this problem is not very
severe in our case. However, following standard practice, we shall test whether the means
of relevant characteristics of the population within each group did change unevenly between
the pre-treatment and the post-treatment period.
15See Meyer (1995) for a comprehensive discussion concerning internal validity in this framework.
– 12 –
Second, the assumption of parallel dynamics in the absence of treatment between the
two groups (equation 1) turns out to be a strong one. It is possible, in fact, that the
two groups have different trends for reasons different from the treatment. However, if non-
parallel dynamics are due to observables, it is possible to overcome the problem including
covariates. The present work, as we shall carefully discuss in Section 4, relies on a large
array of individual and university covariates. Nevertheless, if the dynamics of the outcome
variables of the two groups are affected by unobservables, identification breaks down.16 In
section 6, we shall try to overcome this important problem using data of one additional
pre-treatment period in order to test for non-parallel paths between treatment and control
groups before the treatment.
An additional issue concerns the unit of analysis of our ATT. To be sure, AlmaLau-
rea might not be an appropriate individual level treatment since member institutions are
enrolled at once and it is possible that there are important interactions among each uni-
versity students. If, for instance, the impact of AlmaLaurea on a given student depends on
the characteristics of students of her cohort, we measure the effect on university employ-
ment performance rather than the individual one. Even if in the present study we model
AlmaLaurea as an individual level treatment, in future research we aim at investigate the
possibility of within university spillovers.
On a similar ground, to be valid, the DID approach assumes no interactions among
the agents of treatment and control groups. If for example AlmaLaurea graduates improve
their occupational outcomes harming non-AlmaLaurea graduates, our estimates are not very
interesting, at least for policy guidance. In section 7, we shall try to assess this problem
identifying additional control and treatment groups which includes only graduates from those
universities that are located in the same geographical region.
Finally, if one wishes to generalize the results found to different individuals and contexts,
external validity is also important. It is possible that AlmaLaurea would not have had an
effect for graduates of universities different from the ones that joined. This would explain,
moreover, why a number of universities joined earlier, i.e. they knew that they were going to
benefit the most from it. We do not think this is a major problem here since, as mentioned
in the introduction, membership has been quite accidental, at least during the first years.
Nevertheless, below we test whether universities in the two groups significantly differ in their
observable characteristics.
16Given that decisions to enrol in AlmaLaurea are made by universities, we are mostly concerned with
university unobservables.
– 13 –
Table 4: Universities in AlmaLaurea
1994 University of Bologna starts collecting electronic data concerning its graduates
1995 University of Bologna starts selling data
1996 University of Modena-Reggio Emilia, Ferrara, Parma, and Florence start selling data
1997 University of Catania, Trieste, Udine, Messina, Chieti, Trento, Molise,
and Venice School of Architecture start selling data
August 1998 University of Turin and Eastern Piedmont start selling data
Note: Venice School of Architecture started selling from January the first. For consistency was included in 1997 group. Universities of Siena and
Lecce joined in 1997, but did not start to sell CV untill 1999 and 2003 respectively.
Source: All the information is on AlmaLaurea web site.
4. The Data
Our data on graduates are drawn from two almost identical surveys named Indagine
Inserimento Professionale Laureati (Survey on University-to-Work Transition) run in 1998
and 2001 on individuals graduated, respectively, in 1995 and 1998.17
To implement the econometric approach described in Section 3 we include in our main
treatment group those individuals graduating from universities that joined AlmaLaurea in
1996 and 1997. As displayed in Table 4, this includes universities of Modena-Reggio Emilia,
Ferrara, Parma, Florence, Catania, Trieste, Udine, Messina, Chieti, Trento, Molise and
Venice School of Architecture. Students in the treatment group account for about 18 per
cent of the sample (see Table 5).
In section 5.2, we also exploit an additional source of variation. As shown in Table 4,
universities of Turin and Eastern Piedmont start selling graduates CVs only after August
1998. Thus, graduates from these universities are used for an additional treatment group in
a difference-in-differences setting in which the ”before and after” is time graduation before
and after August 1998 and only graduates of this year are considered.18
Unfortunately, ISTAT does not provide information concerning graduation month for
1995 graduates. Therefore, graduates from Bologna are not considered in the analysis.19
17The publicly available micro-data do not include information concerning the university the interviewed
individual graduated from. Therefore, we carried out the analysis at the ADELE ISTAT laboratory in Rome.
One edition of the Survey has been used by Brunello and Cappellari (2005).
18In Italy graduates may complete their degree at different points of time in the same academic year,
depending on when they finish their dissertation.
19Bologna is also a very special case, the most ”self-selected” one, given that it is the university where

– 14 –
Table 5: Sample Design and Means of Key Variables
All AlmaLaurea nonAlmaLaurea
1998 Survey:
Number of Graduates 15282 3512 11770
Weighted Share .188 .812
2001 Survey:
Number of Graduates 18181 3515 14666
Weighted Share .183 .817
All AlmaLaurea nonAlmaLaurea
Means of selected sample characteristics in 1998:
Share of Female .527 .528 .527
(.004) (.010) (.005)
Age 27.45 27.61 27.41
(.038) (.086) (.042)
High School Grade 48.38 47.87 48.49
(.066) (.151) (.074)
Means of selected sample characteristics in 2001:
Share of Female .551 .567 .548
(.004) (.009) (.004)
Age 27.47 27.55 27.45
(.028) (.063) (.031)
High School Grade 48.96 48.62 49.04
(.057) (.130) (.064)
Notes: Standard errors in parenthesis. Shares, means and standard errors are computed with stratification weights. High school grades range
from 36 to 60. Only individuals that answered to the question concerning their employment status have been considered.

– 15 –
Table 6: Universities Characteristics
All AlmaLaurea nonAlmaLaurea
Universities in 1995
Number of universities 59 12 47
Average number of students 23946 22033 24434
(3742) (4569) (4568)
Average number of students per professor 31.09 26.27 32.32
(2.59) (2.53) (3.17)
Average share of delayed students .288 .278 .291
(.010) (.026) (.011)
Universities in 1998
Number of universities 61 12 49
Average number of students 25473 24134 25801
(3875) (5096) (4679)
Average number of students per professors 31.82 26.50 33.12
(2.36) (3.15) (2.82)
Average share of delayed students .362 .396 .354
(.011) (.029) (.012)
Notes: Averages are computed at university level. Standard errors in parenthesis
The ISTAT target samples consist of 25716 individuals in 1998 and 36373 individuals in
2001. They represent respectively the 25% and 28.1% of the total population of graduates
from Italian universities. The response rates have been of 64.7% and 53.3% for a total of
17326 and 20844 respondents.20 Once we eliminate those individuals who did not answered
to the question concerning their employment status, those who have missing values for key
variables, and graduates from Bologna, Turin and Eastern Piedmont, we remain with 15282
and 18181 observations respectively. In both years the sample is stratified according to sex,
university and university degree and in the analysis below all estimations are performed
using stratification weights.
AlmaLaurea get started. However, results do not change qualitatively either if we include Bologna graduates
in the control group or we consider them in the treatment one.
20Differences in response rates probably stem from different interviewing technologies used in the surveys:
in 1998 ISTAT mailed paper-based questionnaires, while in 2001 the C.A.T.I. (Computer Assisted Telephone
Interview) technique was used. In principle this change should affect distinct universities in a homogenous
way and therefore it should not represent a major concern for our analysis.
– 16 –
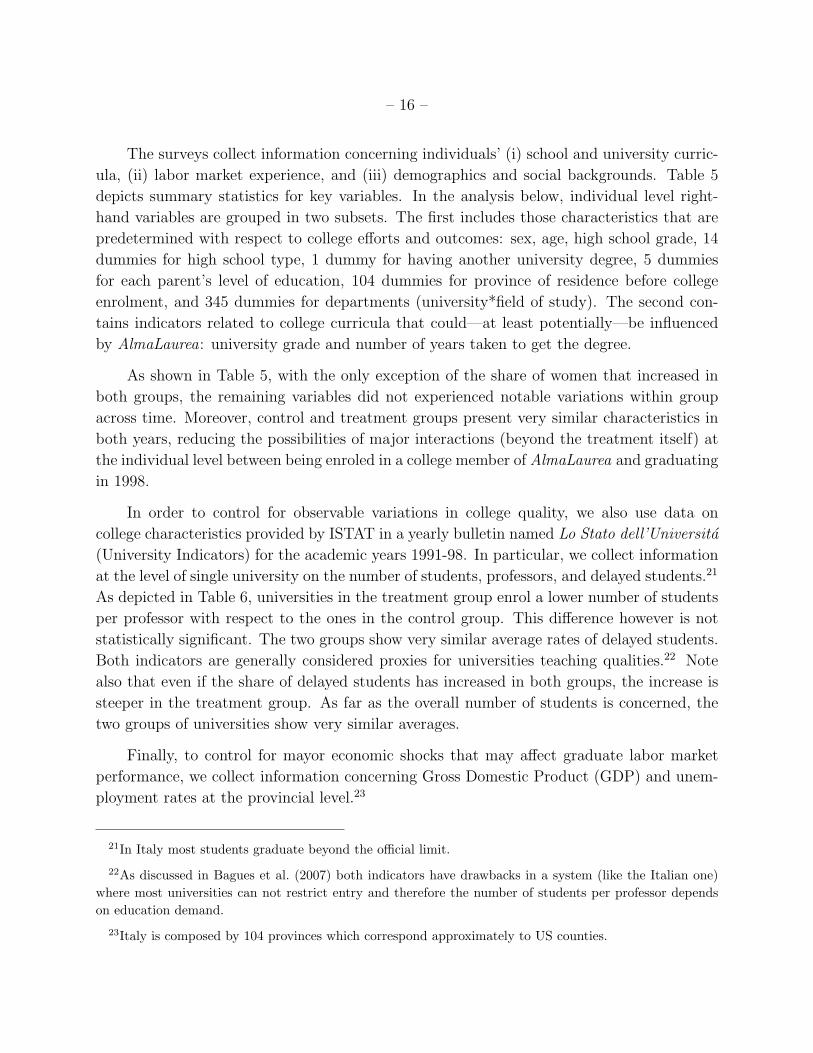
The surveys collect information concerning individuals’ (i) school and university curric-
ula, (ii) labor market experience, and (iii) demographics and social backgrounds. Table 5
depicts summary statistics for key variables. In the analysis below, individual level right-
hand variables are grouped in two subsets. The first includes those characteristics that are
predetermined with respect to college efforts and outcomes: sex, age, high school grade, 14
dummies for high school type, 1 dummy for having another university degree, 5 dummies
for each parent’s level of education, 104 dummies for province of residence before college
enrolment, and 345 dummies for departments (university*field of study). The second con-
tains indicators related to college curricula that could—at least potentially—be influenced
by AlmaLaurea: university grade and number of years taken to get the degree.
As shown in Table 5, with the only exception of the share of women that increased in
both groups, the remaining variables did not experienced notable variations within group
across time. Moreover, control and treatment groups present very similar characteristics in
both years, reducing the possibilities of major interactions (beyond the treatment itself) at
the individual level between being enroled in a college member of AlmaLaurea and graduating
in 1998.
In order to control for observable variations in college quality, we also use data on
college characteristics provided by ISTAT in a yearly bulletin named Lo Stato dell’Universita
(University Indicators) for the academic years 1991-98. In particular, we collect information
at the level of single university on the number of students, professors, and delayed students.21
As depicted in Table 6, universities in the treatment group enrol a lower number of students
per professor with respect to the ones in the control group. This difference however is not
statistically significant. The two groups show very similar average rates of delayed students.
Both indicators are generally considered proxies for universities teaching qualities.22 Note
also that even if the share of delayed students has increased in both groups, the increase is
steeper in the treatment group. As far as the overall number of students is concerned, the
two groups of universities show very similar averages.
Finally, to control for mayor economic shocks that may affect graduate labor market
performance, we collect information concerning Gross Domestic Product (GDP) and unem-
ployment rates at the provincial level.23
21In Italy most students graduate beyond the official limit.
22As discussed in Bagues et al. (2007) both indicators have drawbacks in a system (like the Italian one)
where most universities can not restrict entry and therefore the number of students per professor depends
on education demand.
23Italy is composed by 104 provinces which correspond approximately to US counties.

– 17 –
The present study considers three basic outcome variables measured three years after
graduation: occupational status, which takes value 1 if a given individual is unemployed and
0 otherwise;24 regional mobility, taking value 1 if the individual resides in a different region
with respect to the one where she graduated;25 and finally wage, measured as net monthly
wage expressed in euros and self reported by the interviewed. Moreover, we also consider
two additional proxies of matching productivity. The first concerns the perceived level of
adequacy of the knowledge acquired at university with respect to the content of the present
job. The second measures the perceived stability of the job. Both variables are self reported
and take values from 1, not satisfied at all, to 4, very satisfied.
5. The Impact of AlmaLaurea
5.1. Universities that joined in 1996 and 1997
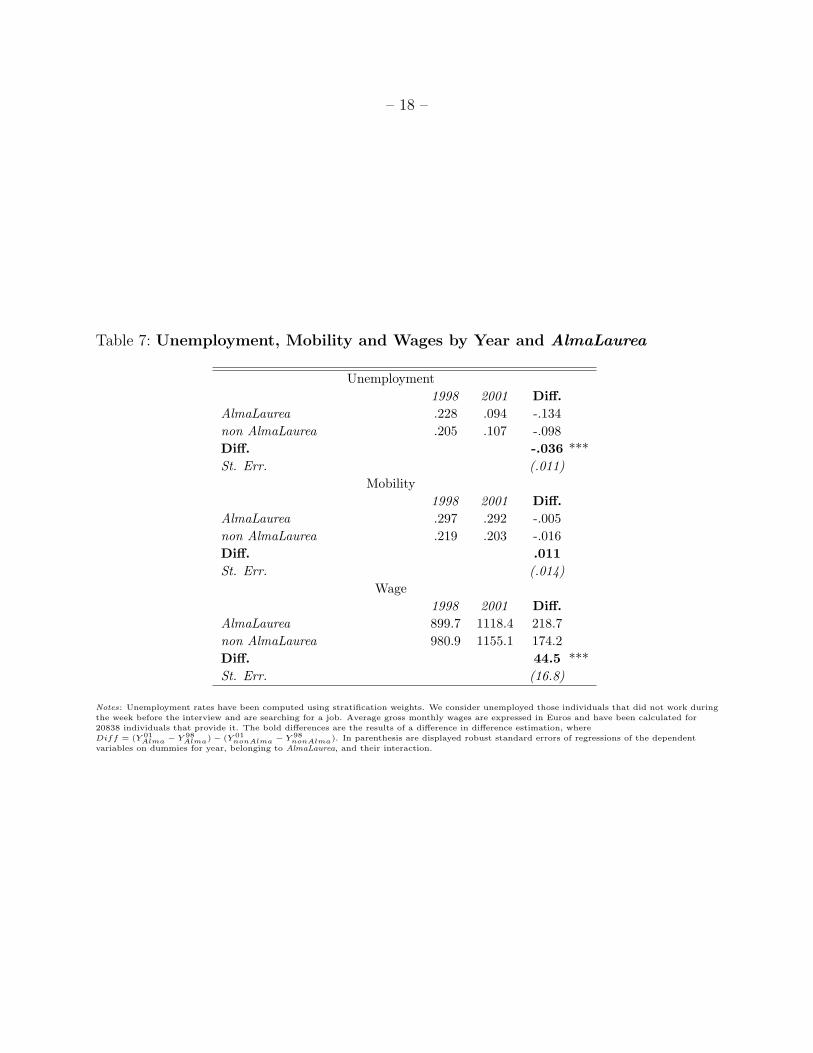
A first outlook of the impact of AlmaLaurea is obtained comparing time differences
in means of key outcomes within each group (treatment and control). Table 7 shows that
unemployment rates decreased sharply from 1998 to 2001 for the whole target population.26
Moreover, and most importantly for the present paper, those in the treated group have
improved their occupational status the most: unemployment rate decreased about 3.5 points
more in this group with respect to the control one. Note also that the ranking between the
two groups reverses. This mean that the same qualitative result would be obtained using
changes in employment logs as outcome variable.
As far as mobility is concerned, rates remained stable for AlmaLaurea students, while
decreased for non-AlmaLaurea ones. Hence, graduates in the treatment group increased
their regional mobility of about 1 point relatively to graduates in the control group. This
difference, however, is not statistically different from zero. Note also that graduates in
the treatment group are more mobile than the ones in the control one. Finally, as far as
matching quality is considered, monthly wages increased about 44 euros more for AlmaLaurea
24Following standard definitions, we consider unemployed those individuals that declare not to have worked
during the week before the interview and are searching for a job.
25Italy is composed by 20 regions.
26Italian labor market conditions have improved substantially in between 1998 and 2001. According to
ISTAT, standardized unemployment rates for the entire population were 11.7 in 1998 and 9.4 in 2001. The
change was from 12.8 to 9.8 for university graduates with age between 25 and 39. It could be that our figure
displays a steeper decrease both because individuals in the sample are younger and because of the change in
the survey technology mentioned above.
– 18 –
Table 7: Unemployment, Mobility and Wages by Year and AlmaLaurea
Unemployment
1998 2001 Diff.
AlmaLaurea .228 .094 -.134
non AlmaLaurea .205 .107 -.098
Diff. -.036 ***
St. Err. (.011)
Mobility
1998 2001 Diff.
AlmaLaurea .297 .292 -.005
non AlmaLaurea .219 .203 -.016
Diff. .011
St. Err. (.014)
Wage
1998 2001 Diff.
AlmaLaurea 899.7 1118.4 218.7
non AlmaLaurea 980.9 1155.1 174.2
Diff. 44.5 ***
St. Err. (16.8)
Notes: Unemployment rates have been computed using stratification weights. We consider unemployed those individuals that did not work during
the week before the interview and are searching for a job. Average gross monthly wages are expressed in Euros and have been calculated for
20838 individuals that provide it. The bold differences are the results of a difference in difference estimation, where
Diff = (Y 01
Alma− Y 98
Alma) − (Y 01
nonAlma− Y 98
nonAlma). In parenthesis are displayed robust standard errors of regressions of the dependent
variables on dummies for year, belonging to AlmaLaurea, and their interaction.
– 19 –
Table 8: The Effect of AlmaLaurea on Unemployment Probability
(1) (2) (3) (4)
AlmaLaurea -.020∗∗ (.008) -.021∗∗ (.008) -.021∗∗ (.008) -.016∗ (.008)
2001 -.101∗∗∗(.013) -.103∗∗∗ (.013) -.099∗∗∗ (.013) -.073∗∗∗ (.013)
Female .060∗∗∗(.006) .061∗∗∗ (.005) .061∗∗∗ (.005) -.061∗∗∗ (.005)
Age -.002∗∗ (.001) -.004∗∗∗ (.001) -.004∗∗∗ (.001) -.004∗∗∗ (.001)
High School Grade -.002∗∗∗(.0003) -.001∗∗∗ (.0004) -.001∗∗∗ (.0004) -.001∗∗∗ (.0004)
University Grade -.001∗∗ (.005) -.001∗∗ (.001) -.001∗∗ (.0006)
Students per faculty -.002∗∗∗ (.001) -.002∗∗∗ (.001)
Share of delayed Students -.018 (.073) -.076 (.077)
GDP -.001∗∗∗ (.0003)
Provincial unemployment .009∗∗∗ (.003)
Dummies on year delay YES YES YES
R-squared 0.147 0.147 0.149 0.150
Obs. 33463 33463 33463 33463
Notes: Results of four different specifications of a linear probability model are displayed. Dependent variable assumes value 1 if the individual
declares not to work and is looking for a job, 0 otherwise. All specifications include university*department fixed effects, 14 dummies for high
school type, 11 dummies for having another university degree, 5 dummies for each parent’s level of education, 104 dummies for province of
residence before college enrolment. Column 1 includes only predetermined individual control, column 2 considers all individual controls, column 3
incorporates time variant universities characteristics, and column 4 includes Provincial GDP and unemployment rate. Robust Standard Errors in
parenthesis. All regression are clustered at region*degree*year.∗ significant at 10%; ∗∗ significant at 5%; ∗∗∗ significant at 1%.
graduates than for the control group.
In order to interpret the above results as the sole effect of AlmaLaurea, one needs
to assume that in absence of the treatment the averages of the two groups would have
experienced the same variation (equation 1). This is indeed a strong restriction when the
treatment (i.e. graduating from a university enroled in AlmaLaurea) is not randomly assigned
across individuals. The remaining part of the paper uses the approaches outlined in Section 3
to assess the extent to which the observed changes may be interpreted as the effect of
AlmaLaurea.
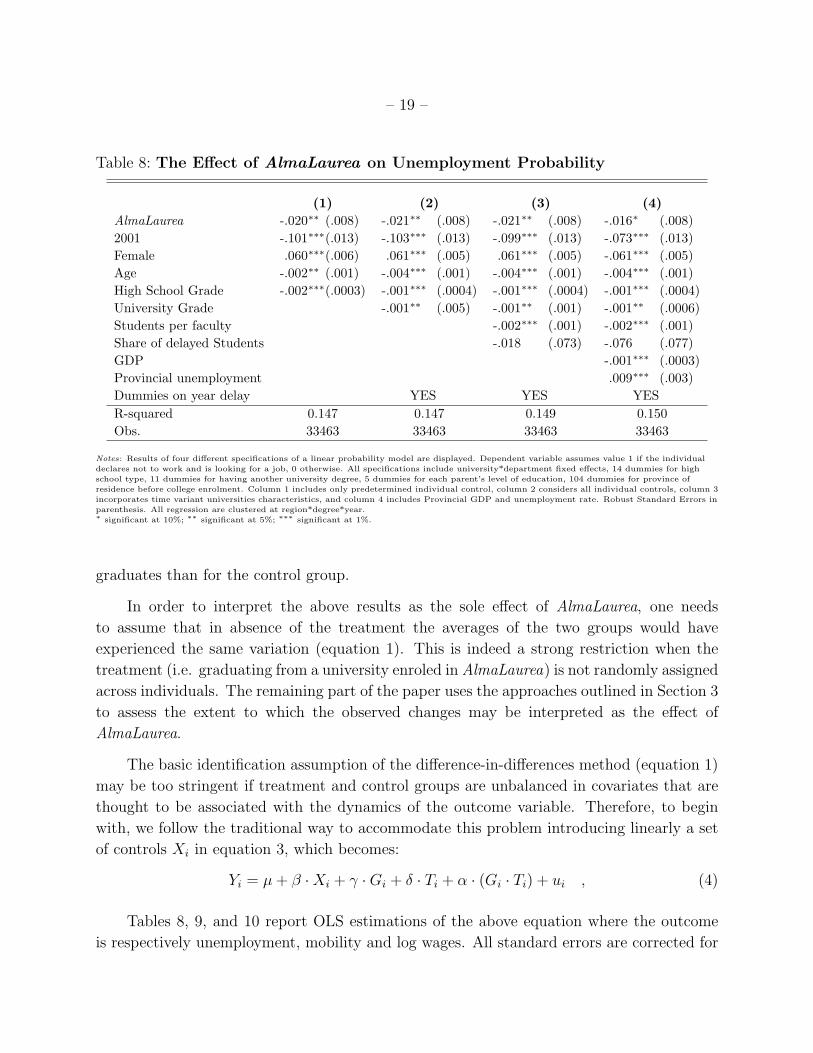
The basic identification assumption of the difference-in-differences method (equation 1)
may be too stringent if treatment and control groups are unbalanced in covariates that are
thought to be associated with the dynamics of the outcome variable. Therefore, to begin
with, we follow the traditional way to accommodate this problem introducing linearly a set
of controls Xi in equation 3, which becomes:
Yi = µ + β · Xi + γ · Gi + δ · Ti + α · (Gi · Ti) + ui , (4)
Tables 8, 9, and 10 report OLS estimations of the above equation where the outcome
is respectively unemployment, mobility and log wages. All standard errors are corrected for
– 20 –
Table 9: The Effect of AlmaLaurea on Mobility
(1) (2) (3) (4)
AlmaLaurea .024∗∗ (.011) .024∗∗ (.012) .027∗∗ (.012) .024∗∗ (.012)
2001 -.008 (.007) -.008 (.007) .007 (.008) -.009 (.011)
Female -.022∗∗∗(.004) -.022∗∗∗ (.005) -.022∗∗∗ (.005) -.022∗∗∗ (.005)
Age -.001∗∗ (.001) .0004 (.0006) .0003 (.0006) .0002 (.0006)
High School Grade .001∗∗ (.0003) .0002 (.0003) .0003 (.0003) .0004 (.0003)
University Grade .0003 (.0006) 0003 (.0006) .0001 (.0006)
Students per faculty .001 (.001) -.001 (.001)
Share of delayed Students -.209∗∗∗ (.001) -.179∗∗ (.077)
GDP -.0005 (.001)
Provincial unemployment -.005 (.004)
Dummies on year delay YES YES YES
R-squared 0.282 0.283 0.283 0.283
Obs. 33463 33463 33463 33463
Notes: Results of four different specifications of a linear probability model are displayed. Dependent variable assumes value 1 if an individual
resides in a distinct region with respect to the one where he attended university, 0 otherwise. All specifications include university*department
fixed effects, 14 dummies for high school type, 11 dummies for having another university degree, 5 dummies for each parent’s level of education,
104 dummies for province of residence before college enrolment. Column 1 includes only predetermined individual control, column 2 considers all
individual controls, column 3 incorporates time variant universities characteristics, and column 4 includes Provincial GDP and unemployment
rate. Robust Standard Errors in parenthesis. All regression are clustered at region*degree*year.∗ significant at 10%; ∗∗ significant at 5%; ∗∗∗ significant at 1%.
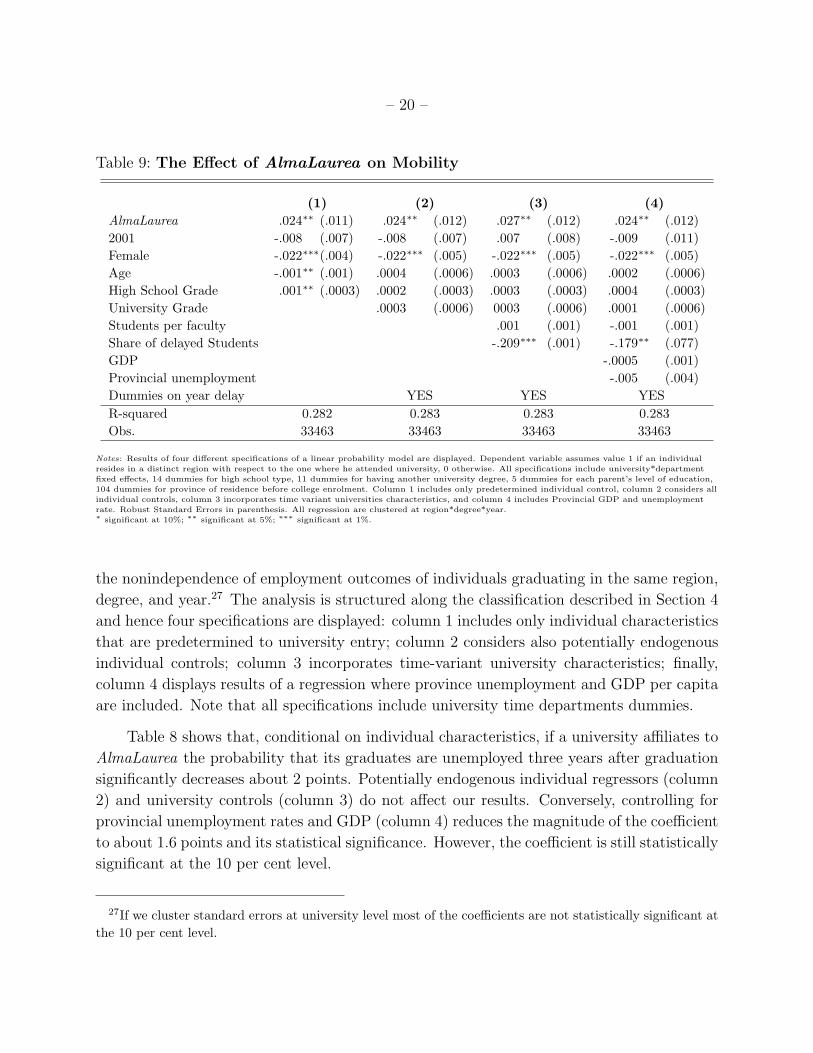
the nonindependence of employment outcomes of individuals graduating in the same region,
degree, and year.27 The analysis is structured along the classification described in Section 4
and hence four specifications are displayed: column 1 includes only individual characteristics
that are predetermined to university entry; column 2 considers also potentially endogenous
individual controls; column 3 incorporates time-variant university characteristics; finally,
column 4 displays results of a regression where province unemployment and GDP per capita
are included. Note that all specifications include university time departments dummies.
Table 8 shows that, conditional on individual characteristics, if a university affiliates to
AlmaLaurea the probability that its graduates are unemployed three years after graduation
significantly decreases about 2 points. Potentially endogenous individual regressors (column
2) and university controls (column 3) do not affect our results. Conversely, controlling for
provincial unemployment rates and GDP (column 4) reduces the magnitude of the coefficient
to about 1.6 points and its statistical significance. However, the coefficient is still statistically
significant at the 10 per cent level.
27If we cluster standard errors at university level most of the coefficients are not statistically significant at
the 10 per cent level.
– 21 –
Table 10: The Effect of AlmaLaurea on Wages
(1) (2) (3) (4)
AlmaLaurea .034∗ (.017) .036∗∗ (.018) .035∗ (.018) .031∗ (.018)
2001 .222∗∗∗(.015) .227∗∗∗ (.015) .227∗∗∗ (.016) .201∗∗∗ (.020)
Female -.153∗∗∗(.008) -.157∗∗∗ (.008) -.158∗∗∗ (.008) -.158∗∗∗ (.008)
Age .013∗∗∗(.002) .017∗∗∗ (.001) .017∗∗∗ (.002) .017∗∗∗ (.002)
High School Grade .005∗∗∗(.0005) .003∗∗∗ (.0006) .003∗∗∗ (.0006) .003∗∗∗ (.0006)
University Grade .005∗∗∗ (.0008) .005∗∗∗ (.0008) .005∗∗∗ (.0008)
Students per faculty .003∗ (.001) .002 (.001)
Share of delayed Students .020 (.100) .055 (.102)
GDP .002∗∗∗ (.0005)
Provincial unemployment -.011∗∗ (.005)
Dummies on year delay YES YES YES
R-squared 0.252 0.259 0.259 0.260
Obs. 20838 20838 20838 20838
Notes: Results of three different specifications of a OLS model are displayed. Dependent variable is the logarithm of monthly net wages. All
specifications include university*department fixed effects, 14 dummies for high school type, 11 dummies for having another university degree, 5
dummies for each parent’s level of education, 104 dummies for province of residence before college enrolment. Column 1 includes only
predetermined individual control, column 2 considers all individual controls, column 3 incorporates time variant universities characteristics,
column 4 includes provincial GDP and provincial unemployment rates. Robust Standard Errors in parenthesis. All regression are clustered at
region*degree*year.∗ significant at 10%; ∗∗ significant at 5%; ∗∗∗ significant at 1%.
Table 9 shows that also regional mobility rates have different dynamics for graduates
in AlmaLaurea universities: depending of the controls used, AlmaLaurea has a positive and
statistically significant effect on mobility that ranges from 2.3 to 2.8 points.28
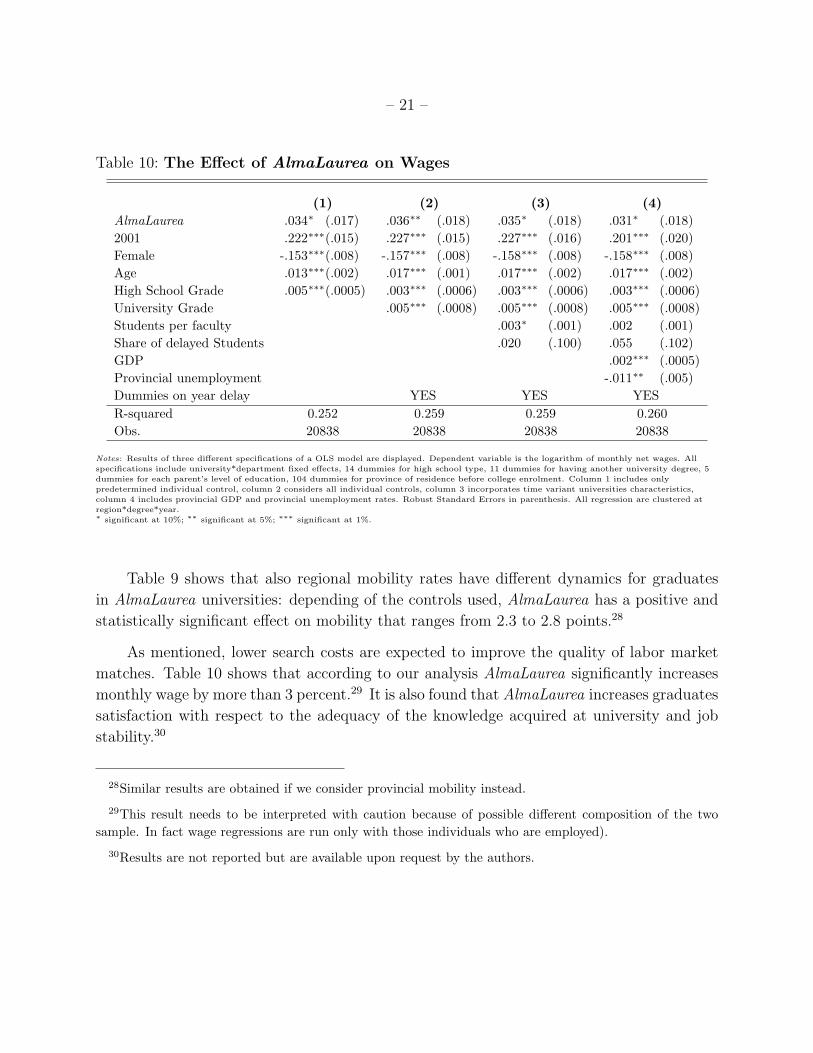
As mentioned, lower search costs are expected to improve the quality of labor market
matches. Table 10 shows that according to our analysis AlmaLaurea significantly increases
monthly wage by more than 3 percent.29 It is also found that AlmaLaurea increases graduates
satisfaction with respect to the adequacy of the knowledge acquired at university and job
stability.30
28Similar results are obtained if we consider provincial mobility instead.
29This result needs to be interpreted with caution because of possible different composition of the two
sample. In fact wage regressions are run only with those individuals who are employed).
30Results are not reported but are available upon request by the authors.
– 22 –
5.2. Universities that join in 1998
The above findings may be driven by time varying omitted university characteristics.
To investigate whether this is the case, in this section, we exploit an additional source of
exogenous variation. Universities of Turin and Easter Piedmont joined AlmaLaurea in Au-
gust 1998 and hence sold resumes on-line only for those 1998 graduates that completed their
degree after summer. Hence, in a second difference-in-differences setting the new treatment
group is composed by graduates from these two universities and the before and after is
graduation after August. In this specification only 1998 data are considered and dummies
for month of graduation are included. As shown in Table 11, AlmaLaurea has significantly
decreased unemployment probability by about 2.5 points, which is a similar magnitude to
the one above. However, no significant effect is observed neither on mobility nor on wages.
6. Unparallel Outcomes
Possibly, the most important threat to the internal validity of the above results concerns
the extent to which the ”parallel trends” assumption stated in equation 1 is valid. A standard
way of assessing its plausibility is using data from pre-treatment periods to check whether
trends were indeed parallel in the past. If this is the case, it is more likely that the results
found stem from the treatment itself.
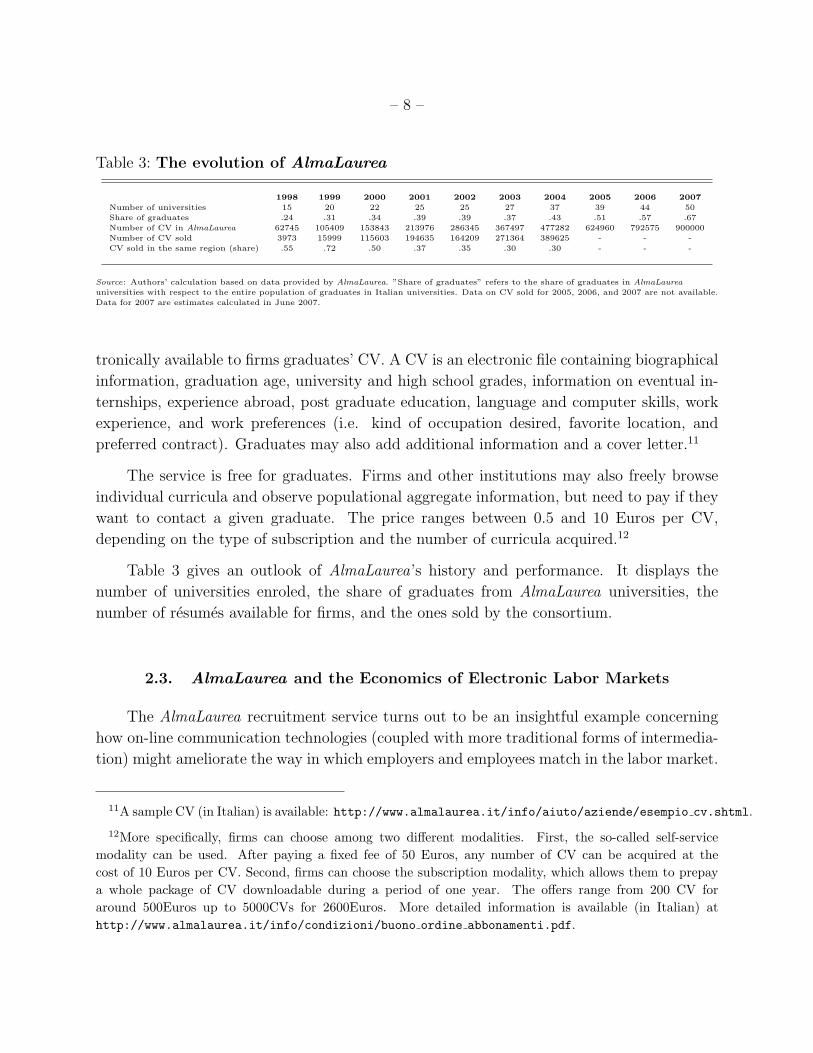
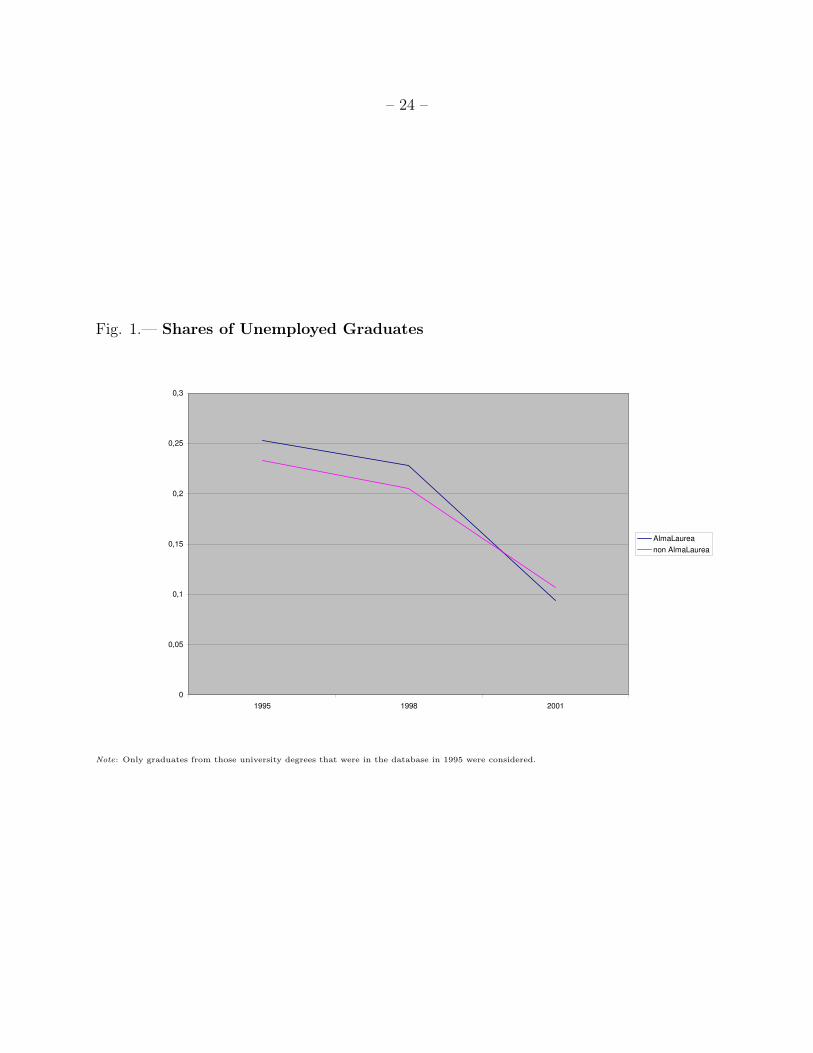
ISTAT run a previous edition of the University-to-work survey on 1992 graduates in-
terviewed in 1995.31 As showed in Figure 1, before 1998 the employment rates dynamics of
the control and the treatment groups have been remarkably similar. More formally, we run
the DID method with linear controls employing data concerning 1992 and 1995 graduates,
when AlmaLaurea was not operating yet. Table 12, shows that the magnitude of the DID
coefficient concerning unemployment is positive, negligible, and it is not statistically differ-
ent from zero. As far as mobility is concerned, a similar result is obtained: the AlmaLaurea
coefficient is not statistically different from zero. This suggests that the coefficients depicted
in Table 8 and Table 9 do not stem from groups unparallel trends.
Of course, the above checks do not control for time specific unparallel outcomes. In fact,
possible interactions between AlmaLaurea enrolment and unobserved time variant character-
istics are not easy to be ruled out. One might argue, for example, that those universities that
self-selected in the treatment group are the ones that improved the most their unobservable
teaching quality. This might affect occupational outcomes of their graduates.
31Unfortunately 1995 survey does not reports data on wages.

– 23 –
Table 11: The Effect of AlmaLaurea: the case of Turin and Eastern Piedmont
PANEL A
Unemployment
pre August post August Diff.
Turin and Eastern Piedmont .038 .016 -.022
non Turin and Eastern Piedmont .102 .104 .002
Diff. -.024 **
St. Err. (.011)
Mobility
pre August post August Diff.
Turin and Eastern Piedmont .165 .164 -.001
non Turin and Eastern Piedmont .227 .228 .001
Diff. .002
St. Err. (.026)
Wage
pre August post August Diff.
Turin and Eastern Piedmont 1151.4 1103.9 -47.5
non Turin and Eastern Piedmont 1152.3 1134.1 -18.2
Diff. -29.4
St. Err. (32.1)
PANEL B
Unemployment Mobility Log Wage
AlmaLaurea -.025∗∗∗ (.008) .009 (.022) -.016 (.018)
Female .043∗∗∗ (.005) -.021∗∗∗ (.007) -.149∗∗∗ (.009)
Age -.002∗ (.001) .0005 (.001) .017∗∗∗ (.002)
High School Grade -.001∗∗∗ (.0002) .0001 (.0003) .002∗∗∗ (.0006)
University Grade -.001∗∗ (.0006) .0004 (.001) .005∗∗∗ ( .001)
Dummies on year delay YES YES YES
Dummies for month of graduation YES YES YES
R-squared 0.122 0.251 0.226
Obs. 20547 20547 12975
Notes: The analysis is performed on 1998 graduates. Treatment group is composed by graduates from Universities of Turin and Eastern
Piedmont. Before and after is graduation before and after August. All specifications include university*department fixed effects. Robust
Standard Errors in parenthesis. All regression are clustered at region*degree*year.∗ significant at 10%; ∗∗ significant at 5%; ∗∗∗ significant at 1%.
– 24 –
Fig. 1.— Shares of Unemployed Graduates
0
0,05
0,1
0,15
0,2
0,25
0,3
1995 1998 2001
AlmaLaurea
non AlmaLaurea
Note: Only graduates from those university degrees that were in the database in 1995 were considered.
– 25 –
Table 12: Pre-adoption falsification test of AlmaLaurea
Unemployment Mobility
AlmaLaurea .004 (.013) .011 (.012)
1998 -.027∗∗∗(.008) .005 (.006)
Female .079∗∗∗(.008) -.026∗∗∗(.005)
GDP -.001∗∗ (.0004) -.003 (.003)
Provincial unemployment .003 (.002) .001 (.002)
R-squared 0.150 0.322
Obs. 27373 27565
Notes: In the first column dependent variable assumes value 1 if a given graduate is unemployed, 0 otherwise. In the second column dependent
variable assumes value 1 if a given individual resides in a different region with respect to the one where she attended universities. Only
individuals graduated in 1992 and 1995 are considered. AlmaLaurea assumes value 1 for 1995 graduates from universities that enrol in
AlmaLaurea in between 1995 and 1998. All specifications include university*department fixed effects. Robust Standard Errors in parenthesis. All
regression are clustered at region*degree*year.∗ significant at 10%; ∗∗ significant at 5%; ∗∗∗ significant at 1%.
Table 13: The Effect of AlmaLaurea using a placebo treatment group
Unemployment Mobility Log Wage
Placebo AlmaLaurea .024 -.017 .011
(.025) (.026) (.036)
R-squared 0.152 0.389 0.260
Obs. 26278 26278 16464
Notes: Placebo AlmaLaurea assumes value 1 for graduates for 1998 universities of Siena and Lecce, 0 otherwise. All specifications include the full
set of control used in column 4 of Tables 8, 9, and 10. Robust Standard Errors in parenthesis. All regression are clustered at region*degree*year.
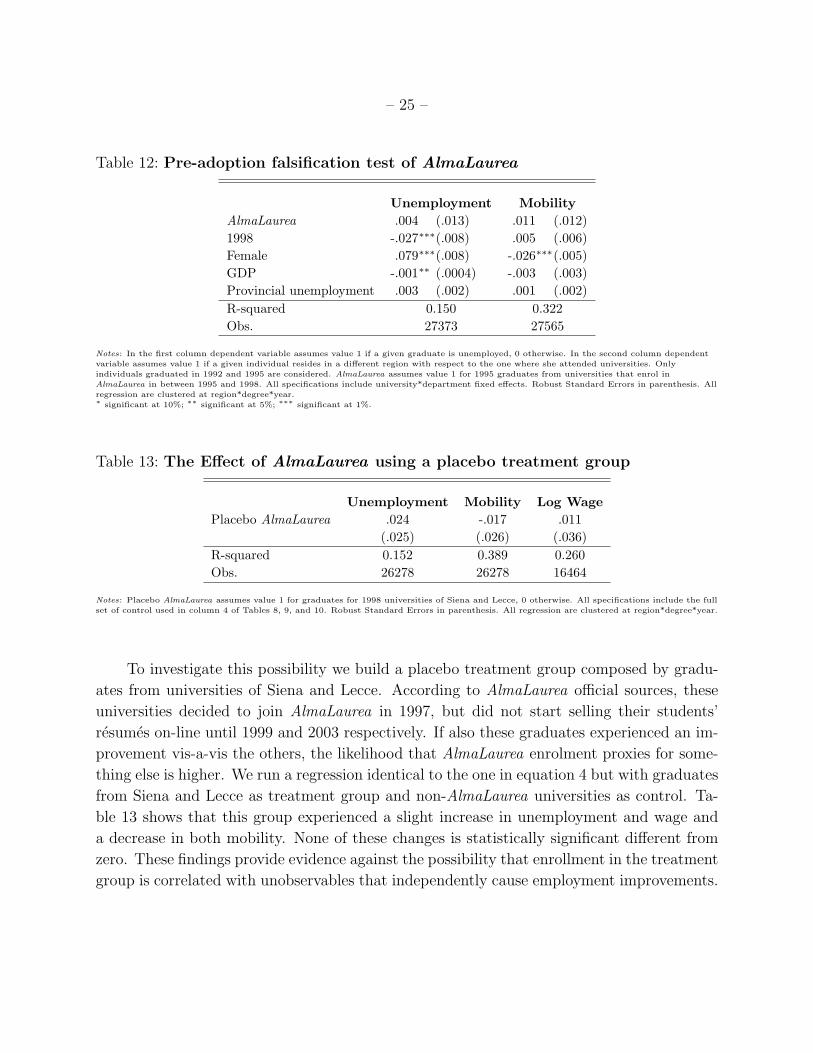
To investigate this possibility we build a placebo treatment group composed by gradu-
ates from universities of Siena and Lecce. According to AlmaLaurea official sources, these
universities decided to join AlmaLaurea in 1997, but did not start selling their students’
resumes on-line until 1999 and 2003 respectively. If also these graduates experienced an im-
provement vis-a-vis the others, the likelihood that AlmaLaurea enrolment proxies for some-
thing else is higher. We run a regression identical to the one in equation 4 but with graduates
from Siena and Lecce as treatment group and non-AlmaLaurea universities as control. Ta-
ble 13 shows that this group experienced a slight increase in unemployment and wage and
a decrease in both mobility. None of these changes is statistically significant different from
zero. These findings provide evidence against the possibility that enrollment in the treatment
group is correlated with unobservables that independently cause employment improvements.
– 26 –
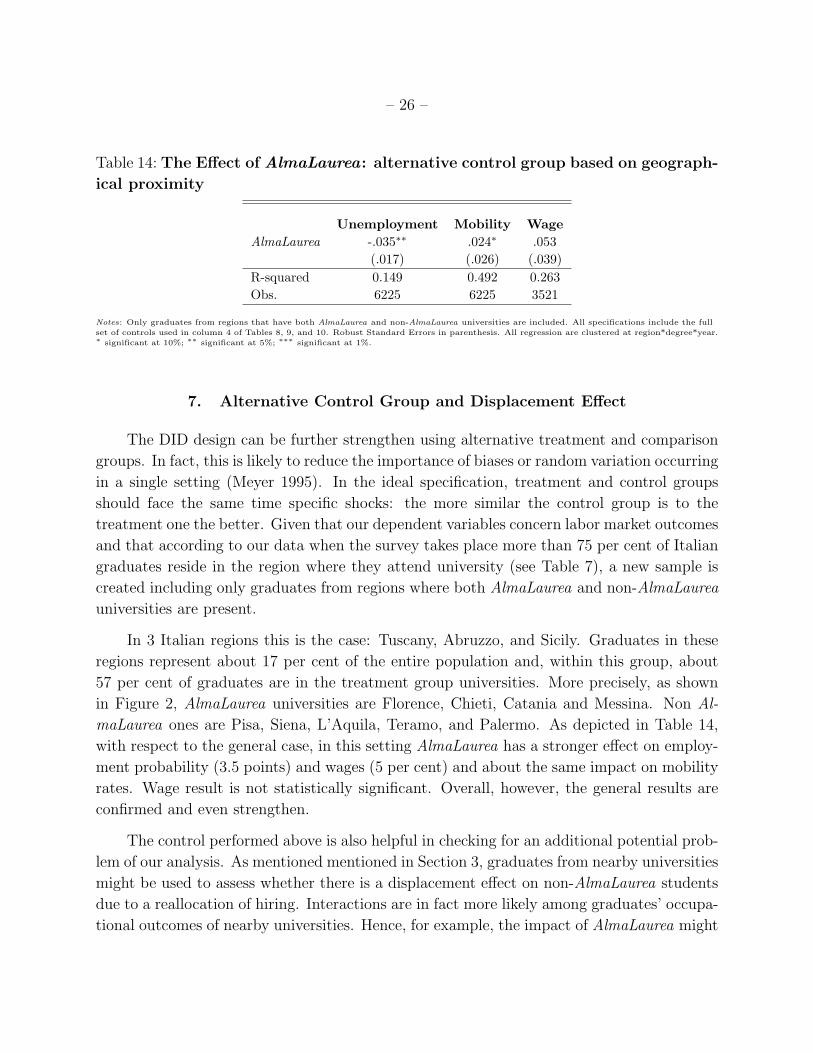
Table 14: The Effect of AlmaLaurea: alternative control group based on geograph-
ical proximity
Unemployment Mobility Wage
AlmaLaurea -.035∗∗ .024∗ .053
(.017) (.026) (.039)
R-squared 0.149 0.492 0.263
Obs. 6225 6225 3521
Notes: Only graduates from regions that have both AlmaLaurea and non-AlmaLaurea universities are included. All specifications include the full
set of controls used in column 4 of Tables 8, 9, and 10. Robust Standard Errors in parenthesis. All regression are clustered at region*degree*year.∗ significant at 10%; ∗∗ significant at 5%; ∗∗∗ significant at 1%.
7. Alternative Control Group and Displacement Effect
The DID design can be further strengthen using alternative treatment and comparison
groups. In fact, this is likely to reduce the importance of biases or random variation occurring
in a single setting (Meyer 1995). In the ideal specification, treatment and control groups
should face the same time specific shocks: the more similar the control group is to the
treatment one the better. Given that our dependent variables concern labor market outcomes
and that according to our data when the survey takes place more than 75 per cent of Italian
graduates reside in the region where they attend university (see Table 7), a new sample is
created including only graduates from regions where both AlmaLaurea and non-AlmaLaurea
universities are present.
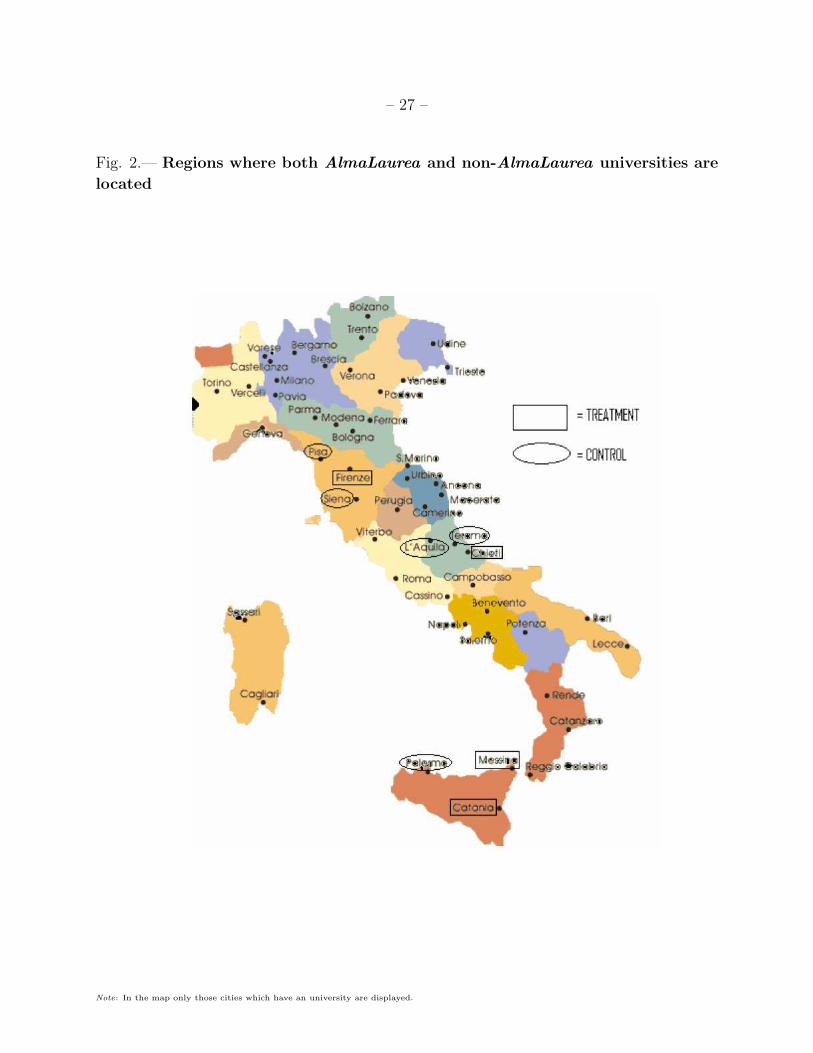
In 3 Italian regions this is the case: Tuscany, Abruzzo, and Sicily. Graduates in these
regions represent about 17 per cent of the entire population and, within this group, about
57 per cent of graduates are in the treatment group universities. More precisely, as shown
in Figure 2, AlmaLaurea universities are Florence, Chieti, Catania and Messina. Non Al-
maLaurea ones are Pisa, Siena, L’Aquila, Teramo, and Palermo. As depicted in Table 14,
with respect to the general case, in this setting AlmaLaurea has a stronger effect on employ-
ment probability (3.5 points) and wages (5 per cent) and about the same impact on mobility
rates. Wage result is not statistically significant. Overall, however, the general results are
confirmed and even strengthen.
The control performed above is also helpful in checking for an additional potential prob-
lem of our analysis. As mentioned mentioned in Section 3, graduates from nearby universities
might be used to assess whether there is a displacement effect on non-AlmaLaurea students
due to a reallocation of hiring. Interactions are in fact more likely among graduates’ occupa-
tional outcomes of nearby universities. Hence, for example, the impact of AlmaLaurea might
– 27 –
Fig. 2.— Regions where both AlmaLaurea and non-AlmaLaurea universities are
located
Note: In the map only those cities which have an university are displayed.
– 28 –
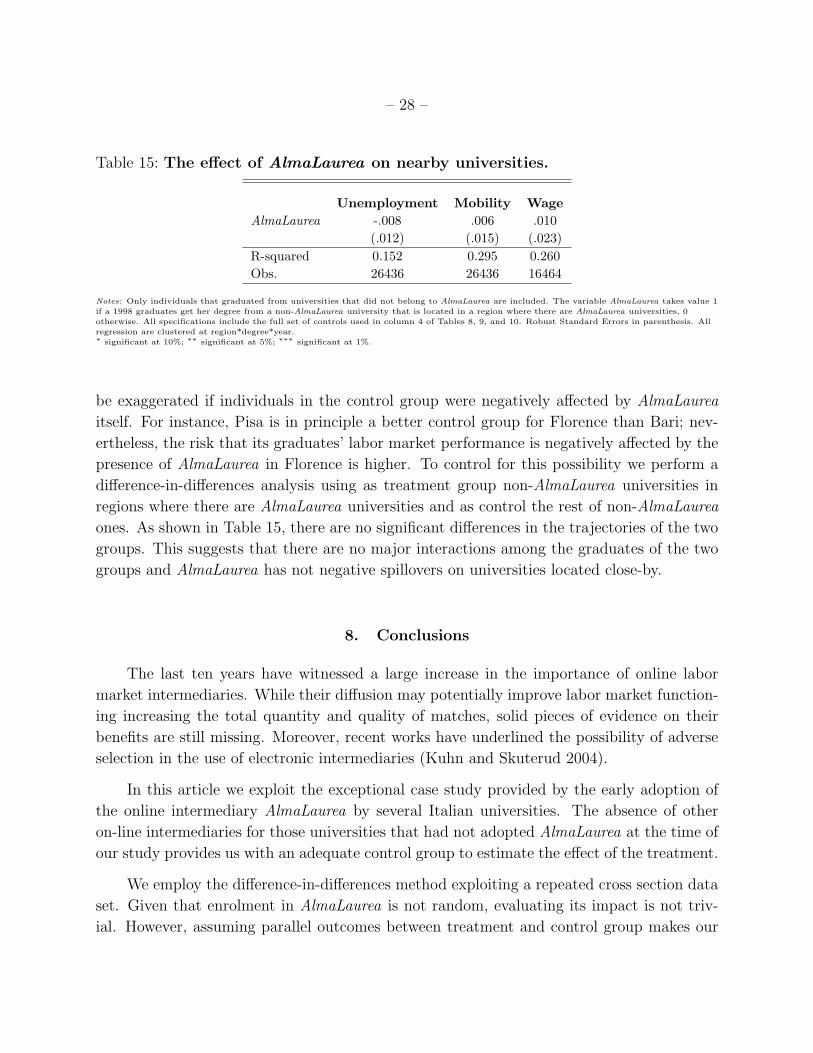
Table 15: The effect of AlmaLaurea on nearby universities.
Unemployment Mobility Wage
AlmaLaurea -.008 .006 .010
(.012) (.015) (.023)
R-squared 0.152 0.295 0.260
Obs. 26436 26436 16464
Notes: Only individuals that graduated from universities that did not belong to AlmaLaurea are included. The variable AlmaLaurea takes value 1
if a 1998 graduates get her degree from a non-AlmaLaurea university that is located in a region where there are AlmaLaurea universities, 0
otherwise. All specifications include the full set of controls used in column 4 of Tables 8, 9, and 10. Robust Standard Errors in parenthesis. All
regression are clustered at region*degree*year.∗ significant at 10%; ∗∗ significant at 5%; ∗∗∗ significant at 1%.
be exaggerated if individuals in the control group were negatively affected by AlmaLaurea
itself. For instance, Pisa is in principle a better control group for Florence than Bari; nev-
ertheless, the risk that its graduates’ labor market performance is negatively affected by the
presence of AlmaLaurea in Florence is higher. To control for this possibility we perform a
difference-in-differences analysis using as treatment group non-AlmaLaurea universities in
regions where there are AlmaLaurea universities and as control the rest of non-AlmaLaurea
ones. As shown in Table 15, there are no significant differences in the trajectories of the two
groups. This suggests that there are no major interactions among the graduates of the two
groups and AlmaLaurea has not negative spillovers on universities located close-by.
8. Conclusions
The last ten years have witnessed a large increase in the importance of online labor
market intermediaries. While their diffusion may potentially improve labor market function-
ing increasing the total quantity and quality of matches, solid pieces of evidence on their
benefits are still missing. Moreover, recent works have underlined the possibility of adverse
selection in the use of electronic intermediaries (Kuhn and Skuterud 2004).
In this article we exploit the exceptional case study provided by the early adoption of
the online intermediary AlmaLaurea by several Italian universities. The absence of other
on-line intermediaries for those universities that had not adopted AlmaLaurea at the time of
our study provides us with an adequate control group to estimate the effect of the treatment.
We employ the difference-in-differences method exploiting a repeated cross section data
set. Given that enrolment in AlmaLaurea is not random, evaluating its impact is not triv-
ial. However, assuming parallel outcomes between treatment and control group makes our
– 29 –
estimation valid. The time variant indicators of individual and university quality and stan-
dard tests aimed at ruling out alternative explanation do not raise major concern on this
important assumption.
The evidence shows that online labor market intermediary adoption has a positive effect
on graduates labor market outcomes three years after graduation. In particular, it is found
that AlmaLaurea decreases graduates’ unemployment probability by about 2 points. Our
study also suggests that on-line labor market intermediaries have a positive effect on wages
and workers’ geographical mobility.
The results presented in this paper also contribute to the policy discussion on university-
to-work transition. The poor labor performance of Italian graduates has been traditionally
ascribed to demand and supply factors. We show that graduate labor market functioning
can also be improved with the introduction of on-line intermediaries.
In future research we aim at exploring whether the positive impact of electronic labor
market intermediaries affected evenly the whole graduate population. Moreover, while in
this paper we focus on average outcomes, the effect on outcome distribution remains an
issue for further research.
REFERENCES
Autor, D.H. (2001). ”Wiring the Labor Market.” Journal of Economic Perspectives, 15,
25-40.
Bagues, M., M. Sylos Labini and N. Zinovyeva (2007). ”The Endogeneity of University Grad-
ing Standards and Labor Market Mismatch: Evidence from Italy.” Mimeo, University
of Strasbourg.
Brunello, G. and L. Cappellari (2005). ”The Labour Market Effects of Alma Mater: Evidence
from Italy.” IZA Discussion Paper, No. 1562. Forthcoming in Economics of Education
Review.
Burdett, K. and J. Ondrich (1985). ”How Changes in Labor Demand Affect Unemployed
Workers.” Journal of Labor Economics, 3(1), 1-10.
Congressional Budget Office (2002). The Effect of Changes in the Labor Markets on the
Natural Rate of Unemployment, April.
Freeman, R.B. (2002). ”The Labor Market in the New Information Economy.” Oxford Review
of Economic Policy, 18(3), 288-305.

– 30 –
Heckman, J.J. (1990). ”Varaieties of Selection Bias.” American Economic Review, 80(2),
Paper and Procedings, 313-318.
Kuhn, P. (2000). ”The Internet and Matching in Labor Markets” in New Economy Handbook.
D.C. Jones ed. Amsterdam, Elsevier.
Kuhn, P. and M. Skuterud (2004). ”Internet Job Search and Unemployment Duration.”
American Economic Review, 94(1), 218-232.
Mannheim Centre for European Social Research (2002). ”Indicators on School-to-Work Tran-
sitions in Europe.” Mannheim: Mzes.
Meyer, B.D. (1995). ”Natural and Quasi-Experiments in Economics.” Journal of Business
& Economic Statistics. 13, 151-161.
Pissarides, C. (2000). Equilibrium Unemployment Theory. 2nd Edition. Cambridge MA, The
MIT Press.
OECD (2007). Education at a Glance. Paris, Organization for Economic Co-operation and
Development.
Rebick, M.E. (2000). ”The Importance of Networks in the Market for University Graduates
in Japan: a Longitudinal Analysis of Hiring Patterns.” Oxford Economic Papers, 52,
471-496.
Rubin, D.B. (1974). ”Estimating Causal Effects of Treatments in Randomized and Nonran-
domized Studies.” Journal of Educational Psychology, 66, 688-701.
Stevenson, B. (2007). ”The Internet and Job Search.” Mimeo, University of Pensilvania.