dr. mark jakubauskas kansas biological survey 2101 constant avenue lawrence, kansas 66047
DESCRIPTION
Development of Remote Sensing-based Predictive Models for the Management of Taste and Odor Events in Kansas Reservoirs. Dr. Mark Jakubauskas Kansas Biological Survey 2101 Constant Avenue Lawrence, Kansas 66047. - PowerPoint PPT PresentationTRANSCRIPT
Development of Remote Sensing-based Predictive Models for the Management of
Taste and Odor Events in Kansas Reservoirs
Development of Remote Sensing-based Predictive Models for the Management of
Taste and Odor Events in Kansas Reservoirs
Dr. Mark JakubauskasKansas Biological Survey2101 Constant Avenue
Lawrence, Kansas 66047
Dr. Mark JakubauskasKansas Biological Survey2101 Constant Avenue
Lawrence, Kansas 66047

Development of Remote Sensing-based Predictive Models for the Management of Taste and Odor Events in Kansas Reservoirs
Project Tasks:
– A remote sensing-based predictive model providing an advance warning of potential drinking water taste and odor problems.
– Remote sensing-based seasonal and year-to-year reservoir condition maps showing sediment plumes and algae bloom patterns within large reservoirs.
Project Tasks:
– A remote sensing-based predictive model providing an advance warning of potential drinking water taste and odor problems.
– Remote sensing-based seasonal and year-to-year reservoir condition maps showing sediment plumes and algae bloom patterns within large reservoirs.
Work Item: Develop Advance Warning Model
A predictive model providing an advance warning of potential drinking water taste and odor problems will be developed.
This model will use remotely sensed and other data to develop predictive relationships between surrogates of watershed landscape condition (Normalized Difference Vegetation Index, Vegetation Phenological Metrics), reservoir condition, and reported taste and odor events.
Reservoirs for which the most complete and extensive data sets are available will be selected for this analysis.

Traditional approaches: Land use / Land Cover
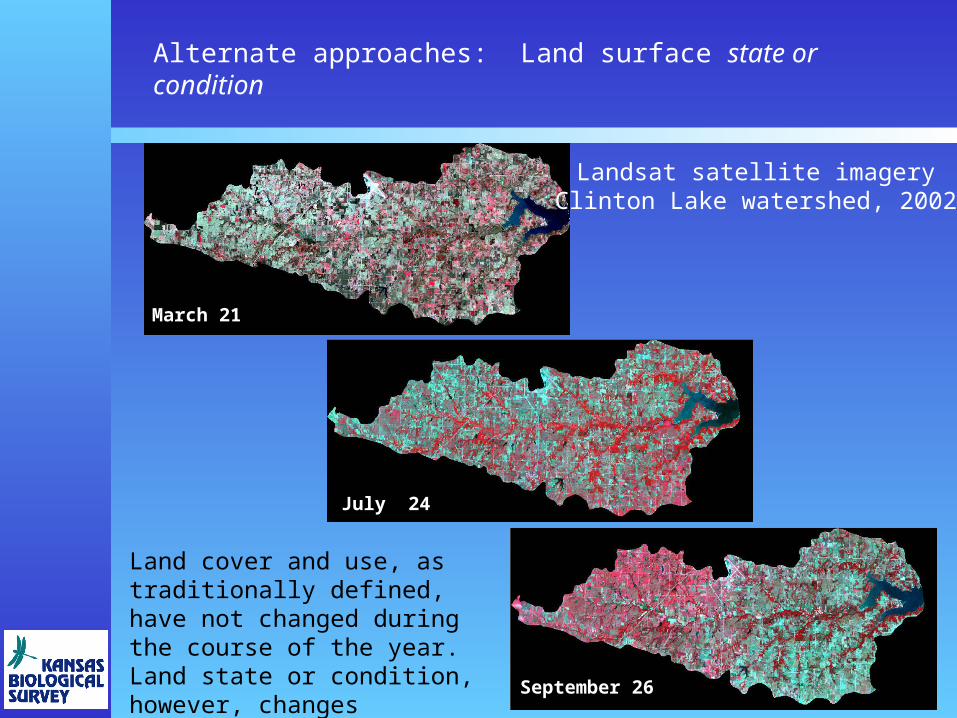
Alternate approaches: Land surface state or condition
Landsat satellite imageryClinton Lake watershed, 2002
March 21
July 24
September 26
Land cover and use, as traditionally defined, have not changed during the course of the year. Land state or condition, however, changes dramatically.

Quantifying vegetation condition – The Normalized Difference Vegetation Index (NDVI)
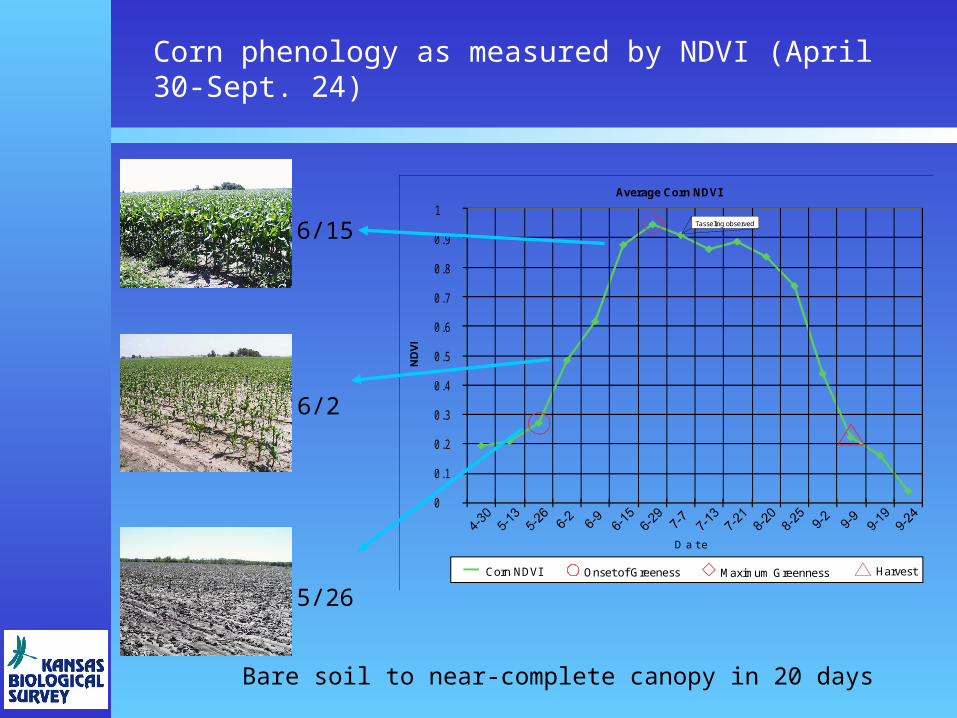
Corn phenology as measured by NDVI (April 30-Sept. 24)
Average Corn NDVI
D a t e
0
0.1
0.2
0.3
0.4
0.5
0.6
0.7
0.8
0.9
1Tasseling observed
Corn NDVI Maximum Greenness HarvestOnset of Greeness
Bare soil to near-complete canopy in 20 days
5/26
6/2
6/15
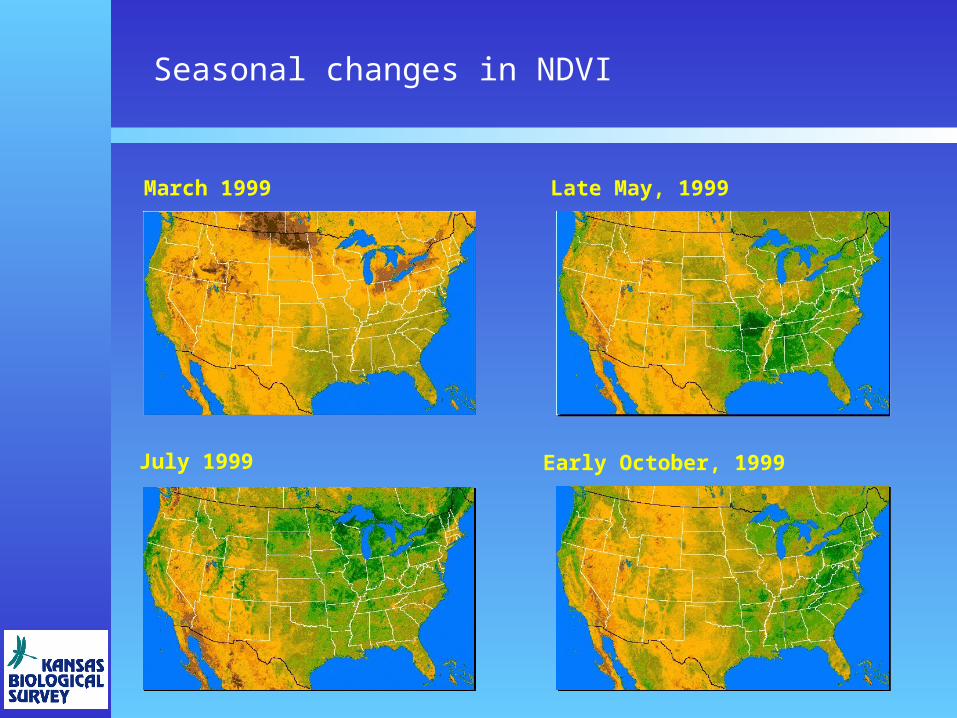
Seasonal changes in NDVI
Early October, 1999
March 1999
July 1999
Late May, 1999
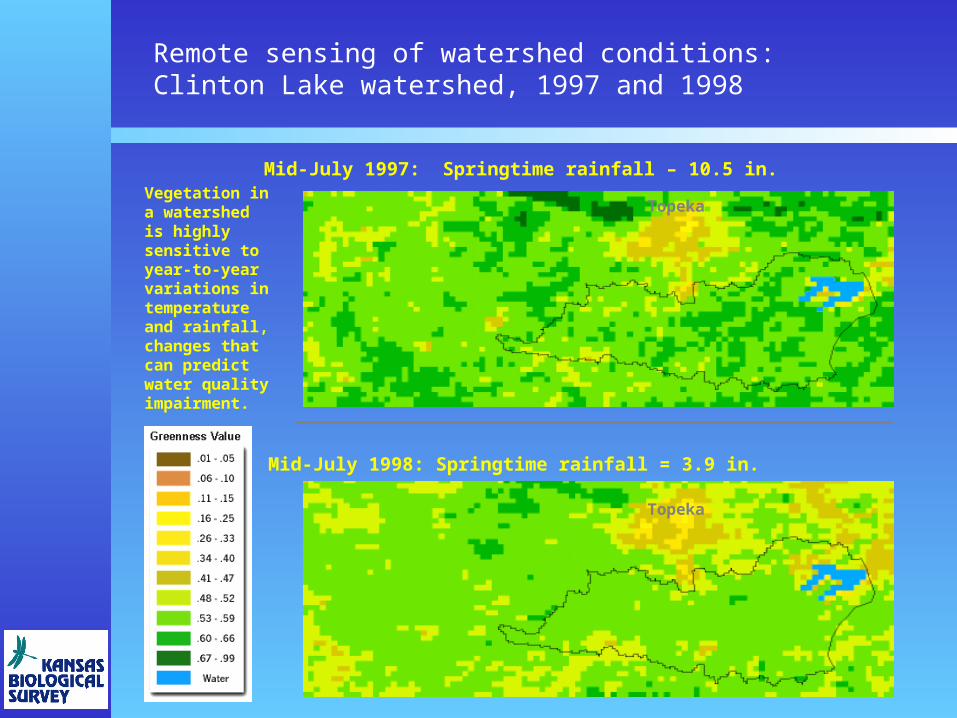
Remote sensing of watershed conditions:Clinton Lake watershed, 1997 and 1998
Mid-July 1997: Springtime rainfall – 10.5 in.
Mid-July 1998: Springtime rainfall = 3.9 in.
Topeka
Topeka
Vegetation in a watershed is highly sensitive to year-to-year variations in temperature and rainfall, changes that can predict water quality impairment.

Average growing season NDVI as a function of precipitation for a fifteen-month precipitation period (current growing season plus the seven preceding months).
0.40
0.38
0.36
0.34
0.32
0.30
0.28
1990
19891991
19921993
1994
1995
1996
1997
NDVI = 0.151 + 0.000207 = Precipitation
Precipitation (mm)
600 700 800 900 1000 1100 13001200
Satellite NDVI is responsive to climate variations
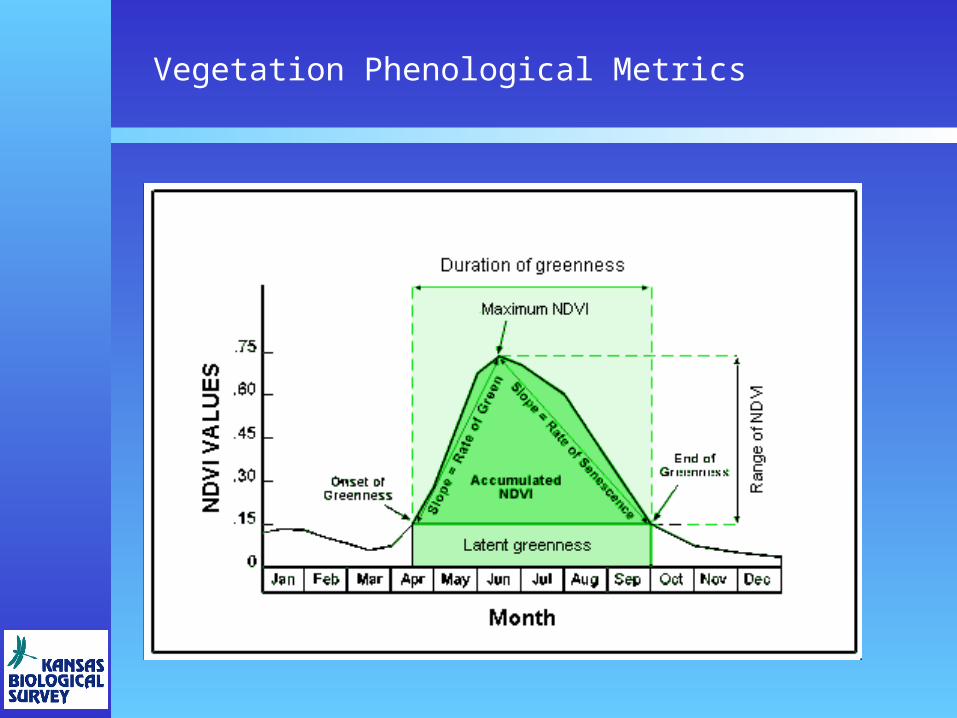
Vegetation Phenological Metrics

Vegetation Phenological Metrics
Temporal Metrics: Time of onset of greenness Time of end of greenness Duration of greenness Time of maximum greenness
NDVI-value Metrics: Value of onset of greenness Value of end of greenness Value of maximum NDVI Range of NDVI
Derived Metrics: Accumulated NDVI Rate of green up Rate of senescence Mean daily NDVI
Beginning of photosynthetic activity End of photosynthetic activity Length of photosynthetic activity Time when photosynthesis is maximum
Level of photosynthesis at start Level of photosynthesis at end Level of photosynthesis at maximum Range of measurable photosynthesis
Net Primary Production Acceleration of increasing photosynthetic activity Acceleration of decreasing photosynthetic activity Mean daily photosynthetic activity

Watershed NDVI and water quality relationships
Predicting potential total phosphorus using satellite-derived vegetation indices

Average Time of Onset of Greenness (1989-1998)
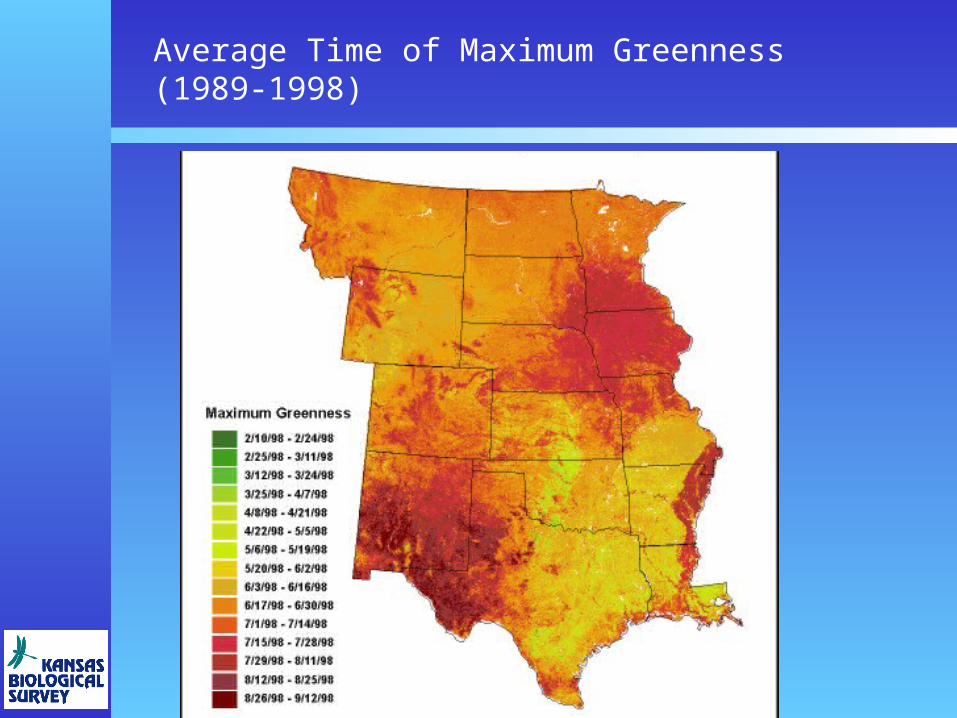
Average Time of Maximum Greenness (1989-1998)

D. Develop Advance Warning Model
TASK ITEMS:TASK ITEMS:
1.1. Select reservoirs for analysisSelect reservoirs for analysis 10/15/0610/15/06
2.2. Obtain and analyze satellite imageryObtain and analyze satellite imagery 12/15/0612/15/06
- Watershed landscape condition- Watershed landscape condition
- Reservoir condition- Reservoir condition
3.3. Analyze existing data from Item A-4Analyze existing data from Item A-4 12/15/0612/15/06
4.4. Develop modelDevelop model 2/1/072/1/07
5.5. Deliverable: Advance Warning ModelDeliverable: Advance Warning Model 4/30/074/30/07

E. Develop Alternative Monitoring Methods
Many reservoirs exhibit relatively rapid changes in water quality conditions, sediment plumes and algae blooms that are difficult and expensive to detect using traditional sampling techniques.
Multitemporal MODIS satellite imagery will be used to develop seasonal and year-to-year reservoir condition maps showing sediment plumes and algae bloom patterns within large reservoirs.
As a prototype, Kansas’ 10 largest reservoirs providing a significant source of drinking water will be mapped.

1 mile
Cheney Reservoir,June-July, 2003
Red areas on this Landsat Thematic Mapper image indicates high chlorophyll (blue-green algae) concentrations in the water.
Examples of satellite imagery of reservoir algae blooms

Red areas on these Landsat Thematic Mapper images indicate high chlorophyll (blue-green algae) concentrations in the water.
“Following a three-week ordeal with anabaena algae in the Marion Reservoir, the water plants in Hillsboro and Marian were able to restore service in early July.”
Kansas Municipal Utilities Newsletter, August 2003
April 21, 2003
July 10, 2003
Examples of satellite imagery of reservoir algae blooms

Identifying spatial and temporal patterns:Similarities and differences in turbidity among reservoirs within the same region.
1982 1987 1990 1994 2002
ClintonClinton
LakeLake
John John RedmondRedmond
ReservoirReservoir
PerryPerry
LakeLake
PomonaPomona
LakeLake
Low turbidity High turbidity

TASK ITEMS:TASK ITEMS:
1.1. Select 10 reservoirs for analysisSelect 10 reservoirs for analysis 10/15/0610/15/06
2.2. Obtain and process MODIS satellite Obtain and process MODIS satellite imageryimagery
12/15/0612/15/06
3.3. Produce Produce seasonal and year-to-year reservoir condition maps
2/1/072/1/07
4.4. Evaluate feasibility of satellite early Evaluate feasibility of satellite early warning and monitoring system for warning and monitoring system for reservoir condition monitoringreservoir condition monitoring
4/30/074/30/07
E. Develop Alternative Monitoring Methods

Reservoir Bathymetry – some brief notes
In May 2006, the Kansas Biological Survey acquired a Biosonics DT-X digital acoustic echosounding system.
The system, sampling methodologies, and data processing approaches are currently being tested.
Lone Star, Olathe, and Carbondale Lakes have been surveyed under the testing phase (Gardner Lake scheduled for July 26, 2006)

Intensity and timing of the signal received back by transducer is a function of depth, intervening medium (water), and the characteristics of the bottom sediments.
“Echogram”“Echogram”
Acoustic Remote Sensing for Reservoir Studies
Depth = ½ (Speed of sound in water x time)

Olathe Lake, KansasBathymetry survey tracks, June 2, 2006

Lone Star Lake – First test, KBS bathymetric mapping system

Olathe Lake Bathymetry Map

Carbondale Lake – KBS bathymetry overlaid on pre-impoundment topographic contour map

Depth in feet
bottom_mask
<VALUE>No data
Mud
Thin mud/rock base
Rock
Carbondale Lake - Test BathymetryPreliminary Bottom Type Map
0 200 400100 MetersµBottom Classification
No data
Mud
Thin mud/rock base
Rock
Carbondale Lake –Preliminary bottom type classification map

Development of Remote Sensing-based Predictive Models for the Management of
Taste and Odor Events in Kansas Reservoirs
Development of Remote Sensing-based Predictive Models for the Management of
Taste and Odor Events in Kansas Reservoirs
Dr. Mark JakubauskasKansas Biological Survey2101 Constant Avenue
Lawrence, Kansas 66047
Dr. Mark JakubauskasKansas Biological Survey2101 Constant Avenue
Lawrence, Kansas 66047