dubai real estate market overview - q3 2016 final
TRANSCRIPT

DUBAI REAL ESTATE MARKETOVERVIEW
Q3 2016

RENTAL GROWTH SLOWING
RENTSFALLING
RENTAL GROWTH ACCELERATING
RENTSBOTTOMING OUT
OFFICE RESIDENTIAL RETAIL HOTEL*
COPYRIGHT © JONES LANG LASALLE IP, INC. 2016
RENTAL GROWTH SLOWING
RENTSFALLING
RENTAL GROWTH ACCELERATING
RENTSBOTTOMING OUT
DUBAIMARKET SUMMARY
Expo 2020 was a dominant topic during thepresentations at the summit. The planningfor a meaningful legacy and ensuring apositive impact beyond 2020 are at theforefront of the government’s agenda.
Being the first Arab nation to host an expo,Dubai is faced with the challenge of hostingan exceptional event, when it opens itsdoors on the 20th of October 2020. Underthe theme “Connecting Minds, Creating theFuture”, Dubai is seeking to combine aseries of themes (from the age of industryto globalization) under one roof.
Another trending topic at Cityscape wasalternative real estate investments. Theseinclude education, healthcare,infrastructure, logistics and studenthousing.
The education sector is leading the way asan increased number of real estateinvestors, developers and builders seek todiversify their portfolios. The majorattraction of this sector to real estateinvestors and developers are the strengthof demand, the attractive financial returnsavailable and the alignment of this sectorwith government policies to improveeducational standards across the region.
Cityscape reflects mutedcurrent market, ahead ofexpected Expo related boostin activity.
The overall sentiment at CityscapeGlobal 2016 (held in Dubai in September)reflected the relatively subdued nature ofcurrent real estate market conditions inDubai as well as the broader region.
Specifically in Dubai, sentiment wasmuted. The re-announcement of existingprojects dominated the scene, leavinglittle room for new ones.
* Hotel clock reflects the movement of RevPARNote: The property clock is a graphical tool developed by JLL to illustrate where a market sits within its individual rental cycle. These positions are not necessarily
representative of investment or development market prospects. It is important to recognise that markets move at different speeds depending on their maturity, size and economic conditions. Markets will not always move in a clockwise direction, they might move backwards or remain at the same point in their cycle for extended periods.
Source: JLL
Q3 2015 Q3 2016
DUBAI PRIME RENTAL CLOCK
COPYRIGHT © JONES LANG LASALLE IP, INC. 2016
HOT TOPIC
80K
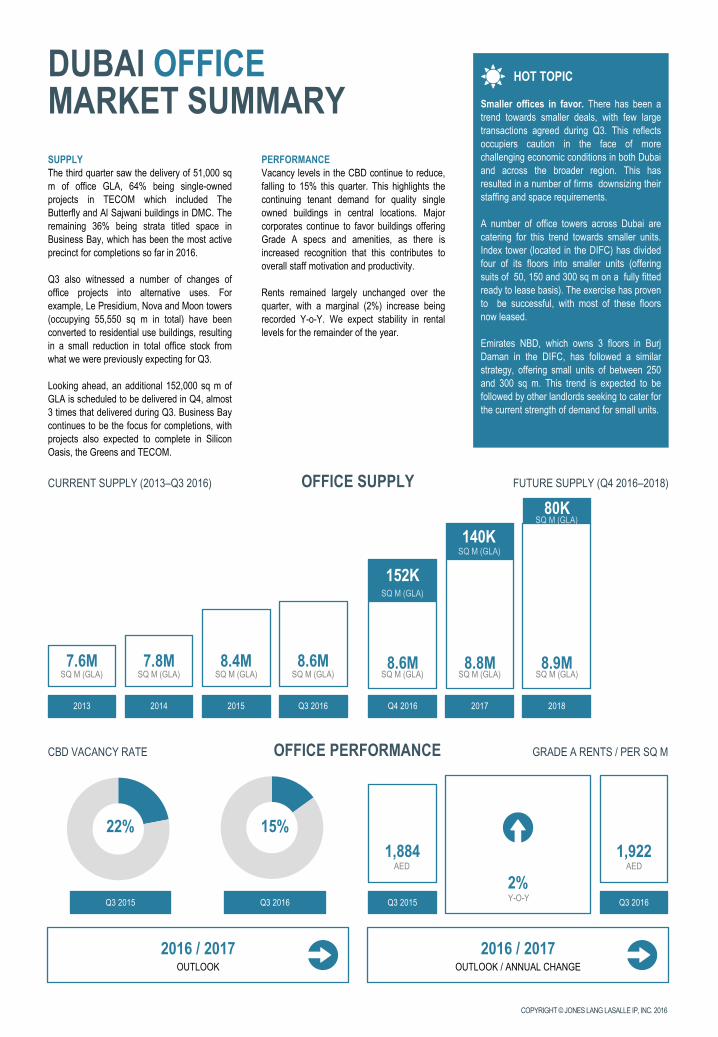
DUBAI OFFICEMARKET SUMMARYSUPPLYThe third quarter saw the delivery of 51,000 sqm of office GLA, 64% being single-ownedprojects in TECOM which included TheButterfly and Al Sajwani buildings in DMC. Theremaining 36% being strata titled space inBusiness Bay, which has been the most activeprecinct for completions so far in 2016.
Q3 also witnessed a number of changes ofoffice projects into alternative uses. Forexample, Le Presidium, Nova and Moon towers(occupying 55,550 sq m in total) have beenconverted to residential use buildings, resultingin a small reduction in total office stock fromwhat we were previously expecting for Q3.
Looking ahead, an additional 152,000 sq m ofGLA is scheduled to be delivered in Q4, almost3 times that delivered during Q3. Business Baycontinues to be the focus for completions, withprojects also expected to complete in SiliconOasis, the Greens and TECOM.
OFFICE SUPPLYCURRENT SUPPLY (2013–Q3 2016) FUTURE SUPPLY (Q4 2016–2018)
Smaller offices in favor. There has been atrend towards smaller deals, with few largetransactions agreed during Q3. This reflectsoccupiers caution in the face of morechallenging economic conditions in both Dubaiand across the broader region. This hasresulted in a number of firms downsizing theirstaffing and space requirements.
A number of office towers across Dubai arecatering for this trend towards smaller units.Index tower (located in the DIFC) has dividedfour of its floors into smaller units (offeringsuits of 50, 150 and 300 sq m on a fully fittedready to lease basis). The exercise has provento be successful, with most of these floorsnow leased.
Emirates NBD, which owns 3 floors in BurjDaman in the DIFC, has followed a similarstrategy, offering small units of between 250and 300 sq m. This trend is expected to befollowed by other landlords seeking to cater forthe current strength of demand for small units.
2013 2014 2015 Q3 2016
7.6M 7.8M 8.4M 8.6M
Q4 2016 2017 2018
8.6M 8.8M 8.9M
OFFICE PERFORMANCECBD VACANCY RATE GRADE A RENTS / PER SQ M
Q3 2015
22%1,884
2%
2016 / 2017
Q3 2016
PERFORMANCEVacancy levels in the CBD continue to reduce,falling to 15% this quarter. This highlights thecontinuing tenant demand for quality singleowned buildings in central locations. Majorcorporates continue to favor buildings offeringGrade A specs and amenities, as there isincreased recognition that this contributes tooverall staff motivation and productivity.
Rents remained largely unchanged over thequarter, with a marginal (2%) increase beingrecorded Y-o-Y. We expect stability in rentallevels for the remainder of the year.
15%
Q3 2015 Q3 2016
152K
AED1,922
AED
OUTLOOK / ANNUAL CHANGE2016 / 2017
OUTLOOK
Y-O-Y
SQ M (GLA) SQ M (GLA) SQ M (GLA) SQ M (GLA) SQ M (GLA) SQ M (GLA) SQ M (GLA)
SQ M (GLA)
SQ M (GLA)
SQ M (GLA)
140K

COPYRIGHT © JONES LANG LASALLE IP, INC. 2016
HOT TOPIC
16K
-1%0%
RESIDENTIAL PERFORMANCE PROPERTY RENT AND SALES INDICES
APARTMENTS VILLAS
SOURCE: REIDINSOURCE: REIDIN
DUBAI RESIDENTIALMARKET SUMMARYSUPPLYThe completion of 5,400 residential units duringQ3 2016 marks the highest quarterlycompletion since Q4 2012 (when approximately6,200 units came into the market).
Apartment units comprised the majority (63%)of total residential units completed during thepast quarter, with Wasl Oasis II (a 13 buildingproject in Muhaisanah, near Sharjah’s border)releasing approximately 690 units. The largestcompletion of villas was the 400 unitscompleted and delivered in Rahat Villas (thesecond phase of the Mudon project inDubailand).
The supply pipeline remains active, with afurther 11 thousand units scheduled to enterthe market in Q4 2016, although not all ofthese projects are likely to be delivered onschedule. Completions scheduled for Q4include approximately 2,500 townhouse andapartment units in the Akoya project by Damacon Al Qudra Street.
RESIDENTIAL SUPPLYCURRENT SUPPLY (2013–Q3 2016) FUTURE SUPPLY (Q4 2016–2018)
Jumeirah Central master plan announcedat Cityscape Global 2016. Dubai Holdinggroup announced its mixed-use developmentat Cityscape in early September 2016. Themega scale project will include 11,000residential units. Construction of Phase 1(which will include 13 residential buildingsencompassing 3,000 units) will start in 2017,on a land plot on the opposite side of SheikhZayed road from the Mall of the Emirates.
This project has replaced Mall of the Worldwhich was announced in 2014. Since thistime, the concept of the mall has beenredesigned and phased over a much longertimeframe and has been relocated to a newsite on Sheikh Mohammed bin Zayed road.
Jumeirah Central is something of a milestoneproject that will establish new levels ofinfrastructure, environmentally friendlytransportation and a new pattern of urban formand community within Dubai.
PERFORMANCEThere has been no change in either rents orprices in the apartment segment of the marketduring Q3, resulting in a reduction in the rate ofdecline on an annual basis. Y-o-Y apartmentrents have declined by -4%, slightly more thanthe Y-o-Y decline in sale prices (-2%).
The pace of decline also seems to bemoderating in the villa segment (where pricesand rents fell by a marginal (-1%) over thequarter).
With only minimal change reported in pricesand rents during Q3, it appears the residentialmarket has now reached the bottom of itscurrent cycle. While we expect prices and rentsto recover in 2017, the pace of this recovery isexpected to be limited by economicuncertainties and the volume of potentialsupply.
2013 2014 2015 Q3 2016
434K 449K 456K 467K
Q4 2016 2017 2018
467K 478K 508KUNITS UNITS UNITS UNITS UNITS UNITS UNITS
UNITS
30KUNITS
UNITS
RENTALS
Q-O-Q0%
SALES
Q-O-Q
-4%RENTALS
Y-O-Y-2%SALES
Y-O-Y
RENTALS
Q-O-Q-1%SALES
Q-O-Q
-6%RENTALS
Y-O-Y-2%SALES
Y-O-Y
11K
COPYRIGHT © JONES LANG LASALLE IP, INC. 2016
HOT TOPIC
18K
14K
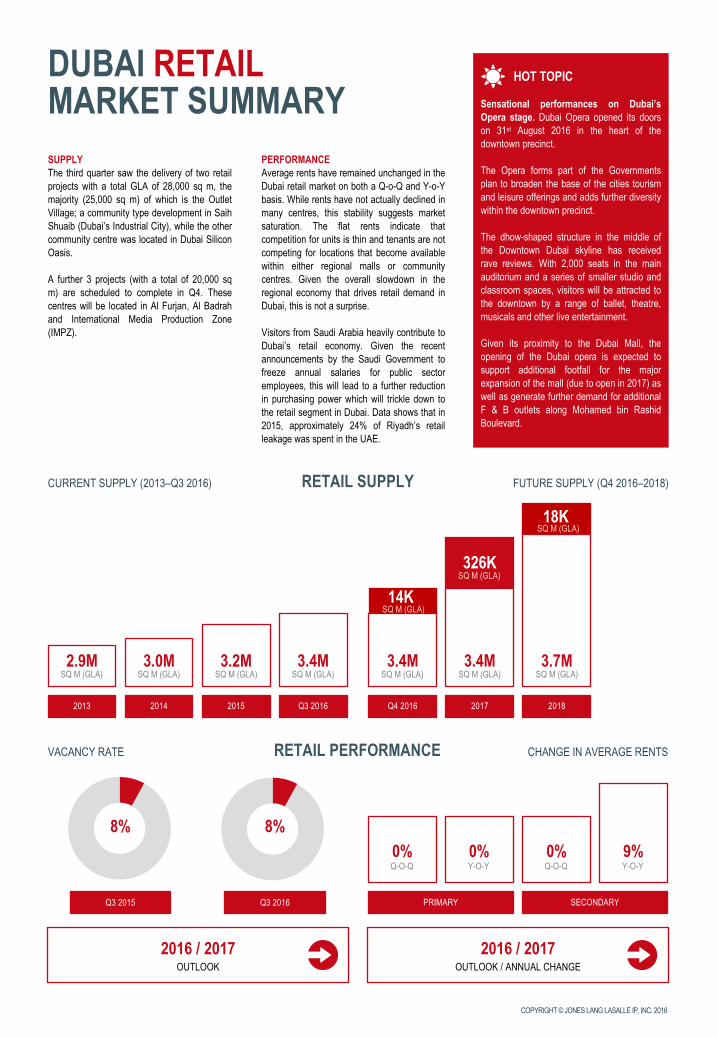
DUBAI RETAILMARKET SUMMARYSUPPLYThe third quarter saw the delivery of two retailprojects with a total GLA of 28,000 sq m, themajority (25,000 sq m) of which is the OutletVillage; a community type development in SaihShuaib (Dubai’s Industrial City), while the othercommunity centre was located in Dubai SiliconOasis.
A further 3 projects (with a total of 20,000 sqm) are scheduled to complete in Q4. Thesecentres will be located in Al Furjan, Al Badrahand International Media Production Zone(IMPZ).
RETAIL SUPPLYCURRENT SUPPLY (2013–Q3 2016) FUTURE SUPPLY (Q4 2016–2018)
Sensational performances on Dubai’sOpera stage. Dubai Opera opened its doorson 31st August 2016 in the heart of thedowntown precinct.
The Opera forms part of the Governmentsplan to broaden the base of the cities tourismand leisure offerings and adds further diversitywithin the downtown precinct.
The dhow-shaped structure in the middle ofthe Downtown Dubai skyline has receivedrave reviews. With 2,000 seats in the mainauditorium and a series of smaller studio andclassroom spaces, visitors will be attracted tothe downtown by a range of ballet, theatre,musicals and other live entertainment.
Given its proximity to the Dubai Mall, theopening of the Dubai opera is expected tosupport additional footfall for the majorexpansion of the mall (due to open in 2017) aswell as generate further demand for additionalF & B outlets along Mohamed bin RashidBoulevard.
2013 2014 2015 Q3 2016
2.9M 3.0M 3.2M 3.4M
Q4 2016 2017 2018
3.4M 3.4M 3.7M
RETAIL PERFORMANCEVACANCY RATE CHANGE IN AVERAGE RENTS
PRIMARY
8%0%
2016 / 2017
PERFORMANCEAverage rents have remained unchanged in theDubai retail market on both a Q-o-Q and Y-o-Ybasis. While rents have not actually declined inmany centres, this stability suggests marketsaturation. The flat rents indicate thatcompetition for units is thin and tenants are notcompeting for locations that become availablewithin either regional malls or communitycentres. Given the overall slowdown in theregional economy that drives retail demand inDubai, this is not a surprise.
Visitors from Saudi Arabia heavily contribute toDubai’s retail economy. Given the recentannouncements by the Saudi Government tofreeze annual salaries for public sectoremployees, this will lead to a further reductionin purchasing power which will trickle down tothe retail segment in Dubai. Data shows that in2015, approximately 24% of Riyadh’s retailleakage was spent in the UAE.
8%
Q3 2015 Q3 2016
Q-O-Q
OUTLOOK / ANNUAL CHANGE2016 / 2017
OUTLOOK
SQ M (GLA) SQ M (GLA) SQ M (GLA) SQ M (GLA) SQ M (GLA) SQ M (GLA) SQ M (GLA)
SQ M (GLA)
326KSQ M (GLA)
SQ M (GLA)
0%Y-O-Y
SECONDARY
0%Q-O-Q
9%Y-O-Y

HOT TOPIC
COPYRIGHT © JONES LANG LASALLE IP, INC. 2016
1,300
DUBAI HOTELMARKET SUMMARYSUPPLYA total of 5,500 hotel rooms have entered themarket since the beginning of the year,indicating the continued momentum in Dubai’shospitality and tourism sector. Among theprojects completed in Q3 were Westin AlHabtoor with around 1,000 rooms, and AtanaHotel in TECOM with 830 rooms.
Major projects expected to complete by the endof 2016 include the Jumeirah Al Naseem (430rooms) and Dukes Dubai on Palm Jumeirah(279 hotel rooms and 227 servicedapartments). The 117 key Nikki Beach Resorton Palm Jumeirah is also expected by the endof the year, following the opening of its beachclub earlier in 2016.
HOTEL SUPPLYCURRENT SUPPLY (2013–Q3 2016) FUTURE SUPPLY (Q4 2016–2018)
Dubai 2016; the year of theme parkentertainment.
Dubai is undoubtedly a leader in innovation inthe leisure and hospitality market. Dubai Parksand Resorts (located in Jebel Ali) representsthe latest innovative offering. Once it is fullyopen (by the end of 2016), it will be the largestmulti-themed leisure and entertainmentdestination in the Middle East.
IMG World of Adventure, an indoor themedpark opened its doors on the 31st of August,and is considered the largest of its kind. It isspread across 139,000 sq m of land andbrings the international brands Marvel andCartoon Network together for the first time.Dubai’s theme parks are seen as a majorattraction for the city as it seeks to expand thenumber of tourist arrivals from 14 million in2016 to 20 million by 2020.
Coupled with similar developments in AbuDhabi, these theme parks will help position theUAE on the regional and international leisuretourism map.
2013 2014 2015 Q3 2016
61,700 67,500 72,500 78,000
Q4 2016 2017 2018
78,000 79,300 92,400
HOTEL PERFORMANCEOCCUPANCY RATE AVERAGE DAILY RATE
YT AUGUST 2015
76%214
-11%
2016 / 2017
YT AUGUST 2016
PERFORMANCEHotels performance in Dubai remained underpressure over the third quarter of 2016 due tothe combination of low oil prices (affectingbusiness travel) and the strong US Dollar(reducing demand from many traditional leisuresource markets).
The relatively diversified spread of sourcemarkets and the growth of demand from newmarkets (especially in Asia), helped minimizethe impact on occupancy rates which remainedalmost stable at around 76% over the YTAugust. Average daily rates were more stronglyimpacted, with a 11% decrease to USD 191.
While a further decline in room rates and yieldscan be expected over the short term, themedium term outlook for the market remainspositive due to the heavy governmentinvestment in expanding the cities tourisminfrastructure.
76%
YT AUGUST 2015 YT AUGUST 2016
USD191USD
OUTLOOK / ANNUAL CHANGE2016 / 2017
OUTLOOK
Y-O-Y
KEYS KEYS KEYS KEYS KEYS KEYS KEYS
KEYS
13,100KEYS
15,200KEYS

COPYRIGHT © JONES LANG LASALLE IP, INC. 2016
DEFINITIONS ANDMETHODOLOGY
12 o’clock indicates a turning pointtowards a market consolidation /slowdown. At this position, themarket has no further rental growthpotential left in the current cycle,with the next move likely to bedownwards.
3 o’ clock indicates the market hasreached its point of fastestdecline. While rents may continueto decline for some time, the rate ofdecrease is expected to slow asthe market moves towards a periodof rental stabilisation.
6 o’clock indicates a turning pointtowards rental growth. At thisposition, we believe the market hasreached its lowest point and thenext movement in rents is likely tobe upwards.
9 o’clock indicates the market hasreached the rental growth peak,while rents may continue toincrease over coming quarters themarket is heading towards a periodof rental stabilisation.
OFFICESupply data is based on our quarterly survey of 32 sub-markets.Completed buildings refer to those handed over for immediateoccupation. Future supply is based on projects underconstruction. Central Business District includes DIFC, DTCD,Sheikh Zayed Road, Burj Khalifa Downtown.
Prime Office Rent represents the top open-market net rent(exclusive of service charge) for a new lease that could beexpected for a notional office unit of the highest quality andspecification in the best location in a market, as at the surveydate. Data relates to headline rents, exclusive of incentives.
Vacancy rate is based on estimates from the JLL Agency team. Itrepresents the average rate across a basket of buildings in theCBD that make up around 80% of the CBD supply and 15% of thetotal current supply.
RESIDENTIALThe supply and stock data has been updated based on data fromthe Dubai Government. Our quarterly survey now covers 158 submarkets (the entire Dubai market) starting from 2010. This dataexcludes labour accommodation and local Emirati housing supply.
Completed buildings refer to those handed over for immediateoccupation. Future supply is based on projects underconstruction.
Residential performance data is based on the REIDIN monthlyindex. REIDIN Dubai Residential Property Price Indices (RPPIs)use monthly sample of offered/asked listing price data and landregistry price data (trans- action data). Index series are set at 100starting at the beginning of each data set.
RETAILClassification of Retail centres is based upon the ULI definitionand based on their GLA:- Super Regional Malls have a GLA of above 90,000 sq m
- Regional Malls have a GLA of 30,000 - 90,000 sq m
- Community Malls have a GLA of 10,000 - 30,000 sq m
- Neighborhood Malls have a GLA of 3,000 - 10,000 sq m
- Convenience Malls have a GLA of less than 3,000 sq m
Supply data is based on our quarterly survey of 45 sub-markets.
Malls are categorized based on turnover levels. Primary Malls aregood performing with high levels of turnover. Secondary Malls areaverage performing with lower levels of turnover.
Average rents represent the top open market net rent expectedfor a standard in line unit shop of 100 sq m in a basket ofregional and super regional centres. Given the variation in rentals,we quote % change for retail rents rather than actual figures.
Vacancy rate is based on estimates from the JLL Retail team, andrepresents the average rate across standard in line unit shops atsuper regional malls.
HOTELHotel room supply is based on existing supply figures provided byDTCM as well as future hotel development data tracked by JLLHotels. Room supply includes all graded supply and excludesserviced apartments.
STR performance data is based on a monthly survey conductedby STR Global on a sample of more than 55,000 rooms acrossDubai.

@JLLMENA youtube.com/joneslanglasalle linkedin.com/companies/jones-lang-lasalle joneslanglasalleblog.com/EMEAResearch
DubaiEmaar SquareBuilding 1, Office 403Sheikh Zayed RoadPO Box 214029Dubai, UAETel: +971 4 426 6999Fax: + 971 4 365 3260
Dana WilliamsonHead of [email protected]
Andrew WilliamsonHead of [email protected]
Craig PlumbHead of [email protected]
Asma DakkakResearch [email protected]
For questions and inquires about the Dubai real estate market, please contact:
© 2016 Jones Lang LaSalle IP, Inc. All rights reserved. The information contained in this document is proprietary to Jones Lang LaSalle andshall be used solely for the purposes of evaluating this proposal. All such documentation and information remains the property ofJones Lang LaSalle and shall be kept confidential. Reproduction of any part of this document is authorised only to the extent necessary for itsevaluation. It is not to be shown to any third party without the prior written authorisation of Jones Lang LaSalle. All information containedherein is from sources deemed reliable; however, no representation or warranty is made as to the accuracy thereof.
Jll-mena.com