dwlbc technical report - home enviro data sa
TRANSCRIPT

2 0 1 0 | t e c h n i c a l r e p o r t
i
DWLBC Technical Report Carbon Sequestration from Revegetation: Southern Murray-Darling Basin Region
ISBN: 978-1-921528-57-6 DWLBC Report: 2010/02


Carbon Sequestration from Revegetation: Southern Murray-Darling Basin Region
Trevor J. Hobbs, Craig R. Neumann and Merv Tucker
Agricultural Landscapes Program, Land Management Unit, Department of Water, Land and Biodiversity Conservation
February 2010
Report DWLBC 2010/02

Agricultural Landscapes Program, Land Management Unit
Department of Water, Land and Biodiversity Conservation
Waite Road, Urrbrae, SA 5064
GPO Box 2834, Adelaide SA 5001
Telephone National (08) 8463 6946
International +61 8 8463 6946
Fax National (08) 8463 6999
International +61 8 8463 6999
Website www.dwlbc.sa.gov.au
Disclaimer
The Department of Water, Land and Biodiversity Conservation and its employees do not warrant or make any representation regarding the use, or results of the use, of the information contained herein as regards to its correctness, accuracy, reliability, currency or otherwise. The Department of Water, Land and Biodiversity Conservation and its employees expressly disclaims all liability or responsibility to any person using the information or advice. Information contained in this document is correct at the time of writing.
© Government of South Australia, through the Department of Water, Land and Biodiversity Conservation 2010
This work is Copyright. Apart from any use permitted under the Copyright Act 1968 (Cwlth), no part may be reproduced by any process without prior written permission obtained from the Department of Water, Land and Biodiversity Conservation. Requests and enquiries concerning reproduction and rights should be directed to the Chief Executive, Department of Water, Land and Biodiversity Conservation, GPO Box 2834, Adelaide SA 5001.
ISBN 978-1-921528-57-6
Preferred way to cite this publication
Hobbs TJ, Neumann CR, Tucker M, 2010, Carbon Sequestration from Revegetation: Southern Murray-Darling Basin Region, DWLBC Report 2010/02, Government of South Australia, through Department of Water, Land and Biodiversity Conservation, Adelaide & Future Farm Industries Cooperative Research Centre.
Download this document at: http://www.dwlbc.sa.gov.au/publications/reports/html
Report DWLBC 2010/02 Carbon Sequestration from Revegetation: Southern Murray-Darling Basin Region
iii
FOREWORD
South Australia’s unique and precious natural resources are fundamental to the economic and social wellbeing of the State. It is critical that these resources are managed in a sustainable manner to safeguard them both for current users and for future generations.
The Department of Water, Land and Biodiversity Conservation (DWLBC) strives to ensure that our natural resources are managed so that they are available for all users, including the environment.
In order for us to best manage these natural resources it is imperative that we have a sound knowledge of their condition and how they are likely to respond to management changes. DWLBC scientific and technical staff continues to improve this knowledge through undertaking investigations, technical reviews and resource modelling.
Scott Ashby CHIEF EXECUTIVE DEPARTMENT OF WATER, LAND AND BIODIVERSITY CONSERVATION

Report DWLBC 2010/02 Carbon Sequestration from Revegetation: Southern Murray-Darling Basin Region
iv
ACKNOWLEDGEMENTS
The authors would like to acknowledge the Complementary State NRM Program 2008-09 and SA Department of Water, Land and Biodiversity Conservation (DWLBC) for funding this project. Support for this project was also provided by the Future Farm Industries Cooperative Research Centre – New Woody Crop Industries Program.
We are grateful to landholders in the Southern Murray-Darling Basin region for access to their revegetation sites, especially; Steven Anderson (Mt. Pleasant), Peter Atkinson (Mt. Beevor), Peter & Mig Brookman (Keith), Lester & Kay Cattle (Netherton), Myles & Chris Clarke (Springton), Anna Glynn & Andrew Cawley (Mt Pleasant), Grant Dabinett (Parilla), Jim Downer (Harrogate), Bill Evans (Keyneton), Fiona Flavel (Mobilong), Sue & John Holt (Eden Valley), Phillip Hyde (Pinnaroo), Ian Johnson (Culburra), Les Maynard (Parilla), Trevor Pfeiffer (Parrakie), David & Michael Redhead (Mt. Pleasant), Dennis Roberts (Karoonda), John Rollond (Rockleigh), Brian Teakle (Karoonda), Clem Tynan (Sherlock), E.J. & D.J. Woidt (Sherlock), Gerald Woidt (Yumali), Nick Woods (Borrika), and Kym Wyatt (Macclesfield).
We greatly appreciate the support of Ivan Clarke (Rural Solutions), Phil Collins (State Flora Murray Bridge), Steve Coombe (Eastern Hills and Murray Plains Catchment Group Inc.), Rowena Danks (Murray Mallee Local Action Planning Association), Glenn Dean (Rural City of Murray Bridge), Ian Filmer (Coorong and Mallee Farm Forestry Network), Glenn Gale (DWLBC), Graham Gates, (Coorong Districts Local Action Planning Association), David Hein (Trees For Life), Tim Herrmann (DWLBC), Janet Kuys (Rural Solutions), Aimee Linke (Mid Murray Local Action Planning Association) Ray O'Malley (O'Malley Planting), Bernie Omodei (Trees For Life), Tony Randall (Goolwa to Wellington Local Action Planning Board Inc.), Maureen Redfern (Trees For Life), Kathryn Rothe (Mannum to Wellington Local Action Planning Committee), Susan Sweeney (DWLBC) and Rob Wallace (DWLBC).
We are indebted to Trees For Life for their willingness to provide us access to native plants sales and distribution information for South Australia.
Thanks to Barbara Afford, Carol Dawson, Jeff Fairlamb, Fiona Flavel, Don Green, Ray Hutchinson, Dennis Searle, Barbara Veit, Naomi Ward and Lance Holberton (DWLBC), and Shaun Johnson and Kylie Neumann for their efforts in field measurements. We would also like to thank Julie Dean for her work in laboratory processing and Kylie Neumann for her additional data entry work.

Report DWLBC 2010/02 Carbon Sequestration from Revegetation: Southern Murray-Darling Basin Region
v
CONTENTS
FOREWORD.........................................................................................................................iii
ACKNOWLEDGEMENTS .....................................................................................................iv
SUMMARY............................................................................................................................ix
1. INTRODUCTION.............................................................................................................1
1.1 NATURAL RESOURCE MANAGEMENT AND CARBON SEQUESTRATION FROM REVEGETATION......................................................................................................1
1.2 BACKGROUND AND RATIONALE ..........................................................................3 1.2.1 Purpose of Revegetation .....................................................................................................4 1.2.2 Carbon Assessments...........................................................................................................5 1.2.3 Carbon Accounting ..............................................................................................................6
2. IDENTIFICATION OF LOCAL REVEGETATION SPECIES AND ACTIVITIES...............9
2.1 LOCAL NATIVE SPECIES........................................................................................9 2.2 SPECIES USED IN REVEGETATION....................................................................11 2.3 REVEGETATION ACTIVITIES ...............................................................................13 2.4 RECOMMENDED SPECIES ..................................................................................14
2.4.1 Productive Species ............................................................................................................14 2.4.2 Environmental Plantings ....................................................................................................16
3. DEVELOPMENT OF CARBON ASSESSMENT METHODS.........................................17
3.1 ASSESSING ABOVE-GROUND PLANT BIOMASS ...............................................17 3.2 ALLOMETRIC ASSESSMENT TECHNIQUES .......................................................18
3.2.1 Sampling ............................................................................................................................19 3.2.2 Biometrics ..........................................................................................................................22 3.2.3 Allometric Relationships.....................................................................................................22
4. PRODUCTIVITY AND CARBON SEQUESTRATION FROM REVEGETATION ...........29
4.1 ASSESSMENT OF PLANTATION PRODUCTIVITY...............................................29 4.2 PREDICTING PLANTATION PRODUCTIVITY .......................................................36 4.3 REVIEW OF NCAT FULLCAM MODEL PREDICTIONS.........................................46
4.3.1 NCAT FullCAM Model........................................................................................................46 4.3.2 Accuracy of NCAT FullCAM Predictions............................................................................48
4.4 REGIONAL CARBON SEQUESTRATION RATES.................................................51
5. DISCUSSION................................................................................................................57
5.1 CARBON MARKETS, DRIVERS AND POLICIES...................................................57 5.2 CARBON ACCOUNTING, ASSESSMENTS AND MODELS...................................59 5.3 CONCLUSIONS AND RECOMMENDATIONS .......................................................61

Report DWLBC 2010/02 Carbon Sequestration from Revegetation: Southern Murray-Darling Basin Region
vi
APPENDICES......................................................................................................................63
APPENDIX A. REVEGETATION SPECIES ....................................................................63 APPENDIX B. PRODUCTIVITY AND CARBON SEQUESTRATION ..............................65 APPENDIX C. NATIONAL CARBON ACCOUNTING TOOLBOX SIMULATIONS...........83
GLOSSARY .........................................................................................................................91
REFERENCES.....................................................................................................................93

CONTENTS
Report DWLBC 2010/02 Carbon Sequestration from Revegetation: Southern Murray-Darling Basin Region
vii
LIST OF FIGURES
Figure 1. Carbon Sequestration from Revegetation project study area..............................................2
Figure 2. Landuse and vegetation cover types in the study region. ...................................................5
Figure 3. Trees For Life zones in the Southern Murray-Darling Basin region. .................................11
Figure 4. Location of survey sites for destructive sampling and productivity measurements in the Southern Murray-Darling Basin region. .............................................................................18
Figure 5. Allometric relationships between plant stemwood volume measurements and above ground dry biomass for trees, mallees and shrubs............................................................24
Figure 6. Allometric relationships between plant stemwood volume measurements and dry stemwood biomass for trees, mallees and shrubs.............................................................24
Figure 7. Allometric relationships between plant stemwood volume measurements and dry bark biomass for trees, mallees and shrubs. .............................................................................25
Figure 8. Allometric relationships between plant stemwood volume measurements and dry branch biomass for trees, mallees and shrubs. .............................................................................25
Figure 9. Allometric relationships between plant stemwood volume measurements and dry leaf biomass for trees, mallees and shrubs. .............................................................................26
Figure 10. The relationship between above-ground plant volume (height [m] x crown area [m²]) and dry biomass from trees, mallees and shrubs destructively sampled in SA biometric studies................................................................................................................................27
Figure 11. The relationship between basal area [cm²] and dry biomass from trees, mallees and shrubs destructively sampled in SA biometric studies.......................................................28
Figure 12. Atriplex nummularia relationships between plant elliptical cylinder volume and above ground dry biomass. ..........................................................................................................28
Figure 13. Relationships between primary productivity drivers and stemwood production rates from woodlot, windbreak and environmental plantings. .............................................................38
Figure 14. Relationships between primary productivity drivers and carbon sequestration rates from woodlot, windbreak and environmental plantings. .............................................................42
Figure 15. Predicted dry matter production from NCAT FullCAM software and raw BiosEquil model versus observed dry matter production at revegetation sites in the Southern Murray-Darling Basin region...........................................................................................................49
Figure 16. NCAT FullCAM predicted carbon sequestration for the Monarto revegetation site using: a) default tree yield formulas; and b) user-defined tree stemwood increments.....................50
Figure 17. User-defined Stem Wood Increments parameters of the NCAT FullCAM model..............51
Figure 18. Environmental and administrative regions within the study area.......................................52
Figure 19. Estimated carbon sequestration rates from a) Woodlot and b) Environmental Planting revegetation types, based on local average planting densities (tree per hectare) by type, in the Southern Murray-Darling Basin region.....................................................................53
Figure 20. Comparison of estimated carbon sequestration rates using different model types based on a) average annual rainfall, b) NCAT Forestry Productivity Index and c) BiosEquil model predictions for Woodlot and Environmental Planting revegetation types at 1000 tree per hectare planting rate.............................................................................................54
Figure 21. The ‘About’ window designed for naming, notes and security...........................................84
Figure 22. The ‘Configuration’ window offers the opportunity to tailor the model outputs to pre-existing criteria. ..................................................................................................................84
Figure 23. The 'Timing' window allows the entry of the planting date and the end date for the simulation of the site ..........................................................................................................85

CONTENTS
Report DWLBC 2010/02 Carbon Sequestration from Revegetation: Southern Murray-Darling Basin Region
viii
Figure 24. The 'Data Builder' window allows the entry of location data and the down loading of data specific to that site and the system chosen for that site. ...................................................85
Figure 25. The ‘Site’ window allows an area or point model to be set and displays the ‘Maximum Aboveground Biomass’ figure generated for the specific site............................................87
Figure 26. The 'Trees' window displays the selected planting system and gives access to other background plant and growth data.....................................................................................87
Figure 27. The 'Plant Properties' sub-window displays the carbon and turnover percentages used by the model and is accessed via the plant button on the ‘Trees; window.............................88
Figure 28. The 'Stem Density’ sub-window displays the wood density figures used by the model and is accessed via the plant button on the 'Plant Properties' sub-window. ............................88
Figure 29. The ‘Events’ window allows the user to enter and model the effects of external events on production. .........................................................................................................................89
Figure 30. The ‘Output’ window allows the user to tailor the types of outputs delivered by the model.89
Figure 31. An example output window displaying modelled plant carbon sequestration rates. .........90
Figure 32. Stem Wood Increments sub-screen where the user can enter their own stem wood volume data if running the program in the incremental mode. ..........................................90
LIST OF TABLES
Table 1. Common naturally occurring native woody plant species of the study region. Based on the frequency of occurrences from SA DEH herbarium and plant survey records (>60 records) by IBRA sub-regions............................................................................................10
Table 2. Top 50 most commonly planted species in the study area based on 10 years of Trees For Life plant seedling distribution data (1999-2008)...............................................................12
Table 3. Estimated area of revegetation (hectares) established in SA (1999 - 2005). ....................13
Table 4. Estimated area of revegetation and commercial forestry (hectares) established in each region of SA (1999 - 2005).................................................................................................13
Table 5. Woody species suitable for production-oriented revegetation in major environmental regions of the Southern Murray-Darling Basin region........................................................14
Table 6. Plant species measured and destructively sampled for biometric studies, including some key plant characteristics (mean values, n=3). ...................................................................20
Table 7. Simple regression relationships between stemwood volume and total above-ground dry biomass for different lifeform by species group. ................................................................23
Table 8. Additional dry biomass allometric relationships. ................................................................27
Table 9. Generalised summary of measurement protocols used in 70 surveys of plantation productivity in the Southern Murray-Darling Basin study...................................................30
Table 10. Plantation growth and carbon sequestration rates from woodlots, windbreaks and environmental plantings observed in the Southern Murray-Darling Basin region. ............31
Table 11. Relationships between mean annual rainfall, NCAT Forest Productivity Index, BiosEquil model predictions and observed productivity in the Murray-Darling Basin region.............37
Table 12. Regional summaries of total land area, potential agricultural land for carbon sequestration activities (woodlots & environmental plantings), and estimated carbon sequestration rates for IBRA sub-regions in the study area. .............................................................................55
Table 13. District summaries of total land area, potential agricultural land for carbon sequestration activities (woodlots & environmental plantings), and estimated carbon sequestration rates for 70 Hundred regions in the study area. .........................................................................55

Report DWLBC 2010/02 Carbon Sequestration from Revegetation: Southern Murray-Darling Basin Region
ix
SUMMARY
Woody carbon crops and revegetation have the potential to sequester significant amounts of carbon in South Australia. This study was conducted to assist in the evaluation and prediction of carbon sequestration rates from dedicated woody carbon crops, sustainable extractive woody crops and environmental plantings in the low to medium rainfall (300 - 650mm) dryland agriculture zones of the Southern Murray-Darling Basin region.
The natural resources of the Southern Murray-Darling Basin region provide the backbone of a diverse range of ecosystems, agricultural pursuits, industries and communities. Unfortunately the loss of perennial vegetation cover has contributed substantially to a number of natural resource management issues such as dryland salinity, groundwater recharge, soil erosion risk and ecosystem fragmentation and degradation. Dryland plantations of native species can provide many environmental services and economic opportunities for the region. The value of perennial plant systems to reduce salinity, stabilise soils and sequester atmospheric carbon is well recognised. Correctly managed and designed revegetation and agroforestry can also provide positive contributions to ecosystems, habitats and biodiversity.
A number of commercial opportunities, natural resource management drivers and supportive policies exist to encourage greater investments in woody crop industries and revegetation activities in the Southern Murray-Darling Basin region and across the state. The Carbon Pollution Reduction Scheme (CPRS) due to commence in 2011, recent expansion of existing carbon offset/credit programs from energy/liquid fuel sectors (e.g. Mandatory Renewable Energy Targets) and informal “green-friendly” markets are all expected to increase the demand for carbon crops, agroforestry and environmental plantings in Australia. Many woodlots and environmental plantings in South Australia currently fit CPRS and other carbon trading scheme criteria, and the design of many future revegetation plantings will undoubtedly be tailored to comply with these schemes. Carbon is quickly becoming a highly valued product (or co-product) of revegetation and commercial agroforestry.
Previous studies of plantation productivity in the Southern Murray-Darling Basin (and most other low-mid rainfall areas of Australia) have mainly been limited to the evaluation of stemwood production rates of a few forestry and woody crop species. Production rates of species used in woodlots and environmental plantings are largely unquantified. To increase the efficiency of assessing carbon sequestered within revegetation sites this study has developed robust allometric relationships (r²=0.86) between simple plant measurements and stemwood volumes, total above-ground biomass and carbon contents. Simple classifications of species groups and life forms have improved the predictive capability of these models by a further 4 to 8%. These relationships can now be routinely used to rapidly assess production and carbon sequestration rates for a wide range of species and revegetation sites.
In this study the total above-ground plant biomass and carbon content of 70 revegetation sites of known age were surveyed in the Southern Murray-Darling Basin region. These represent 51 mixed species revegetation sites and 19 monocultures. A total of 76 different species were examined. In examining the factors that influenced productivity this study found stocking rate and rainfall to be most significant, with no significant auto-correlation between rainfall and stocking rates (i.e. stocking rates were not influenced by average rainfall), and soil type/ fertility had little or no influence on site productivity. Most woodlot plantations out-perform environmental plantings when using identical stocking rates on the same site. These
SUMMARY
Report DWLBC 2010/02 Carbon Sequestration from Revegetation: Southern Murray-Darling Basin Region
x
surveys found that the average planting density for woodlot plantings was 800 trees per hectare (tph) and 1400 tph for environmental plantings in the region. However, it must be noted that optimum stocking rates vary with species selections and location.
Analysis of the information gathered from these new surveys and existing databases provides a greater insight into the productive potential of a number of species growing in the region, and has facilitated the development of more reliable models to estimate carbon sequestration from revegetation activities. The productivity models developed from this study have been applied to spatial datasets within a geographic information system to estimate likely carbon sequestration rates from revegetation at a 1 hectare resolution. Based on typical stocking rates (i.e. woodlots 800 tph, environmental plantings 1400 tph), and plantation growth relationships to rainfall/soils, average above-ground carbon sequestration rates across the region were 5.8 tonnes of carbon dioxide equivalents per hectare per year (CO2-e t/ha/yr) in woodlots and 6.0 CO2-e t/ha/yr in environmental plantings.
The Australian Government Department of Climate Change (DCC) has a strong commitment to the use of the National Carbon Accounting Toolbox (NCAT) for carbon accounting purposes in Australia. Further, the NCAT has been identified as the preferred system to support carbon accounting within the proposed Carbon Pollution Reduction Scheme. At present the FullCAM model (and sub-models) within the NCAT has been predominantly populated by parameters drawn from studies of higher rainfall commercial forestry plantations. However, current NCAT parameter sets for lower rainfall species, plantation designs and mixed environmental plantings are largely absent or poorly validated.
The lack of detailed data from low to medium rainfall agroforestry and environmental plantings has previously hampered the development of suitable NCAT parameter sets for accurate NCAT prediction of carbon balances in the low to medium rainfall regions of Australia. Comparisons between detailed productivity assessments in the Southern Murray-Darling Basin region and FullCAM predictions (using their standard parameter sets) clearly demonstrates that NCAT can severely under-predict carbon sequestration rates in woodlots and environmental planting (27% of observed above-ground carbon) in lower rainfall regions.
A major component of this study was to develop sets of parameters that could be used in conjunction with the FullCAM model to improve the predictive capacity of that system, especially for woodlots and environmental plantings. Although this study provides new information on several plantation parameters (e.g. growth rates, stemwood volumes, plant fractions, wood densities) suited for input to the NCAT system, the underlying NCAT/FullCAM programming and front-end design limits the successful inclusion of these new parameters to create more realistic NCAT predictions of carbon balances in our state. The NCAT system, in its current form, is an unreliable tool for predicting carbon sequestration rates from revegetation in the low to medium rainfall zones of South Australia. There are strong concerns that the NCAT system may seriously mislead carbon accounting analysis across the state, and may pose significant risks to potential investors, landuse planning and government policies relating to carbon sequestration from revegetation.
The information contained within this report can provide guidance to those seeking to evaluate the feasibility of developing new environmental plantations and biomass industries in the Southern Murray-Darling Basin region. However care must be taken to avoid the negative impacts that wholesale landscape planting of carbon crops could have on agricultural production, rural communities and the environment. It is important that these new industries are targeted in areas where they maximise the benefits and profitability of whole farm enterprises and regions.

Report DWLBC 2010/02 Carbon Sequestration from Revegetation: Southern Murray-Darling Basin Region
1
1. INTRODUCTION
1.1 NATURAL RESOURCE MANAGEMENT AND CARBON SEQUESTRATION FROM REVEGETATION
The integrated management of our natural resources is a high priority for South Australians and is notably reflected in recent developments of policy and legislation in the State. The State Strategic Plan’s objectives of “growing prosperity, improving wellbeing, attaining sustainability, fostering creativity, building communities and expanding opportunity” (SA Government 2004) are strongly connected to our ability to manage our natural resources and adapt to changing climate for the future benefit of all South Australians. The SA Natural Resources Management Act 2004 provides the underlying structure for government activities to better manage our natural resources. Overall state goals for NRM are detailed in the State Natural Resources Management Plan (SA DWLBC 2006). The State NRM Plan identifies a 50 year vision for natural resource management (NRM) in South Australia, and sets out policies, milestones and strategies to achieve that vision (SA DWLBC 2006).
State NRM Plan Vision: South Australia, a capable and prosperous community, managing natural resources for a good quality of life within the capacity of our environment for the long term.
• Goal 1: Landscape scale management that maintains healthy natural systems and is adaptive to climate change
• Goal 2: Prosperous communities and industries using and managing natural resources within ecologically sustainable limits
• Goal 3: Communities, governments and industries with the capability, commitment and connections to manage natural resources in an integrated way
• Goal 4: Integrated management of biological threats to minimise risks to natural systems, communities and industry.
This project aims to develop critical information and methodologies to evaluate and predict carbon sequestration rates from sustainable woody crops and environmental revegetation plantings in the lower rainfall (300 to 650mm) dryland agriculture zone of the Southern Murray-Darling Basin region of South Australia. This will support future understanding and adoption of carbon sequestration that will assist in the development of long term natural resource management strategies and policies for maintaining prosperity of the rural communities and natural environment in the dryland agricultural regions of South Australia.
The development of carbon markets will provide an economic driver for the adoption of woody crops and environmental revegetation for diverse multipurpose agricultural systems that are productive, sustainable, resilient and adaptable to climate change (Hobbs et al. 2009b). Strategically placed revegetation can provide a wide range of economic benefits to land holders and facilitate ecosystem services that benefit local areas and the broader community. The integration of sustainable woody crop systems (e.g. extractive use, habitat restoration & carbon markets) with other agricultural production (e.g. grazing and cropping) can provide more stable landholder return and the persistence and prosperity of local rural

INTRODUCTION
Report DWLBC 2010/02 Carbon Sequestration from Revegetation: Southern Murray-Darling Basin Region
2
communities and industries while enhancing the natural ecology of these regions. The use of indigenous native species in revegetation activities (commercial or environmental) can minimise the biological threats associated with the introduction of woody crop plant species from other regions of the world. Local biodiversity can typically be enhanced with revegetation through the provision of plant species and structural diversity not found in cleared agricultural lands.
Prior research conducted by DWLBC FloraSearch, Future Farm Industries CRC, Rural Industries Research and Development Corporation and CSIRO has identified the medium rainfall (300-650mm) dryland agricultural zones with the greatest feasibility for developing carbon markets in Australia (Hobbs et al. 2009b). By focussing this research project in the Southern Murray-Darling Basin region (Figure 1) we will advance our knowledge and methodologies within a high priority region, prior to application across wider agricultural regions of South Australia. The information and technological outcomes of this study will advance the rapid progression of carbon sequestration assessments, monitoring and evaluations into other NRM regions of South Australia in preparation for the likely introduction of a national Carbon Pollution Reduction Scheme.
Figure 1. Carbon Sequestration from Revegetation project study area.

INTRODUCTION
Report DWLBC 2010/02 Carbon Sequestration from Revegetation: Southern Murray-Darling Basin Region
3
1.2 BACKGROUND AND RATIONALE
This study aims to efficiently evaluate and predict carbon sequestration rates from sustainable woody crops and environmental revegetation plantings in the medium rainfall (300 - 650mm) dryland agriculture zones of the Southern Murray-Darling Basin region of South Australia. The objective of this project is to increase the representation, accuracy and reliability of biomass productivity data for revegetation activities in SA and to calibrate carbon accounting models in anticipation of a Carbon Pollution Reduction Scheme coming into effect in 2011. Without this crucial and scientifically rigorous information the state government is at risk of being unable to accurately determine or monitor carbon sequestration rates from revegetation, provide accurate carbon accounting evaluations for the Carbon Pollution Reduction Scheme, or credibly support investments in the development of carbon markets (and other carbon-related sustainability markets) in South Australia.
DWLBC Land Management Unit’s team of scientific researchers and technical staff have undertaken this complex research into plant and landscape ecology to develop robust carbon sequestration assessment methodologies, add to databases of species and revegetation community productivity, and create parameter sets for the National Carbon Accounting System and FullCAM carbon modelling program. The work also contributes significantly to the feasibility assessment and development of effective carbon markets in the state. This report outlines current research and is a timely extension of work in a region with a high feasibility for carbon sequestration activities.
This research presented here is consistent with the South Australia's “State NRM Plan 2006 Section 8 - South Australia’s monitoring and evaluation framework” and clearly addresses the fundamental requirements that “Natural resource information should be”:
• obtained to meet the strategic needs of government, industry and the community
• readily available to government, industry and the community
• captured on an agreed priority basis
• collected using a coordinated approach with uniform measurement standards, data management protocols, storage and retrieval
• consistent with national and international standards and protocols
This research is also consistent with the South Australia's Greenhouse Strategy, “Tackling Climate Change: South Australia's Greenhouse Strategy 2007-2020” (SA DPC 2007). Most notably Section 8 - Natural resources:
• Objective 8.1 - To strengthen the resilience of industries reliant on natural resources in the face of potential impacts of climate change.
• Objective 8.4 - To reduce greenhouse gas emissions from the natural resources sector and increase carbon sinks.
and Section 4 - Industry objectives:
• Objective 4.3 - To target commercial opportunities and develop products and services of the future.

INTRODUCTION
Report DWLBC 2010/02 Carbon Sequestration from Revegetation: Southern Murray-Darling Basin Region
4
1.2.1 PURPOSE OF REVEGETATION
Many environmental and economic benefits can be achieved from increasing the use of perennial plant species in Australian landscapes (Australian Greenhouse Office & Murray Darling Basin Commission 2001). New plantations of woody perennial species can reduce groundwater recharge, dryland salinity, saline river discharges, wind erosion and drought risk, increase landscape sustainability, biodiversity, livestock production, economic diversification, and the stability of financial returns in the region.
There is increasing interest and awareness of the potential to offset carbon emissions from fossil fuels with environmental and other perennial plantings. Apart form their potential to sequester carbon some of these plantings could be designed as renewable energy sources used to generate electricity (Stucley et al. 2004, Zorzetto & Chudleigh 1999, Hague et al. 2002, Harper et al. 2007). Electricity generation from biomass (bioenergy), especially when combined with co-products like oil, charcoal, tannins or fodder provides a new industry opportunity in many regions of Australia (Zorzetto & Chudleigh 1999; Bartle et al. 2007; Bennell et al. 2008; Bartle & Shea 2002; Olsen et al. 2004, Enecon 2001). Stucley et al. (2004) however, states that, “There is a general lack of information available on the growth of tree plantations in many parts of Australia.” This lack of information is effectively carried over into the area of carbon sequestration and is particularly acute in the case of environmental plantings where there has been little economic impetus toward acquiring such information in the past.
Large areas across the study area have been highly modified since settlement and opportunities exist across these modified areas to undertake economically viable revegetation in response to climate change issues (Figure 2). One of these options is carbon sequestration in areas planted specifically for biodiversity purposes. This study aims to examine what naturally occuring species are commonly recorded across the study area, and to compare this information with plant sales data from the last 10 years. Plant sales data can also be used to estimate the expected area of revegetation planted in recent years. It is particularly important to examine the species mixes so that this study could adapt previously collected destructive sampling analysis to the current work, and identify problems and areas for future research to cover gaps in the knowledge base.

INTRODUCTION
Report DWLBC 2010/02 Carbon Sequestration from Revegetation: Southern Murray-Darling Basin Region
5
Source: BRS 2004
Figure 2. Landuse and vegetation cover types in the study region.
1.2.2 CARBON ASSESSMENTS
Unlike most biomass crops where yields of products are readily measured at harvest times, in-situ carbon crops are more difficult to assess. Two main approaches may be used to determine the yields of these carbon crops: 1/ physical measurements supported by destructive subsamples or reliable estimation techniques (i.e. allometrics); or 2/ process or simulation models of predicted carbon yields.
For physical carbon sequestration assessments whole plant biomass is required rather than the simple estimates of stemwood volumes used in classical forestry. To accomplish this, site productivity can be rapidly estimated using reliable relationships (allometrics) between plant measurements and biomass developed from measuring and destructively harvesting representative individual plants and species. By harvesting a small number of individuals of a species and exploring how it’s morphological parameters, individual dry biomass and the dry biomass of component fractions (leaves, bark, branches and stemwood) it is possible to develop useful formulas that could be applied to other similar individuals. A set of simple measurements were developed in this way and these can be applied without the need for further destructive sampling. This study aimed to provide a range of these allometric equations for differing life forms and situations. A stemwood volume model was chosen because it was most comparable with the process-based stemwood models used in the FullCAM program, however, many of other models developed in this study are equally as valid and reliable. It is intended that many of the data sets produced from this study could be used as parameter sets within FullCAM and provide improvements to the default parameter

INTRODUCTION
Report DWLBC 2010/02 Carbon Sequestration from Revegetation: Southern Murray-Darling Basin Region
6
sets currently included within that program. Physical and time constraints have limited these assessments to only above ground components of plant biomass. Assessments of growth and carbon sequestration rates for woodlots and windbreaks of both environmental plantings and monocultures will also permit comparisons of sequestration potential of these differing planting regimes. Assessments of productivity at the local level can be also be amalgamated to provide greater accuracy in regional estimates of productivity and carbon sequestration potential.
The National Carbon Accounting Toolbox (NCAT) contains a process-based model (Full Carbon Accounting Model [FullCAM] Version 3.1) to estimate carbon sequestration rates and carbon balances. FullCAM also integrates data on land cover change, land use and management, climate, plant productivity and soil carbon over a thirty year period from 1970 (Dept of Climate Change, 2009) to assist in estimating carbon balances. In this study, the default environmental planting and woodlot forestry models within FullCAM are evaluated for a number of locations across the study area. To test the reliability of NCAT/FullCAM models (and their default parameter sets) this study aims to provide comparisons between NCAT/FullCAM model predictions and physical site assessments of productivity for a range of species and sites.
1.2.3 CARBON ACCOUNTING
Australia's National Carbon Accounting System aims to account for greenhouse gas emissions from land based sectors in Australia, and to ensure credibility under international agreements on greenhouse gas emissions. The Australian Government Department of Climate Change (DCC) has invested strongly over the past decade into the building of a scientifically advanced National Carbon Accounting Toolbox (NCAT) and the FullCAM carbon models.
These predictive models attempt to provide estimates for Australia’s greenhouse gas emissions and carbon sinks associated with Australian land systems under a future national Emission Trading Scheme (e.g. Carbon Pollution Reduction Scheme). Carbon accounting methodologies and growth rates for commercial forestry species in higher rainfall regions (>650mm) are now well established within these national carbon accounting schemes and models. However, this information for other native woody crop species, and productivity rates of environmental plantings for medium to lower rainfall regions (<650mm), is currently poorly developed in South Australia and nationally. Consequently, a number of users of the system (DWLBC, SA Water, Greening Australia and Canopy) in conjunction with CSIRO have called for additional sampling studies to produce a more comprehensive dataset for use in carbon accounting models. Previous DWLBC FloraSearch studies have illustrated that currently available national models can misrepresent carbon sequestration rates in lower rainfall regions by over 50% (Hobbs et al. 2009a). To permit the use of this national carbon accounting system and associated models, the South Australia government must be able to accurately quantify growth rates and provide carbon calibration data for revegetation activities in the state.
DWLBC has previously invested resources and developed collaborations with the Future Farm Industries CRC and the Rural Industry Research and Development Corporation (RIRDC) to undertake two studies on carbon sequestration rates and evaluation techniques for two areas within SA (Upper South East [Hobbs et al. 2006, 2009a] & River Murray Dryland Corridor [Hobbs & Bennell 2005]). The FloraSearch team has collaborated

INTRODUCTION
Report DWLBC 2010/02 Carbon Sequestration from Revegetation: Southern Murray-Darling Basin Region
7
extensively with CSIRO in recent years on other national studies of native plant growth rates and carbon sequestration modelling (Polglase et al. 2008). From these investments and collaborations DWLBC has developed a unique capacity to undertake scientifically rigorous evaluations of carbon sequestration rates of native plant species in lower rainfall regions.
While the ultimate objective of the State Government is to develop a comprehensive understanding of carbon sequestration rates from all revegetation plantings in South Australia, the most cost-effective approach will be to develop sound methodologies and information in regions and plant communities with the highest priority for investment. Landscapes currently utilised for dryland agriculture in the lower rainfall regions (300-650mm) have the greatest viability and prospects for investments in revegetation for carbon sequestration, sustainable woody crop production and beneficial environmental outcomes. The development of sustainability markets in South Australia for carbon sequestration in woody crops and environmental plantings requires a scientifically rigorous evaluation process and an understanding of the productivity and carbon sequestration rates of revegetation activities.

INTRODUCTION
Report DWLBC 2010/02 Carbon Sequestration from Revegetation: Southern Murray-Darling Basin Region
8

Report DWLBC 2010/02 Carbon Sequestration from Revegetation: Southern Murray-Darling Basin Region
9
2. IDENTIFICATION OF LOCAL REVEGETATION
SPECIES AND ACTIVITIES
2.1 LOCAL NATIVE SPECIES
There are many biodiversity and practical site-suitability benefits of utilising common local native species for revegetation. This of course is affected by ease of propagation, targeted diversity of plant species and complexity of plant stratum being created. To determine the most common local native species suited for the study area an analysis regional species frequency was conducted using herbarium and plant surveys records from the SA Department of Environment and Heritage.
To help identify changes in species composition caused by differing environmental conditions the study area was divided into three broad regions using the Interim Biogeographic Regions of Australia (IBRA) mapping as a guide (Figure 1). These regions included the Fleurieu subregion, the Tintinara subregion (including Murray Lakes & Coorong, and southern part Lowan Mallee subregions) and the Murray Mallee subregion (including northern part Lowan Mallee subregion). The Murray Lakes and Coorong subregion and parts of Lowan Mallee subregion were amalgamated into neighbouring broader groups based on climate and species similarities.
For revegetation in Australia to gain accreditation within most existing and proposed carbon trading schemes (e.g. Carbon Pollution Reduction Scheme) they typically must fit the criteria for compliant forests identified by the Kyoto protocol (Department of Climate Change 2008). The Australian definition of a forest for the purpose of Kyoto Protocol accounting specifies a post-1990 planted forest with minimum area of only 0.2 hectares, tree crown cover of 20 per cent and a tree height of two metres.
To make the output from the database more meaningful species lists were divided into three strata; Tall, Medium and Small, to represent overstorey, midstorey and understorey, based on maximum recorded height. Site variations across the study area made it difficult to classify species into an exact stratum position as a midstorey tree at one site may become the main overstorey species at another depending on the species mix and environment. All plants with a maximum recorded height < 2 metres were excluded as they are not currently compliant with the requirements for forest carbon sinks. Table 1 lists those indigenous species recorded ≥ 60 times within each subregion. Frequency of occurrence data for each species in each zone should largely coincide with its importance as a species for environmental revegetation in that area. Clearer evidence of commonly planted species comes from nursery sales / plant distribution data for the region.

IDENTIFICATION OF LOCAL REVEGETATION SPECIES AND ACTIVITIES
Report DWLBC 2010/02 Carbon Sequestration from Revegetation: Southern Murray-Darling Basin Region
10
Table 1. Common naturally occurring native woody plant species of the study region. Based on the frequency of occurrences from SA DEH herbarium and plant survey records (>60 records) by IBRA sub-regions.
Fleurieu IBRA Sub-region Height Species Count Height Species Count Tall Eucalyptus odorata 121 Medium Dodonaea viscosa 114 Tall Eucalyptus fasciculosa 108 Medium Eucalyptus phenax 87 Tall Allocasuarina verticillata 97 Medium Acacia paradoxa 76 Tall Bursaria spinosa 84 Small Calytrix tetragona 81 Tall Eucalyptus porosa 73 Small Acacia spinescens 73 Tall Eucalyptus leucoxylon 71 Small Olearia pannosa 72 Medium Acacia pycnantha 123 Murray Mallee IBRA Sub-region Height Species Count Height Species Count Tall Eucalyptus socialis 297 Medium Acacia calamifolia 87 Tall Melaleuca lanceolata 289 Medium Eucalyptus brachycalyx 84 Tall Eucalyptus dumosa 235 Medium Exocarpos sparteus 84 Tall Myoporum platycarpum 141 Medium Eucalyptus calycogona 82 Tall Eucalyptus oleosa 116 Medium Acacia pycnantha 82 Tall Eucalyptus porosa 98 Medium Dodonaea viscosa 80 Tall Callitris gracilis 74 Medium Eucalyptus yalatensis 73 Tall Pittosporum angustifolium 69 Medium Santalum acuminatum 72 Medium Eucalyptus leptophylla 355 Medium Grevillea pterosperma 65 Medium Eucalyptus incrassata 310 Medium Acacia microcarpa 65 Medium Melaleuca acuminata 239 Small Babingtonia behrii 196 Medium Leptospermum coriaceum 237 Small Phebalium bullatum 161 Medium Eucalyptus gracilis 209 Small Calytrix tetragona 154 Medium Melaleuca uncinata 193 Small Acacia spinescens 149 Medium Callitris verrucosa 186 Small Beyeria lechenaultii 107 Medium Allocasuarina muelleriana 137 Small Senna artemisioides 100 Medium Acacia rigens 136 Small Aotus subspinescens 93 Medium Hakea mitchellii 125 Small Eutaxia microphylla 91 Medium Acacia brachybotrya 120 Small Acacia lineata 76 Medium Callitris canescens 96 Small Muehlenbeckia florulenta 62 Medium Eucalyptus phenax 93 Tintinara IBRA Sub-region Height Species Count Height Species Count Tall Eucalyptus diversifolia 201 Medium Melaleuca brevifolia 87 Tall Banksia marginata 186 Medium Leucopogon parviflorus 85 Tall Eucalyptus leucoxylon 179 Medium Melaleuca acuminata 78 Tall Melaleuca lanceolata 151 Medium Hakea rostrata 65 Tall Eucalyptus fasciculosa 117 Medium Exocarpos syrticola 63 Tall Acacia longifolia ssp. sophorae 114 Small Correa reflexa 279 Tall Bursaria spinosa 110 Small Calytrix tetragona 274 Tall Eucalyptus socialis 80 Small Acacia spinescens 268 Tall Myoporum insulare 79 Small Banksia ornata 263 Tall Eucalyptus dumosa 67 Small Allocasuarina pusilla 225 Medium Allocasuarina muelleriana 292 Small Babingtonia behrii 212 Medium Eucalyptus incrassata 287 Small Adenanthos terminalis 186 Medium Hakea mitchellii 275 Small Hakea vittata 128 Medium Eucalyptus leptophylla 265 Small Grevillea ilicifolia 119 Medium Leptospermum myrsinoides 235 Small Calytrix alpestris 85 Medium Leptospermum coriaceum 229 Small Aotus subspinescens 79 Medium Acacia pycnantha 142 Small Eutaxia microphylla 77 Medium Exocarpos sparteus 140 Small Persoonia juniperina 75 Medium Rhagodia candolleana 113 Small Acacia myrtifolia 70 Medium Melaleuca uncinata 107 Small Pomaderris obcordata 67 Medium Callitris verrucosa 99 Small Choretrum glomeratum 61

IDENTIFICATION OF LOCAL REVEGETATION SPECIES AND ACTIVITIES
Report DWLBC 2010/02 Carbon Sequestration from Revegetation: Southern Murray-Darling Basin Region
11
2.2 SPECIES USED IN REVEGETATION
In reality what has been planted at any location for revegetation purposes may not reflect the most common native species in the surrounding area. Species selections may be restricted to available nursery stock in any given year. Species that are easy to propagate can dominate the selections available; while ones that are common but are difficult to propagate may be in short supply. Revegetation by direct seeding also favours species that respond well to that treatment skewing species representation in some sites.
Emes et al. (2006) determined that Trees For Life (TFL) had provided a significant number of the plants that went into revegetation efforts around the state (29% of total). TFL provides 94% of the plants for revegetation in the Murray Mallee region and 30% of plants in the whole South East region. It must be noted that the smaller percentage of TFL plants in the South East region is due to the dominance of commercial forestry (e.g. Tasmanian Bluegum) plantings in Emes’ regional tallies. Due to differences in zone boundaries, it is difficult accurately determine the total number of plants or the proportion of TFL stock used in the study region. However, TFL is clearly the dominant provider of trees and shrubs for environmental plantings (non-commercial) in the Southern Murray-Darling Basin region.
Unlike many organisations that produce native plants for revegetation, Trees For Life (TFL) targets species production for well defined zones (Figure 3). A list of species for each of these zones is available each year and land holders are encouraged to place orders for seedlings based on those lists.
Figure 3. Trees For Life zones in the Southern Murray-Darling Basin region.

IDENTIFICATION OF LOCAL REVEGETATION SPECIES AND ACTIVITIES
Report DWLBC 2010/02 Carbon Sequestration from Revegetation: Southern Murray-Darling Basin Region
12
Trees For Life kindly permitted access to their plant sales and distribution data for the ten year period from 1999 to 2008 from the TFL zones within the study area (Bernie Odomei, pers. comm.). To estimate the total number of each species planted within the study area:
• it was assumed TFL plants sales were uniformly distributed across each TFL zone;
• higher rainfall species were excluded (not suited to our study area); and
• sales data was proportioned based on the area of overlap between TFL zones and the study region.
Based on these calculations it is estimated that Trees For Life have dispatched 2.4 million trees into the study area over the last ten years (Table 2).
There is a high degree of concurrence between the most common species identified by analysis of DEH plant survey data (Table 1) and the most abundant species distributed by Trees For Life in the region (Table 2). It is also apparent, from comparisons of these lists, that generally few mid and lower story species, or common species difficult to propagate in nurseries (e.g. Myoporum platycarpum, M. insulare), have been distributed by TFL and planted in the region over the last 10 years. Some species (e.g. Eucalyptus camaldulensis, E. viminalis, E. largiflorens) appear to be planted more frequently than would be expected from analysis of their natural occurrence in the region.
Table 2. Top 50 most commonly planted species in the study area based on 10 years of Trees For Life plant seedling distribution data (1999-2008).
Species
Total Plants Last 10
Years Species
Total Plants Last 10
Years Eucalyptus fasciculosa 149,197 Acacia ligulata 26,289 Allocasuarina verticillata 142,803 Acacia myrtifolia 24,068 Eucalyptus leucoxylon 129,513 Bursaria spinosa 23,577 Eucalyptus camaldulensis 115,809 Allocasuarina muelleriana 22,931 Acacia pycnantha 107,173 Pittosporum angustifolium 22,140 Melaleuca lanceolata 105,802 Eucalyptus brachycalyx 21,828 Dodonaea viscosa 71,591 Acacia microcarpa 21,776 Eucalyptus socialis 63,136 Acacia calamifolia 21,673 Eucalyptus porosa 59,291 Leptospermum lanigerum 18,735 Eucalyptus gracilis 51,282 Leptospermum continentale 18,147 Melaleuca halmaturorum 49,245 Eucalyptus phenax 17,861 Eucalyptus incrassata 43,188 Melaleuca decussata 16,868 Callistemon rugulosus 39,858 Eucalyptus baxteri 14,692 Acacia paradoxa 39,350 Acacia retinodes 14,448 Eucalyptus odorata 38,761 Acacia rigens 14,153 Eucalyptus dumosa 38,375 Acacia longifolia ssp. sophorae 12,786 Eucalyptus leptophylla 36,347 Acacia hakeoides 12,385 Melaleuca uncinata 36,044 Eucalyptus cosmophylla 11,970 Acacia brachybotrya 33,784 Acacia dodonaeifolia 10,650 Melaleuca acuminata 31,275 Banksia marginata 10,460 Eucalyptus oleosa 31,240 Xanthorrhoea semiplana 10,234 Eucalyptus viminalis 30,478 Acacia cupularis 9,668 Eucalyptus largiflorens 30,061 Eucalyptus diversifolia 9,428 Callitris gracilis 29,537 Allocasuarina striata 8,997 Eucalyptus calycogona 27,648 All other species (n=84) 422,554 Acacia acinacea 26,595 Total of all species (n=134) 2,375,702

IDENTIFICATION OF LOCAL REVEGETATION SPECIES AND ACTIVITIES
Report DWLBC 2010/02 Carbon Sequestration from Revegetation: Southern Murray-Darling Basin Region
13
2.3 REVEGETATION ACTIVITIES
The SA Department of Water, Land and Biodiversity have previously commissioned studies to estimate the number of hectares of commercial farm forestry and environmental revegetation planted across the state based on nursery surveys of plant sales and their distribution (Emes et al. 2006). Results of these surveys for the period between 1999 and 2005 are collated and presented in Table 3 and Table 4. On average, approximately 6,300 ha of farm forestry and revegetation was planted annually, with indigenous environmental plantings (~4,300 ha/year) and saltbush (~950 ha/year) dominating revegetation activities in lower rainfall regions. However, saltbush plantings for grazing purposes are unlikely to be Kyoto-compliant for carbon accounting.
No precise information exists on the area that has been revegetated in the study region in recent years. Using the planting density estimates provided in Emes et al. (2006) of around a 1000 stems per hectare, and Trees For Life plant sales and distribution data, it is estimated that a minimum of ~2,400 hectares of environmental revegetation has been planted in the region over the last ten years, or ~240 hectares per year. This figure excludes areas planted with fodder shrubs (e.g. saltbush) and other extractive farm forestry (e.g. firewood, woodchips, lumber). This estimate largely concurs with an analysis of Emes’ regional statistics, when total plant numbers are proportioned according to overlapping areas within the study region.
Table 3. Estimated area of revegetation (hectares) established in SA (1999 - 2005).
Type of revegetation 1999 2000 2001 2002 2003 2004 2005
Indigenous 3,767 4,052 3,912 4,058 4,539 5,128 4,632
Native (non indigenous) 1,052 381 794 330 95 191 920
Native Grasses 12 16 38 58 21 30 32
Farm Forestry 0 630 254 445 442 507 64
Saltbush 1,492 1,210 1,302 318 1,093 582 635
Tagasaste 572 207 72 10 54 11 6
Product Species (e.g. broombush) 14 47 12 98 33 69 30
Total 6,909 6,543 6,384 5,317 6,277 6,518 6,320 Source: Emes et al. (2006) Commercial forestry figures removed.
Table 4. Estimated area of revegetation and commercial forestry (hectares) established in each region of SA (1999 - 2005).
Region 1999 2000 2001 2002 2003 2004 2005
Eyre Peninsula 1,243 1,013 532 456 1,174 658 1,017
Northern Agric. Districts 455 648 497 494 508 347 640
Adelaide Plains 102 269 222 70 113 94 733
Metropolitan Area 511 67 218 296 68 422 407
Murray Darling Basin 403 961 837 629 801 1,259 773
Mount Lofty Ranges/ KI 2,338 6,499 2,286 3,183 2,012 6,089 4,081
South East 6,657 20,926 7,330 6,639 1,742 1,369 2,949
State (region unknown) 1,190 230 1,272 456 1,011 858 1,271
Total 12,899 30,613 13,194 12,223 7,429 13,744 11,871 Source: Emes et al. (2006) Commercial forestry figures Included.

IDENTIFICATION OF LOCAL REVEGETATION SPECIES AND ACTIVITIES
Report DWLBC 2010/02 Carbon Sequestration from Revegetation: Southern Murray-Darling Basin Region
14
2.4 RECOMMENDED SPECIES
2.4.1 PRODUCTIVE SPECIES
Monocultures of woodlot and other commercial extractive-use species are often more productive than environmental plantings at the same plant density (trees per hectare). Prior studies in lower-rainfall regions have identified a number of productive agroforestry species (Table 5) suited for use in commercial revegetation plantations (Hobbs et al. 2009a, Bennell et al. 2008, Hobbs et al. 2006, Hobbs & Bennell 2005, Harwood et al. 2001 & 2005, Fairlamb & Bulman 1994). Many of the species listed in Table 5 are widely applicable for this study region. However, some species listed have more specific climate and soil preferences. To guide potential growers within the study area, generalised species preferences for two broad environmental regions based on their dominant climatic conditions and soils are also indicated (Table 5). Local expert advice should be sought from revegetation and farm forestry consultants and groups to ensure optimal species choices for any site. This table also identifies the major product groups to which these species are most suited for commercially-driven revegetation purposes (e.g. solid lumber/timber/posts/poles, pulp/woodfibres, fodder for livestock grazing, Eucalyptus oil, firewood/bioenergy)
The growth rate, lifespan and height of plants chosen for carbon sequestration crops influence their viability as a compliant carbon crop for most carbon trading schemes. Although many Acacia species (wattles) are highly productive in their early stages, some do not persist over longer timeframes, and many saltbushes (e.g. Atriplex nummularia) may not achieve a Kyoto-compliant height class (e.g. ≥ 2m). Monocultures of these short-lived and lower height species may not be suitable for typical carbon crop contracts.
Table 5. Woody species suitable for production-oriented revegetation in major environmental regions of the Southern Murray-Darling Basin region.
Recommended Species Common name
E. Fleurieu / Tintinara /
Murray Lakes & Coorong
Murray Mallee / Lowan Mallee
Product Group #
Acacia decurrens black wattle � B,F Acacia lasiocalyx silver wattle � B Acacia mearnsii black wattle � B,F Acacia pycnantha golden wattle � � B Acacia retinodes wirilda � B Allocasuarina luehmannii bull-oak � � L,B Allocasuarina verticillata drooping she-oak � � B Atriplex nummularia old man saltbush � � F Casuarina glauca grey she-oak � L,B Casuarina obesa swamp she-oak � L,B Corymbia citriodora lemon-scented gum � L,O,B Corymbia henryi spotted gum � L,B Corymbia maculata spotted gum � L,B Corymbia variegata spotted gum � L,B Eucalyptus angustissima narrow-leaved mallee � � O,B Eucalyptus aromaphloia scent bark � O,B Eucalyptus astringens brown mallet � � B Eucalyptus baxteri brown stringybark � B

IDENTIFICATION OF LOCAL REVEGETATION SPECIES AND ACTIVITIES
Report DWLBC 2010/02 Carbon Sequestration from Revegetation: Southern Murray-Darling Basin Region
15
Recommended Species Common name
E. Fleurieu / Tintinara /
Murray Lakes & Coorong
Murray Mallee / Lowan Mallee
Product Group #
Eucalyptus botryoides southern mahogany � L,B Eucalyptus brachycalyx Chindoo mallee � B Eucalyptus camaldulensis river red gum � � L,O,B Eucalyptus cladocalyx sugargum � � P,B Eucalyptus cneorifolia KI narrow-leaved mallee � � O,B Eucalyptus cornuta yate � L,B Eucalyptus cyanophylla blue-leaved mallee � B Eucalyptus cypellocarpa mountain grey gum � L,B Eucalyptus diversifolia coastal white mallee � � B Eucalyptus dumosa white mallee � B Eucalyptus gardneri blue mallet � � B Eucalyptus globulus Tasmanian bluegum � L,O,B Eucalyptus gomphocephala tuart � B Eucalyptus grandis flooded gum � L,P,B Eucalyptus horistes oil mallee � O,B Eucalyptus kochii oil mallee � O,B Eucalyptus largiflorens black box � � B Eucalyptus leucoxylon SA bluegum � � B Eucalyptus loxophleba Yorke gum � � O,B Eucalyptus macrorhyncha red stringybark � L,B Eucalyptus melliodora yellow box � � L,B Eucalyptus microcarpa grey box � B Eucalyptus nortonii long-leaved box � L,B Eucalyptus obliqua messmate stringybark � L,B Eucalyptus occidentalis swamp yate � � L,P,B Eucalyptus oleosa red morell � � O,B Eucalyptus ovata swamp gum � P,B Eucalyptus petiolaris Eyre Peninsula bluegum � � B Eucalyptus polyanthemos red box � L,B Eucalyptus polybractea blue mallee � � O,B Eucalyptus porosa mallee box � � O,P,B Eucalyptus punctata grey gum � L,B Eucalyptus rudis flooded gum � L,B Eucalyptus saligna Sydney bluegum � L,B Eucalyptus salmonophloia salmon gum � � L,B Eucalyptus sideroxylon red ironbark � � L,B Eucalyptus socialis red mallee � B Eucalyptus spathulata swamp mallet � � B Eucalyptus tereticornis forest red gum � L,B Eucalyptus tricarpa red ironbark � � L,B Eucalyptus viminalis manna gum � L,P,B Melaleuca armillaris bracelet honey myrtle � B
#Product category codes: L= Lumber/timber; P= Pulp/fibre; F= Fodder; O= Eucalyptus Oil; B= Bioenergy/firewood

IDENTIFICATION OF LOCAL REVEGETATION SPECIES AND ACTIVITIES
Report DWLBC 2010/02 Carbon Sequestration from Revegetation: Southern Murray-Darling Basin Region
16
2.4.2 ENVIRONMENTAL PLANTINGS
Non-extractive use revegetation activities in the region are typically focussed on providing natural resource management or other environmental benefits. These environmental plantings can be use for the reduction of groundwater recharge, dryland salinity, saline river discharges, wind erosion, biodiversity loss, livestock protection and amenity purposes. In the past, these permanent environmental plantings of native trees and shrubs did not have a direct financial benefit to the landholder, but provided longer-term benefits to farming systems and the wider community.
Most environmental plantings in the study region have opted to use local indigenous (see Table 1) or other Australian native species in block and windbreak plantings. SA Trees For Life (TFL) has been particularly active within the region and is a dominant provider of tubestock plants to local farmers (see Table 2).
Species lists from SA Department of Environment databases (Table 1), Trees For Life (Table 2, Appendix A) and recent surveys (Table 6, Appendix B) indicate a range of species suitable for environmental plantings within the study area. Local site conditions (e.g. rainfall, soils) and the intended purpose of the environmental planting will dictate the most appropriate species selections. Local site assessments and expert advice should be sought to promote success of any investments in revegetation.
The carbon sequestration potential of environmental plantings may be increased through the use of a greater proportion of fast growing and productive species in the planting mix. This approach may increase the tradeable carbon value of these plantings but may also conflict with other intended values (e.g. biodiversity) of the mixed environmental planting. Ultimately it is the decision of the investors and planning authorities to determine the right blend of species for any environmental revegetation. Monocultures (or limited species blends) of most productive species may provide substantive increases in tradeable carbon stocks and some natural resource management benefits (e.g. recharge reduction) but have lower biodiversity values.

Report DWLBC 2010/02 Carbon Sequestration from Revegetation: Southern Murray-Darling Basin Region
17
3. DEVELOPMENT OF CARBON ASSESSMENT
METHODS
3.1 ASSESSING ABOVE-GROUND PLANT BIOMASS
Evaluations of the carbon sequestration potential of revegetation sites in lower rainfall areas has been hindered by a lack of productivity data for many of the individual species native to those areas and for mixed environmental plantings in general. This study provides refinements in non-destructive methodologies for assessing above-ground plant biomass, and sets of reliable parameters which can be applied to existing models to assess carbon sequestered within lower rainfall plantations.
The accuracy of the carbon accounting models (e.g. National Carbon Accounting Toolbox NCAT FullCAM) rely heavily on the quality of species/site parameters that drive model calculations. Within NCAT FullCAM, species information and model parameters for lower rainfall species and environmental plantings are typically scant, derived from non-applicable situations or are non existent within the package. Default NCAT FullCAM Environmental Plantings models are typically poor predictors of growth and carbon sequestration in lower rainfall regions of SA (Hobbs et al. 2009a, see later sections). For most lower-rainfall revegetation options, new species and environmental plantings parameter values for FullCAM models must be manually inserted by the user before the model can function with any greater degree of accuracy than that obtained from the default settings.
To supplement the currently limited data within carbon accounting models this study has undertaken work on plant biometrics and productivity surveys from a range revegetation sites and species within the study area. This work includes measuring and destructive sampling a number of plants so that relationships (allometric models) between simple plant height by stem area measurements and above-ground plant biomass (and carbon content) could be determined. These allometric models have then been used to estimate plant biomass and carbon sequestration rates at many sites across the study area. Additional information was also collected from the destructive samples to determine biomass ratios (or fractions) between Stemwood : Bark : Branches : Leaves for a wide range of species common to revegetation sites in the region to match requirement of the NCAT FullCAM models. This study also aims to calibrate spatial empirical models of productivity from soil and climate information (BiosEquil) to estimate likely carbon sequestration rates in the region.
The following sections report on:
• Allometric relationships developed to allow rapid assessment of plant biomass and carbon content in SA revegetation sites;
• Assessments of growth and carbon sequestration rates in woodlots, windbreaks and environmental plantings in the Southern Murray-Darling Basin region (see Figure 4);
• Comparisons of field observations of productivity and carbon sequestration with default NCAT FullCAM model predictions; and
• Regional estimates of productivity and carbon sequestration from revegetation in the Southern Murray-Darling Basin region.

DEVELOPMENT OF CARBON ASSESSMENT METHODS
Report DWLBC 2010/02 Carbon Sequestration from Revegetation: Southern Murray-Darling Basin Region
18
Figure 4. Location of survey sites for destructive sampling and productivity measurements in the Southern Murray-Darling Basin region.
3.2 ALLOMETRIC ASSESSMENT TECHNIQUES
Most existing assessments of plantation productivity are focussed on assessing height and stem diameters. These measures are suitable for estimating stemwood volumes for classical forestry where the focus is on the recoverable solid timber. For carbon sequestration assessments and many biomass industries the focus is on the whole plant biomass and the relative proportions of stemwood, bark, twig and leaf fractions. The dry weights of these fractions can then be used to calculate carbon sequestration rates, and provide accurate estimates of the carbon sequestered by the entire plant. Carbon accounting and other biomass industry productivity assessments require assessment methodologies that can be used to rapidly and reliably assess both total dry biomass and carbon content.
Allometrics is a commonly used technique to non-destructively assay plantation productivity from a limited number of measurements (biometrics). In classical forestry industries, these allometric models are often based on measurements of tree diameter at breast height or basal area calculations (± tree height) to determine stemwood volumes or biomass, with models often being species specific (Snowdon et al. 2004, 2002, Grierson 2000, Kiddle et al. 1987). However, allometric models based on high rainfall forestry trees are unlikely to be reliable predictors of productivity for the mallee and shrub lifeforms more suited to lower rainfall regions. New allometric models must be developed to non-destructively and efficiently assess plantations of low rainfall agroforestry species. To maintain consistency

DEVELOPMENT OF CARBON ASSESSMENT METHODS
Report DWLBC 2010/02 Carbon Sequestration from Revegetation: Southern Murray-Darling Basin Region
19
with NCAT FullCAM modelling parameters current analyses have mainly focussed on relationships between stemwood volume and total plant dry biomass.
3.2.1 SAMPLING
Several new plant species were selected and destructively sampled (39 individual plants) from dryland environments in the Southern Murray-Darling Basin regions from forestry and revegetation sites of known age (Neumann et al. 2010) to supplement information from prior work in the River Murray Corridor and Upper South East regions (101 individual plants) (see Table 6; Hobbs & Bennell 2005; Hobbs et al. 2006). Plant species were chosen to represent those species most highly ranked for agroforestry development (Hobbs et al. 2009a) and environmental plantings for the region. The species selected included forestry tree species, small trees and mallees, and shrubs. A minimum of 3 individuals of each species and location were chosen for detailed biometric measurements of plant morphology and biomass sampling.
Individual plant measurements included height, crown width, distance to neighbouring plants, stem count and circumference at two lower section heights (basal and intermediate: 0.5m and 1.3m for trees and mallees; and 0.2m and 0.8m for shrubs), and visual ranking of leaf density using reference photographs (8 classes). The stemwood volume (outer bark) of each plant was calculated from stem height and circumferences using standard forestry formulas for tree volumes of each stemwood section (1. lower section – cylinder volume; 2. mid section - Smalian's frustrum of a paraboloid volume, and 3. upper section - paraboloid volume).
Samples of wood and bark were taken from each basal and intermediate height for each plant with an additional sample taken half way between the intermediate height and the top of the plant. The diameter of the wood (minus bark) and bark thicknesses were measured across the north-south axis of the sample, and used to determine the bark proportion of the outer bark stemwood volume. The green weight of the wood only and bark only samples were measured immediately. The green volume of the wood only samples was determined by displacement in water, and the separate wood and bark samples were oven dried to a steady dry-weight to determine wood basic density and the moisture content of each sample component.
The whole of each plant was destructively sampled and sorted into three biomass fractions: 1. stemwood and bark (>20mm diameter); 2. twig and bark (2-20mm diameter); and 3. leaf, fine twig and bark (<2mm diameter) and each fraction weighed immediately. Samples (>200g) from each green biomass fraction was weighed immediately, oven dried to a steady dry-weight and reweighed to determine their moisture content. The total dry biomass of each plant was determined from the green weight of each biomass fraction and the observed moisture content of oven-dried subsamples. Whole plant carbon contents were calculated from the sum of dry biomass fractions and the commonly accepted generic conversion factor of 0.5 (Snowdon et al. 2002).
Allometric relationships between simple measurements of height, crown area, basal stem area, leaf density, stemwood volumes and observations of total green biomass (including stemwood and bark; twig and bark; and leaf, fine twig and bark) were plotted, explored visually and tested using linear and non-linear regressions. Interactions between these simple measurements and lifeform or plant genera groupings were also evaluated.

DE
VE
LO
PM
EN
T O
F C
AR
BO
N A
SS
ES
SM
EN
T M
ET
HO
DS
Report D
WLB
C 2010/02
20 C
arbon Sequestration from
Revegetation: S
outhern Murray-D
arling Basin R
egion
Table 6. Plant species measured and destructively sampled for biometric studies, including some key plant characteristics (mean values, n=3).
Proportion Dry Biomass by Weight
Species (plantation type) Rai
nfal
l [m
m]
Age
[yea
rs]
Hei
ght [
m]
Life
form
[T
ree/
Mal
lee/
Shr
ub]
Cro
wn
Wid
th [m
]
Cro
wn
Are
a [m
²]
Fol
iage
Den
sity
[%
]
Bas
al A
rea
[cm
²]
at 0
.5m
hei
ght
Ste
mw
ood
Vol
ume
x 10
00 [m
³]
Bas
ic D
ensi
ty
[kg/
m³]
(n=
9)
Tot
al D
ry B
iom
ass
[kg/
plan
t]
Woo
d
Bar
k
Bra
nch
Leaf
Acacia ligulata (block 1) 247 8.5 1.80 S 3.0 6.9 81 62#2 7.8 840 15.9 0.06 0.03 0.67 0.23 Acacia ligulata (block 2) 261 13.8 3.23 S 4.4 15.7 62 182 28.9 820 52.9 0.63 0.20 0.12 0.05 Acacia mearnsii (block) 492 12.5 9.90 T 3.3 9.7 57 179 82.4 650 73.5 0.67 0.15 0.11 0.07 Acacia oswaldii (block 1; n=2) 340 12.5 2.03 S 2.9 6.6 95 132#2 13.4 859 25.8 0.18 0.04 0.48 0.30 Acacia oswaldii (block 2) 253 8.5 1.40 S 2.1 3.5 57 29#1 1.5 878 4.6 0.08 0.03 0.60 0.29 Acacia pycnantha (block 1) 340 13.5 4.10 T 3.8 11.5 43 68 11.1 785 32.4 0.47 0.12 0.26 0.15 Acacia pycnantha (block 2) 387 7.0 3.37 S 3.2 8.3 86 96 14.5 675 35.2 0.34 0.10 0.22 0.34 Acacia rigens (block 1) 340 12.5 2.60 S 2.1 3.7 100 92 10.0 776 24.3 0.22 0.07 0.37 0.33 Acacia rigens (block 2) 357 31.2 2.78 S 7.0 40.0 71 448 44.3 874 168.6 0.49 0.11 0.22 0.18 Allocasuarina verticillata (block 1) 340 12.5 5.67 T 3.3 8.4 43 183 41.4 723 48.3 0.52 0.17 0.18 0.13 Allocasuarina verticillata (block 2) 492 10.9 9.60 T 4.9 19.1 38 484 173.9 724 202.3 0.67 0.16 0.07 0.10 Atriplex nummularia (block 1) 251 7.5 1.90 S 3.2 8.2 81 133#1 7.8 793 16.9 0.15 0.01 0.66 0.18 Atriplex nummularia (block 2) 466 3.0 1.77 S 2.5 4.8 86 67#2 6.3 626 11.6 0.39 0.02 0.42 0.22 Callitris gracilis (block) 253 8.5 2.13 S 1.4 1.5 76 17#2 1.9 619 2.5 0.10 0.03 0.38 0.48 Callitris verrucosa (block) 357 31.3 4.60 S 4.6 16.9 86 642 113.7 642 160.8 0.54 0.09 0.19 0.19 Corymbia maculata (block) 492 10.8 7.97 T 3.2 7.8 52 114 32.0 601 23.8 0.41 0.30 0.13 0.16 Dodonea viscosa (block) 261 13.8 2.91 S 3.0 7.2 29 141 14.2 830 20.1 0.64 0.14 0.15 0.07 Eucalyptus calycogona (block) 261 8.5 2.70 M 2.5 5.1 57 75#2 5.2 775 17.0 0.23 0.07 0.26 0.44 Eucalyptus camaldulensis (windbreak) 460 10.7 11.20 T 4.9 19.1 57 450 172.4 483 92.3 0.59 0.18 0.10 0.12 Eucalyptus cladocalyx (block) 460 6.7 7.07 T 2.7 5.7 71 118 30.2 634 31.0 0.39 0.17 0.21 0.23 Eucalyptus cladocalyx (windbreak) 460 6.7 5.83 T 2.4 4.5 86 142 28.5 600 34.4 0.43 0.15 0.17 0.25 Eucalyptus cyanophylla (block) 261 9.5 2.88 M 2.5 5.2 62 62 5.9 787 22.3 0.20 0.10 0.26 0.44 Eucalyptus diversifolia (mixed block) 460 12.7 5.50 M 4.3 15.6 66 208 51.6 581 91.7 0.33 0.06 0.41 0.20

DE
VE
LO
PM
EN
T O
F C
AR
BO
N A
SS
ES
SM
EN
T M
ET
HO
DS
Report D
WLB
C 2010/02
21 C
arbon Sequestration from
Revegetation: S
outhern Murray-D
arling Basin R
egion
Proportion Dry Biomass by Weight
Species (plantation type) Rai
nfal
l [m
m]
Age
[yea
rs]
Hei
ght [
m]
Life
form
[T
ree/
Mal
lee/
Shr
ub]
Cro
wn
Wid
th [m
]
Cro
wn
Are
a [m
²]
Fol
iage
Den
sity
[%
]
Bas
al A
rea
[cm
²]
at 0
.5m
hei
ght
Ste
mw
ood
Vol
ume
x 10
00 [m
³]
Bas
ic D
ensi
ty
[kg/
m³]
(n=
9)
Tot
al D
ry B
iom
ass
[kg/
plan
t]
Woo
d
Bar
k
Bra
nch
Leaf
Eucalyptus dumosa (block) 387 12.0 3.25 M 2.7 6.5 62 63 7.8 767 20.4 0.35 0.12 0.33 0.20 Eucalyptus globulus (block) 460 10.7 13.80 T 3.5 10.1 57 224 126.1 530 90.8 0.63 0.10 0.09 0.17 Eucalyptus gracilis (block 1) 261 6.6 1.77 M 2.0 3.0 91 31#1 1.4 830 6.1 0.05 0.02 0.36 0.57 Eucalyptus gracilis (block 2) 357 31.2 10.03 M 7.5 47.6 71 701 318.0 908 422.1 0.75 0.14 0.06 0.05 Eucalyptus incrassata (block) 357 31.2 5.79 M 7.8 47.7 43 423 97.6 824 221.5 0.61 0.12 0.14 0.13 Eucalyptus incrassata (mixed block) 460 12.7 3.55 M 4.3 14.8 71 132 19.0 726 50.9 0.31 0.12 0.29 0.28 Eucalyptus largiflorens (windbreak) 261 10.5 3.77 M 2.6 5.4 52 95 13.0 687 19.2 0.40 0.16 0.22 0.22 Eucalyptus leptophylla (block) 357 31.3 6.57 M 9.2 67.9 71 665 205.7 844 388.8 0.66 0.10 0.13 0.11 Eucalyptus leucoxylon (block) 492 10.7 9.70 T 2.9 6.6 43 172 61.1 657 42.7 0.54 0.27 0.07 0.12 Eucalyptus occidentalis (block) 460 5.7 9.97 T 3.3 8.7 57 238 95.9 538 68.1 0.64 0.10 0.09 0.17 Eucalyptus occidentalis (windbreak) 460 6.7 8.57 T 2.3 4.5 57 133 49.7 604 39.8 0.57 0.10 0.12 0.21 Eucalyptus oleosa (block 1) 261 10.4 2.93 M 3.5 9.9 76 84 8.4 793 25.1 0.24 0.09 0.27 0.39 Eucalyptus oleosa (block 2) 357 31.2 6.43 M 9.2 67.2 57 555 158.8 841 343.2 0.61 0.12 0.12 0.15 Eucalyptus porosa (block 1) 340 12.4 4.50 M 3.6 17.9 71 218 34.3 663 55.4 0.43 0.13 0.18 0.26 Eucalyptus porosa (block 2) 261 9.5 2.37 M 3.1 7.8 76 67 4.4 668 11.6 0.19 0.06 0.39 0.35 Eucalyptus porosa (block 3) 387 6.7 3.90 M 3.8 11.7 71 93 11.6 577 23.3 0.29 0.08 0.26 0.37 Eucalyptus socialis (block) 261 10.5 3.30 M 4.5 16.0 71 136 16.1 757 51.5 0.25 0.09 0.30 0.36 Eucalyptus socialis (windbreak) 357 26.1 5.57 M 7.1 39.5 71 517 107.0 778 185.9 0.64 0.14 0.11 0.12 Eucalyptus viminalis (block) 460 5.7 11.07 T 3.9 12.6 52 312 129.9 487 75.4 0.55 0.15 0.09 0.21 Melaleuca lanceolata (block) 357 31.2 4.00 S 5.0 20.5 71 487 106.6 776 148.8 0.56 0.14 0.16 0.14 Melaleuca uncinata (block) 340 12.4 1.83 S 1.7 2.3 100 73#1 7.3 711 10.7 0.10 0.03 0.46 0.41 Melaleuca uncinata (windbreak) 357 16.3 2.27 S 2.2 4.0 71 88#2 10.1 769 11.6 0.40 0.09 0.28 0.24 Pittosporum phylliraeoides (block) 357 16.2 2.47 S 2.3 4.3 43 97 13.2 754 18.0 0.51 0.14 0.25 0.11 Senna artemis. ssp. coriacea (block) 261 13.4 1.61 S 2.1 3.5 62 34 2.7 955 5.4 0.00 0.00 0.65 0.35 # 1 basal area at 0.1m height, 2 0.2m
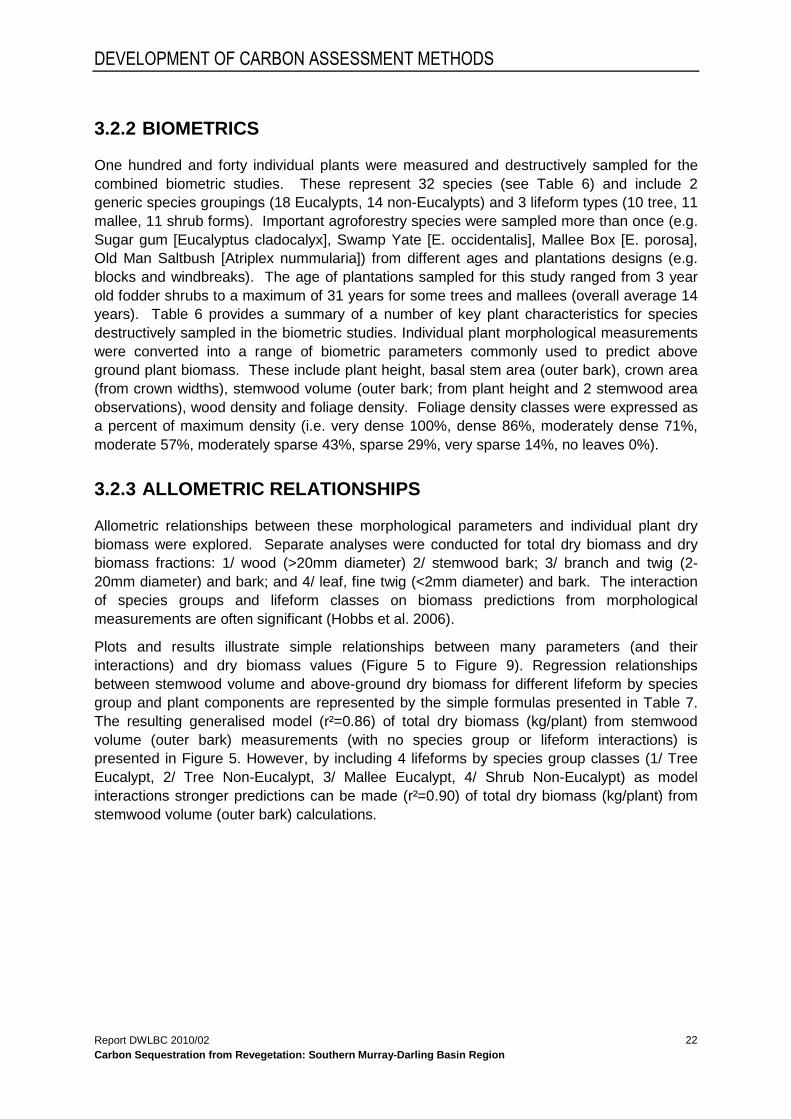
DEVELOPMENT OF CARBON ASSESSMENT METHODS
Report DWLBC 2010/02 Carbon Sequestration from Revegetation: Southern Murray-Darling Basin Region
22
3.2.2 BIOMETRICS
One hundred and forty individual plants were measured and destructively sampled for the combined biometric studies. These represent 32 species (see Table 6) and include 2 generic species groupings (18 Eucalypts, 14 non-Eucalypts) and 3 lifeform types (10 tree, 11 mallee, 11 shrub forms). Important agroforestry species were sampled more than once (e.g. Sugar gum [Eucalyptus cladocalyx], Swamp Yate [E. occidentalis], Mallee Box [E. porosa], Old Man Saltbush [Atriplex nummularia]) from different ages and plantations designs (e.g. blocks and windbreaks). The age of plantations sampled for this study ranged from 3 year old fodder shrubs to a maximum of 31 years for some trees and mallees (overall average 14 years). Table 6 provides a summary of a number of key plant characteristics for species destructively sampled in the biometric studies. Individual plant morphological measurements were converted into a range of biometric parameters commonly used to predict above ground plant biomass. These include plant height, basal stem area (outer bark), crown area (from crown widths), stemwood volume (outer bark; from plant height and 2 stemwood area observations), wood density and foliage density. Foliage density classes were expressed as a percent of maximum density (i.e. very dense 100%, dense 86%, moderately dense 71%, moderate 57%, moderately sparse 43%, sparse 29%, very sparse 14%, no leaves 0%).
3.2.3 ALLOMETRIC RELATIONSHIPS
Allometric relationships between these morphological parameters and individual plant dry biomass were explored. Separate analyses were conducted for total dry biomass and dry biomass fractions: 1/ wood (>20mm diameter) 2/ stemwood bark; 3/ branch and twig (2-20mm diameter) and bark; and 4/ leaf, fine twig (<2mm diameter) and bark. The interaction of species groups and lifeform classes on biomass predictions from morphological measurements are often significant (Hobbs et al. 2006).
Plots and results illustrate simple relationships between many parameters (and their interactions) and dry biomass values (Figure 5 to Figure 9). Regression relationships between stemwood volume and above-ground dry biomass for different lifeform by species group and plant components are represented by the simple formulas presented in Table 7. The resulting generalised model (r²=0.86) of total dry biomass (kg/plant) from stemwood volume (outer bark) measurements (with no species group or lifeform interactions) is presented in Figure 5. However, by including 4 lifeforms by species group classes (1/ Tree Eucalypt, 2/ Tree Non-Eucalypt, 3/ Mallee Eucalypt, 4/ Shrub Non-Eucalypt) as model interactions stronger predictions can be made (r²=0.90) of total dry biomass (kg/plant) from stemwood volume (outer bark) calculations.
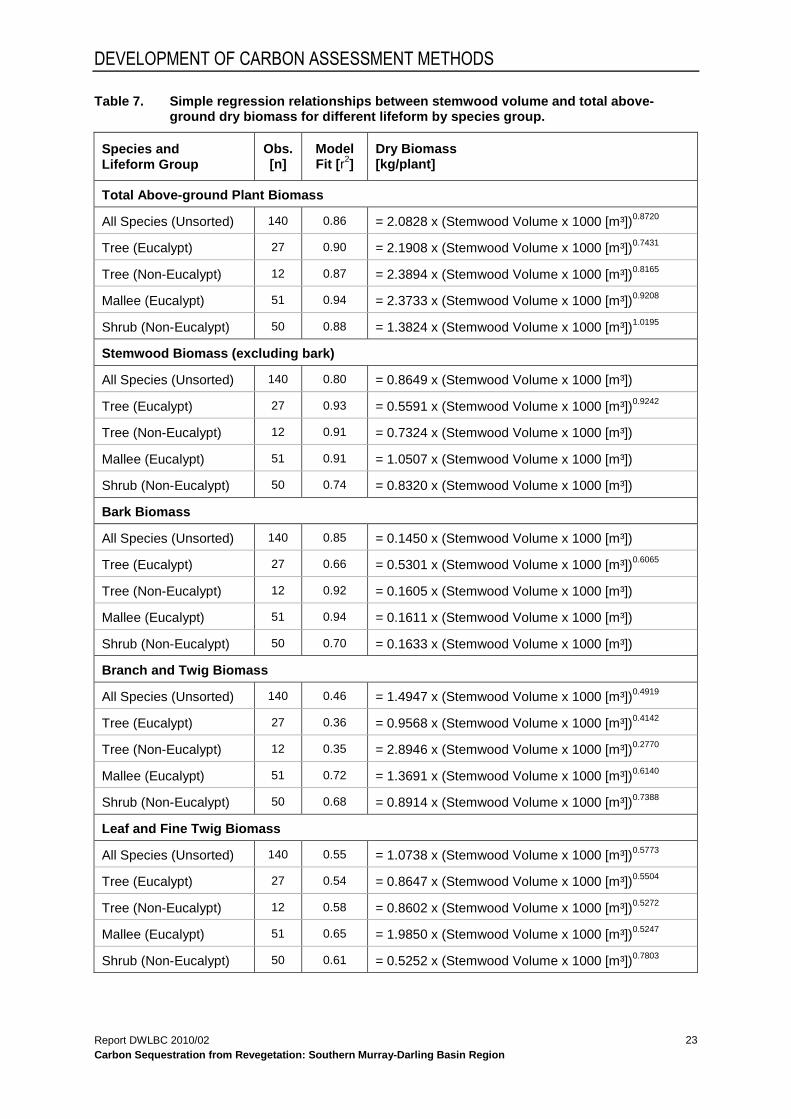
DEVELOPMENT OF CARBON ASSESSMENT METHODS
Report DWLBC 2010/02 Carbon Sequestration from Revegetation: Southern Murray-Darling Basin Region
23
Table 7. Simple regression relationships between stemwood volume and total above-ground dry biomass for different lifeform by species group.
Species and Lifeform Group
Obs. [n]
Model Fit [ r2]
Dry Biomass [kg/plant]
Total Above-ground Plant Biomass
All Species (Unsorted) 140 0.86 = 2.0828 x (Stemwood Volume x 1000 [m³])0.8720
Tree (Eucalypt) 27 0.90 = 2.1908 x (Stemwood Volume x 1000 [m³])0.7431
Tree (Non-Eucalypt) 12 0.87 = 2.3894 x (Stemwood Volume x 1000 [m³])0.8165
Mallee (Eucalypt) 51 0.94 = 2.3733 x (Stemwood Volume x 1000 [m³])0.9208
Shrub (Non-Eucalypt) 50 0.88 = 1.3824 x (Stemwood Volume x 1000 [m³])1.0195
Stemwood Biomass (excluding bark)
All Species (Unsorted) 140 0.80 = 0.8649 x (Stemwood Volume x 1000 [m³])
Tree (Eucalypt) 27 0.93 = 0.5591 x (Stemwood Volume x 1000 [m³])0.9242
Tree (Non-Eucalypt) 12 0.91 = 0.7324 x (Stemwood Volume x 1000 [m³])
Mallee (Eucalypt) 51 0.91 = 1.0507 x (Stemwood Volume x 1000 [m³])
Shrub (Non-Eucalypt) 50 0.74 = 0.8320 x (Stemwood Volume x 1000 [m³])
Bark Biomass
All Species (Unsorted) 140 0.85 = 0.1450 x (Stemwood Volume x 1000 [m³])
Tree (Eucalypt) 27 0.66 = 0.5301 x (Stemwood Volume x 1000 [m³])0.6065
Tree (Non-Eucalypt) 12 0.92 = 0.1605 x (Stemwood Volume x 1000 [m³])
Mallee (Eucalypt) 51 0.94 = 0.1611 x (Stemwood Volume x 1000 [m³])
Shrub (Non-Eucalypt) 50 0.70 = 0.1633 x (Stemwood Volume x 1000 [m³])
Branch and Twig Biomass
All Species (Unsorted) 140 0.46 = 1.4947 x (Stemwood Volume x 1000 [m³])0.4919
Tree (Eucalypt) 27 0.36 = 0.9568 x (Stemwood Volume x 1000 [m³])0.4142
Tree (Non-Eucalypt) 12 0.35 = 2.8946 x (Stemwood Volume x 1000 [m³])0.2770
Mallee (Eucalypt) 51 0.72 = 1.3691 x (Stemwood Volume x 1000 [m³])0.6140
Shrub (Non-Eucalypt) 50 0.68 = 0.8914 x (Stemwood Volume x 1000 [m³])0.7388
Leaf and Fine Twig Biomass
All Species (Unsorted) 140 0.55 = 1.0738 x (Stemwood Volume x 1000 [m³])0.5773
Tree (Eucalypt) 27 0.54 = 0.8647 x (Stemwood Volume x 1000 [m³])0.5504
Tree (Non-Eucalypt) 12 0.58 = 0.8602 x (Stemwood Volume x 1000 [m³])0.5272
Mallee (Eucalypt) 51 0.65 = 1.9850 x (Stemwood Volume x 1000 [m³])0.5247
Shrub (Non-Eucalypt) 50 0.61 = 0.5252 x (Stemwood Volume x 1000 [m³])0.7803

DEVELOPMENT OF CARBON ASSESSMENT METHODS
Report DWLBC 2010/02 Carbon Sequestration from Revegetation: Southern Murray-Darling Basin Region
24
Mallee Eucs
y = 2.3733x0.9208
R2=0.94; n=51
Tree Eucs
y = 2.1908x0.7431
R2=0.90; n=27
Tree NonEucs
y = 2.3894x0.8165
R2=0.87; n=12
Shrub NonEucs
y = 1.3824x1.0195
R2=0.88; n=50
All Plants
y = 2.0828x0.872
R2 = 0.86; n=140
0
200
400
600
800
1000
0 100 200 300 400 500 600Stemwood Volume [m³] x 1000
Dry
Bio
mas
s [k
g/pl
ant]
Tree Eucs
Tree NonEucs
Mallee Eucs
Shrub NonEucs
Figure 5. Allometric relationships between plant stemwood volume measurements and above ground dry biomass for trees, mallees and shrubs.
Tree Eucs
y = 0.5591x0.9242
R2=0.93
Tree NonEucsy = 0.7324x
R2=0.91
Mallee Eucsy = 1.0507x
R2=0.91
All Plantsy = 0.8649x
R2=0.80
Shrub NonEucsy = 0.832x
R2=0.74
0
100
200
300
400
500
600
700
0 100 200 300 400 500 600Stemwood Volume [m³] x 1000
Ste
mw
ood
Dry
Bio
mas
s [k
g/pl
ant]
Tree Eucs
Tree NonEucs
Mallee Eucs
Shrub NonEucs
Figure 6. Allometric relationships between plant stemwood volume measurements and dry stemwood biomass for trees, mallees and shrubs.

DEVELOPMENT OF CARBON ASSESSMENT METHODS
Report DWLBC 2010/02 Carbon Sequestration from Revegetation: Southern Murray-Darling Basin Region
25
Tree Eucs
y = 0.5301x0.6065
R2=0.66
Mallee Eucsy = 0.1611x
R2=0.94
All Plantsy = 0.145x
R2=0.85Shrub NonEucsy = 0.1633x
R2=0.70
Tree NonEucsy = 0.1605x
R2=0.92
0
20
40
60
80
100
0 100 200 300 400 500 600Stemwood Volume [m³] x 1000
Bar
k D
ry B
iom
ass
[kg/
plan
t]Tree Eucs
Tree NonEucs
Mallee Eucs
Shrub NonEucs
Figure 7. Allometric relationships between plant stemwood volume measurements and dry bark biomass for trees, mallees and shrubs.
Tree Eucs y = 0.9568x0.4142
R2=0.36
Tree NonEucs y = 2.8946x0.277
R2=0.35
Mallee Eucs
y = 1.3691x0.614
R2=0.72Shrub NonEucs
y = 0.8914x0.7388
R2=0.68
All Plantsy = 1.4947x0.4919
R2=0.46
0
20
40
60
80
100
0 100 200 300 400 500 600Stemwood Volume [m³] x 1000
Bra
nch
Dry
Bio
mas
s [k
g/pl
ant]
Tree Eucs
Tree NonEucs
Mallee Eucs
Shrub NonEucs
Figure 8. Allometric relationships between plant stemwood volume measurements and dry branch biomass for trees, mallees and shrubs.

DEVELOPMENT OF CARBON ASSESSMENT METHODS
Report DWLBC 2010/02 Carbon Sequestration from Revegetation: Southern Murray-Darling Basin Region
26
Tree Eucs
y = 0.8647x0.5504
R2=0.54
Tree NonEucs
y = 0.8602x0.5272
R2=0.58
Mallee Eucs
y = 1.985x0.5247
R2=0.65
Shrub NonEucs
y = 0.5252x0.7803
R2=0.61
All Plantsy = 1.0738x0.5773
R2=0.55
0
20
40
60
80
100
0 100 200 300 400 500 600Stemwood Volume [m³] x 1000
Leaf
Dry
Bio
mas
s [k
g/pl
ant]
Tree Eucs
Tree NonEucs
Mallee Eucs
Shrub NonEucs
Figure 9. Allometric relationships between plant stemwood volume measurements and dry leaf biomass for trees, mallees and shrubs.
For the Field Trials of Woody Germplasm project (Hobbs et al. 2009a), where stemwood volume has not yet been measured, allometric models have been developed from available biometric data on plant volume to estimate plant dry biomass (Figure 10, Table 8). This model allows us to estimate above ground plant dry biomass by using height and crown diameter data only, and is only ~2% less capable than models based on stemwood volume measurements. Plant basal area (from stem diameter measurements) is a commonly used plant biometric used in many individual species allometric models. The generalised relationship with plant dry biomass from destructive measurements (Figure 11, Table 8) is strong for plants with small stem areas, but increasing variable (and less reliable) with increasing stem area.
To generate the allometric models for the commonly utilised fodder shrub Old Man Saltbush (Atriplex nummularia), a set of destructive biomass measurements for 3 year old plants located at the Field Trials of Woody Germplasm trial site at Murray Bridge has been reanalysed. Within this site, there was a combination of Atriplex nummularia ssp. nummularia germplasm collected from near Yando in Victoria, and the commercial clone, Eyres Green. At Murray Bridge, each of these provenances was planted in 2004 as 4 replicated plots of 8 rows of 8 plants at 3m by 1.5m spacing. In late Autumn 2007, the height and width (along and across the row) was measured for 16 plants in the northwest quadrant of each plot. Plants were then cut plants back to a height and width of approximately 50-60cm and the harvested green biomass (leaf and stems combined) of each plant weighed. For two of the 16 plants from each plot of Yando, and for all plants from each plot of Eyres Green, harvested materials were subdivided and weighed for the edible (leaf and fine stem < 3mm) and woody (all material > 3mm) green biomass fractions. The biomass of the remaining standing in-ground stems was visually estimated using the modified Adelaide technique of Andrew et al. (1979). This approach requires taking a branch unit of known weight that is representative of the branches within the plant to be measured. A count is

DEVELOPMENT OF CARBON ASSESSMENT METHODS
Report DWLBC 2010/02 Carbon Sequestration from Revegetation: Southern Murray-Darling Basin Region
27
then made of the number of representative branch equivalents on the plant, which is then multiplied by the weight of the branch unit to get the standing biomass. Unharvested branch weight estimates were then added to the weight of harvested material in order to calculate whole-plant biomass. Subsamples from these plants were oven-dried to determine the moisture content of each biomass fraction and field observed green biomass values converted to dry matter equivalents. Several biometrics were explored to determine the best predictor of plant dry biomass. The relationship between plant volume (height x elliptical crown area) is presented in Figure 12 and Table 8.
Table 8. Additional dry biomass allometric relationships.
Species Obs. [n]
Model Fit [ r2] Total Above-ground Plant Biomass [kg/plant]
All Species 140 0.88 = 0.8056 x Plant Volume [m³]
All Species 140 0.89 = 0.0875 x Basal Area [cm²]1.2248
Old Man Saltbush 125 0.82 = 2.6531 x Plant Volume [m³]0.8158
Plant Volume = Height [m] x Elliptical Crown Area [m²].
All Plants y = 0.8056xR2=0.88; n=140
0
200
400
600
800
0 100 200 300 400 500 600 700 800 900 1000Above-ground Plant Volume [m³ ]
Dry
Bio
mas
s [k
g/pl
ant]
Figure 10. The relationship between above-ground plant volume (height [m] x crown area [m²]) and dry biomass from trees, mallees and shrubs destructively sampled in SA biometric studies.

DEVELOPMENT OF CARBON ASSESSMENT METHODS
Report DWLBC 2010/02 Carbon Sequestration from Revegetation: Southern Murray-Darling Basin Region
28
All Plantsy = 0.0875x1.2248
R2=0.89; n=140
0
200
400
600
800
0 100 200 300 400 500 600 700 800 900 1000Basal Area [cm²]
Dry
Bio
mas
s [k
g/pl
ant]
Figure 11. The relationship between basal area [cm²] and dry biomass from trees, mallees and shrubs destructively sampled in SA biometric studies.
Atriplex nummulariaOld Man Saltbush
y = 2.6531xR2=0.82; n=125
0
10
20
30
40
0 2 4 6 8 10 12 14Plant Volume (Elliptical Cylinder) [m³]
Dry
Bio
mas
s [k
g/pl
ant]
prov. Yandoo
cv. Eyres Green
Figure 12. Atriplex nummularia relationships between plant elliptical cylinder volume and above ground dry biomass.

Report DWLBC 2010/02 Carbon Sequestration from Revegetation: Southern Murray-Darling Basin Region
29
4. PRODUCTIVITY AND CARBON
SEQUESTRATION FROM REVEGETATION
4.1 ASSESSMENT OF PLANTATION PRODUCTIVITY
Seventy sites of known age were chosen across the study area to assess plant growth and carbon sequestration rates from forestry and environmental revegetation plantings in the low to medium rainfall (300 - 650mm) dryland agriculture zones of the Southern Murray-Darling Basin region of South Australia. The information gathered from these sites were designed to bolster existing plantation information (53 plantations) collected from various sources during the FloraSearch projects within Murray-Darling Basin region (Hobbs et al. 2009a); and to provide information on species grown in mixed species environmental plantings. Recent surveys (70 sites) comprise of 51 mixed species plantings, 19 monocultures plantings and a total of 76 different species. Data from a total of a 123 plantations (26 woodlots, 37 windbreaks & 60 environmental plantings) was available for evaluations of productivity and carbon sequestration in the region.
Productivity assessment protocols varied according to planting designs and species mixes (see Table 9). These were based on 2 planting designs (block and windbreak) and 2 species group types (monocultures and mixed species). Sites were sub-sampled using 6 randomly placed segments of continuous plants along rows (and avoiding ends of rows). Segments typically comprised of 10 individuals in mixed species plantings and 6 individuals in monocultures. The larger number of observations in mixed species planting was utilised to determine proportion of biomass contribution by each species within the plantation. At each segment, individual species (>2m high) were recorded and plant measurements included height, crown width, form (tree/mallee/shrub), distance to neighbouring plants, stem count and circumference at two lower section heights (basal and intermediate: 0.5m and 1.3m) for trees and mallees; and at 0.2m for shrubs), and visual ranking of foliage density using reference photographs (8 classes). Foliage density classes were expressed as a percent of maximum density (i.e. very dense 100%, dense 86%, moderately dense 71%, moderate 57%, moderately sparse 43%, sparse 29%, very sparse 14%, no leaves 0%).
The stemwood volume (outer bark) of each plant was calculated from stem height and circumferences using standard forestry formulas for tree volumes of each stemwood section (1. lower section – cylinder volume; 2. mid section - Smalian's frustrum of a paraboloid volume, and 3. upper section - paraboloid volume). Robust and reliable allometric models (see preceding sections) were applied to the results gathered at the field sites to estimate stemwood volume, above-ground dry biomass productivity and carbon sequestration rates of these plantations of low rainfall species.
Pre-existing survey data of predominantly monocultures (53 plantations; Hobbs et al. 2009a) followed an identical methodology to that outlined above. However, within these plantations the number of observations was typically fewer (30 individuals for woodlots; and 3 to 6 for some environmental plantings and biometric studies). The combined dataset and species encountered during these surveys is summarised in Table 10 and Appendix A.

PRODUCTIVITY AND CARBON SEQUESTRATION FROM REVEGETATION
Report DWLBC 2010/02 Carbon Sequestration from Revegetation: Southern Murray-Darling Basin Region
30
Table 9. Generalised summary of measurement protocols used in 70 surveys of plantation productivity in the Southern Murray-Darling Basin study.
Plantation Size Total Observations (Subsites & Layout) Subsite Location
Block - Single species >4 rows;
>110m long 36
(6x6 plant segments) 6 segments randomly located within inside rows
Block - Mixed species >4 rows;
>110m long 60
(6x10 plant segments) 6 segments randomly located within inside rows
Windbreak - Single species 3 or 4 rows; >110m long
36 (6x6 plant segments)
3 segments inside row; 3 segments edge rows
Windbreak - Mixed species 3 or 4 rows; >110m long
60 (6x10 plant segments)
3 segments inside row; 3 segments edge rows
The average observed planting densities of revegetation sites in our study was 803 trees per hectare (tph, n=37) for Woodlots and 1385 tph for Environmental Plantings (n=57). The overall average of 1156 tph is slightly higher than that 1000 tph assumed by Emes et al. (2006) in their state estimates for hectares of revegetation from nursery plant sales surveys data.
Productivity values for each revegetation site have been were standardised to an annual biomass accumulation rate to account for the different ages of the plant studied. The average annual rainfall (CSIRO Land & Water 2001), BiosEquil (BE) model values (Raupach et al. 2001, Hobbs et al. 2006) and NCAT Forest Productivity Index (DCC 2009) for each sampled locality was extracted from spatial coverages of annual rainfall using ArcGIS (ESRI 2009). NCAT Model Maximum Dry Matter values were extracted from the NCAT data server (DCC 2009) for each site. A summary of site data and observed productivity rates for woodlots, windbreaks and environmental plantings is presented in Table 10. Detailed species breakdowns for mixed species sites are available in Appendix A.

Report D
WLB
C 2010/02
31 C
arbon Sequestration from
Revegetation: S
outhern Murray-D
arling Basin R
egion
PR
OD
UC
TIV
ITY
AN
D C
AR
BO
N S
EQ
UE
ST
RA
TIO
N
Table 10. Plantation growth and carbon sequestration rates from woodlots, windbreaks and environmental plantings observed in the Southern Murray-Darling Basin region.
See Appendix A for detailed breakdowns of Mixed Species plantings Site Detail Field Survey Proportion of Above-
ground Dry Biomass
Species Rai
n [m
m]
NC
AT
Mod
el –
M
ax. D
ry m
atte
r
[t/ha
]
NC
AT
For
est
Pro
duct
ivity
Inde
x
Bio
sEqu
il M
odel
[t
C/h
a/yr
]
Age
TP
H
Sta
nd T
ype
[Blo
ck,
Win
dBre
ak,.R
ando
m/N
atur
al
Obs
erva
tions
#
Hei
ght [
m]
Ste
m V
olum
e
MA
I [m
³/ha
/yr]
Dry
Bio
mas
s
[t/ha
/yr]
Car
bon
[t/
ha/y
r]
CO
2e
[t/ha
/yr]
Ste
mw
ood
Bar
k
Bra
nche
s
Leaf
Woodlots Eucalyptus camaldulensis 362 49.1 4.1 1.7 7.6 142 BL 30 5.7 0.58 0.495 0.25 0.90 0.50 0.15 0.14 0.21 Eucalyptus camaldulensis 376 48.5 4.1 1.6 15.0 995 BL 36 15.5 16.45 8.382 4.16 15.26 0.70 0.11 0.07 0.13 E. camaldulensis/leucoxylon 370 47.2 4.1 1.6 15.0 600 BL 60 6.6 1.68 1.215 0.60 2.21 0.55 0.14 0.12 0.18 E. camald./tricarpa/cladocalyx, +4sp 478 108.2 6.7 2.9 20.9 1376 BL 60 13.0 10.39 6.001 2.98 10.92 0.66 0.12 0.08 0.14 Eucalyptus cladocalyx 339 39.5 3.7 1.2 98.0 281 BL 36 10.7 0.49 0.275 0.14 0.50 0.66 0.12 0.08 0.14 Eucalyptus cladocalyx 460 64.8 4.8 1.7 10.7 440 BL 30 14.9 13.44 6.757 3.35 12.30 0.71 0.10 0.06 0.12 Eucalyptus cladocalyx 460 64.2 4.8 1.7 14.0 778 BL 36 10.2 5.98 3.708 1.84 6.75 0.62 0.13 0.09 0.16 Eucalyptus cladocalyx 460 65.1 4.8 1.7 6.7 793 BL 33 5.6 2.82 2.539 1.26 4.62 0.48 0.16 0.15 0.21 Eucalyptus cladocalyx 465 120.2 7.3 3.0 14.9 502 BL 36 12.1 3.45 2.195 1.09 3.99 0.61 0.13 0.10 0.16 Eucalyptus cladocalyx 557 131.6 7.8 2.6 17.9 2277 BL 36 13.0 15.43 9.126 4.53 16.61 0.64 0.12 0.09 0.15 E. cladocalyx/camaldulensis 478 101.7 6.4 2.9 21.9 1210 BL 36 16.3 9.42 5.316 2.64 9.68 0.66 0.12 0.08 0.14 E. cladocalyx/camaldulensis, +1sp 478 102.2 6.5 2.9 21.9 1257 BL 60 14.6 9.63 5.373 2.67 9.78 0.66 0.12 0.08 0.14 Eucalyptus globulus 460 65.4 4.9 1.7 10.7 898 BL 33 12.5 11.01 6.448 3.20 11.74 0.64 0.12 0.09 0.15 E. grandis/camaldulensis 478 102.2 6.5 2.9 21.9 1600 BL 36 18.9 14.83 8.152 4.04 14.84 0.67 0.11 0.07 0.14 E. largiflorens/cladocalyx 330 39.0 3.7 1.2 98.0 390 BL 60 7.0 0.28 0.189 0.09 0.34 0.58 0.14 0.11 0.17 Eucalyptus leucoxylon 379 54.9 4.4 2.2 32.9 568 BL 36 6.3 1.01 0.717 0.36 1.31 0.56 0.14 0.11 0.18 Eucalyptus leucoxylon 361 43.5 3.9 1.3 99.0 235 BL 36 8.3 0.32 0.188 0.09 0.34 0.64 0.12 0.09 0.15 E. leucoxylon, +3sp 403 117.9 7.2 2.9 33.0 527 BL 60 5.3 0.77 0.727 0.36 1.32 0.56 0.13 0.14 0.18 E. leucoxylon/camaldulensis 315 40.0 3.7 1.3 9.0 384 BL 60 5.7 1.65 1.330 0.66 2.42 0.52 0.15 0.13 0.20 Eucalyptus loxophleba ssp. lissophloia 318 40.1 3.7 1.2 8.0 2094 BL 36 4.8 3.06 5.489 2.72 9.99 0.44 0.10 0.21 0.25 Eucalyptus occidentalis 460 64.2 4.8 1.7 5.7 708 BL 34 9.8 13.54 8.607 4.27 15.67 0.61 0.13 0.09 0.16 E. occidentalis/leucoxylon, +3sp 364 43.1 3.9 1.5 19.0 351 BL 60 9.7 1.74 1.216 0.60 2.21 0.61 0.13 0.10 0.16

Report D
WLB
C 2010/02
32 C
arbon Sequestration from
Revegetation: S
outhern Murray-D
arling Basin R
egion
PR
OD
UC
TIV
ITY
AN
D C
AR
BO
N S
EQ
UE
ST
RA
TIO
N
Site Detail Field Survey Proportion of Above-ground Dry Biomass
Species Rai
n [m
m]
NC
AT
Mod
el –
M
ax. D
ry m
atte
r
[t/ha
]
NC
AT
For
est
Pro
duct
ivity
Inde
x
Bio
sEqu
il M
odel
[t
C/h
a/yr
]
Age
TP
H
Sta
nd T
ype
[Blo
ck,
Win
dBre
ak,.R
ando
m/N
atur
al
Obs
erva
tions
#
Hei
ght [
m]
Ste
m V
olum
e
MA
I [m
³/ha
/yr]
Dry
Bio
mas
s
[t/ha
/yr]
Car
bon
[t/
ha/y
r]
CO
2e
[t/ha
/yr]
Ste
mw
ood
Bar
k
Bra
nche
s
Leaf
Eucalyptus polybractea 318 39.3 3.7 1.2 8.0 1872 BL 36 4.2 4.28 9.096 4.51 16.56 0.49 0.08 0.20 0.23 Eucalyptus salmonophoia 330 39.4 3.7 1.2 95.0 942 BL 36 18.7 2.37 1.259 0.62 2.29 0.69 0.11 0.07 0.13 Eucalyptus viminalis 460 64.8 4.8 1.7 5.7 526 BL 33 10.0 10.83 6.600 3.27 12.01 0.63 0.13 0.09 0.16 Eucalyptus viminalis ssp. cygnetensis 460 64.8 4.8 1.7 9.0 561 BL 36 12.9 13.04 7.103 3.52 12.93 0.68 0.11 0.07 0.14 Windbreaks Acacia myrtifolia 585 129.2 7.7 3.0 8.0 114 WB 6 1.5 0.03 0.135 0.07 0.25 0.43 0.09 0.29 0.19 Allo. verticillata, E. socialis, +7sp 399 49.9 4.2 1.3 15.0 1492 WB 36 4.8 1.99 3.447 1.71 6.28 0.56 0.09 0.18 0.16 Callitris gracilis, E. platypus/dund., +7sp 362 48.7 4.1 1.7 18.9 227 WB 60 7.2 2.92 2.647 1.31 4.82 0.72 0.11 0.09 0.09 Casuarina cunninghamiana, +5sp 465 116.6 7.1 3.0 14.9 675 WB 39 5.4 1.61 2.176 1.08 3.96 0.64 0.11 0.14 0.11 Eucalyptus baxteri 585 130.9 7.7 3.0 8.0 226 WB 6 3.6 0.69 0.835 0.41 1.52 0.52 0.15 0.13 0.20 Eucalyptus camaldulensis 460 65.4 4.9 1.7 10.0 580 WB 36 13.8 31.37 14.142 7.01 25.74 0.75 0.09 0.05 0.10 Eucalyptus camaldulensis 376 50.8 4.2 1.6 7.7 1027 WB 30 9.6 9.78 6.549 3.25 11.92 0.59 0.13 0.10 0.17 Eucalyptus camaldulensis 460 65.4 4.9 1.7 10.7 513 WB 33 11.4 10.62 5.717 2.84 10.41 0.68 0.11 0.07 0.14 E. camald., Cas. cunninghamiana, +1sp 585 115.3 7.0 3.0 14.9 754 WB 60 6.1 1.68 1.529 0.76 2.78 0.58 0.12 0.15 0.15 Eucalyptus cladocalyx 460 71.9 5.1 1.7 6.7 419 WB 30 5.0 1.79 1.558 0.77 2.84 0.49 0.15 0.15 0.21 Eucalyptus cladocalyx 460 68.6 5.0 1.7 6.7 789 WB 30 6.4 4.02 3.378 1.68 6.15 0.50 0.15 0.14 0.20 E. fasciculosa, A. pycnantha/ret., +5sp 465 113.4 7.0 3.0 16.9 636 WB 72 5.7 1.25 1.458 0.72 2.65 0.62 0.11 0.14 0.13 E. fasciculosa, A. retinodes/pycn., +4sp 585 128.7 7.6 3.0 14.9 1372 WB 70 6.1 7.23 5.128 2.54 9.34 0.66 0.11 0.11 0.13 E. fasciculosa, M. lanceolata, +3sp 554 120.4 7.3 2.9 16.9 2959 WB 36 5.7 8.99 6.608 3.28 12.03 0.60 0.12 0.11 0.16 Eucalyptus gomphocephala 460 68.4 5.0 1.7 12.0 334 WB 6 12.4 20.32 8.744 4.34 15.92 0.77 0.09 0.04 0.10 E. gracilis/socialis/incrassata, +7sp 317 46.0 4.0 1.4 16.0 531 WB 60 3.7 1.44 4.228 2.10 7.70 0.66 0.10 0.12 0.12 E. incrassata/leptophylla, +7sp 357 49.9 4.2 1.9 28.9 2801 WB 60 3.9 1.16 2.214 1.10 4.03 0.48 0.08 0.21 0.23 Eucalyptus leucoxylon 339 45.1 4.0 1.6 14.0 405 WB 36 4.6 1.77 2.501 1.24 4.55 0.60 0.10 0.14 0.16 E. leucoxylon, +2sp 557 127.2 7.6 2.6 16.0 620 WB 36 5.4 2.37 1.903 0.94 3.46 0.61 0.13 0.11 0.15 E. leucoxylon/camaldulensis, +1sp 376 48.6 4.1 1.6 24.0 300 WB 36 11.8 7.68 3.463 1.72 6.30 0.77 0.09 0.05 0.09 E. leucoxylon/cladocalyx/tricarpa, +2sp 478 106.5 6.7 2.9 20.9 1134 WB 36 12.4 9.35 6.075 3.01 11.06 0.67 0.11 0.09 0.13 E. leucoxylon/gracilis/incrassata, +10sp 357 46.2 4.0 1.9 28.9 279 WB 60 6.4 1.19 1.457 0.72 2.65 0.67 0.11 0.11 0.12 Eucalyptus occidentalis 460 68.5 5.0 1.7 6.7 603 WB 30 10.2 8.04 5.279 2.62 9.61 0.60 0.13 0.10 0.17

Report D
WLB
C 2010/02
33 C
arbon Sequestration from
Revegetation: S
outhern Murray-D
arling Basin R
egion
PR
OD
UC
TIV
ITY
AN
D C
AR
BO
N S
EQ
UE
ST
RA
TIO
N
Site Detail Field Survey Proportion of Above-ground Dry Biomass
Species Rai
n [m
m]
NC
AT
Mod
el –
M
ax. D
ry m
atte
r
[t/ha
]
NC
AT
For
est
Pro
duct
ivity
Inde
x
Bio
sEqu
il M
odel
[t
C/h
a/yr
]
Age
TP
H
Sta
nd T
ype
[Blo
ck,
Win
dBre
ak,.R
ando
m/N
atur
al
Obs
erva
tions
#
Hei
ght [
m]
Ste
m V
olum
e
MA
I [m
³/ha
/yr]
Dry
Bio
mas
s
[t/ha
/yr]
Car
bon
[t/
ha/y
r]
CO
2e
[t/ha
/yr]
Ste
mw
ood
Bar
k
Bra
nche
s
Leaf
Eucalyptus occidentalis 460 68.6 5.0 1.7 6.7 762 WB 32 8.2 5.57 4.273 2.12 7.78 0.54 0.15 0.12 0.19 Eucalyptus occidentalis 460 68.5 5.0 1.7 6.5 645 WB 6 12.1 12.20 7.557 3.75 13.76 0.62 0.13 0.09 0.16 E. occidentalis/megacornuta, +1sp 460 60.5 4.6 1.7 15.0 756 WB 60 8.4 6.69 3.994 1.98 7.27 0.64 0.12 0.09 0.15 Eucalyptus oleosa 357 49.9 4.2 1.9 28.9 3325 WB 36 5.0 1.41 2.996 1.49 5.45 0.47 0.08 0.21 0.24 E. porosa, Bursaria spinosa, +10sp 317 44.4 3.9 1.4 17.0 1590 WB 60 4.4 6.24 6.739 3.34 12.27 0.63 0.10 0.14 0.13 E. porosa/fasciculosa, Allo. verticill., +8sp 332 84.2 5.7 2.0 17.0 580 WB 61 4.7 0.97 1.118 0.55 2.04 0.56 0.12 0.16 0.17 E. porosa/gracilis/socialis, +3sp 321 43.8 3.9 1.7 14.0 1836 WB 60 4.3 2.58 5.730 2.84 10.43 0.53 0.08 0.19 0.20 E. porosa/leucoxylon, +5sp 339 45.1 4.0 1.6 12.0 447 WB 63 3.5 1.82 2.852 1.41 5.19 0.59 0.09 0.16 0.16 Eucalyptus socialis 357 46.2 4.0 1.9 26.1 444 WB 3 5.6 1.82 3.795 1.88 6.91 0.66 0.10 0.12 0.11 Eucalyptus viminalis ssp. cygnetensis 585 130.9 7.7 3.0 9.0 597 WB 6 7.6 5.80 4.599 2.28 8.37 0.62 0.13 0.09 0.16 Melaleuca armillaris ssp. armillaris 362 51.3 4.2 2.0 11.0 122 WB 6 2.7 0.44 1.063 0.53 1.93 0.71 0.11 0.10 0.08 M. lanceolata, +7sp 375 116.1 7.1 2.2 16.9 807 WB 36 4.8 3.15 4.165 2.07 7.58 0.59 0.11 0.16 0.14 Melaleuca uncinata 357 50.6 4.2 1.9 16.3 585 WB 3 2.3 0.36 0.651 0.32 1.18 0.46 0.09 0.27 0.18 Pittosporum phylliraeoides 357 47.6 4.1 1.9 16.2 460 WB 3 2.5 0.38 0.657 0.33 1.20 0.48 0.09 0.26 0.17 Environmental Plantings Acacia calamifolia 371 50.6 4.2 2.1 6.0 756 RN 6 2.0 1.62 2.810 1.39 5.11 0.48 0.09 0.26 0.17 Acacia hakeoides 371 51.9 4.3 2.1 3.7 752 RN 6 1.3 0.90 2.570 1.27 4.68 0.50 0.10 0.24 0.16 Acacia hakeoides 371 51.6 4.2 2.1 2.0 2226 RN 6 1.2 2.46 5.291 2.62 9.63 0.39 0.08 0.33 0.20 Acacia Iigulata 261 22.9 3.0 1.1 13.8 1111 BL 30 2.7 1.71 2.916 1.45 5.31 0.52 0.10 0.23 0.15 Acacia ligulata 261 22.9 3.0 1.1 13.8 484 BL 3 3.2 1.01 2.073 1.03 3.77 0.53 0.10 0.22 0.15 Acacia montana 371 51.3 4.2 2.1 6.0 738 RN 6 2.1 1.82 3.117 1.55 5.67 0.49 0.10 0.25 0.17 Acacia pycnantha 340 44.9 4.0 1.9 13.8 2778 BL 60 3.7 2.70 5.053 2.51 9.20 0.56 0.09 0.23 0.13 A. pycnantha/microcarpa, +6sp 364 68.8 5.0 2.4 18.0 6736 BL 86 4.0 1.56 3.647 1.81 6.64 0.39 0.07 0.37 0.17 Acacia rigens 357 48.9 4.1 1.9 31.2 197 BL 3 2.8 0.28 0.430 0.21 0.78 0.54 0.11 0.21 0.15 Allo. verticillata, E. leucoxylon, +1sp 403 95.9 6.2 2.9 33.0 310 BL 60 6.0 1.00 1.069 0.53 1.95 0.72 0.11 0.08 0.09 Callitris gracilis, E. camaldulensis, +12sp 335 92.3 6.0 1.7 18.0 1981 BL 60w 8.9 24.43 13.939 6.91 25.37 0.73 0.10 0.07 0.10 Callitris gracilis, E. leucoxylon/por., +6sp 376 109.4 6.8 2.2 31.9 280 BL 60 7.0 1.27 1.385 0.69 2.52 0.70 0.11 0.10 0.10 Callitris verrucosa 357 46.7 4.0 1.9 31.3 140 BL 3 4.6 0.51 0.729 0.36 1.33 0.58 0.11 0.18 0.13

Report D
WLB
C 2010/02
34 C
arbon Sequestration from
Revegetation: S
outhern Murray-D
arling Basin R
egion
PR
OD
UC
TIV
ITY
AN
D C
AR
BO
N S
EQ
UE
ST
RA
TIO
N
Site Detail Field Survey Proportion of Above-ground Dry Biomass
Species Rai
n [m
m]
NC
AT
Mod
el –
M
ax. D
ry m
atte
r
[t/ha
]
NC
AT
For
est
Pro
duct
ivity
Inde
x
Bio
sEqu
il M
odel
[t
C/h
a/yr
]
Age
TP
H
Sta
nd T
ype
[Blo
ck,
Win
dBre
ak,.R
ando
m/N
atur
al
Obs
erva
tions
#
Hei
ght [
m]
Ste
m V
olum
e
MA
I [m
³/ha
/yr]
Dry
Bio
mas
s
[t/ha
/yr]
Car
bon
[t/
ha/y
r]
CO
2e
[t/ha
/yr]
Ste
mw
ood
Bar
k
Bra
nche
s
Leaf
Casuarina cunninghamiana 585 121.8 7.3 3.0 14.9 828 BL 36 6.3 1.59 2.682 1.33 4.88 0.65 0.10 0.15 0.10 Dodonaea viscosa 261 22.9 3.0 1.1 13.8 2251 BL 30 2.6 0.85 1.596 0.79 2.91 0.44 0.09 0.29 0.18 Dodonaea viscosa 261 22.9 3.0 1.1 13.8 633 BL 3 2.9 0.65 1.122 0.56 2.04 0.48 0.09 0.26 0.17 E. camald./largiflorens, A. ligulata, +6sp 387 47.2 4.1 1.4 11.9 1309 BL 60 4.6 3.69 4.579 2.27 8.34 0.55 0.11 0.18 0.15 E. camaldulensis/oleosa, +6sp 387 47.2 4.1 1.4 9.9 1104 BL 60 4.5 2.76 3.591 1.78 6.54 0.54 0.10 0.18 0.19 Eucalyptus cyanophylla 261 22.9 3.0 1.1 13.4 555 BL 30 3.6 1.02 2.042 1.01 3.72 0.52 0.08 0.19 0.21 Eucalyptus diversifolia 460 64.8 4.8 1.7 12.7 1279 RN 3 5.5 5.17 9.333 4.63 16.99 0.58 0.09 0.16 0.17 E. diversifolia/incrassata, +4sp 460 64.8 4.8 1.7 17.0 1119 BL 60 5.5 6.32 9.775 4.85 17.79 0.65 0.10 0.13 0.12 Eucalyptus dumosa 323 46.4 4.0 1.6 30.0 1091 RN 6 4.9 1.36 2.468 1.22 4.49 0.56 0.09 0.17 0.18 Eucalyptus dumosa 387 46.3 4.0 1.4 12.0 836 BL 31 3.8 0.90 1.988 0.99 3.62 0.47 0.07 0.21 0.24 E. fasciculosa, A. retinodes/pycn., +3sp 585 128.7 7.6 3.0 14.9 2010 BL 70 5.8 4.18 3.787 1.88 6.89 0.57 0.12 0.16 0.15 E. fasciculosa/leuco., Allo. vertic., +3sp 546 129.5 7.7 2.8 18.0 1119 BL 60 9.5 10.38 7.350 3.65 13.38 0.71 0.10 0.08 0.11 Eucalyptus gracilis 357 51.9 4.3 1.9 31.2 329 BL 3 10.0 3.35 4.939 2.45 8.99 0.71 0.11 0.10 0.08 Eucalyptus gracilis 261 22.9 3.0 1.1 14.3 554 BL 30 3.4 0.59 1.334 0.66 2.43 0.48 0.07 0.21 0.24 E. gracilis/porosa/incrassata, +7sp 340 46.3 4.0 1.6 15.0 473 BL 60 4.4 1.91 2.549 1.26 4.64 0.59 0.10 0.15 0.16 Eucalyptus incrassata 357 51.9 4.3 1.9 31.2 208 BL 3 5.8 0.65 1.086 0.54 1.98 0.63 0.10 0.14 0.13 Eucalyptus incrassata 374 47.3 4.1 1.5 8.0 1120 BL 30 3.7 1.89 4.273 2.12 7.78 0.46 0.07 0.22 0.25 E. incrassata, Allo. verticillata, +12sp 369 51.3 4.2 1.8 16.0 908 BL 61 3.9 1.52 2.741 1.36 4.99 0.54 0.09 0.19 0.18 E. incrassata/A. ligulata, +8sp 399 49.1 4.1 1.3 15.0 1383 BL 60 3.2 0.97 1.896 0.94 3.45 0.47 0.08 0.24 0.20 Eucalyptus largiflorens 261 22.9 3.0 1.1 14.4 392 BL 30 4.5 0.98 0.797 0.40 1.45 0.52 0.15 0.14 0.20 E. largiflorens, Allo. verticillata, +3sp 322 77.7 5.4 1.8 17.0 1150 BL 60 4.7 1.25 1.271 0.63 2.31 0.48 0.13 0.19 0.19 Eucalyptus leptophylla 261 22.9 3.0 1.1 13.4 1133 BL 30 2.0 0.41 1.213 0.60 2.21 0.37 0.06 0.25 0.32 Eucalyptus leptophylla 357 46.7 4.0 1.9 31.3 153 BL 3 6.6 1.00 1.549 0.77 2.82 0.68 0.10 0.11 0.10 E. leucoxylon, A. ligulata/brachy., +3sp 350 49.6 4.2 1.7 15.9 1471 BL 60 3.9 2.00 2.481 1.23 4.52 0.53 0.12 0.19 0.17 E. leucoxylon, Cal. gracilis, +2sp 379 52.9 4.3 2.2 32.9 230 BL 60 7.8 1.51 1.310 0.65 2.38 0.75 0.12 0.05 0.08 E. leucoxylon, Cal. gracilis, +8sp 379 54.4 4.4 2.2 32.9 242 BL 60 6.0 0.64 0.542 0.27 0.99 0.65 0.11 0.10 0.14 E. leucoxylon, Cal. gracilis, A. ret., +5sp 335 90.2 5.9 1.7 18.0 683 BL 60 9.9 7.01 5.233 2.60 9.53 0.73 0.11 0.07 0.10 E. leucoxylon/largiflorens, +12sp 382 58.4 4.5 2.1 17.0 3441 BL 60 5.9 7.65 6.144 3.05 11.18 0.56 0.13 0.14 0.18
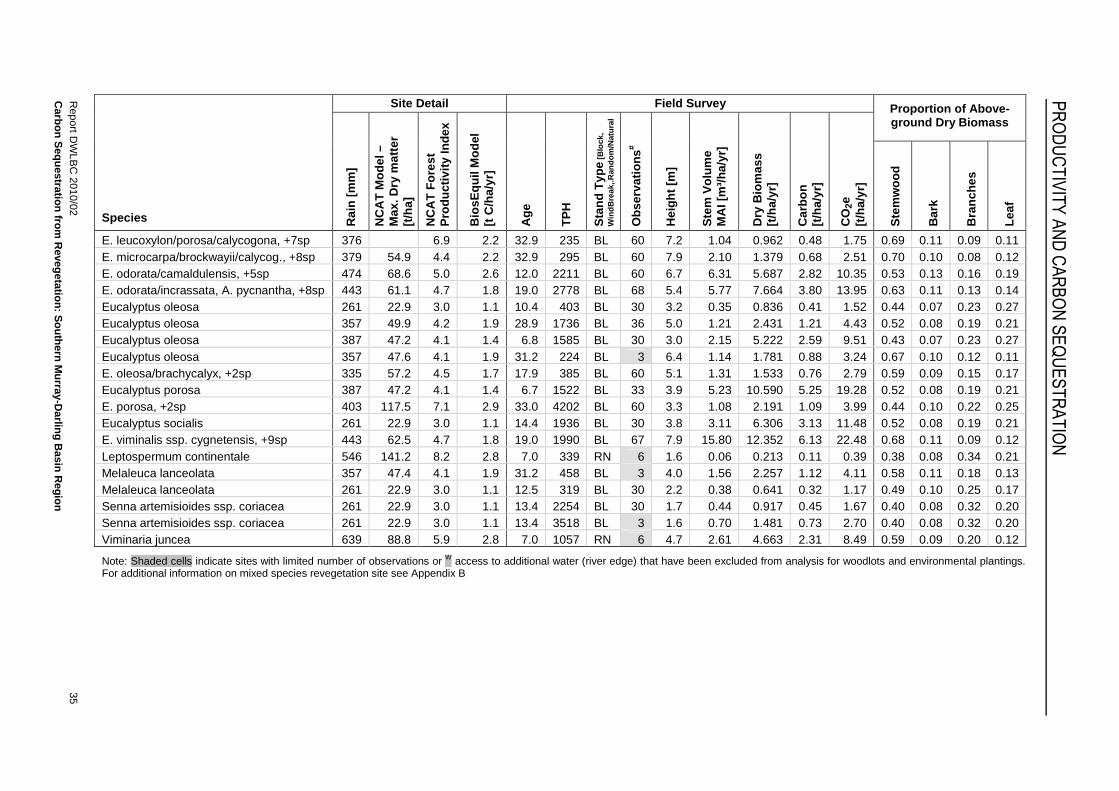
Report D
WLB
C 2010/02
35 C
arbon Sequestration from
Revegetation: S
outhern Murray-D
arling Basin R
egion
PR
OD
UC
TIV
ITY
AN
D C
AR
BO
N S
EQ
UE
ST
RA
TIO
N
Site Detail Field Survey Proportion of Above-ground Dry Biomass
Species Rai
n [m
m]
NC
AT
Mod
el –
M
ax. D
ry m
atte
r
[t/ha
]
NC
AT
For
est
Pro
duct
ivity
Inde
x
Bio
sEqu
il M
odel
[t
C/h
a/yr
]
Age
TP
H
Sta
nd T
ype
[Blo
ck,
Win
dBre
ak,.R
ando
m/N
atur
al
Obs
erva
tions
#
Hei
ght [
m]
Ste
m V
olum
e
MA
I [m
³/ha
/yr]
Dry
Bio
mas
s
[t/ha
/yr]
Car
bon
[t/
ha/y
r]
CO
2e
[t/ha
/yr]
Ste
mw
ood
Bar
k
Bra
nche
s
Leaf
E. leucoxylon/porosa/calycogona, +7sp 376 6.9 2.2 32.9 235 BL 60 7.2 1.04 0.962 0.48 1.75 0.69 0.11 0.09 0.11 E. microcarpa/brockwayii/calycog., +8sp 379 54.9 4.4 2.2 32.9 295 BL 60 7.9 2.10 1.379 0.68 2.51 0.70 0.10 0.08 0.12 E. odorata/camaldulensis, +5sp 474 68.6 5.0 2.6 12.0 2211 BL 60 6.7 6.31 5.687 2.82 10.35 0.53 0.13 0.16 0.19 E. odorata/incrassata, A. pycnantha, +8sp 443 61.1 4.7 1.8 19.0 2778 BL 68 5.4 5.77 7.664 3.80 13.95 0.63 0.11 0.13 0.14 Eucalyptus oleosa 261 22.9 3.0 1.1 10.4 403 BL 30 3.2 0.35 0.836 0.41 1.52 0.44 0.07 0.23 0.27 Eucalyptus oleosa 357 49.9 4.2 1.9 28.9 1736 BL 36 5.0 1.21 2.431 1.21 4.43 0.52 0.08 0.19 0.21 Eucalyptus oleosa 387 47.2 4.1 1.4 6.8 1585 BL 30 3.0 2.15 5.222 2.59 9.51 0.43 0.07 0.23 0.27 Eucalyptus oleosa 357 47.6 4.1 1.9 31.2 224 BL 3 6.4 1.14 1.781 0.88 3.24 0.67 0.10 0.12 0.11 E. oleosa/brachycalyx, +2sp 335 57.2 4.5 1.7 17.9 385 BL 60 5.1 1.31 1.533 0.76 2.79 0.59 0.09 0.15 0.17 Eucalyptus porosa 387 47.2 4.1 1.4 6.7 1522 BL 33 3.9 5.23 10.590 5.25 19.28 0.52 0.08 0.19 0.21 E. porosa, +2sp 403 117.5 7.1 2.9 33.0 4202 BL 60 3.3 1.08 2.191 1.09 3.99 0.44 0.10 0.22 0.25 Eucalyptus socialis 261 22.9 3.0 1.1 14.4 1936 BL 30 3.8 3.11 6.306 3.13 11.48 0.52 0.08 0.19 0.21 E. viminalis ssp. cygnetensis, +9sp 443 62.5 4.7 1.8 19.0 1990 BL 67 7.9 15.80 12.352 6.13 22.48 0.68 0.11 0.09 0.12 Leptospermum continentale 546 141.2 8.2 2.8 7.0 339 RN 6 1.6 0.06 0.213 0.11 0.39 0.38 0.08 0.34 0.21 Melaleuca lanceolata 357 47.4 4.1 1.9 31.2 458 BL 3 4.0 1.56 2.257 1.12 4.11 0.58 0.11 0.18 0.13 Melaleuca lanceolata 261 22.9 3.0 1.1 12.5 319 BL 30 2.2 0.38 0.641 0.32 1.17 0.49 0.10 0.25 0.17 Senna artemisioides ssp. coriacea 261 22.9 3.0 1.1 13.4 2254 BL 30 1.7 0.44 0.917 0.45 1.67 0.40 0.08 0.32 0.20 Senna artemisioides ssp. coriacea 261 22.9 3.0 1.1 13.4 3518 BL 3 1.6 0.70 1.481 0.73 2.70 0.40 0.08 0.32 0.20 Viminaria juncea 639 88.8 5.9 2.8 7.0 1057 RN 6 4.7 2.61 4.663 2.31 8.49 0.59 0.09 0.20 0.12
Note: Shaded cells indicate sites with limited number of observations or W access to additional water (river edge) that have been excluded from analysis for woodlots and environmental plantings. For additional information on mixed species revegetation site see Appendix B

PRODUCTIVITY AND CARBON SEQUESTRATION FROM REVEGETATION
Report DWLBC 2010/02 Carbon Sequestration from Revegetation: Southern Murray-Darling Basin Region
36
4.2 PREDICTING PLANTATION PRODUCTIVITY
For the purpose of creating generalised productivity models the revegetation sites were divided into 2 broad classes based on species selections and designs (see Table 10):
1. Woodlots - Blocks and windbreaks containing monocultures (or a few species) of typical woodlot species, including Sugar gum (Eucalyptus cladocalyx), River red gum (E. camaldulensis), SA Blue gum (E. leucoxylon) and productive mallees (E. loxophleba & E. polybractea).
2. Environmental Plantings - Blocks and windbreaks containing predominately mixtures of native species for biodiverse/habitat plantings or non-woodlot species intended for other environmental services.
The significant differences in production rates from these 2 classes are clearly illustrated in Figure 13 and Figure 14.
Although the contrary was expected due to general planting recommendations for the region, statistical tests between average annual rainfall and planting density revealed no significant auto-correlation. This permitted valid evaluations of planting density interactions with rainfall, NCAT Forest Productivity Index and BiosEquil models. Planting density (trees per hectare, tph) and average annual rainfall have the greatest influence on the productivity in woodlots and environmental plants in our study area (see Table 11, Figure 13, Figure 14). In higher rainfall regions outside of our study area, where water is a less limiting factor, soil fertility is reported to have a significant influence on plantation growth. This soil fertility principle is evident in NCAT Forest Productivity Index (FPI) model coverages across Australia which shows significant variations in productivity based on soil types (Landsberg & Kesteven 2001, see Figure 20b).
Analysis of plantation/revegetation growth rates in the study region revealed no statistically significant soil type or fertility influences on productivity. NCAT Forest Productivity Index (which underpins the NCAT FullCAM model) was found to be the weakest predictor of plantation/revegetation productivity, and after factoring different stocking rates only accounted for 0 – 2 % of model variation. After stocking rates, average annual rainfall was found to account for the greatest variations in site productivity, especially for woodlots (+7%). BiosEquil model values (also strongly influenced by climate parameters) provide a similar level of predictive capacity as rainfall based models, especially for environmental plantings (+6%). In this study, woodlots appear to be less influenced by soil conditions than environmental plantings.

PRODUCTIVITY AND CARBON SEQUESTRATION FROM REVEGETATION
Report DWLBC 2010/02 Carbon Sequestration from Revegetation: Southern Murray-Darling Basin Region
37
Table 11. Relationships between mean annual rainfall, NCAT Forest Productivity Index, BiosEquil model predictions and observed productivity in the Murray-Darling Basin region.
Productivity by Plantation Type (y)
Predictor Variable (x)
Model Fit [ r2] Formula
Mean Annual Increment (MAI) Stemwood Volume [m³/ha/yr]
Woodlot Mean Annual Rainfall (R) [mm/yr] 0.39 y = 1.96E-12 x R4.6990
(n = 37) NCAT Forest Productivity Index (FPI) 0.15 y = 0.1615 x FPI2.0155
BiosEquil (BE) [t C/ha/yr] 0.20 y = 0.4723 x BE3.4878
Trees Per Hectare [TPH] 0.36 y = 0.00234 x TPH1.1406
R x TPH 0.47 y = 1.64E-06 x (Rx TPH)1.1718
FPI x TPH 0.39 y = 0.00127 x (FPI x TPH)0.9928
BE x TPH 0.41 y = 0.00164 x (BE x TPH)1.0929
Env. Planting Mean Annual Rainfall (R) [mm/yr] 0.31 y = 6.90E-06 x R2.1197
(n =57) NCAT Forest Productivity Index (FPI) 0.17 y = 0.3017 x FPI1.2161
BiosEquil (BE) [t C/ha/yr] 0.28 y = 0.7661 x BE1.8559
Trees Per Hectare [TPH] 0.13 y = 0.1374 x TPH0.3824
R x TPH 0.24 y = 0.00492 x (Rx TPH)0.4660
FPI x TPH 0.24 y = 0.0381 x (FPI x TPH)0.4662
BE x TPH 0.24 y = 0.0607 x (BE x TPH)0.4677
Carbon Sequestration Rate [t CO 2-e/ha/yr]
Woodlot Mean Annual Rainfall (R) [mm/yr] 0.29 y = 5.19E-10 x R3.8174
(n = 37) NCAT Forest Productivity Index (FPI) 0.13 y = 0.3116 x FPI1.7672
BiosEquil (BE) [t C/ha/yr] 0.15 y = 0.9206 x BE2.8227
Trees Per Hectare [TPH] 0.48 y = 0.00169 x TPH1.2308
Rainfall x TPH 0.55 y = 1.49E-06 x (Rx TPH)1.2003
FPI x TPH 0.48 y = 0.00120 x (FPI x TPH)1.0328
BE x TPH 0.50 y = 0.00159 x (BE x TPH)1.1347
Env. Planting Mean Annual Rainfall (R) [mm/yr] 0.14 y = 0.00382 x R1.2082
(n =57) NCAT Forest Productivity Index (FPI) 0.03ns y = 2.4893 x FPI0.4366
BiosEquil (BE) [t C/ha/yr] 0.11 y = 2.9435 x BE1.0054
Trees Per Hectare [TPH] 0.35 y = 0.1316 x TPH0.5235
Rainfall x TPH 0.41 y = 0.00548 x (Rx TPH)0.5300
FPI x TPH 0.37 y = 0.0689 x (FPI x TPH)0.5059
BE x TPH 0.41 y = 0.0991 x (BE x TPH)0.5271 ns
not statistically significant, trend formula only.

PRODUCTIVITY AND CARBON SEQUESTRATION FROM REVEGETATION
Report DWLBC 2010/02 Carbon Sequestration from Revegetation: Southern Murray-Darling Basin Region
38
Stemwood Productivity
a) Stemwood Production Rates versus Annual Rainfall
y = 2E-12x 4.699
R2 = 0.39
y = 7E-06x 2.1197
R2 = 0.31
0
5
10
15
20
200 250 300 350 400 450 500 550 600 650 700Annual Rainfall [mm/yr]
MA
I Ste
mw
ood
Vol
ume
[m³/
ha/y
r]
Woodlot
Env. Planting
Windbreak
Woodlot
Env. Planting
b) Stemwood Production Rates versus NCAT Forest Productivity Index
y = 0.1615x 2.0155
R2 = 0.15
y = 0.3017x 1.2161
R2 = 0.17
0
5
10
15
20
2 3 4 5 6 7 8 9Forest Productivity Index [FPI]
MA
I Ste
mw
ood
Vol
ume
[m³/
ha/y
r]
Woodlot
Env. Planting
Windbreak
Woodlot
Env. Planting
Figure 13. Relationships between primary productivity drivers and stemwood production rates from woodlot, windbreak and environmental plantings.
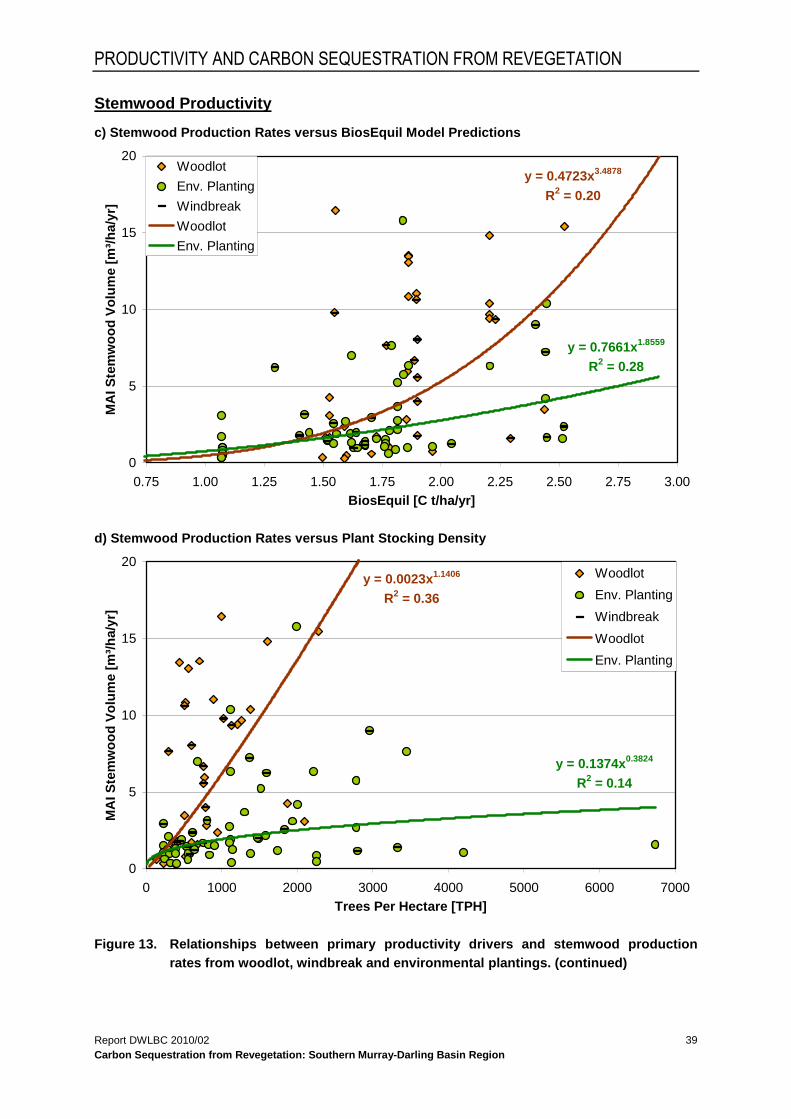
PRODUCTIVITY AND CARBON SEQUESTRATION FROM REVEGETATION
Report DWLBC 2010/02 Carbon Sequestration from Revegetation: Southern Murray-Darling Basin Region
39
Stemwood Productivity
c) Stemwood Production Rates versus BiosEquil Model Predictions
y = 0.4723x3.4878
R2 = 0.20
y = 0.7661x 1.8559
R2 = 0.28
0
5
10
15
20
0.75 1.00 1.25 1.50 1.75 2.00 2.25 2.50 2.75 3.00BiosEquil [C t/ha/yr]
MA
I Ste
mw
ood
Vol
ume
[m³/
ha/y
r]
Woodlot
Env. Planting
Windbreak
Woodlot
Env. Planting
d) Stemwood Production Rates versus Plant Stocking Density
y = 0.0023x1.1406
R2 = 0.36
y = 0.1374x0.3824
R2 = 0.14
0
5
10
15
20
0 1000 2000 3000 4000 5000 6000 7000Trees Per Hectare [TPH]
MA
I Ste
mw
ood
Vol
ume
[m³/
ha/y
r]
Woodlot
Env. Planting
Windbreak
Woodlot
Env. Planting
Figure 13. Relationships between primary productivity drivers and stemwood production rates from woodlot, windbreak and environmental plantings. (continued)

PRODUCTIVITY AND CARBON SEQUESTRATION FROM REVEGETATION
Report DWLBC 2010/02 Carbon Sequestration from Revegetation: Southern Murray-Darling Basin Region
40
Stemwood Productivity
e) Stemwood Production Rates versus Annual Rainfall x Plant Stocking Density
y = 2E-06x1.1718
R2 = 0.47
y = 0.0049x0.466
R2 = 0.24
0
5
10
15
20
0 500000 1000000 1500000 2000000 2500000Annual Rainfall [mm/yr] x Trees Per Hectares [TPH]
MA
I Ste
mw
ood
Vol
ume
[m³/
ha/y
r]
Woodlot
Env. Planting
Windbreak
Woodlot
Env. Planting
f) Stemwood Production Rates versus Forest Productivity Index x Plant Stocking Density
y = 0.0013x0.9928
R2 = 0.39
y = 0.0381x0.4662
R2 = 0.24
0
5
10
15
20
0 5000 10000 15000 20000 25000 30000 35000Forest Productivity Index [FPI] x Trees Per Hectares [TPH]
MA
I Ste
mw
ood
Vol
ume
[m³/
ha/y
r]
Woodlot
Env. Planting
Windbreak
Woodlot
Env. Planting
Figure 13. Relationships between primary productivity drivers and stemwood production rates from woodlot, windbreak and environmental plantings. (continued)

PRODUCTIVITY AND CARBON SEQUESTRATION FROM REVEGETATION
Report DWLBC 2010/02 Carbon Sequestration from Revegetation: Southern Murray-Darling Basin Region
41
Stemwood Productivity
g) Stemwood Production Rates versus BiosEquil Model Predictions x Plant Stocking Density
y = 0.0016x1.0929
R2 = 0.41
y = 0.0607x0.4677
R2 = 0.24
0
5
10
15
20
0 2000 4000 6000 8000 10000 12000BiosEquil [C t/ha/yr] x Trees Per Hectares [TPH]
MA
I Ste
mw
ood
Vol
ume
[m³/
ha/y
r]
Woodlot
Env. Planting
Windbreak
Woodlot
Env. Planting
Figure 13. Relationships between primary productivity drivers and stemwood production rates from woodlot, windbreak and environmental plantings. (continued)

PRODUCTIVITY AND CARBON SEQUESTRATION FROM REVEGETATION
Report DWLBC 2010/02 Carbon Sequestration from Revegetation: Southern Murray-Darling Basin Region
42
Carbon Sequestration
a) Carbon Sequestration Rates versus Annual Rainfall
y = 5E-10x 3.8174
R2 = 0.29
y = 0.0038x 1.2082
R2 = 0.14
0
5
10
15
20
25
200 250 300 350 400 450 500 550 600 650 700Annual Rainfall [mm/yr]
Car
bon
Seq
uest
ratio
n [t
CO
2-e/
ha/y
r]
Woodlot
Env. Planting
Windbreak
Woodlot
Env. Planting
b) Carbon Sequestration Rates versus NCAT Forest Productivity Index
y = 0.3116x1.7672
R2 = 0.13
y = 2.4893x0.4366
R2 = 0.03
0
5
10
15
20
25
2 3 4 5 6 7 8 9Forest Productivity Index [FPI]
Car
bon
Seq
uest
ratio
n [t
CO
2-e/
ha/y
r]
Woodlot
Env. Planting
Windbreak
Woodlot
Env. Planting
Figure 14. Relationships between primary productivity drivers and carbon sequestration rates from woodlot, windbreak and environmental plantings.

PRODUCTIVITY AND CARBON SEQUESTRATION FROM REVEGETATION
Report DWLBC 2010/02 Carbon Sequestration from Revegetation: Southern Murray-Darling Basin Region
43
Carbon Sequestration
c) Carbon Sequestration Rates versus BiosEquil Model Predictions
y = 0.9206x 2.8227
R2 = 0.15
y = 2.9435x 1.0054
R2 = 0.11
0
5
10
15
20
25
0.75 1.00 1.25 1.50 1.75 2.00 2.25 2.50 2.75 3.00BiosEquil [C t/ha/yr]
Car
bon
Seq
uest
ratio
n [t
CO
2-e/
ha/y
r]
Woodlot
Env. Planting
Windbreak
Woodlot
Env. Planting
d) Carbon Sequestration Rates versus Plant Stocking Density
y = 0.0017x1.2308
R2 = 0.48
y = 0.1316x0.5235
R2 = 0.35
0
5
10
15
20
25
0 1000 2000 3000 4000 5000 6000 7000Trees Per Hectare [TPH]
Car
bon
Seq
uest
ratio
n [t
CO
2-e/
ha/y
r]
Woodlot
Env. Planting
Windbreak
Woodlot
Env. Planting
Figure 14. Relationships between primary productivity drivers and carbon sequestration rates from woodlot, windbreak and environmental plantings. (continued)

PRODUCTIVITY AND CARBON SEQUESTRATION FROM REVEGETATION
Report DWLBC 2010/02 Carbon Sequestration from Revegetation: Southern Murray-Darling Basin Region
44
Carbon Sequestration
e) Carbon Sequestration Rates versus Annual Rainfall x Plant Stocking Density
y = 1E-06x 1.2003
R2 = 0.55
y = 0.0055x0.53
R2 = 0.41
0
5
10
15
20
25
0 500000 1000000 1500000 2000000 2500000Annual Rainfall [mm/yr] x Trees Per Hectares [TPH]
Car
bon
Seq
uest
ratio
n [t
CO
2-e/
ha/y
r]
Woodlot
Env. Planting
Windbreak
Woodlot
Env. Planting
f) Carbon Sequestration Rates versus Forest Productivity Index x Plant Stocking Density
y = 0.0012x1.0328
R2 = 0.48
y = 0.0689x0.5059
R2 = 0.37
0
5
10
15
20
25
0 5000 10000 15000 20000 25000 30000 35000Forest Productivity Index [FPI] x Trees Per Hectares [TPH]
Car
bon
Seq
uest
ratio
n [t
CO
2-e/
ha/y
r]
Woodlot
Env. Planting
Windbreak
Woodlot
Env. Planting
Figure 14. Relationships between primary productivity drivers and carbon sequestration rates from woodlot, windbreak and environmental plantings. (continued)
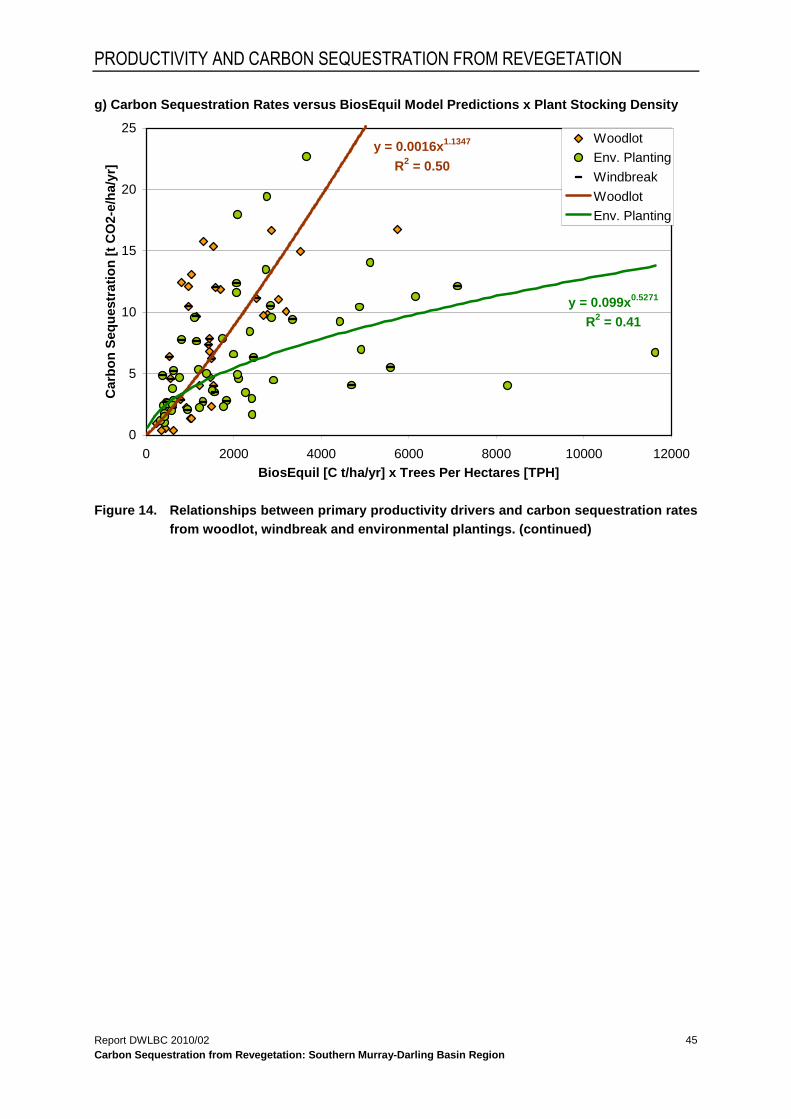
PRODUCTIVITY AND CARBON SEQUESTRATION FROM REVEGETATION
Report DWLBC 2010/02 Carbon Sequestration from Revegetation: Southern Murray-Darling Basin Region
45
g) Carbon Sequestration Rates versus BiosEquil Model Predictions x Plant Stocking Density
y = 0.0016x1.1347
R2 = 0.50
y = 0.099x 0.5271
R2 = 0.41
0
5
10
15
20
25
0 2000 4000 6000 8000 10000 12000BiosEquil [C t/ha/yr] x Trees Per Hectares [TPH]
Car
bon
Seq
uest
ratio
n [t
CO
2-e/
ha/y
r]
Woodlot
Env. Planting
Windbreak
Woodlot
Env. Planting
Figure 14. Relationships between primary productivity drivers and carbon sequestration rates from woodlot, windbreak and environmental plantings. (continued)

PRODUCTIVITY AND CARBON SEQUESTRATION FROM REVEGETATION
Report DWLBC 2010/02 Carbon Sequestration from Revegetation: Southern Murray-Darling Basin Region
46
4.3 REVIEW OF NCAT FULLCAM MODEL PREDICTIONS
To take advantage of any emissions trading scheme, industry needs to be confident of the amount of carbon stored in any plantations it uses to offset emissions. Although several carbon accounting and growth models exist (e.g. FullCAM, CABALA, 3-PG, BiosEquil) the National Carbon Accounting Toolbox (NCAT) is currently the preferred package for the anticipated Carbon Pollution Reduction Scheme and the federal Department of Climate Change. NCAT uses the Full Carbon Accounting Model (FullCAM) and modified 3-PG models (Landsberg & Waring 1997) to predict time series data on plantation growth and carbon balances and sequestration rates. NCAT FullCAM Version 3.1 software allows users to calculate estimates of carbon balances under a range of landuse scenarios. The toolbox also contains a range of technical reports relevant to carbon accounting in Australia.
Public users can readily attain this NCAT software from the federal Department of Climate Change (http://www.climatechange.gov.au) and use default parameter settings to create site specific predictions of growth and carbon sequestration rates from limited range of standard planting types by entering only location and planting date parameters. Within the NCAT many site and plantation model parameter can be user-modified to refine predictions. The complex NCAT FullCAM model contains many parameters that are unfamiliar to most users and many more parameters that require detailed site and plantation specific measurements to populate model parameter sets.
Most users will rely on default settings within the NCAT models due to the lack of alternative information available or their comprehension level of NCAT model complexity. The following analyses provide an evaluation of the level of concurrence between default NCAT model predictions and observed plantation productivity data for the Southern Murray-Darling Basin region.
4.3.1 NCAT FULLCAM MODEL
The FullCAM Version 3.1 software has a number of default model parameter sets for a range of predominantly forestry species and systems suited to medium to higher rainfall zone. Users may select one of the forestry systems and apply predictive models to their specific location of interest. Alternatively, users may enter their own species and site parameter sets and run FullCAM simulations of carbon balances (see Appendix C for details). Many of the site variables are able to be changed by entering the user’s own data into spreadsheets located via buttons on the various windows and sub windows. Rainfall, temperature and pan evaporation are able to be changed in this way if better quality data is available for a specific site. However, soil is restricted to a small range of types listed for each location, and while minor soil adjustments are possible, the basic characteristics remain.
While site data may be broadly applicable over larger areas, vegetation data is more variable, being dependant on the species selected. The range of background default values for species other than Pinus radiata and Eucalyptus globulus are very generalised, and in the case of mixed environmental plantings, appear very similar to E. globulus. But, where as E. globulus has a range of wood densities that vary with age, mixed environmental plantings are allocated a single wood density of 750 kilograms of dry matter per square metre regardless of age or species mix. Wood densities can vary from location to location, plant to plant and with age. Density data from a range of species destructively sampled during this study and
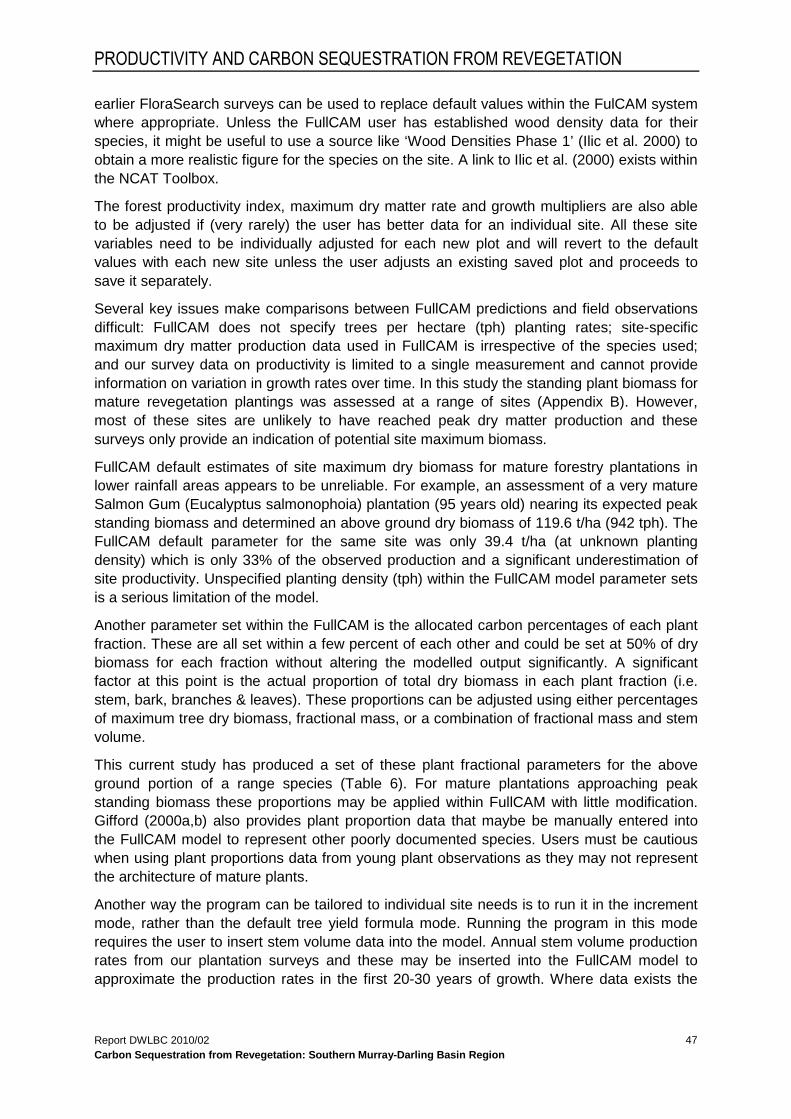
PRODUCTIVITY AND CARBON SEQUESTRATION FROM REVEGETATION
Report DWLBC 2010/02 Carbon Sequestration from Revegetation: Southern Murray-Darling Basin Region
47
earlier FloraSearch surveys can be used to replace default values within the FulCAM system where appropriate. Unless the FullCAM user has established wood density data for their species, it might be useful to use a source like ‘Wood Densities Phase 1’ (Ilic et al. 2000) to obtain a more realistic figure for the species on the site. A link to Ilic et al. (2000) exists within the NCAT Toolbox.
The forest productivity index, maximum dry matter rate and growth multipliers are also able to be adjusted if (very rarely) the user has better data for an individual site. All these site variables need to be individually adjusted for each new plot and will revert to the default values with each new site unless the user adjusts an existing saved plot and proceeds to save it separately.
Several key issues make comparisons between FullCAM predictions and field observations difficult: FullCAM does not specify trees per hectare (tph) planting rates; site-specific maximum dry matter production data used in FullCAM is irrespective of the species used; and our survey data on productivity is limited to a single measurement and cannot provide information on variation in growth rates over time. In this study the standing plant biomass for mature revegetation plantings was assessed at a range of sites (Appendix B). However, most of these sites are unlikely to have reached peak dry matter production and these surveys only provide an indication of potential site maximum biomass.
FullCAM default estimates of site maximum dry biomass for mature forestry plantations in lower rainfall areas appears to be unreliable. For example, an assessment of a very mature Salmon Gum (Eucalyptus salmonophoia) plantation (95 years old) nearing its expected peak standing biomass and determined an above ground dry biomass of 119.6 t/ha (942 tph). The FullCAM default parameter for the same site was only 39.4 t/ha (at unknown planting density) which is only 33% of the observed production and a significant underestimation of site productivity. Unspecified planting density (tph) within the FullCAM model parameter sets is a serious limitation of the model.
Another parameter set within the FullCAM is the allocated carbon percentages of each plant fraction. These are all set within a few percent of each other and could be set at 50% of dry biomass for each fraction without altering the modelled output significantly. A significant factor at this point is the actual proportion of total dry biomass in each plant fraction (i.e. stem, bark, branches & leaves). These proportions can be adjusted using either percentages of maximum tree dry biomass, fractional mass, or a combination of fractional mass and stem volume.
This current study has produced a set of these plant fractional parameters for the above ground portion of a range species (Table 6). For mature plantations approaching peak standing biomass these proportions may be applied within FullCAM with little modification. Gifford (2000a,b) also provides plant proportion data that maybe be manually entered into the FullCAM model to represent other poorly documented species. Users must be cautious when using plant proportions data from young plant observations as they may not represent the architecture of mature plants.
Another way the program can be tailored to individual site needs is to run it in the increment mode, rather than the default tree yield formula mode. Running the program in this mode requires the user to insert stem volume data into the model. Annual stem volume production rates from our plantation surveys and these may be inserted into the FullCAM model to approximate the production rates in the first 20-30 years of growth. Where data exists the
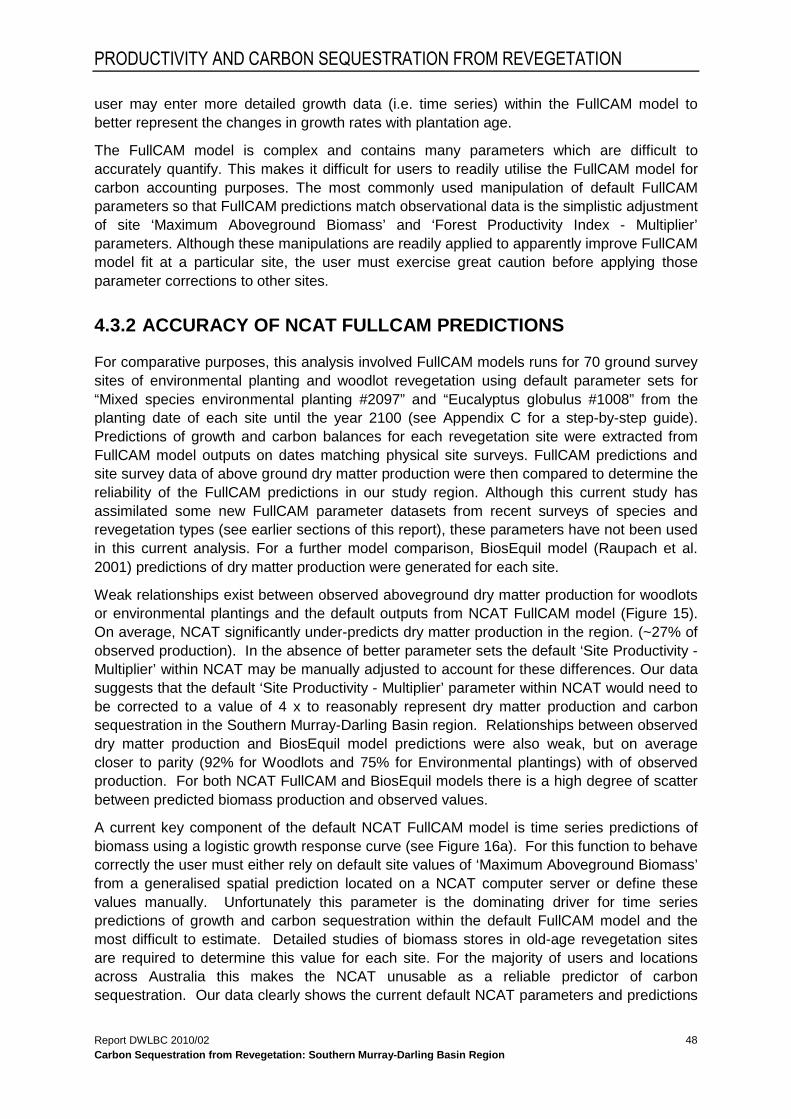
PRODUCTIVITY AND CARBON SEQUESTRATION FROM REVEGETATION
Report DWLBC 2010/02 Carbon Sequestration from Revegetation: Southern Murray-Darling Basin Region
48
user may enter more detailed growth data (i.e. time series) within the FullCAM model to better represent the changes in growth rates with plantation age.
The FullCAM model is complex and contains many parameters which are difficult to accurately quantify. This makes it difficult for users to readily utilise the FullCAM model for carbon accounting purposes. The most commonly used manipulation of default FullCAM parameters so that FullCAM predictions match observational data is the simplistic adjustment of site ‘Maximum Aboveground Biomass’ and ‘Forest Productivity Index - Multiplier’ parameters. Although these manipulations are readily applied to apparently improve FullCAM model fit at a particular site, the user must exercise great caution before applying those parameter corrections to other sites.
4.3.2 ACCURACY OF NCAT FULLCAM PREDICTIONS
For comparative purposes, this analysis involved FullCAM models runs for 70 ground survey sites of environmental planting and woodlot revegetation using default parameter sets for “Mixed species environmental planting #2097” and “Eucalyptus globulus #1008” from the planting date of each site until the year 2100 (see Appendix C for a step-by-step guide). Predictions of growth and carbon balances for each revegetation site were extracted from FullCAM model outputs on dates matching physical site surveys. FullCAM predictions and site survey data of above ground dry matter production were then compared to determine the reliability of the FullCAM predictions in our study region. Although this current study has assimilated some new FullCAM parameter datasets from recent surveys of species and revegetation types (see earlier sections of this report), these parameters have not been used in this current analysis. For a further model comparison, BiosEquil model (Raupach et al. 2001) predictions of dry matter production were generated for each site.
Weak relationships exist between observed aboveground dry matter production for woodlots or environmental plantings and the default outputs from NCAT FullCAM model (Figure 15). On average, NCAT significantly under-predicts dry matter production in the region. (~27% of observed production). In the absence of better parameter sets the default ‘Site Productivity - Multiplier’ within NCAT may be manually adjusted to account for these differences. Our data suggests that the default ‘Site Productivity - Multiplier’ parameter within NCAT would need to be corrected to a value of 4 x to reasonably represent dry matter production and carbon sequestration in the Southern Murray-Darling Basin region. Relationships between observed dry matter production and BiosEquil model predictions were also weak, but on average closer to parity (92% for Woodlots and 75% for Environmental plantings) with of observed production. For both NCAT FullCAM and BiosEquil models there is a high degree of scatter between predicted biomass production and observed values.
A current key component of the default NCAT FullCAM model is time series predictions of biomass using a logistic growth response curve (see Figure 16a). For this function to behave correctly the user must either rely on default site values of ‘Maximum Aboveground Biomass’ from a generalised spatial prediction located on a NCAT computer server or define these values manually. Unfortunately this parameter is the dominating driver for time series predictions of growth and carbon sequestration within the default FullCAM model and the most difficult to estimate. Detailed studies of biomass stores in old-age revegetation sites are required to determine this value for each site. For the majority of users and locations across Australia this makes the NCAT unusable as a reliable predictor of carbon sequestration. Our data clearly shows the current default NCAT parameters and predictions
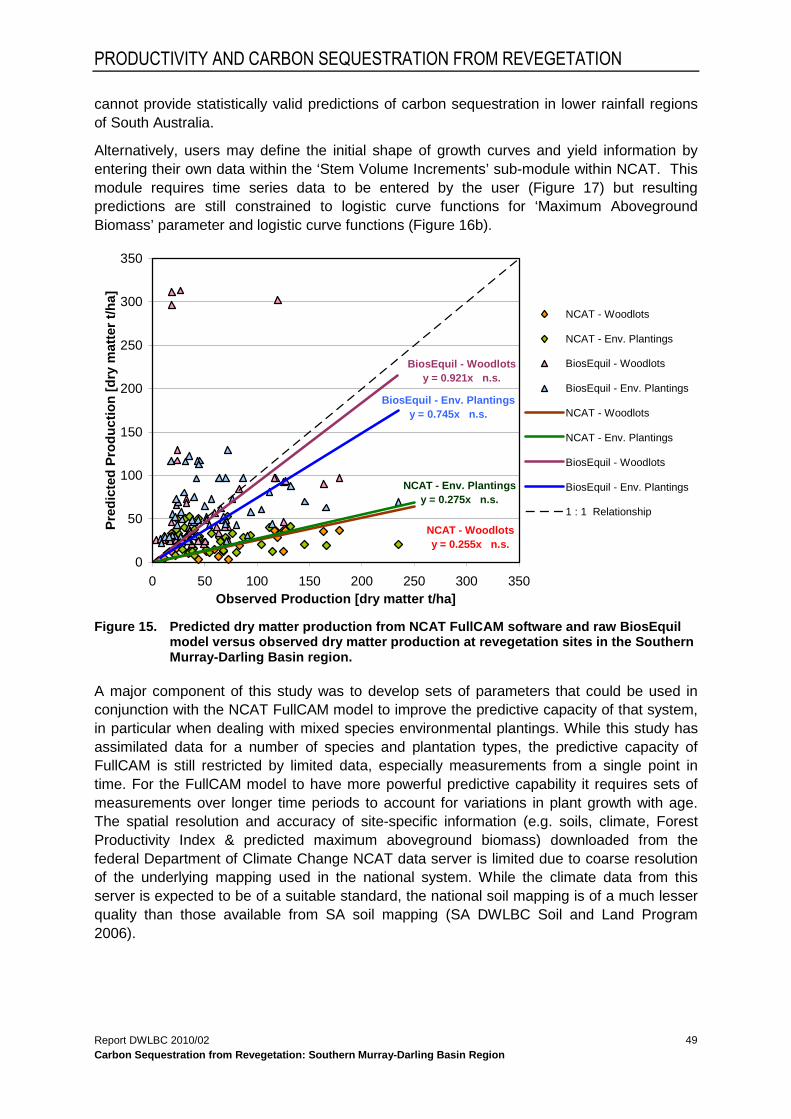
PRODUCTIVITY AND CARBON SEQUESTRATION FROM REVEGETATION
Report DWLBC 2010/02 Carbon Sequestration from Revegetation: Southern Murray-Darling Basin Region
49
cannot provide statistically valid predictions of carbon sequestration in lower rainfall regions of South Australia.
Alternatively, users may define the initial shape of growth curves and yield information by entering their own data within the ‘Stem Volume Increments’ sub-module within NCAT. This module requires time series data to be entered by the user (Figure 17) but resulting predictions are still constrained to logistic curve functions for ‘Maximum Aboveground Biomass’ parameter and logistic curve functions (Figure 16b).
NCAT - Woodlotsy = 0.255x n.s.
NCAT - Env. Plantingsy = 0.275x n.s.
BiosEquil - Woodlotsy = 0.921x n.s.
BiosEquil - Env. Plantingsy = 0.745x n.s.
0
50
100
150
200
250
300
350
0 50 100 150 200 250 300 350Observed Production [dry matter t/ha]
Pre
dict
ed P
rodu
ctio
n [d
ry m
atte
r t/h
a] NCAT - Woodlots
NCAT - Env. Plantings
BiosEquil - Woodlots
BiosEquil - Env. Plantings
NCAT - Woodlots
NCAT - Env. Plantings
BiosEquil - Woodlots
BiosEquil - Env. Plantings
1 : 1 Relationship
Figure 15. Predicted dry matter production from NCAT FullCAM software and raw BiosEquil
model versus observed dry matter production at revegetation sites in the Southern Murray-Darling Basin region.
A major component of this study was to develop sets of parameters that could be used in conjunction with the NCAT FullCAM model to improve the predictive capacity of that system, in particular when dealing with mixed species environmental plantings. While this study has assimilated data for a number of species and plantation types, the predictive capacity of FullCAM is still restricted by limited data, especially measurements from a single point in time. For the FullCAM model to have more powerful predictive capability it requires sets of measurements over longer time periods to account for variations in plant growth with age. The spatial resolution and accuracy of site-specific information (e.g. soils, climate, Forest Productivity Index & predicted maximum aboveground biomass) downloaded from the federal Department of Climate Change NCAT data server is limited due to coarse resolution of the underlying mapping used in the national system. While the climate data from this server is expected to be of a suitable standard, the national soil mapping is of a much lesser quality than those available from SA soil mapping (SA DWLBC Soil and Land Program 2006).

PRODUCTIVITY AND CARBON SEQUESTRATION FROM REVEGETATION
Report DWLBC 2010/02 Carbon Sequestration from Revegetation: Southern Murray-Darling Basin Region
50
a) Default “Tree Production – Tree yield formula” model
b) Default “Tree Production – Increments” model with user-defined “Stemwood volume increments”
Mixed Environmental Planting - Eucalyptus microcarpa/brockwayii/calycogona +8sp
Figure 16. NCAT FullCAM predicted carbon sequestration for the Monarto revegetation site using: a) default tree yield formulas; and b) user-defined tree stemwood increments.

PRODUCTIVITY AND CARBON SEQUESTRATION FROM REVEGETATION
Report DWLBC 2010/02 Carbon Sequestration from Revegetation: Southern Murray-Darling Basin Region
51
Figure 17. User-defined Stem Wood Increments parameters of the NCAT FullCAM model.
4.4 REGIONAL CARBON SEQUESTRATION RATES
Prior agroforestry and woody crop research in the Upper South East region of SA (Hobbs et al. 2006) has demonstrated that significant improvements in woodlot species productivity can be made from more precise matching of species to local site conditions. However, this current study aims to reasonably represent average productivity values for the region by not separating out the most productive sites and species within these analyses. The results presented in following section are likely to provide conservative estimates of potential production rates for the region.
Optimum stocking rates will vary depending on species selections for local conditions, targeted purposes of each plantation/revegetation type and the expected lifespan of revegetation project. Local expertise and planning is required to more precisely define set stocking rates. As a generalisation for the Southern Murray-Darling Basin, we largely concur with locally observed stocking rates (800 tph for woodlots, 1400 for environmental plants) but suggest an optimum stocking rate may be around 20% higher than these observed rates. Higher initial stocking rates should be anticipated for projects with longer life spans to account for natural mortality rates with age.
Productivity models identified in the previously section have been applied to spatial datasets within a geographic information system (ArcGIS 9.3, ESRI 2009) to estimate likely carbon sequestration rates from revegetation in the Southern Murray-Darling Basin region (Figure 18) at a 1 hectare resolution . Figure 19 provides estimated annual carbon sequestration rates for woodlots and environmental plantings based on district average stocking rates for each planting type (Woodlots at 800tph, Environmental Plantings at 1400tph) using BiosEquil model productivity surfaces for SA. Using a standardised plant stocking rate of 1000 tph, the potential differences in the spatial patterns of productivity has been mapped (Figure 20)
PRODUCTIVITY AND CARBON SEQUESTRATION FROM REVEGETATION
Report DWLBC 2010/02 Carbon Sequestration from Revegetation: Southern Murray-Darling Basin Region
52
using 1/ rainfall, 2/ NCAT Forest Productivity Index and 3/ BiosEquil model predictions. These maps also illustrate that significantly more carbon can be sequestered using woodlots species compared to environmental planting if stocking rates are uniform. However, when higher stocking rates are used in environmental plantings there is less difference between carbon sequestration rates between the revegetation types (Figure 19).
Spatial predictions of carbon sequestration rates from woodlots and environmental plantings have been restricted to cleared agricultural areas by masking out locations mapped by SA Department of Environment and Heritage as containing native vegetation, national parks and other conservation reserves, lakes and rivers, and built-up areas of town and cities. The nominated available land is typically dominated by cereal cropping and livestock grazing on cleared landscapes, but also includes other agricultural crops. Summary regional statistics (Figure 18) of expected annual carbon sequestration rates for environmental subregions (Interim Biogeographic Regions of Australia [IBRA]) are presented in Table 12 and more localised district (SA land administration Hundred districts) are presented in Table 13.
Figure 18. Environmental and administrative regions within the study area.

PRODUCTIVITY AND CARBON SEQUESTRATION FROM REVEGETATION
Report DWLBC 2010/02 Carbon Sequestration from Revegetation: Southern Murray-Darling Basin Region
53
Figure 19. Estimated carbon sequestration rates from a) Woodlot and b) Environmental Planting revegetation types, based on local average planting densities (tree per hectare) by type, in the Southern Murray-Darling Basin region.
a)
b)

PRODUCTIVITY AND CARBON SEQUESTRATION FROM REVEGETATION
Report DWLBC 2010/02 Carbon Sequestration from Revegetation: Southern Murray-Darling Basin Region
54
a) Average Annual Rainfall Woodlots Environmental Planting
b) NCAT Forest Productivity Index Woodlots Environmental Planting
c) BiosEquil Model Woodlots Environmental Planting
Figure 20. Comparison of estimated carbon sequestration rates using different model types based on a) average annual rainfall, b) NCAT Forestry Productivity Index and c) BiosEquil model predictions for Woodlot and Environmental Planting revegetation types at 1000 tree per hectare planting rate.

PRODUCTIVITY AND CARBON SEQUESTRATION FROM REVEGETATION
Report DWLBC 2010/02 Carbon Sequestration from Revegetation: Southern Murray-Darling Basin Region
55
Table 12. Regional summaries of total land area, potential agricultural land for carbon sequestration activities (woodlots & environmental plantings), and estimated carbon sequestration rates for IBRA sub-regions in the study area.
Carbon Sequestration (CO2-e t/ha/yr) [range]
Regions
Annual Rainfall
(mm) [range]
Total Land Area (ha)
Potential Agric. Land (ha)
% of Land Area
Woodlots at 800tph
Env.Plant. at 1400tph
IBRA Sub-region (part)
Fleurieu 469 [313-650] 199,524 181,928 91% 7.49
[4.49-10.83] 6.74
[5.33-8.03]
Murray Mallee 339 [257-440] 992,324 889,548 90% 5.29
[2.98-7.13] 5.75
[4.41-6.61]
Murray Lakes & Coorong 413 [356-579] 141,076 97,131 69% 6.25
[4.40-9.32] 6.21
[5.29-7.49]
Lowan Mallee (N) 311 [282-347] 235,604 120,787 51% 4.53
[2.86-5.53] 5.35
[4.33-5.88]
Lowan Mallee (S) 400 [333-437] 357,271 98,468 28% 5.50
[4.49-6.97] 5.86
[5.34-6.55]
Tintinara 452 [377-521] 494,913 378,428 76% 6.59
[4.64-8.37] 6.37
[5.42-7.12]
NRM Region (part)
Murray-Darling Basin (S) 365 [258-650] 1,814,839 1,363,283 75% 5.60
[2.86-10.83] 5.89
[4.33-8.03]
South East (N) 446 [375-522] 598,528 397,167 66% 6.49
[4.68-8.37] 6.33
[5.44-7.12]
Study Area 385 [257-650] 2,420,712 1,766,290 73% 5.81
[2.98-10.83] 5.99
[4.33-8.03]
Table 13. District summaries of total land area, potential agricultural land for carbon sequestration activities (woodlots & environmental plantings), and estimated carbon sequestration rates for 70 Hundred regions in the study area.
Carbon Sequestration (CO2-e t/ha/yr)
Table 13 (continued) Hundred
Annual Rainfall
(mm)
Total Land Area (ha)
Potential Agric. Land (ha)
% of Land Area
Woodlots at 800tph
Env.Plant. at 1400tph
Alexandrina 395 11,150 9,923 89% 6.10 6.15 Allenby 392 31,076 26,641 86% 5.72 5.97 Angas 308 34,824 31,742 91% 4.83 5.51 Archibald 438 39,632 9,825 25% 6.62 6.39 Auld 313 42,596 10,629 25% 4.58 5.38 Bagot 300 26,056 14,645 56% 4.85 5.53 Baker 409 33,100 21,955 66% 6.38 6.28 Bews 350 56,061 52,988 95% 5.45 5.83 Billiatt 309 42,558 7,641 18% 4.15 5.14 Bonney 446 43,477 37,108 85% 6.54 6.35 Bowhill 316 29,489 25,608 87% 4.96 5.59 Bremer 405 22,552 21,846 97% 6.34 6.25 Brinkley 367 40,939 34,751 85% 5.53 5.87 Burdett 330 30,733 25,350 82% 5.09 5.65 Carcuma 402 35,486 25,598 72% 5.48 5.85 Colebatch 473 34,218 27,539 80% 6.82 6.48 Coneybeer 426 35,346 30,316 86% 6.48 6.32 Coolinong 405 24,720 21,552 87% 6.09 6.14 Coombe 441 45,315 42,137 93% 6.25 6.22

PRODUCTIVITY AND CARBON SEQUESTRATION FROM REVEGETATION
Report DWLBC 2010/02 Carbon Sequestration from Revegetation: Southern Murray-Darling Basin Region
56
Carbon Sequestration (CO2-e t/ha/yr)
Table 13 (continued) Hundred
Annual Rainfall
(mm)
Total Land Area (ha)
Potential Agric. Land (ha)
% of Land Area
Woodlots at 800tph
Env.Plant. at 1400tph
Cotton 355 56,056 51,360 92% 5.53 5.87 Day 384 26,929 18,047 67% 5.39 5.81 Encounter Bay* 641 1,013 391 39% 10.35 7.86 Ettrick 338 33,697 27,488 82% 5.26 5.74 Field 473 24,801 23,960 97% 6.83 6.48 Finniss 307 33,185 29,620 89% 4.88 5.55 Fisher 276 22,785 6,654 29% 4.34 5.25 Fisk 405 26,428 1,961 7% 5.79 6.00 Freeling 377 28,734 24,874 87% 5.78 5.99 Glyde 476 31,479 24,615 78% 6.82 6.48 Goolwa* 552 12,063 9,736 81% 8.80 7.29 Hooper 337 38,956 36,980 95% 5.21 5.71 Jeffries 440 24,607 20,894 85% 6.51 6.34 Jellicoe 450 32,772 29,983 91% 7.16 6.61 Jutland 482 26,441 25,933 98% 7.62 6.80 Kanmantoo* 518 19,686 18,308 93% 8.26 7.06 Kingsford 304 42,460 21,936 52% 4.41 5.28 Kirkpatrick 408 25,604 22,965 90% 6.25 6.22 Kondoparinga* 559 10,110 8,685 86% 8.72 7.25 Lewis 417 42,769 29,773 70% 5.86 6.03 Livingston 393 34,114 29,115 85% 5.99 6.09 Macclesfield* 589 3,475 3,240 93% 9.37 7.51 Makin 427 34,935 13,927 40% 5.99 6.10 Malcolm 406 41,145 33,909 82% 6.13 6.16 Marmon Jabuk 347 39,183 37,233 95% 5.17 5.69 McNamara 501 39,535 27,861 70% 7.42 6.74 McPherson 313 34,347 26,863 78% 4.66 5.42 Messent 502 32,592 10,987 34% 7.30 6.69 Mobilong 340 31,007 26,864 87% 5.25 5.73 Molineux 349 38,391 35,990 94% 5.21 5.71 Monarto 393 27,543 24,054 87% 6.21 6.19 Nangkita* 456 16,773 13,105 78% 7.14 6.60 Ngarkat 405 168,712 8,255 5% 5.55 5.88 Parilla 333 56,139 53,374 95% 5.16 5.69 Peake 381 36,546 35,743 98% 5.86 6.04 Peebinga 302 43,071 30,644 71% 4.39 5.27 Pinnaroo 322 56,681 53,441 94% 5.05 5.64 Price 384 41,382 40,205 97% 5.86 6.04 Quirke 358 24,966 4,357 17% 5.04 5.63 Richards 459 38,925 36,717 94% 6.50 6.33 Ridley 283 44,459 29,677 67% 4.50 5.34 Roby 368 37,107 36,517 98% 5.67 5.94 Santo 490 22,049 10,375 47% 7.31 6.69 Seymour 361 42,824 37,233 87% 5.63 5.92 Sherlock 351 38,102 36,032 95% 5.42 5.82 Strathalbyn* 473 21,653 20,659 95% 7.52 6.76 Strawbridge 441 26,752 19,795 74% 6.63 6.39 Tungkillo 451 31,280 28,642 92% 7.27 6.64 Vincent 314 37,124 34,440 93% 4.71 5.45 Wilson 309 32,382 31,264 97% 4.74 5.47 Younghusband 301 27,517 23,808 87% 4.65 5.42
* partial of Hundred district in study region
Report DWLBC 2010/02 Carbon Sequestration from Revegetation: Southern Murray-Darling Basin Region
57
5. DISCUSSION
5.1 CARBON MARKETS, DRIVERS AND POLICIES
Governments and communities around Australia are concerned about the potential impacts of climate change on the health and prosperity of rural landscapes and communities. Two broad approaches to assist in managing this issue are: 1/ Mitigation - reducing carbon dioxide in the atmosphere by sequestering carbon dioxide in long-term stores (e.g. woody plant biomass in forests and revegetation) or reducing atmospheric emissions from fossil fuels by encouraging the development of renewable energy sources; and 2/ Adaptation - developing agricultural uses, land management practices and industries that can maintain rural prosperity by modifying current production systems to suit changed climatic conditions.
Increasing the proportion of perennial woody vegetation through revegetation and woody biomass industries in agricultural landscapes could significantly reduce atmospheric carbon dioxide through sequestration. This could also reduce fossil fuel emissions though the development of renewable bioenergy crops. Recognition of the potential of revegetation to help address some of the issues of climate change, natural resource management and rural prosperity has led to the considerable support of policies and initiatives in recent years to encourage revegetation activities in South Australia and nationally.
The likely emergence of the Carbon Pollution Reduction Scheme (CPRS) due to commence in 2011, recent expansion of existing carbon offset/credit programs from energy/liquid fuel sectors (e.g. Mandatory Renewable Energy Targets) and informal “green-friendly” markets is expected to increase the demand for carbon crops, agroforestry and environmental plantings in Australia. Current documentation for the CPRS recognises “Kyoto-compliant” revegetation/forestry for carbon accounting purposes. The Australian definition of a forest for the purpose of Kyoto Protocol accounting specifies a minimum area of only 0.2 hectares, tree crown cover of 20 per cent and a tree height of two metres (Department of Climate Change 2008). Many woodlots and environmental plantings in South Australia currently fit these criteria and most future plantings are expected to be designed as “Kyoto-compliant” to meet CPRS and other carbon trading schemes. Carbon is quickly becoming a highly valued product (or co-product) of revegetation and commercial agroforestry.
There is currently great interest and momentum for dedicated carbon sequestration crops, using both monocultures and mixed species environmental plantings of long-lived trees and shrubs. Due to land prices and economic considerations it is expected that many of these new activities will focus on the low to medium rainfall zones (250-650mm/year) on dryland agricultural landscapes that are predominantly used for annual cropping and grazing. Within the Southern Murray-Darling Basin study area the potential area for carbon crops and revegetation on cleared agricultural land equates to 1.76 million hectares or 73% of the total land area.
The growth rate, lifespan and height of plants chosen for carbon sequestration crops influence their viability as compliant carbon crops for most carbon trading schemes. Results from this study suggest that monocultures of woodlot and other commercial species are often more productive than environmental plantings at the same density (trees per hectare). Although many Acacia species (wattles) can be highly productive in their early stages, some

DISCUSSION
Report DWLBC 2010/02 Carbon Sequestration from Revegetation: Southern Murray-Darling Basin Region
58
do not persist over longer timeframes, and most saltbushes for lower rainfall regions (e.g. Atriplex nummularia) may not achieve a compliant height class (e.g. ≥ 2m). Plantations of short-lived and lower height species may not be suitable for typical carbon crop contracts.
The economic viability and success of any carbon sequestration plantings is highly dependent on the primary productivity of the species chosen. The work presented in this productivity study provides a solid evaluation of the biomass productivity of a wide range of species grown in Southern Murray-Darling Basin region. Other productivity studies (Bennell et al. 2008, Kiddle et al. 1987, Boardman 1992, Fairlamb & Bulman 1994) detail a number of tree species which are often more productive than mixed species environmental plantings within lower rainfall environments (350-650mm). Some highly productive species identified in these studies, which are climatically suited to large sections of the Southern Murray-Darling Basin, include Sugar gum (Eucalyptus cladocalyx), WA Swamp yate (E. occidentalis), SA Blue gum (E. leucoxylon), WA Swamp mallet (E. spathulata) and WA Blue mallet (E. gardneri).
Dedicated carbon crops and extractive-use woody biomass crops provide opportunities to both sequester carbon and/or provide commercial alternatives to existing annual crops/pastures in agricultural landscapes. Many extractive-use woody crop production systems (e.g. pulp/woodfibre, firewood, lumber/posts/poles, fodder shrubs, Eucalyptus oil) will maintain non-extracted components (e.g. root biomass and soil carbon) as carbon stores. Woody biomass extracted for use in bioenergy plants currently has a market value under the Australian Mandatory Renewable Energy Target scheme in addition to the inherent energy (and economic) value of the raw biomass. Many forestry industries in Australia that utilise woody biomass for electricity generation already derive financial returns through this scheme. Future carbon accounting practices are also expected to consider long-term average standing biomass in carbon budgeting.
The majority of existing permanent environmental plantings in South Australia were intended to address a range of natural resource management or other environmental issues, including groundwater recharge, dryland salinity, saline river discharges, wind erosion, biodiversity loss, livestock protection and amenity. In the past, many of these permanent environmental plantings of native trees and shrubs did not have a direct financial benefit to the landholder, but provided longer-term benefits to farming systems and the wider community. The establishment of these plantings were often supported by government/local region grants and incentive schemes. The potential of these revegetation types to attract tradeable carbon credits in the future may help to reduce the level of public subsidisation for these environmental plantings.
The carbon sequestration potential of revegetation may be increased through the use of a greater proportion of fast growing and productive species in the planting mix. This approach may increase the tradeable carbon value of these plantings but may also conflict with other intended values (e.g. biodiversity vs. extractable biomass) of the plantation. Ultimately it is the decision of the investors and planning authorities to determine the right blend of species for any revegetation. Monocultures (or limited species blends) of most productive species may provide substantive increases in tradeable carbon stocks and some natural resource management benefits (e.g. recharge reduction) but have lower biodiversity values.
Mixed species environmental plantings will seldom approach re-creations of natural vegetation communities that existed prior to land clearing for agriculture. While they often contain many of the larger tree and shrub species indigenous to the region, the smaller understorey species are generally not included in planted species mixes. Similarly, the

DISCUSSION
Report DWLBC 2010/02 Carbon Sequestration from Revegetation: Southern Murray-Darling Basin Region
59
number of local indigenous species planted by land managers can be significantly influenced by nursery stock availability, costs and establishment success of each species. Species preferences and fashions are evident in many environmental plantings. Notably, many Western Australian native species were “fashionable” in the 1970s and are commonly encountered in revegetation from that era. For example, River red gum (Eucalyptus camaldulensis), a desirable woodlot species and locally indigenous plant of creek lines and rivers, is often found planted within mixed environmental plantings away from watercourses.
Without accurate data on planting locations, trees per hectare and survival rates of the plants despatched, the area under revegetation from nursery sales surveys in South Australia (or the Southern Murray-Darling Basin) is not easily quantifiable. Emes et al. (2006) suggest a planting density of around a 1000 trees/stems per hectare (tph) but this value appears to be an overestimation of planting density for woodlots (average of ~800 tph from our surveys) and an underestimate for environmental plantings (~1400 tph surveyed). Based on Trees For Life stock distributed to the Southern Murray-Darling Basin region over the last 10 years and our surveyed planting densities, at least 1,000 - 3,000 hectares of revegetation has been established in the region over the last 10 years. This represents a potential of around 10,000 - 17,000 tonnes of carbon dioxide equivalent (CO2-e) being sequestered annually from revegetation established during the last 10 years in this region.
5.2 CARBON ACCOUNTING, ASSESSMENTS AND MODELS
The Australian Government Department of Climate Change (DCC) has a strong commitment to the use of the National Carbon Accounting Toolbox (NCAT) for carbon accounting purposes in Australia. Further, the NCAT has been identified as the preferred system to support carbon accounting within the Carbon Pollution Reduction Scheme expected to commence in 2011. At present the FullCAM model (and sub-models) within the NCAT has been predominantly populated by parameters drawn from studies of higher rainfall commercial forestry plantations. However, current NCAT parameter sets for lower rainfall species, plantation designs and mixed environmental plantings are largely absent or poorly validated.
The lack of detailed data from low to medium rainfall forestry and environmental plantings has previously hampered the development of suitable NCAT parameter sets for accurate NCAT prediction of carbon balances in the low to medium rainfall regions of Australia. Comparisons between detailed productivity assessments of 70 sites in the Southern Murray-Darling Basin region and FullCAM predictions (using their standard parameter sets) clearly demonstrates that NCAT can severely under-predict carbon sequestration rates in woodlots and environmental planting (27% of observed above-ground carbon sequestration) in lower rainfall regions. While options exist within the NCAT system to manually adjust a range of parameter to make the NCAT predictions match observed data at individual sites, this approach provides very limited opportunities to use the NCAT to successfully predict carbon balances for other plantations and sites.
The NCAT system downloads a set of spatially-variable and site-specific parameters (e.g. climate, soils, maximum aboveground biomass) from a federal Department of Climate Change computer server prior to creating FullCAM time-series predictions of carbon balances. The spatially variable parameter “Maximum aboveground biomass” dominates model predictions to such an extent that variations in other manually entered parameters

DISCUSSION
Report DWLBC 2010/02 Carbon Sequestration from Revegetation: Southern Murray-Darling Basin Region
60
have virtually no influence on resulting mature age carbon balance predictions. Although this report provides many plantation parameters (e.g. growth rates, stemwood volumes, plant fractions, wood densities) suited for input to the NCAT system, the underlying NCAT/FullCAM programming and front-end design limits the successful inclusion of these new parameters to create more realistic NCAT predictions of carbon balances in South Australia.
Previous studies of plantation productivity in the Southern Murray-Darling Basin (and most other low-mid rainfall areas of Australia) have mainly been limited to the evaluation of stemwood production rates of known forestry and biomass production species planted for industrial purposes driven by economic returns. Biomass productivity and carbon sequestration rates of many species used in mixed environmental plantings are poorly known. Measuring total plant biomass for evaluating or developing these plantings for a secondary carbon sequestration purpose can be a difficult and labour intensive task. To increase the efficiency of determining existing and future plantation productivities, and to evaluate and value-add to previously collected trial site data, current analyses provide reliable quantification of the relationships between simple plant measurements and stemwood volumes, total above-ground biomass and carbon contents (i.e. allometric relationships).
These new allometric relationships provide a foundation for robust and rapid methods of assessing carbon sequestration and woody biomass production rates from environmental revegetation, woody biomass crop and agroforestry activities in lower rainfall regions of South Australia. These relationships can now be applied to data from historical, recent and future surveys of plants at a range of revegetation sites in dryland agricultural regions to more rapidly evaluate and accuracy assess biomass production and carbon sequestration rates from revegetation in dryland agricultural regions of the state. Further, current and future productivity assessments can now be combined with spatial datasets and predictive models to allow landscape scale evaluations of potential carbon sequestration and woody crop production. Such information can provide strong guidance to those seeking to evaluate the potential for developing new plantations for carbon crops and other biomass industries in the Southern Murray-Darling Basin region.
Our analyses show that productivity and carbon sequestration in woodlots and environmental plantings in low to medium rainfall zones of the Southern Murray-Darling Basin region is dominated by planting densities (trees per hectare) and rainfall. Water availability is clearly a limiting factor of plantation growth in this area. Soil fertility was found to have no statistically significant influence on productivity in our study region. This result contrasts those from commercial forestry in higher rainfall regions, where soil fertility is considered an important factor influencing plantation growth. The biomass accumulation rates and other parameters reported here have been applied, using geographic information systems, BiosEquil and FullCAM modelling, to estimate productivity and potential carbon sequestration over the entire Southern Murray-Darling Basin. From our recent studies the expected average carbon sequestration rate of mature woodlots and environmental plantings in the Southern Murray-Darling Basin region is typically within in the range of 5.3 - 7.5 CO2-e t/ha/year.
Regional models of plantation productivity are a core component of regional industry potential analyses to provide economic evaluations of the viability of carbon sequestration and other woody biomass industries across the dryland agricultural regions of South Australia (e.g. Hobbs 2009, Hobbs et al. 2009b, Crossman et al. 2010). High resolution spatial analyses of annual and woody crop yields and profitability can help to facilitate a

DISCUSSION
Report DWLBC 2010/02 Carbon Sequestration from Revegetation: Southern Murray-Darling Basin Region
61
better understanding the optimal productive arrangement of annual and woody crops in a farming enterprise (e.g. Lyle et al. 2009). Through a better understanding of the optimal productive arrangement the issue of perceived competition of new crop options can largely be avoided, and economic opportunity costs involved in the movement from existing to alternate land uses can be eliminated or reduced. It is crucial to estimate and compare economic returns and risks of new integrated systems with those from existing annual crops/pastures so that the most profitable and sustainable land use options are adopted for locations within farming enterprises and regions.
5.3 CONCLUSIONS AND RECOMMENDATIONS
Current policies, natural resource management drivers and economic evaluations indicate there are substantial opportunities for carbon sequestration in the dryland agricultural regions of South Australia from revegetation based on woody carbon crops, permanent environmental plantings and extractive agroforestry/biomass industries. Private or corporate investors in revegetation for carbon sequestration in lower rainfall regions of the state, and the extent of government support for those enterprises in the form of incentives, support mechanisms, regional planning and policy development, should be mindful of the very dynamic nature of the carbon markets and their influence on long-term viability.
Recent studies (e.g. Hobbs 2009, Hobbs et al. 2009b, Polglase et al. 2008, Crossman et al. 2010, Lyle et al. 2009) show that the scale and profitability of carbon sequestration crops is highly dependant on market prices for carbon sequestration and opportunity costs from existing landuses. Significant pressure on the viability of existing annual crops and pastures could result from high carbon market prices in the future. If uncontrolled by policy and landuse planning, carbon crop reforestation driven by market prices alone may significantly reduce agriculture production in food and fibre industries, provide only marginal biodiversity values, and reduce fresh water resources for consumptive uses in some regions.
Targeted placement of new woody biomass and carbon crop to maximise benefits and profitability of whole farm enterprises and regions should be the goal of any investment in carbon sequestration and woody crops. Broad-scale evaluations of natural resource management drivers, policies, annual and woody crop productivities and farm economics provide useful tools in determining regions with greatest potential for investment in carbon crops.
To promote success of carbon sequestration activities from revegetation in South Australia and minimise risks within these new carbon markets it is recommended that potential investors, planners and government agencies:
1. Clearly define the targeted purpose of revegetation activities (e.g. carbon vs. biodiversity) so the correct species (or species blends), scale of investment, planting designs and locations are adopted. Evaluate the influence on manipulations of plantation designs and spatial/regional priorities on financial and other intended benefits of the revegetation activities.
2. Construct a business plan for any investment in revegetation, incorporating realistic information on expected capital, establishment and maintenance costs, carbon sequestration production rates, carbon markets, management/financial/ environmental risks, property management plans and zoning/policy restrictions.

DISCUSSION
Report DWLBC 2010/02 Carbon Sequestration from Revegetation: Southern Murray-Darling Basin Region
62
3. Exercise caution in relying on forecasts of potential carbon sequestration from existing Nation Carbon Accounting Toolbox (NCAT) models or other predictions, especially in low to medium rainfall regions. Current information clearly demonstrates a high degree of variation in carbon sequestration rates from plantations and revegetation activities in lower rainfall regions resulting from a range of unknown species, management and environmental factors. Always utilise reliable plantation assessment techniques to accurately determine quantities of carbon sequestered from revegetation for carbon accounting purposes.
4. Thoroughly evaluate local site conditions, seek expert advice and select most appropriate species for revegetation activities to maximise production rates, meet other targeted purposes, and minimise risks.
5. Support investments in further research to more accurately assess and predict carbon sequestration rates in mature revegetation plantations across the state, including a greater diversity of species, plantation types and locations. Support spatial/regional and natural resource management priority evaluations of the optimal placement of revegetation activities within agricultural landscapes of the state.

Report DWLBC 2010/02 Carbon Sequestration from Revegetation: Southern Murray-Darling Basin Region
63
APPENDICES
APPENDIX A. REVEGETATION SPECIES
Revegetation species used in the Southern Murray-Darling Basin region, based on recent Trees For Life plant records for the region (1999-2008).
Species by Height Class Total Plants
Last 10 Years Species by Height Class Total Plants
Last 10 Years
Height Class: Tall 1,136,782 Height Class: Moderately Tall 807,311
Acacia euthycarpa 2,162 Acacia argyrophylla 8,700
Acacia longifolia ssp. sophorae 12,786 Acacia brachybotrya 33,784
Acacia retinodes 14,448 Acacia calamifolia 21,673
Acacia stenophylla 150 Acacia cupularis 9,668
Allocasuarina verticillata 142,803 Acacia dodonaeifolia 10,650
Banksia marginata 10,460 Acacia hakeoides 12,385
Bursaria spinosa 23,577 Acacia ligulata 26,289
Callitris gracilis 29,537 Acacia microcarpa 21,776
Casuarina pauper 310 Acacia montana 6,650
Eucalyptus arenacea 671 Acacia notabilis 949
Eucalyptus baxteri 14,692 Acacia oswaldii 4,743
Eucalyptus camaldulensis 115,809 Acacia paradoxa 39,350
Eucalyptus cosmophylla 11,970 Acacia pycnantha 107,173
Eucalyptus diversifolia 9,428 Acacia rigens 14,153
Eucalyptus dumosa 38,375 Acacia verticillata 199
Eucalyptus fasciculosa 149,197 Allocasuarina muelleriana 22,931
Eucalyptus largiflorens 30,061 Allocasuarina striata 8,997
Eucalyptus leucoxylon 129,513 Callistemon brachyandrus 206
Eucalyptus odorata 38,761 Callistemon rugulosus 39,858
Eucalyptus oleosa 31,240 Callitris canescens 2,497
Eucalyptus porosa 59,291 Callitris rhomboidea 516
Eucalyptus rugosa 740 Callitris verrucosa 5,226
Eucalyptus socialis 63,136 Dodonaea viscosa 71,591
Eucalyptus viminalis 30,478 Eucalyptus brachycalyx 21,828
Melaleuca halmaturorum 49,245 Eucalyptus calycogona 27,648
Melaleuca lanceolata 105,802 Eucalyptus cyanophylla 482
Pittosporum angustifolium 22,140 Eucalyptus gracilis 51,282
Eucalyptus incrassata 43,188
Eucalyptus leptophylla 36,347
Eucalyptus phenax 17,861
Hakea leucoptera 21
Hakea mitchellii 379
Hakea rostrata 1,723
Hardenbergia violacea 7,765
Leptospermum continentale 18,147
Leptospermum coriaceum 2
Leptospermum lanigerum 18,735
Melaleuca acuminata 31,275
Melaleuca brevifolia 7,752
Melaleuca decussata 16,868
Melaleuca uncinata 36,044

APPENDIX A. REVEGETATION SPECIES
Report DWLBC 2010/02 Carbon Sequestration from Revegetation: Southern Murray-Darling Basin Region
64
Species by Height Class Total Plants
Last 10 Years Species by Height Class Total Plants
Last 10 Years
Height Class: Medium 132,938 Height Class: Low 68,138
Acacia acinacea 26,595 Arthropodium strictum 1,128
Acacia colletioides 37 Atriplex semibaccata 9,381
Acacia farinosa 1,528 Atriplex stipitata 981
Acacia leiophylla 585 Atriplex suberecta 1,310
Acacia myrtifolia 24,068 Atriplex vesicaria 355
Acacia nyssophylla 1,298 Austrostipa elegantissima 918
Acacia rupicola 1,907 Austrostipa eremophila 11
Acacia sclerophylla 7,310 Austrostipa mollis 338
Acacia spinescens 2,877 Austrostipa nitida 8
Acacia wilhelmiana 4,005 Austrostipa scabra 612
Allocasuarina mackliniana 1,416 Austrostipa semibarbata 604
Atriplex rhagodioides 9 Carex tereticaulis 28
Banksia ornata 3,229 Chloris truncata 275
Cassinia tegulata 75 Chrysocephalum apiculatum 307
Cullen australasicum 429 Clematis microphylla 8,232
Gahnia sieberiana 3,176 Dianella revoluta 54
Hakea carinata 934 Dodonaea baueri 575
Hakea rugosa 776 Einadia nutans 4
Melaleuca wilsonii 4,026 Enchylaena tomentosa 10,556
Olearia decurrens 96 Helichrysum scorpioides 383
Olearia floribunda 283 Juncus pallidus 5,701
Olearia pannosa 6,669 Kennedia prostrata 3,733
Olearia pimeleoides 302 Maireana brevifolia 88
Olearia ramulosa 8,991 Maireana erioclada 37
Rhagodia candolleana 8,191 Microlaena stipoides 9,011
Rhagodia parabolica 3,918 Olearia axillaris 103
Senna artemisioides 8,800 Olearia muelleri 277
Xanthorrhoea australis 224 Rhagodia crassifolia 5,483
Xanthorrhoea quadrangulata 951 Rhagodia spinescens 134
Xanthorrhoea semiplana 10,234 Senecio quadridentatus 66
Vittadinia blackii 1,929
Vittadinia cuneata 2,097
Vittadinia dissecta 178
Vittadinia gracilis 2,017
Vittadinia sp. 1,000
Xerochrysum bracteatum 223
local seed sources (species unknown) 230,534
All plants 2,375,702

Report D
WLB
C 2010/02
65 C
arbon Sequestration from
Revegetation: S
outhern Murray-D
arling Basin R
egion
AP
PE
ND
IX B
. PR
OD
UC
TIV
ITY
AN
D C
AR
BO
N S
EQ
UE
ST
RA
TIO
N
APPENDIX B. PRODUCTIVITY AND CARBON SEQUESTRATION
Plantation growth and carbon sequestration rates from mixed-species and single-species plantings observed in the Southern Murray-Darling Basin region.
Site Detail Field Survey Proportion of Above-ground Dry Biomass
Species Rai
n [m
m]
NC
AT
Mod
el –
M
ax. D
ry m
atte
r
[t/ha
]
NC
AT
For
est
Pro
duct
ivity
Inde
x
Bio
sEqu
il M
odel
[t
C/h
a/yr
]
Age
TP
H
Sta
ndT
ype
[Blo
ck,
Win
dBre
ak,.R
ando
m/N
atur
al
Obs
erva
tions
Hei
ght [
m]
Ste
m V
olum
e
MA
I [m
³/ha
/yr]
Dry
Bio
mas
s
[t/ha
/yr]
Car
bon
[t/
ha/y
r]
CO
2e
[t/ha
/yr]
Ste
mw
ood
Bar
k
Bra
nche
s
Leaf
Mixed species A. pycnantha/microcarpa, +6sp 364 68.8 5.0 2.4 18.0 6736 BL 86 4.0 1.56 3.647 1.81 6.64 0.39 0.07 0.37 0.17 Acacia calamifolia 1 2.2 0.43 0.3% 0.34 0.07 0.37 0.22
Acacia microcarpa 22 4.4 1.85 28.7% 0.40 0.07 0.36 0.17
Acacia paradoxa 1 2.9 1.13 0.8% 0.39 0.08 0.33 0.20
Acacia pycnantha 52 3.8 1.35 59.9% 0.39 0.06 0.39 0.16
Allocasuarina verticillata 1 3.7 0.26 0.4% 0.21 0.03 0.59 0.17
Dodonaea viscosa ssp. cuneata 2 3.7 0.65 0.9% 0.45 0.08 0.31 0.17
Eucalyptus incrassata 6 4.3 2.03 5.8% 0.33 0.18 0.23 0.26
Eucalyptus leucoxylon 1 6.0 7.75 2.6% 0.43 0.17 0.17 0.23
Allo. verticillata, E. leucoxylon, +1sp 403 95.9 6.2 2.9 33.0 310 BL 60 6.0 1.00 1.069 0.53 1.95 0.72 0.11 0.08 0.09 Allocasuarina verticillata 38 5.7 0.74 63.0% 0.73 0.11 0.09 0.08
Callitris gracilis 7 5.7 1.67 24.9% 0.77 0.12 0.06 0.06
Eucalyptus leucoxylon 15 7.2 1.13 14.8% 0.67 0.11 0.08 0.14
Allo. verticillata, E. socialis, +7sp 399 49.9 4.2 1.3 15.0 1492 WB 36 4.8 1.99 3.447 1.71 6.28 0.56 0.09 0.18 0.16 Acacia rigens 2 2.7 3.84 10.7% 0.48 0.09 0.25 0.17
Allocasuarina verticillata 14 5.6 2.32 43.6% 0.63 0.10 0.17 0.11
Callitris gracilis 1 2.6 0.13 0.3% 0.33 0.05 0.45 0.17
Dodonaea viscosa ssp. spathulata 3 3.1 0.17 0.9% 0.40 0.08 0.32 0.20
Eucalyptus camaldulensis 1 8.5 4.93 3.2% 0.53 0.15 0.13 0.20
Eucalyptus incrassata 4 4.0 1.65 11.1% 0.50 0.08 0.20 0.22
Eucalyptus leptophylla 1 2.9 0.15 0.3% 0.23 0.18 0.29 0.29

Report D
WLB
C 2010/02
66 C
arbon Sequestration from
Revegetation: S
outhern Murray-D
arling Basin R
egion
AP
PE
ND
IX B
. PR
OD
UC
TIV
ITY
AN
D C
AR
BO
N S
EQ
UE
ST
RA
TIO
N
Site Detail Field Survey Proportion of Above-ground Dry Biomass
Species Rai
n [m
m]
NC
AT
Mod
el –
M
ax. D
ry m
atte
r
[t/ha
]
NC
AT
For
est
Pro
duct
ivity
Inde
x
Bio
sEqu
il M
odel
[t
C/h
a/yr
]
Age
TP
H
Sta
ndT
ype
[Blo
ck,
Win
dBre
ak,.R
ando
m/N
atur
al
Obs
erva
tions
Hei
ght [
m]
Ste
m V
olum
e
MA
I [m
³/ha
/yr]
Dry
Bio
mas
s
[t/ha
/yr]
Car
bon
[t/
ha/y
r]
CO
2e
[t/ha
/yr]
Ste
mw
ood
Bar
k
Bra
nche
s
Leaf
Eucalyptus oleosa 2 5.0 1.72 3.9% 0.49 0.11 0.18 0.22
Eucalyptus socialis 8 5.1 1.77 22.8% 0.53 0.08 0.19 0.20
Callitris gracilis, E. camaldulensis, +12sp 335 92.3 6.0 1.7 18.0 1981 BL 60 8.9 24.43 13.939 6.91 25.37 0.73 0.10 0.07 0.10 Acacia argyrophylla 5 3.9 10.59 9.3% 0.57 0.11 0.19 0.13
Acacia montana 1 2.7 0.89 0.2% 0.43 0.08 0.30 0.19
Acacia retinodes 7 7.1 17.81 20.9% 0.75 0.11 0.07 0.06
Acacia rigens 1 2.8 0.49 0.1% 0.49 0.10 0.25 0.16
Acacia sclerophylla 1 2.7 0.19 0.0% 0.39 0.08 0.33 0.20
Callitris gracilis 18 5.9 2.54 8.8% 0.68 0.10 0.13 0.09
Dodonaea viscosa ssp. angustisima 2 3.0 2.45 1.0% 0.47 0.09 0.26 0.17
Eucalyptus camaldulensis 9 18.2 17.30 7.8% 0.79 0.08 0.04 0.09
Eucalyptus cladocalyx 1 13.0 59.72 3.5% 0.72 0.10 0.06 0.12
Eucalyptus fasciculosa 4 10.0 26.27 7.2% 0.66 0.12 0.08 0.15
Eucalyptus incrassata 2 7.0 2.61 1.0% 0.56 0.10 0.17 0.18
Eucalyptus largiflorens 1 12.5 9.40 0.5% 0.76 0.09 0.05 0.10
Eucalyptus leucoxylon 7 13.8 22.25 9.9% 0.68 0.11 0.07 0.13
Melaleuca brevifolia 1 3.2 0.44 0.1% 0.49 0.10 0.25 0.16
Callitris gracilis, E. leucoxylon/por., +6sp 376 109.4 6.8 2.2 31.9 280 BL 60 7.0 1.27 1.385 0.69 2.52 0.70 0.11 0.10 0.10 Brachychiton populeneus 1 2.7 0.03 0.1% 0.36 0.06 0.41 0.17
Callitris gracilis 22 5.5 0.28 12.0% 0.66 0.10 0.14 0.10
Eucalyptus campaspe 2 7.3 1.35 1.9% 0.64 0.12 0.09 0.15
Eucalyptus gardneri 1 9.2 3.71 6.5% 0.72 0.11 0.09 0.08
Eucalyptus gomphocephala 2 10.8 1.50 1.9% 0.68 0.11 0.07 0.14
Eucalyptus leucoxylon 14 6.9 0.73 8.2% 0.59 0.13 0.10 0.17
Eucalyptus phenax 2 5.8 0.96 3.4% 0.66 0.11 0.12 0.12
Eucalyptus porosa 9 8.8 2.24 28.9% 0.69 0.11 0.10 0.10
Eucalyptus spathulata 7 9.3 3.97 36.6% 0.74 0.11 0.08 0.07
Callitris gracilis, E. platypus/dund., +7sp 362 48.7 4.1 1.7 18.9 227 WB 60 7.2 2.92 2.647 1.31 4.82 0.72 0.11 0.09 0.09 Allocasuarina verticillata 1 7.0 2.38 2.1% 0.75 0.11 0.07 0.07

Report D
WLB
C 2010/02
67 C
arbon Sequestration from
Revegetation: S
outhern Murray-D
arling Basin R
egion
AP
PE
ND
IX B
. PR
OD
UC
TIV
ITY
AN
D C
AR
BO
N S
EQ
UE
ST
RA
TIO
N
Site Detail Field Survey Proportion of Above-ground Dry Biomass
Species Rai
n [m
m]
NC
AT
Mod
el –
M
ax. D
ry m
atte
r
[t/ha
]
NC
AT
For
est
Pro
duct
ivity
Inde
x
Bio
sEqu
il M
odel
[t
C/h
a/yr
]
Age
TP
H
Sta
ndT
ype
[Blo
ck,
Win
dBre
ak,.R
ando
m/N
atur
al
Obs
erva
tions
Hei
ght [
m]
Ste
m V
olum
e
MA
I [m
³/ha
/yr]
Dry
Bio
mas
s
[t/ha
/yr]
Car
bon
[t/
ha/y
r]
CO
2e
[t/ha
/yr]
Ste
mw
ood
Bar
k
Bra
nche
s
Leaf
Callitris gracilis 13 5.0 1.31 15.1% 0.75 0.11 0.07 0.07
Eucalyptus camaldulensis 5 8.1 2.20 3.7% 0.68 0.11 0.07 0.13
Eucalyptus dundasii 8 10.8 2.98 7.6% 0.71 0.11 0.06 0.12
Eucalyptus leptophylla 3 4.8 0.57 1.8% 0.61 0.10 0.14 0.14
Eucalyptus leucoxylon 6 10.9 7.19 11.2% 0.79 0.08 0.04 0.09
Eucalyptus platypus 10 10.6 6.07 55.1% 0.73 0.11 0.09 0.07
Eucalyptus socialis 4 4.2 0.42 1.9% 0.59 0.09 0.16 0.16
Melaleuca halmaturorum 5 2.9 0.31 1.5% 0.53 0.10 0.22 0.15
Melaleuca lanceolata 5 3.0 0.94 4.4% 0.56 0.11 0.19 0.14
Casuarina cunninghamiana, +5sp 465 116.6 7.1 3.0 14.9 675 WB 39 5.4 1.61 2.176 1.08 3.96 0.64 0.11 0.14 0.11 Acacia pycnantha 6 3.4 0.26 4.0% 0.49 0.08 0.29 0.14
Allocasuarina verticillata 3 4.0 0.37 2.9% 0.48 0.07 0.30 0.15
Casuarina cunninghamiana 24 5.6 2.08 95.0% 0.67 0.10 0.13 0.09
Corymbia maculata 1 7.3 0.67 0.6% 0.55 0.14 0.12 0.19
Eucalyptus cladocalyx 4 7.2 0.64 2.2% 0.56 0.14 0.11 0.18
Eucalyptus leucoxylon 1 7.4 1.15 0.8% 0.62 0.13 0.09 0.16
E. camald., Cas. cunninghamiana, +1sp 585 115.3 7.0 3.0 14.9 754 WB 60 6.1 1.68 1.529 0.76 2.78 0.58 0.12 0.15 0.15 Casuarina cunninghamiana 23 6.1 0.92 40.2% 0.60 0.09 0.19 0.12
Eucalyptus camaldulensis 36 6.0 2.23 60.1% 0.57 0.14 0.11 0.18
Eucalyptus sideroxylon 1 6.2 0.19 0.2% 0.42 0.17 0.18 0.23
E. camald./largiflorens, A. ligulata, +6sp 387 47.2 4.1 1.4 11.9 1309 BL 60 4.6 3.69 4.579 2.27 8.34 0.55 0.11 0.18 0.15 Acacia calamifolia 7 2.3 1.03 4.6% 0.47 0.09 0.26 0.17
Acacia ligulata 25 4.9 4.08 57.1% 0.54 0.11 0.21 0.14
Acacia rigens 3 2.4 1.07 2.1% 0.46 0.09 0.27 0.18
Callitris canescens 1 5.8 5.22 3.0% 0.52 0.10 0.22 0.15
Dodonaea viscosa ssp. angustisima 6 1.5 0.08 0.5% 0.33 0.07 0.38 0.22
Eucalyptus camaldulensis 8 6.8 4.76 10.0% 0.55 0.14 0.12 0.18
Eucalyptus largiflorens 8 7.3 7.90 19.8% 0.63 0.12 0.09 0.16
Eucalyptus oleosa 1 2.8 0.10 0.2% 0.21 0.03 0.30 0.45

Report D
WLB
C 2010/02
68 C
arbon Sequestration from
Revegetation: S
outhern Murray-D
arling Basin R
egion
AP
PE
ND
IX B
. PR
OD
UC
TIV
ITY
AN
D C
AR
BO
N S
EQ
UE
ST
RA
TIO
N
Site Detail Field Survey Proportion of Above-ground Dry Biomass
Species Rai
n [m
m]
NC
AT
Mod
el –
M
ax. D
ry m
atte
r
[t/ha
]
NC
AT
For
est
Pro
duct
ivity
Inde
x
Bio
sEqu
il M
odel
[t
C/h
a/yr
]
Age
TP
H
Sta
ndT
ype
[Blo
ck,
Win
dBre
ak,.R
ando
m/N
atur
al
Obs
erva
tions
Hei
ght [
m]
Ste
m V
olum
e
MA
I [m
³/ha
/yr]
Dry
Bio
mas
s
[t/ha
/yr]
Car
bon
[t/
ha/y
r]
CO
2e
[t/ha
/yr]
Ste
mw
ood
Bar
k
Bra
nche
s
Leaf
Eucalyptus socialis 1 3.8 1.07 1.0% 0.41 0.06 0.24 0.29
E. camaldulensis/leucoxylon 370 47.2 4.1 1.6 15.0 600 BL 60 6.6 1.68 1.215 0.60 2.21 0.55 0.14 0.12 0.18 Eucalyptus camaldulensis 31 7.5 2.10 61.7% 0.57 0.14 0.11 0.18
Eucalyptus leucoxylon 29 5.5 1.28 39.1% 0.53 0.14 0.13 0.19
E. camaldulensis/oleosa, +6sp 387 47.2 4.1 1.4 9.9 1104 BL 60 4.5 2.76 3.591 1.78 6.54 0.54 0.10 0.18 0.19 Acacia rigens 10 4.0 1.64 13.7% 0.59 0.09 0.20 0.12
Allocasuarina muelleriana 7 2.4 1.11 9.3% 0.49 0.10 0.25 0.16
Allocasuarina verticillata 2 4.9 3.00 4.8% 0.61 0.09 0.18 0.11
Eucalyptus camaldulensis 14 6.5 7.04 30.7% 0.59 0.13 0.11 0.17
Eucalyptus cyanophylla 1 3.4 0.26 0.5% 0.27 0.04 0.29 0.40
Eucalyptus incrassata 2 3.6 0.61 1.6% 0.38 0.06 0.25 0.31
Eucalyptus oleosa 14 4.4 2.05 26.6% 0.53 0.08 0.19 0.21
Eucalyptus socialis 10 4.1 1.10 11.8% 0.46 0.07 0.22 0.26
E. camald./tricarpa/cladocalyx, +4sp 478 108.2 6.7 2.9 20.9 1376 BL 60 13.0 10.39 6.001 2.98 10.92 0.66 0.12 0.08 0.14 Eucalyptus camaldulensis 21 12.1 6.80 24.1% 0.63 0.13 0.09 0.16
Eucalyptus cladocalyx 12 14.8 23.53 39.6% 0.71 0.11 0.06 0.12
Eucalyptus leucoxylon 6 13.5 8.82 8.1% 0.67 0.12 0.08 0.14
Eucalyptus platypus 2 8.5 4.21 4.3% 0.58 0.09 0.17 0.17
Eucalyptus sideroxylon 6 14.6 9.56 9.5% 0.64 0.12 0.08 0.15
Eucalyptus spathulata 1 14.0 15.50 2.5% 0.65 0.12 0.08 0.15
Eucalyptus tricarpa 12 12.3 7.73 15.6% 0.63 0.12 0.09 0.16
E. cladocalyx/camaldulensis 478 101.7 6.4 2.9 21.9 1210 BL 36 16.3 9.42 5.316 2.64 9.68 0.66 0.12 0.08 0.14 Eucalyptus camaldulensis 18 15.1 7.83 43.3% 0.64 0.12 0.08 0.15
Eucalyptus cladocalyx 18 17.4 10.94 56.4% 0.67 0.11 0.07 0.14
E. cladocalyx/camaldulensis, +1sp 478 102.2 6.5 2.9 21.9 1257 BL 60 14.6 9.63 5.373 2.67 9.78 0.66 0.12 0.08 0.14 Eucalyptus camaldulensis 30 14.7 10.64 55.7% 0.66 0.12 0.08 0.14
Eucalyptus cladocalyx 29 14.8 8.95 44.3% 0.67 0.11 0.08 0.14
Eucalyptus phenax 1 3.0 0.17 0.1% 0.41 0.06 0.24 0.29
E. diversifolia/incrassata, +4sp 460 64.8 4.8 1.7 17.0 1119 BL 60 5.5 6.32 9.775 4.85 17.79 0.65 0.10 0.13 0.12
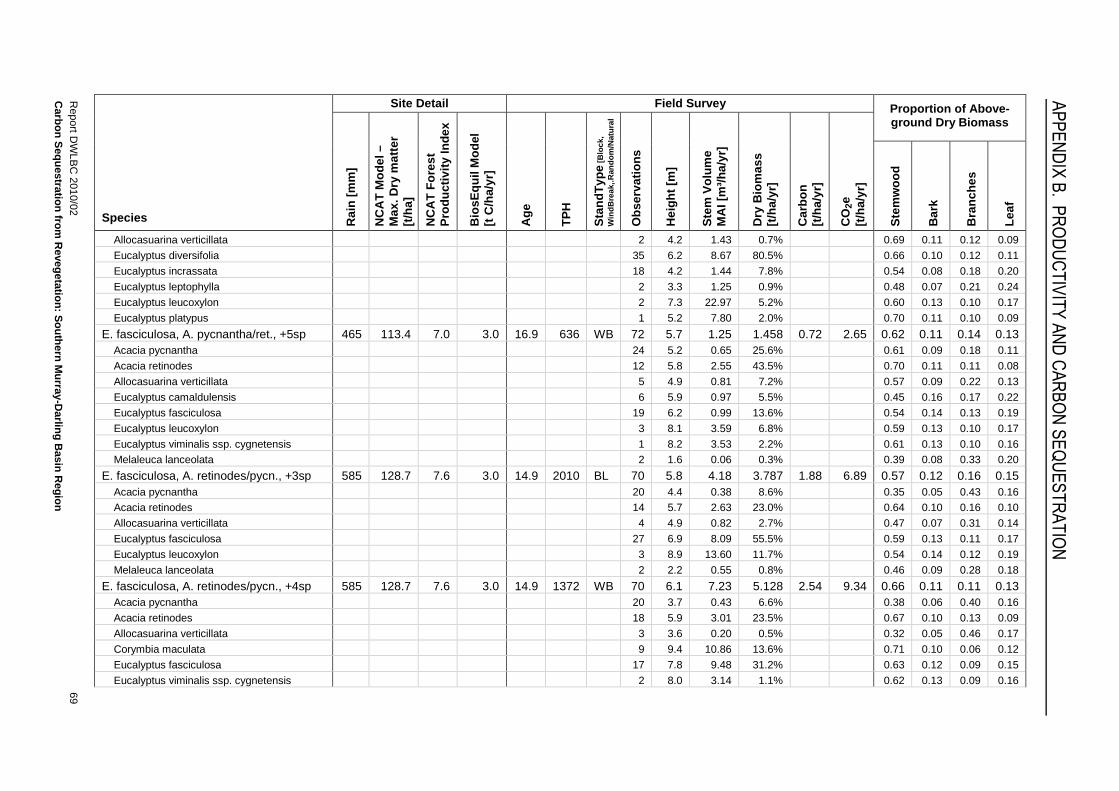
Report D
WLB
C 2010/02
69 C
arbon Sequestration from
Revegetation: S
outhern Murray-D
arling Basin R
egion
AP
PE
ND
IX B
. PR
OD
UC
TIV
ITY
AN
D C
AR
BO
N S
EQ
UE
ST
RA
TIO
N
Site Detail Field Survey Proportion of Above-ground Dry Biomass
Species Rai
n [m
m]
NC
AT
Mod
el –
M
ax. D
ry m
atte
r
[t/ha
]
NC
AT
For
est
Pro
duct
ivity
Inde
x
Bio
sEqu
il M
odel
[t
C/h
a/yr
]
Age
TP
H
Sta
ndT
ype
[Blo
ck,
Win
dBre
ak,.R
ando
m/N
atur
al
Obs
erva
tions
Hei
ght [
m]
Ste
m V
olum
e
MA
I [m
³/ha
/yr]
Dry
Bio
mas
s
[t/ha
/yr]
Car
bon
[t/
ha/y
r]
CO
2e
[t/ha
/yr]
Ste
mw
ood
Bar
k
Bra
nche
s
Leaf
Allocasuarina verticillata 2 4.2 1.43 0.7% 0.69 0.11 0.12 0.09
Eucalyptus diversifolia 35 6.2 8.67 80.5% 0.66 0.10 0.12 0.11
Eucalyptus incrassata 18 4.2 1.44 7.8% 0.54 0.08 0.18 0.20
Eucalyptus leptophylla 2 3.3 1.25 0.9% 0.48 0.07 0.21 0.24
Eucalyptus leucoxylon 2 7.3 22.97 5.2% 0.60 0.13 0.10 0.17
Eucalyptus platypus 1 5.2 7.80 2.0% 0.70 0.11 0.10 0.09
E. fasciculosa, A. pycnantha/ret., +5sp 465 113.4 7.0 3.0 16.9 636 WB 72 5.7 1.25 1.458 0.72 2.65 0.62 0.11 0.14 0.13 Acacia pycnantha 24 5.2 0.65 25.6% 0.61 0.09 0.18 0.11
Acacia retinodes 12 5.8 2.55 43.5% 0.70 0.11 0.11 0.08
Allocasuarina verticillata 5 4.9 0.81 7.2% 0.57 0.09 0.22 0.13
Eucalyptus camaldulensis 6 5.9 0.97 5.5% 0.45 0.16 0.17 0.22
Eucalyptus fasciculosa 19 6.2 0.99 13.6% 0.54 0.14 0.13 0.19
Eucalyptus leucoxylon 3 8.1 3.59 6.8% 0.59 0.13 0.10 0.17
Eucalyptus viminalis ssp. cygnetensis 1 8.2 3.53 2.2% 0.61 0.13 0.10 0.16
Melaleuca lanceolata 2 1.6 0.06 0.3% 0.39 0.08 0.33 0.20
E. fasciculosa, A. retinodes/pycn., +3sp 585 128.7 7.6 3.0 14.9 2010 BL 70 5.8 4.18 3.787 1.88 6.89 0.57 0.12 0.16 0.15 Acacia pycnantha 20 4.4 0.38 8.6% 0.35 0.05 0.43 0.16
Acacia retinodes 14 5.7 2.63 23.0% 0.64 0.10 0.16 0.10
Allocasuarina verticillata 4 4.9 0.82 2.7% 0.47 0.07 0.31 0.14
Eucalyptus fasciculosa 27 6.9 8.09 55.5% 0.59 0.13 0.11 0.17
Eucalyptus leucoxylon 3 8.9 13.60 11.7% 0.54 0.14 0.12 0.19
Melaleuca lanceolata 2 2.2 0.55 0.8% 0.46 0.09 0.28 0.18
E. fasciculosa, A. retinodes/pycn., +4sp 585 128.7 7.6 3.0 14.9 1372 WB 70 6.1 7.23 5.128 2.54 9.34 0.66 0.11 0.11 0.13 Acacia pycnantha 20 3.7 0.43 6.6% 0.38 0.06 0.40 0.16
Acacia retinodes 18 5.9 3.01 23.5% 0.67 0.10 0.13 0.09
Allocasuarina verticillata 3 3.6 0.20 0.5% 0.32 0.05 0.46 0.17
Corymbia maculata 9 9.4 10.86 13.6% 0.71 0.10 0.06 0.12
Eucalyptus fasciculosa 17 7.8 9.48 31.2% 0.63 0.12 0.09 0.15
Eucalyptus viminalis ssp. cygnetensis 2 8.0 3.14 1.1% 0.62 0.13 0.09 0.16
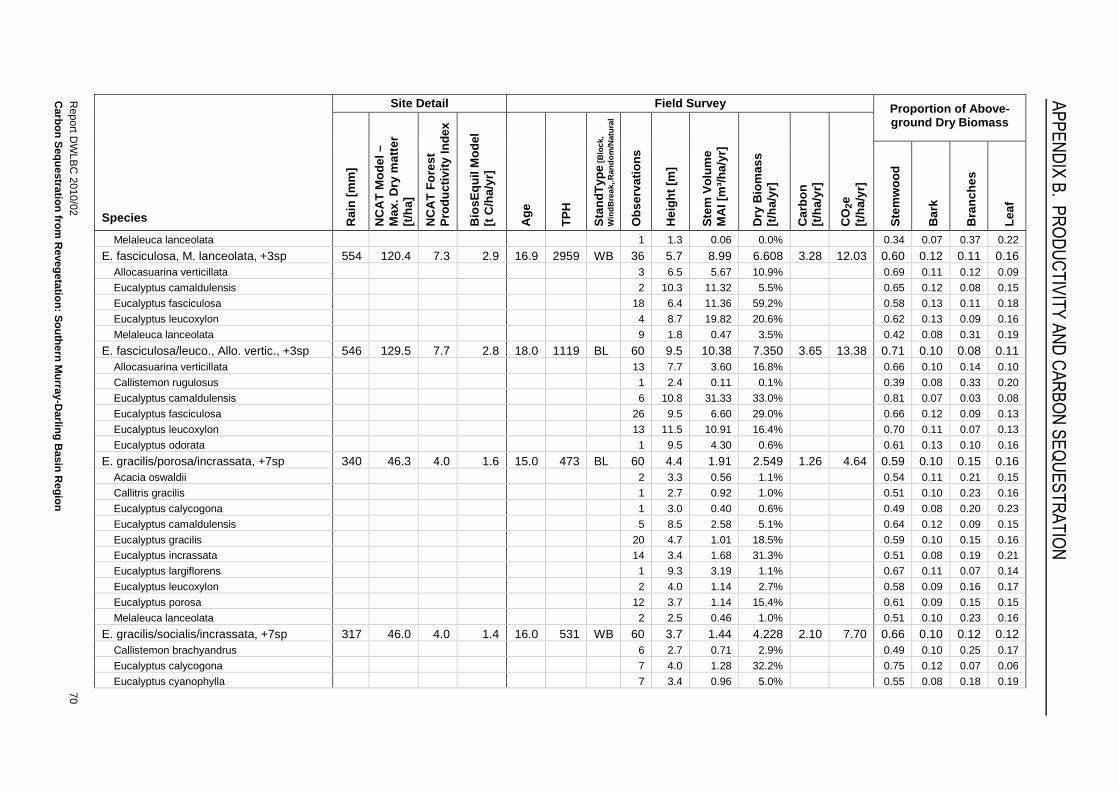
Report D
WLB
C 2010/02
70 C
arbon Sequestration from
Revegetation: S
outhern Murray-D
arling Basin R
egion
AP
PE
ND
IX B
. PR
OD
UC
TIV
ITY
AN
D C
AR
BO
N S
EQ
UE
ST
RA
TIO
N
Site Detail Field Survey Proportion of Above-ground Dry Biomass
Species Rai
n [m
m]
NC
AT
Mod
el –
M
ax. D
ry m
atte
r
[t/ha
]
NC
AT
For
est
Pro
duct
ivity
Inde
x
Bio
sEqu
il M
odel
[t
C/h
a/yr
]
Age
TP
H
Sta
ndT
ype
[Blo
ck,
Win
dBre
ak,.R
ando
m/N
atur
al
Obs
erva
tions
Hei
ght [
m]
Ste
m V
olum
e
MA
I [m
³/ha
/yr]
Dry
Bio
mas
s
[t/ha
/yr]
Car
bon
[t/
ha/y
r]
CO
2e
[t/ha
/yr]
Ste
mw
ood
Bar
k
Bra
nche
s
Leaf
Melaleuca lanceolata 1 1.3 0.06 0.0% 0.34 0.07 0.37 0.22
E. fasciculosa, M. lanceolata, +3sp 554 120.4 7.3 2.9 16.9 2959 WB 36 5.7 8.99 6.608 3.28 12.03 0.60 0.12 0.11 0.16 Allocasuarina verticillata 3 6.5 5.67 10.9% 0.69 0.11 0.12 0.09
Eucalyptus camaldulensis 2 10.3 11.32 5.5% 0.65 0.12 0.08 0.15
Eucalyptus fasciculosa 18 6.4 11.36 59.2% 0.58 0.13 0.11 0.18
Eucalyptus leucoxylon 4 8.7 19.82 20.6% 0.62 0.13 0.09 0.16
Melaleuca lanceolata 9 1.8 0.47 3.5% 0.42 0.08 0.31 0.19
E. fasciculosa/leuco., Allo. vertic., +3sp 546 129.5 7.7 2.8 18.0 1119 BL 60 9.5 10.38 7.350 3.65 13.38 0.71 0.10 0.08 0.11 Allocasuarina verticillata 13 7.7 3.60 16.8% 0.66 0.10 0.14 0.10
Callistemon rugulosus 1 2.4 0.11 0.1% 0.39 0.08 0.33 0.20
Eucalyptus camaldulensis 6 10.8 31.33 33.0% 0.81 0.07 0.03 0.08
Eucalyptus fasciculosa 26 9.5 6.60 29.0% 0.66 0.12 0.09 0.13
Eucalyptus leucoxylon 13 11.5 10.91 16.4% 0.70 0.11 0.07 0.13
Eucalyptus odorata 1 9.5 4.30 0.6% 0.61 0.13 0.10 0.16
E. gracilis/porosa/incrassata, +7sp 340 46.3 4.0 1.6 15.0 473 BL 60 4.4 1.91 2.549 1.26 4.64 0.59 0.10 0.15 0.16 Acacia oswaldii 2 3.3 0.56 1.1% 0.54 0.11 0.21 0.15
Callitris gracilis 1 2.7 0.92 1.0% 0.51 0.10 0.23 0.16
Eucalyptus calycogona 1 3.0 0.40 0.6% 0.49 0.08 0.20 0.23
Eucalyptus camaldulensis 5 8.5 2.58 5.1% 0.64 0.12 0.09 0.15
Eucalyptus gracilis 20 4.7 1.01 18.5% 0.59 0.10 0.15 0.16
Eucalyptus incrassata 14 3.4 1.68 31.3% 0.51 0.08 0.19 0.21
Eucalyptus largiflorens 1 9.3 3.19 1.1% 0.67 0.11 0.07 0.14
Eucalyptus leucoxylon 2 4.0 1.14 2.7% 0.58 0.09 0.16 0.17
Eucalyptus porosa 12 3.7 1.14 15.4% 0.61 0.09 0.15 0.15
Melaleuca lanceolata 2 2.5 0.46 1.0% 0.51 0.10 0.23 0.16
E. gracilis/socialis/incrassata, +7sp 317 46.0 4.0 1.4 16.0 531 WB 60 3.7 1.44 4.228 2.10 7.70 0.66 0.10 0.12 0.12 Callistemon brachyandrus 6 2.7 0.71 2.9% 0.49 0.10 0.25 0.17
Eucalyptus calycogona 7 4.0 1.28 32.2% 0.75 0.12 0.07 0.06
Eucalyptus cyanophylla 7 3.4 0.96 5.0% 0.55 0.08 0.18 0.19

Report D
WLB
C 2010/02
71 C
arbon Sequestration from
Revegetation: S
outhern Murray-D
arling Basin R
egion
AP
PE
ND
IX B
. PR
OD
UC
TIV
ITY
AN
D C
AR
BO
N S
EQ
UE
ST
RA
TIO
N
Site Detail Field Survey Proportion of Above-ground Dry Biomass
Species Rai
n [m
m]
NC
AT
Mod
el –
M
ax. D
ry m
atte
r
[t/ha
]
NC
AT
For
est
Pro
duct
ivity
Inde
x
Bio
sEqu
il M
odel
[t
C/h
a/yr
]
Age
TP
H
Sta
ndT
ype
[Blo
ck,
Win
dBre
ak,.R
ando
m/N
atur
al
Obs
erva
tions
Hei
ght [
m]
Ste
m V
olum
e
MA
I [m
³/ha
/yr]
Dry
Bio
mas
s
[t/ha
/yr]
Car
bon
[t/
ha/y
r]
CO
2e
[t/ha
/yr]
Ste
mw
ood
Bar
k
Bra
nche
s
Leaf
Eucalyptus gracilis 8 4.3 1.82 10.3% 0.59 0.09 0.16 0.16
Eucalyptus incrassata 7 4.0 1.02 5.0% 0.56 0.09 0.17 0.18
Eucalyptus leptophylla 6 3.6 1.59 5.7% 0.60 0.09 0.15 0.16
Eucalyptus odorata 4 3.4 1.31 3.8% 0.57 0.09 0.17 0.18
Eucalyptus oleosa 4 4.7 1.74 4.8% 0.60 0.09 0.15 0.15
Eucalyptus socialis 9 3.7 1.99 22.7% 0.65 0.10 0.13 0.13
Melaleuca lanceolata 2 2.7 1.33 1.6% 0.55 0.11 0.20 0.14
E. grandis/camaldulensis 478 102.2 6.5 2.9 21.9 1600 BL 36 18.9 14.83 8.152 4.04 14.84 0.67 0.11 0.07 0.14 Eucalyptus camaldulensis 12 17.9 13.46 28.9% 0.69 0.11 0.07 0.13
Eucalyptus grandis 24 19.3 14.64 68.1% 0.66 0.12 0.08 0.14
E. incrassata, Allo. verticillata, +12sp 369 51.3 4.2 1.8 16.0 908 BL 61 3.9 1.52 2.741 1.36 4.99 0.54 0.09 0.19 0.18 Acacia pycnantha 2 3.1 0.10 0.4% 0.28 0.04 0.51 0.17
Allocasuarina verticillata 10 4.9 0.63 6.7% 0.59 0.09 0.20 0.12
Banksia ornata 1 3.7 1.34 1.3% 0.49 0.10 0.24 0.16
Dodonaea viscosa 7 3.3 1.47 10.0% 0.51 0.10 0.23 0.16
Eucalyptus diversifolia 1 3.3 3.42 3.6% 0.60 0.09 0.15 0.15
Eucalyptus dumosa 2 4.5 1.87 4.1% 0.57 0.09 0.17 0.17
Eucalyptus incrassata 14 3.6 1.49 25.7% 0.51 0.08 0.20 0.22
Eucalyptus leptophylla 7 3.2 1.06 9.2% 0.50 0.08 0.20 0.22
Eucalyptus leucoxylon 2 5.5 4.72 4.3% 0.54 0.14 0.12 0.19
Eucalyptus odorata 2 4.9 1.70 3.7% 0.59 0.09 0.16 0.16
Eucalyptus oleosa 6 4.1 3.48 22.4% 0.59 0.09 0.16 0.16
Eucalyptus phenax 5 4.2 0.99 5.8% 0.54 0.08 0.18 0.20
Eucalyptus socialis 1 3.7 2.54 3.2% 0.51 0.08 0.20 0.22
Pittosporum phylliraeoides 1 3.0 0.36 0.4% 0.49 0.10 0.25 0.16
E. incrassata/A. ligulata, +8sp 399 49.1 4.1 1.3 15.0 1383 BL 60 3.2 0.97 1.896 0.94 3.45 0.47 0.08 0.24 0.20 Acacia ligulata 11 2.7 0.66 10.8% 0.49 0.10 0.25 0.16
Acacia rigens 2 2.4 0.59 1.8% 0.47 0.09 0.27 0.17
Allocasuarina muelleriana 9 2.4 0.49 7.4% 0.44 0.09 0.29 0.18

Report D
WLB
C 2010/02
72 C
arbon Sequestration from
Revegetation: S
outhern Murray-D
arling Basin R
egion
AP
PE
ND
IX B
. PR
OD
UC
TIV
ITY
AN
D C
AR
BO
N S
EQ
UE
ST
RA
TIO
N
Site Detail Field Survey Proportion of Above-ground Dry Biomass
Species Rai
n [m
m]
NC
AT
Mod
el –
M
ax. D
ry m
atte
r
[t/ha
]
NC
AT
For
est
Pro
duct
ivity
Inde
x
Bio
sEqu
il M
odel
[t
C/h
a/yr
]
Age
TP
H
Sta
ndT
ype
[Blo
ck,
Win
dBre
ak,.R
ando
m/N
atur
al
Obs
erva
tions
Hei
ght [
m]
Ste
m V
olum
e
MA
I [m
³/ha
/yr]
Dry
Bio
mas
s
[t/ha
/yr]
Car
bon
[t/
ha/y
r]
CO
2e
[t/ha
/yr]
Ste
mw
ood
Bar
k
Bra
nche
s
Leaf
Allocasuarina verticillata 3 5.3 1.51 7.3% 0.57 0.09 0.21 0.13
Callitris canescens 1 2.0 0.88 1.4% 0.46 0.09 0.28 0.18
Callitris gracilis 1 2.9 1.42 2.5% 0.51 0.08 0.27 0.14
Callitris verrucosa 7 3.2 0.82 12.0% 0.44 0.07 0.35 0.15
Dodonaea viscosa ssp. spathulata 4 3.1 0.40 2.7% 0.42 0.08 0.30 0.19
Eucalyptus incrassata 16 3.8 1.46 40.4% 0.47 0.08 0.21 0.24
Eucalyptus socialis 6 3.1 0.41 7.8% 0.41 0.06 0.24 0.29
E. incrassata/leptophylla, +7sp 357 49.9 4.2 1.9 28.9 2801 WB 60 3.9 1.16 2.214 1.10 4.03 0.48 0.08 0.21 0.23 Allocasuarina muelleriana 2 2.7 0.66 1.8% 0.47 0.09 0.27 0.17
Allocasuarina verticillata 1 5.5 0.53 0.8% 0.52 0.08 0.26 0.14
Eucalyptus brachycalyx 2 5.8 5.71 15.5% 0.58 0.09 0.16 0.17
Eucalyptus incrassata 37 4.0 0.93 50.3% 0.44 0.09 0.22 0.26
Eucalyptus leptophylla 11 4.2 2.14 36.0% 0.51 0.08 0.20 0.22
Melaleuca acuminata 1 2.3 0.11 0.2% 0.43 0.09 0.29 0.19
Melaleuca lanceolata 2 2.1 0.25 0.8% 0.39 0.08 0.33 0.20
Melaleuca uncinata 4 2.6 0.47 1.6% 0.45 0.09 0.28 0.18
E. largiflorens, Allo. verticillata, +3sp 322 77.7 5.4 1.8 17.0 1150 BL 60 4.7 1.25 1.271 0.63 2.31 0.48 0.13 0.19 0.19 Allocasuarina verticillata 17 3.8 0.23 12.1% 0.44 0.07 0.34 0.15
Callitris gracilis 3 3.3 0.34 2.7% 0.52 0.08 0.26 0.14
Eucalyptus camaldulensis 3 7.8 6.76 17.0% 0.61 0.13 0.09 0.16
Eucalyptus largiflorens 31 5.2 1.67 64.7% 0.46 0.16 0.16 0.22
Eucalyptus odorata 6 4.1 0.53 5.3% 0.37 0.17 0.21 0.25
E. largiflorens/cladocalyx 330 39.0 3.7 1.2 98.0 390 BL 60 7.0 0.28 0.189 0.09 0.34 0.58 0.14 0.11 0.17 Eucalyptus cladocalyx 8 6.7 0.23 11.2% 0.58 0.14 0.11 0.18
Eucalyptus largiflorens 52 7.0 0.28 88.9% 0.58 0.14 0.11 0.17
E. leucoxylon, +2sp 557 127.2 7.6 2.6 16.0 620 WB 36 5.4 2.37 1.903 0.94 3.46 0.61 0.13 0.11 0.15 Allocasuarina verticillata 4 5.8 2.13 17.9% 0.73 0.11 0.08 0.07
Eucalyptus leucoxylon 31 5.4 2.41 76.0% 0.57 0.14 0.11 0.18
Melaleuca brevifolia 1 2.4 0.47 1.2% 0.46 0.09 0.28 0.18

Report D
WLB
C 2010/02
73 C
arbon Sequestration from
Revegetation: S
outhern Murray-D
arling Basin R
egion
AP
PE
ND
IX B
. PR
OD
UC
TIV
ITY
AN
D C
AR
BO
N S
EQ
UE
ST
RA
TIO
N
Site Detail Field Survey Proportion of Above-ground Dry Biomass
Species Rai
n [m
m]
NC
AT
Mod
el –
M
ax. D
ry m
atte
r
[t/ha
]
NC
AT
For
est
Pro
duct
ivity
Inde
x
Bio
sEqu
il M
odel
[t
C/h
a/yr
]
Age
TP
H
Sta
ndT
ype
[Blo
ck,
Win
dBre
ak,.R
ando
m/N
atur
al
Obs
erva
tions
Hei
ght [
m]
Ste
m V
olum
e
MA
I [m
³/ha
/yr]
Dry
Bio
mas
s
[t/ha
/yr]
Car
bon
[t/
ha/y
r]
CO
2e
[t/ha
/yr]
Ste
mw
ood
Bar
k
Bra
nche
s
Leaf
E. leucoxylon, +3sp 403 117.9 7.2 2.9 33.0 527 BL 60 5.3 0.77 0.727 0.36 1.32 0.56 0.13 0.14 0.18 Eucalyptus fasciculosa 4 5.0 0.48 8.4% 0.55 0.08 0.18 0.19
Eucalyptus gracilis 3 5.2 0.14 1.1% 0.40 0.17 0.19 0.24
Eucalyptus leucoxylon 52 5.4 0.85 89.9% 0.56 0.13 0.13 0.18
Eucalyptus odorata 1 5.8 0.59 1.0% 0.56 0.14 0.11 0.18
E. leucoxylon, A. ligulata/brachy., +3sp 350 49.6 4.2 1.7 15.9 1471 BL 60 3.9 2.00 2.481 1.23 4.52 0.53 0.12 0.19 0.17 Acacia brachybotrya 11 1.8 0.45 6.5% 0.43 0.08 0.30 0.19
Acacia ligulata 22 2.9 1.98 63.7% 0.53 0.10 0.22 0.15
Callitris verrucosa 2 4.2 0.80 2.1% 0.53 0.08 0.25 0.13
Dodonaea viscosa 6 3.3 0.95 7.0% 0.45 0.09 0.28 0.18
Eucalyptus cladocalyx 1 7.4 2.28 1.1% 0.58 0.14 0.11 0.18
Eucalyptus leucoxylon 18 6.4 1.87 16.8% 0.55 0.14 0.12 0.19
E. leucoxylon, Cal. gracilis, +2sp 379 52.9 4.3 2.2 32.9 230 BL 60 7.8 1.51 1.310 0.65 2.38 0.75 0.12 0.05 0.08 Callitris gracilis 11 8.2 2.43 55.6% 0.81 0.12 0.03 0.04
Eucalyptus astringens 1 11.3 6.15 3.2% 0.80 0.08 0.04 0.09
Eucalyptus leptophylla 1 6.9 0.35 0.3% 0.54 0.15 0.12 0.19
Eucalyptus leucoxylon 47 7.7 1.18 39.6% 0.67 0.12 0.08 0.14
E. leucoxylon, Cal. gracilis, +8sp 379 54.4 4.4 2.2 32.9 242 BL 60 6.0 0.64 0.542 0.27 0.99 0.65 0.11 0.10 0.14 Allocasuarina verticillata 1 2.2 0.03 0.2% 0.39 0.06 0.38 0.16
Callitris gracilis 9 5.4 0.36 15.0% 0.69 0.11 0.11 0.09
Eucalyptus dumosa 1 5.5 0.34 0.9% 0.52 0.15 0.13 0.20
Eucalyptus fasciculosa 3 3.3 0.08 1.0% 0.43 0.16 0.17 0.23
Eucalyptus leucoxylon 36 6.9 0.87 69.7% 0.67 0.12 0.08 0.14
Eucalyptus microcarpa 1 7.2 0.77 1.4% 0.63 0.12 0.09 0.15
Eucalyptus oleosa 2 4.0 0.18 2.2% 0.53 0.08 0.19 0.20
Eucalyptus phenax 3 5.2 0.44 5.5% 0.57 0.11 0.15 0.17
Eucalyptus socialis 2 5.9 0.33 3.7% 0.57 0.09 0.17 0.17
Pittosporum phylliraeoides 2 3.2 0.04 0.6% 0.45 0.07 0.33 0.15
E. leucoxylon, Cal. gracilis, A. ret., +5sp 335 90.2 5.9 1.7 18.0 683 BL 60 9.9 7.01 5.233 2.60 9.53 0.73 0.11 0.07 0.10

Report D
WLB
C 2010/02
74 C
arbon Sequestration from
Revegetation: S
outhern Murray-D
arling Basin R
egion
AP
PE
ND
IX B
. PR
OD
UC
TIV
ITY
AN
D C
AR
BO
N S
EQ
UE
ST
RA
TIO
N
Site Detail Field Survey Proportion of Above-ground Dry Biomass
Species Rai
n [m
m]
NC
AT
Mod
el –
M
ax. D
ry m
atte
r
[t/ha
]
NC
AT
For
est
Pro
duct
ivity
Inde
x
Bio
sEqu
il M
odel
[t
C/h
a/yr
]
Age
TP
H
Sta
ndT
ype
[Blo
ck,
Win
dBre
ak,.R
ando
m/N
atur
al
Obs
erva
tions
Hei
ght [
m]
Ste
m V
olum
e
MA
I [m
³/ha
/yr]
Dry
Bio
mas
s
[t/ha
/yr]
Car
bon
[t/
ha/y
r]
CO
2e
[t/ha
/yr]
Ste
mw
ood
Bar
k
Bra
nche
s
Leaf
Acacia brachybotrya 1 3.5 1.51 0.8% 0.53 0.10 0.22 0.15
Acacia notabilis 1 3.0 0.21 0.1% 0.46 0.09 0.27 0.18
Acacia retinodes 8 8.1 5.68 19.6% 0.78 0.12 0.05 0.05
Callitris gracilis 15 6.4 2.80 25.2% 0.76 0.12 0.07 0.06
Eucalyptus dumosa 3 5.0 0.34 0.7% 0.44 0.09 0.22 0.25
Eucalyptus fasciculosa 4 12.5 8.40 6.4% 0.69 0.10 0.08 0.12
Eucalyptus largiflorens 1 15.0 3.77 0.7% 0.67 0.12 0.08 0.14
Eucalyptus leucoxylon 27 12.7 10.95 47.7% 0.71 0.10 0.06 0.12
E. leucoxylon/camaldulensis 315 40.0 3.7 1.3 9.0 384 BL 60 5.7 1.65 1.330 0.66 2.42 0.52 0.15 0.13 0.20 Eucalyptus camaldulensis 28 5.4 1.54 44.5% 0.51 0.15 0.14 0.20
Eucalyptus leucoxylon 32 5.9 1.74 55.3% 0.53 0.15 0.13 0.19
E. leucoxylon/camaldulensis, +1sp 376 48.6 4.1 1.6 24.0 300 WB 36 11.8 7.68 3.463 1.72 6.30 0.77 0.09 0.05 0.09 Eucalyptus camaldulensis 16 13.9 8.32 46.5% 0.77 0.09 0.05 0.10
Eucalyptus diversifolia 2 10.0 3.49 8.3% 0.71 0.11 0.10 0.09
Eucalyptus leucoxylon 18 10.1 7.24 42.8% 0.79 0.08 0.04 0.09
E. leucoxylon/cladocalyx/tricarpa, +2sp 478 106.5 6.7 2.9 20.9 1134 WB 36 12.4 9.35 6.075 3.01 11.06 0.67 0.11 0.09 0.13 Eucalyptus cladocalyx 10 14.3 9.93 23.4% 0.70 0.11 0.07 0.13
Eucalyptus leucoxylon 13 10.3 6.20 23.1% 0.62 0.13 0.10 0.16
Eucalyptus platypus 4 11.3 9.22 26.7% 0.66 0.10 0.12 0.11
Eucalyptus sideroxylon 3 15.3 21.65 14.6% 0.72 0.10 0.06 0.12
Eucalyptus tricarpa 6 12.8 6.79 10.9% 0.65 0.12 0.08 0.15
E. leucoxylon/gracilis/incrassata, +10sp 357 46.2 4.0 1.9 28.9 279 WB 60 6.4 1.19 1.457 0.72 2.65 0.67 0.11 0.11 0.12 Acacia calamifolia 2 5.2 0.41 1.5% 0.53 0.10 0.22 0.15
Allocasuarina verticillata 2 6.2 0.64 4.4% 0.77 0.12 0.06 0.06
Eucalyptus diversifolia 1 2.8 0.04 0.1% 0.33 0.05 0.27 0.35
Eucalyptus fasciculosa 5 6.6 0.62 2.2% 0.61 0.13 0.10 0.16
Eucalyptus gracilis 8 7.6 1.63 17.8% 0.68 0.11 0.11 0.11
Eucalyptus incrassata 8 5.2 0.58 7.0% 0.59 0.11 0.14 0.16
Eucalyptus leptophylla 3 6.0 0.95 3.8% 0.61 0.10 0.14 0.15

Report D
WLB
C 2010/02
75 C
arbon Sequestration from
Revegetation: S
outhern Murray-D
arling Basin R
egion
AP
PE
ND
IX B
. PR
OD
UC
TIV
ITY
AN
D C
AR
BO
N S
EQ
UE
ST
RA
TIO
N
Site Detail Field Survey Proportion of Above-ground Dry Biomass
Species Rai
n [m
m]
NC
AT
Mod
el –
M
ax. D
ry m
atte
r
[t/ha
]
NC
AT
For
est
Pro
duct
ivity
Inde
x
Bio
sEqu
il M
odel
[t
C/h
a/yr
]
Age
TP
H
Sta
ndT
ype
[Blo
ck,
Win
dBre
ak,.R
ando
m/N
atur
al
Obs
erva
tions
Hei
ght [
m]
Ste
m V
olum
e
MA
I [m
³/ha
/yr]
Dry
Bio
mas
s
[t/ha
/yr]
Car
bon
[t/
ha/y
r]
CO
2e
[t/ha
/yr]
Ste
mw
ood
Bar
k
Bra
nche
s
Leaf
Eucalyptus leucoxylon 8 9.0 1.56 8.4% 0.68 0.11 0.07 0.13
Eucalyptus oleosa 7 7.0 2.23 26.6% 0.70 0.11 0.10 0.09
Eucalyptus phenax 2 6.0 1.09 4.1% 0.64 0.10 0.13 0.13
Eucalyptus porosa 3 3.1 0.19 1.3% 0.51 0.09 0.19 0.21
Eucalyptus socialis 7 6.8 1.26 16.5% 0.64 0.10 0.13 0.13
Melaleuca lanceolata 4 3.5 0.45 3.1% 0.54 0.11 0.21 0.14
E. leucoxylon/largiflorens, +12sp 382 58.4 4.5 2.1 17.0 3441 BL 60 5.9 7.65 6.144 3.05 11.18 0.56 0.13 0.14 0.18 Acacia argyrophylla 3 3.7 2.34 3.5% 0.46 0.09 0.28 0.17
Callitris gracilis 5 3.9 1.52 4.0% 0.54 0.08 0.26 0.13
Eucalyptus brachycalyx 1 4.4 0.75 0.6% 0.38 0.06 0.25 0.31
Eucalyptus camaldulensis 1 5.3 2.06 0.6% 0.40 0.17 0.19 0.24
Eucalyptus fasciculosa 4 5.4 1.10 1.7% 0.41 0.13 0.21 0.25
Eucalyptus largiflorens 7 7.4 2.82 3.6% 0.59 0.13 0.11 0.17
Eucalyptus leptophylla 4 5.6 1.88 2.6% 0.37 0.17 0.21 0.25
Eucalyptus leucoxylon 24 7.1 14.80 65.0% 0.58 0.13 0.11 0.17
Eucalyptus oleosa 1 6.5 10.09 5.7% 0.50 0.08 0.20 0.22
Eucalyptus platypus 3 5.4 6.56 4.5% 0.50 0.15 0.14 0.20
Eucalyptus socialis 1 5.4 0.87 0.5% 0.51 0.08 0.20 0.22
Leptospermum laevigatum 3 2.5 0.49 0.8% 0.39 0.08 0.33 0.20
Melaleuca armillaris ssp. armillaris 1 4.8 1.98 0.8% 0.67 0.10 0.13 0.10
Melaleuca lanceolata 2 2.5 0.30 0.4% 0.34 0.07 0.38 0.22
E. leucoxylon/porosa/calycogona, +7sp 376 111.2 6.9 2.2 32.9 235 BL 60 7.2 1.04 0.962 0.48 1.75 0.69 0.11 0.09 0.11 Allocasuarina verticillata 9 5.4 0.48 10.8% 0.73 0.11 0.09 0.07
Callitris gracilis 4 7.3 0.82 7.9% 0.76 0.12 0.06 0.06
Eucalyptus calycogona 11 6.2 0.45 17.3% 0.64 0.11 0.12 0.13
Eucalyptus fasciculosa 1 10.0 1.19 1.2% 0.65 0.12 0.08 0.15
Eucalyptus gomphocephala 1 11.6 2.99 2.6% 0.71 0.11 0.06 0.12
Eucalyptus leucoxylon 16 7.9 1.46 21.6% 0.68 0.11 0.07 0.14
Eucalyptus porosa 14 8.1 1.29 26.2% 0.67 0.11 0.10 0.12
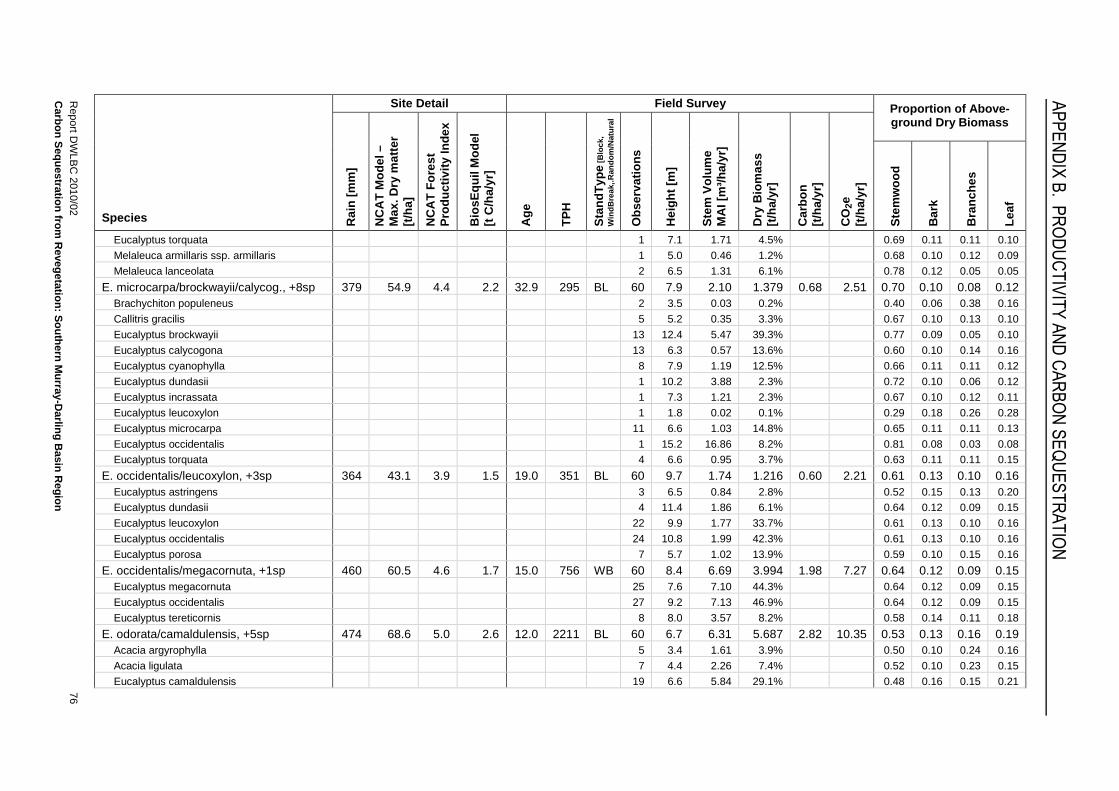
Report D
WLB
C 2010/02
76 C
arbon Sequestration from
Revegetation: S
outhern Murray-D
arling Basin R
egion
AP
PE
ND
IX B
. PR
OD
UC
TIV
ITY
AN
D C
AR
BO
N S
EQ
UE
ST
RA
TIO
N
Site Detail Field Survey Proportion of Above-ground Dry Biomass
Species Rai
n [m
m]
NC
AT
Mod
el –
M
ax. D
ry m
atte
r
[t/ha
]
NC
AT
For
est
Pro
duct
ivity
Inde
x
Bio
sEqu
il M
odel
[t
C/h
a/yr
]
Age
TP
H
Sta
ndT
ype
[Blo
ck,
Win
dBre
ak,.R
ando
m/N
atur
al
Obs
erva
tions
Hei
ght [
m]
Ste
m V
olum
e
MA
I [m
³/ha
/yr]
Dry
Bio
mas
s
[t/ha
/yr]
Car
bon
[t/
ha/y
r]
CO
2e
[t/ha
/yr]
Ste
mw
ood
Bar
k
Bra
nche
s
Leaf
Eucalyptus torquata 1 7.1 1.71 4.5% 0.69 0.11 0.11 0.10
Melaleuca armillaris ssp. armillaris 1 5.0 0.46 1.2% 0.68 0.10 0.12 0.09
Melaleuca lanceolata 2 6.5 1.31 6.1% 0.78 0.12 0.05 0.05
E. microcarpa/brockwayii/calycog., +8sp 379 54.9 4.4 2.2 32.9 295 BL 60 7.9 2.10 1.379 0.68 2.51 0.70 0.10 0.08 0.12 Brachychiton populeneus 2 3.5 0.03 0.2% 0.40 0.06 0.38 0.16
Callitris gracilis 5 5.2 0.35 3.3% 0.67 0.10 0.13 0.10
Eucalyptus brockwayii 13 12.4 5.47 39.3% 0.77 0.09 0.05 0.10
Eucalyptus calycogona 13 6.3 0.57 13.6% 0.60 0.10 0.14 0.16
Eucalyptus cyanophylla 8 7.9 1.19 12.5% 0.66 0.11 0.11 0.12
Eucalyptus dundasii 1 10.2 3.88 2.3% 0.72 0.10 0.06 0.12
Eucalyptus incrassata 1 7.3 1.21 2.3% 0.67 0.10 0.12 0.11
Eucalyptus leucoxylon 1 1.8 0.02 0.1% 0.29 0.18 0.26 0.28
Eucalyptus microcarpa 11 6.6 1.03 14.8% 0.65 0.11 0.11 0.13
Eucalyptus occidentalis 1 15.2 16.86 8.2% 0.81 0.08 0.03 0.08
Eucalyptus torquata 4 6.6 0.95 3.7% 0.63 0.11 0.11 0.15
E. occidentalis/leucoxylon, +3sp 364 43.1 3.9 1.5 19.0 351 BL 60 9.7 1.74 1.216 0.60 2.21 0.61 0.13 0.10 0.16 Eucalyptus astringens 3 6.5 0.84 2.8% 0.52 0.15 0.13 0.20
Eucalyptus dundasii 4 11.4 1.86 6.1% 0.64 0.12 0.09 0.15
Eucalyptus leucoxylon 22 9.9 1.77 33.7% 0.61 0.13 0.10 0.16
Eucalyptus occidentalis 24 10.8 1.99 42.3% 0.61 0.13 0.10 0.16
Eucalyptus porosa 7 5.7 1.02 13.9% 0.59 0.10 0.15 0.16
E. occidentalis/megacornuta, +1sp 460 60.5 4.6 1.7 15.0 756 WB 60 8.4 6.69 3.994 1.98 7.27 0.64 0.12 0.09 0.15 Eucalyptus megacornuta 25 7.6 7.10 44.3% 0.64 0.12 0.09 0.15
Eucalyptus occidentalis 27 9.2 7.13 46.9% 0.64 0.12 0.09 0.15
Eucalyptus tereticornis 8 8.0 3.57 8.2% 0.58 0.14 0.11 0.18
E. odorata/camaldulensis, +5sp 474 68.6 5.0 2.6 12.0 2211 BL 60 6.7 6.31 5.687 2.82 10.35 0.53 0.13 0.16 0.19 Acacia argyrophylla 5 3.4 1.61 3.9% 0.50 0.10 0.24 0.16
Acacia ligulata 7 4.4 2.26 7.4% 0.52 0.10 0.23 0.15
Eucalyptus camaldulensis 19 6.6 5.84 29.1% 0.48 0.16 0.15 0.21

Report D
WLB
C 2010/02
77 C
arbon Sequestration from
Revegetation: S
outhern Murray-D
arling Basin R
egion
AP
PE
ND
IX B
. PR
OD
UC
TIV
ITY
AN
D C
AR
BO
N S
EQ
UE
ST
RA
TIO
N
Site Detail Field Survey Proportion of Above-ground Dry Biomass
Species Rai
n [m
m]
NC
AT
Mod
el –
M
ax. D
ry m
atte
r
[t/ha
]
NC
AT
For
est
Pro
duct
ivity
Inde
x
Bio
sEqu
il M
odel
[t
C/h
a/yr
]
Age
TP
H
Sta
ndT
ype
[Blo
ck,
Win
dBre
ak,.R
ando
m/N
atur
al
Obs
erva
tions
Hei
ght [
m]
Ste
m V
olum
e
MA
I [m
³/ha
/yr]
Dry
Bio
mas
s
[t/ha
/yr]
Car
bon
[t/
ha/y
r]
CO
2e
[t/ha
/yr]
Ste
mw
ood
Bar
k
Bra
nche
s
Leaf
Eucalyptus fasciculosa 2 6.8 12.01 6.0% 0.50 0.15 0.14 0.20
Eucalyptus incrassata 2 5.6 1.34 1.7% 0.49 0.07 0.21 0.23
Eucalyptus leucoxylon 5 7.3 5.68 6.0% 0.56 0.14 0.12 0.18
Eucalyptus odorata 20 8.4 8.89 38.3% 0.55 0.14 0.12 0.18
E. odorata/incrassata, A. pycnantha, +8sp 443 61.1 4.7 1.8 19.0 2778 BL 68 5.4 5.77 7.664 3.80 13.95 0.63 0.11 0.13 0.14 Acacia microcarpa 3 2.8 1.17 1.2% 0.46 0.09 0.27 0.18
Acacia pycnantha 16 5.6 6.62 29.0% 0.74 0.11 0.09 0.06
Acacia retinodes 2 4.3 7.95 4.4% 0.73 0.11 0.09 0.07
Eucalyptus arenacea 4 6.0 12.23 10.6% 0.58 0.12 0.14 0.16
Eucalyptus diversifolia 1 4.7 4.08 1.5% 0.57 0.09 0.17 0.18
Eucalyptus incrassata 8 5.1 1.34 3.9% 0.45 0.10 0.21 0.24
Eucalyptus leptophylla 1 3.6 0.54 0.3% 0.36 0.06 0.26 0.32
Eucalyptus leucoxylon 1 5.5 1.43 0.3% 0.41 0.17 0.18 0.24
Eucalyptus odorata 21 5.1 5.67 31.0% 0.58 0.10 0.15 0.17
Eucalyptus porosa 6 6.2 4.80 10.1% 0.53 0.09 0.18 0.20
Eucalyptus viminalis ssp. cygnetensis 5 7.8 11.42 7.5% 0.59 0.13 0.11 0.18
E. oleosa/brachycalyx, +2sp 335 57.2 4.5 1.7 17.9 385 BL 60 5.1 1.31 1.533 0.76 2.79 0.59 0.09 0.15 0.17 Eucalyptus brachycalyx 20 4.7 0.65 27.5% 0.54 0.08 0.18 0.20
Eucalyptus cladocalyx 10 6.9 3.80 22.4% 0.68 0.11 0.07 0.14
Eucalyptus oleosa 21 5.0 0.98 40.4% 0.58 0.09 0.16 0.17
Eucalyptus socialis 9 4.4 0.49 9.4% 0.53 0.08 0.19 0.20
E. porosa, +2sp 403 117.5 7.1 2.9 33.0 4202 BL 60 3.3 1.08 2.191 1.09 3.99 0.44 0.10 0.22 0.25 Eucalyptus fasciculosa 7 3.1 0.56 4.2% 0.34 0.18 0.23 0.26
Eucalyptus leucoxylon 7 3.3 0.78 7.3% 0.34 0.14 0.24 0.28
Eucalyptus porosa 46 3.3 1.21 89.3% 0.45 0.09 0.22 0.25
E. porosa, Bursaria spinosa, +10sp 317 44.4 3.9 1.4 17.0 1590 WB 60 4.4 6.24 6.739 3.34 12.27 0.63 0.10 0.14 0.13 Acacia calamifolia 3 2.6 1.27 1.6% 0.50 0.10 0.24 0.16
Allocasuarina verticillata 2 3.8 0.22 0.4% 0.29 0.04 0.50 0.17
Bursaria spinosa 17 3.0 0.82 6.0% 0.48 0.09 0.26 0.16

Report D
WLB
C 2010/02
78 C
arbon Sequestration from
Revegetation: S
outhern Murray-D
arling Basin R
egion
AP
PE
ND
IX B
. PR
OD
UC
TIV
ITY
AN
D C
AR
BO
N S
EQ
UE
ST
RA
TIO
N
Site Detail Field Survey Proportion of Above-ground Dry Biomass
Species Rai
n [m
m]
NC
AT
Mod
el –
M
ax. D
ry m
atte
r
[t/ha
]
NC
AT
For
est
Pro
duct
ivity
Inde
x
Bio
sEqu
il M
odel
[t
C/h
a/yr
]
Age
TP
H
Sta
ndT
ype
[Blo
ck,
Win
dBre
ak,.R
ando
m/N
atur
al
Obs
erva
tions
Hei
ght [
m]
Ste
m V
olum
e
MA
I [m
³/ha
/yr]
Dry
Bio
mas
s
[t/ha
/yr]
Car
bon
[t/
ha/y
r]
CO
2e
[t/ha
/yr]
Ste
mw
ood
Bar
k
Bra
nche
s
Leaf
Callitris gracilis 6 3.8 1.26 4.3% 0.46 0.07 0.32 0.15
Eucalyptus camaldulensis 4 8.1 24.98 11.2% 0.75 0.09 0.05 0.11
Eucalyptus dumosa 3 5.9 16.98 19.9% 0.66 0.10 0.12 0.11
Eucalyptus fasciculosa 1 3.7 1.40 0.7% 0.55 0.08 0.18 0.19
Eucalyptus incrassata 4 4.1 2.86 5.5% 0.47 0.09 0.21 0.23
Eucalyptus leucoxylon 4 6.3 15.60 15.1% 0.65 0.11 0.11 0.13
Eucalyptus porosa 15 5.3 4.01 21.5% 0.63 0.10 0.13 0.14
Melaleuca lanceolata 1 2.9 0.86 0.3% 0.52 0.10 0.22 0.15
E. porosa/fasciculosa, Allo. verticill., +8sp 332 84.2 5.7 2.0 17.0 580 WB 61 4.7 0.97 1.118 0.55 2.04 0.56 0.12 0.16 0.17 Acacia brachybotrya 1 3.6 0.56 1.4% 0.49 0.10 0.25 0.16
Acacia ligulata 2 2.8 0.37 2.1% 0.44 0.09 0.29 0.19
Acacia pycnantha 2 3.4 0.12 0.9% 0.44 0.07 0.34 0.16
Allocasuarina verticillata 9 4.2 0.68 15.1% 0.62 0.10 0.17 0.11
Callitris verrucosa 5 4.1 0.53 7.0% 0.58 0.09 0.21 0.12
Eucalyptus fasciculosa 13 4.4 0.65 12.3% 0.47 0.14 0.16 0.22
Eucalyptus globulus 1 2.9 0.08 0.2% 0.25 0.18 0.28 0.28
Eucalyptus leucoxylon 8 6.9 2.05 18.9% 0.59 0.12 0.12 0.17
Eucalyptus odorata 5 4.7 0.64 4.2% 0.47 0.16 0.16 0.21
Eucalyptus porosa 14 5.3 1.46 39.4% 0.57 0.11 0.15 0.17
Melaleuca lanceolata 1 2.4 0.10 0.3% 0.42 0.08 0.31 0.19
E. porosa/gracilis/socialis, +3sp 321 43.8 3.9 1.7 14.0 1836 WB 60 4.3 2.58 5.730 2.84 10.43 0.53 0.08 0.19 0.20 Eucalyptus dumosa 6 3.7 1.27 9.2% 0.53 0.08 0.19 0.21
Eucalyptus gracilis 11 4.6 2.29 15.4% 0.50 0.08 0.20 0.22
Eucalyptus incrassata 12 3.6 1.42 11.2% 0.47 0.07 0.21 0.25
Eucalyptus leptophylla 8 4.6 3.07 14.5% 0.52 0.08 0.19 0.21
Eucalyptus porosa 11 4.8 4.54 28.9% 0.59 0.09 0.16 0.17
Eucalyptus socialis 12 4.1 2.40 20.1% 0.51 0.08 0.19 0.21
E. porosa/leucoxylon, +5sp 339 45.1 4.0 1.6 12.0 447 WB 63 3.5 1.82 2.852 1.41 5.19 0.59 0.09 0.16 0.16 Acacia calamifolia 1 2.2 0.37 0.4% 0.43 0.08 0.30 0.19

Report D
WLB
C 2010/02
79 C
arbon Sequestration from
Revegetation: S
outhern Murray-D
arling Basin R
egion
AP
PE
ND
IX B
. PR
OD
UC
TIV
ITY
AN
D C
AR
BO
N S
EQ
UE
ST
RA
TIO
N
Site Detail Field Survey Proportion of Above-ground Dry Biomass
Species Rai
n [m
m]
NC
AT
Mod
el –
M
ax. D
ry m
atte
r
[t/ha
]
NC
AT
For
est
Pro
duct
ivity
Inde
x
Bio
sEqu
il M
odel
[t
C/h
a/yr
]
Age
TP
H
Sta
ndT
ype
[Blo
ck,
Win
dBre
ak,.R
ando
m/N
atur
al
Obs
erva
tions
Hei
ght [
m]
Ste
m V
olum
e
MA
I [m
³/ha
/yr]
Dry
Bio
mas
s
[t/ha
/yr]
Car
bon
[t/
ha/y
r]
CO
2e
[t/ha
/yr]
Ste
mw
ood
Bar
k
Bra
nche
s
Leaf
Acacia pycnantha 6 2.6 0.25 1.7% 0.52 0.08 0.26 0.13
Eucalyptus camaldulensis ssp. obtusa 3 6.0 1.31 1.6% 0.56 0.14 0.12 0.18
Eucalyptus cladocalyx 1 7.2 9.30 2.7% 0.69 0.11 0.07 0.13
Eucalyptus leucoxylon 20 3.6 1.03 19.7% 0.58 0.09 0.16 0.17
Eucalyptus platypus 2 4.8 4.73 8.3% 0.67 0.10 0.12 0.11
Eucalyptus porosa 30 3.1 2.30 67.7% 0.58 0.09 0.17 0.17
E. viminalis ssp. cygnetensis, +9sp 443 62.5 4.7 1.8 19.0 1990 BL 67 7.9 15.80 12.352 6.13 22.48 0.68 0.11 0.09 0.12 Acacia pycnantha 14 5.2 6.31 16.1% 0.70 0.11 0.11 0.09
Acacia retinodes 3 8.0 10.79 5.5% 0.75 0.11 0.07 0.07
Eucalyptus arenacea 4 9.2 42.19 11.0% 0.68 0.11 0.07 0.14
Eucalyptus diversifolia 2 5.2 1.97 0.9% 0.57 0.09 0.17 0.17
Eucalyptus incrassata 2 4.3 1.48 0.5% 0.45 0.11 0.20 0.25
Eucalyptus leucoxylon 8 10.5 24.12 12.2% 0.69 0.11 0.07 0.13
Eucalyptus obliqua 2 7.5 11.84 1.6% 0.66 0.12 0.08 0.14
Eucalyptus odorata 8 6.4 9.86 13.2% 0.63 0.10 0.14 0.14
Eucalyptus porosa 6 6.4 16.62 16.1% 0.68 0.11 0.11 0.10
Eucalyptus viminalis ssp. cygnetensis 18 10.6 18.87 21.7% 0.69 0.11 0.07 0.13
M. lanceolata, +7sp 375 116.1 7.1 2.2 16.9 807 WB 36 4.8 3.15 4.165 2.07 7.58 0.59 0.11 0.16 0.14 Allocasuarina verticillata 2 3.9 1.58 3.5% 0.64 0.10 0.16 0.10
Eucalyptus fasciculosa 2 4.2 0.54 0.9% 0.38 0.17 0.20 0.25
Eucalyptus incrassata 5 5.9 2.90 11.0% 0.59 0.11 0.14 0.16
Eucalyptus leptophylla 6 7.2 5.42 25.3% 0.65 0.11 0.11 0.12
Eucalyptus phenax 6 5.4 2.19 11.0% 0.58 0.11 0.14 0.16
Eucalyptus platypus 1 3.7 3.36 4.4% 0.54 0.08 0.18 0.19
Melaleuca acuminata 1 3.3 1.76 1.7% 0.56 0.11 0.19 0.14
Melaleuca lanceolata 13 3.6 2.90 37.4% 0.56 0.11 0.19 0.14

Report D
WLB
C 2010/02
80 C
arbon Sequestration from
Revegetation: S
outhern Murray-D
arling Basin R
egion
AP
PE
ND
IX B
. PR
OD
UC
TIV
ITY
AN
D C
AR
BO
N S
EQ
UE
ST
RA
TIO
N
Site Detail Field Survey Proportion of Above-ground Dry Biomass
Species Rai
n [m
m]
NC
AT
Mod
el –
M
ax. D
ry m
atte
r
[t/ha
]
NC
AT
For
est
Pro
duct
ivity
Inde
x
Bio
sEqu
il M
odel
[t
C/h
a/yr
]
Age
TP
H
Sta
ndT
ype
[Blo
ck,
Win
dBre
ak,.R
ando
m/N
atur
al
Obs
erva
tions
Hei
ght [
m]
Ste
m V
olum
e
MA
I [m
³/ha
/yr]
Dry
Bio
mas
s
[t/ha
/yr]
Car
bon
[t/
ha/y
r]
CO
2e
[t/ha
/yr]
Ste
mw
ood
Bar
k
Bra
nche
s
Leaf
Single species Acacia calamifolia 371 50.6 4.2 2.1 6.0 756 RN 6 2.0 1.62 2.810 1.39 5.11 0.48 0.09 0.26 0.17 Acacia hakeoides 371 51.9 4.3 2.1 3.7 752 RN 6 1.3 0.90 2.570 1.27 4.68 0.50 0.10 0.24 0.16 Acacia hakeoides 371 51.6 4.2 2.1 2.0 2226 RN 6 1.2 2.46 5.291 2.62 9.63 0.39 0.08 0.33 0.20 Acacia Iigulata 261 22.9 3.0 1.1 13.8 1111 BL 30 2.7 1.71 2.916 1.45 5.31 0.52 0.10 0.23 0.15 Acacia ligulata 261 22.9 3.0 1.1 13.8 484 BL 3 3.2 1.01 2.073 1.03 3.77 0.53 0.10 0.22 0.15 Acacia montana 371 51.3 4.2 2.1 6.0 738 RN 6 2.1 1.82 3.117 1.55 5.67 0.49 0.10 0.25 0.17 Acacia myrtifolia 585 129.2 7.7 3.0 8.0 114 WB 6 1.5 0.03 0.135 0.07 0.25 0.43 0.09 0.29 0.19 Acacia pycnantha 340 44.9 4.0 1.9 13.8 2778 BL 60 3.7 2.70 5.053 2.51 9.20 0.56 0.09 0.23 0.13 Acacia rigens 357 48.9 4.1 1.9 31.2 197 BL 3 2.8 0.28 0.430 0.21 0.78 0.54 0.11 0.21 0.15 Callitris verrucosa 357 46.7 4.0 1.9 31.3 140 BL 3 4.6 0.51 0.729 0.36 1.33 0.58 0.11 0.18 0.13 Casuarina cunninghamiana 585 121.8 7.3 3.0 14.9 828 BL 36 6.3 1.59 2.682 1.33 4.88 0.65 0.10 0.15 0.10 Dodonaea viscosa 261 22.9 3.0 1.1 13.8 2251 BL 30 2.6 0.85 1.596 0.79 2.91 0.44 0.09 0.29 0.18 Dodonaea viscosa 261 22.9 3.0 1.1 13.8 633 BL 3 2.9 0.65 1.122 0.56 2.04 0.48 0.09 0.26 0.17 Eucalyptus baxteri 585 130.9 7.7 3.0 8.0 226 WB 6 3.6 0.69 0.835 0.41 1.52 0.52 0.15 0.13 0.20 Eucalyptus camaldulensis 362 49.1 4.1 1.7 7.6 142 BL 30 5.7 0.58 0.495 0.25 0.90 0.50 0.15 0.14 0.21 Eucalyptus camaldulensis 460 65.4 4.9 1.7 10.0 580 WB 36 13.8 31.37 14.142 7.01 25.74 0.75 0.09 0.05 0.10 Eucalyptus camaldulensis 376 48.5 4.1 1.6 15.0 995 BL 36 15.5 16.45 8.382 4.16 15.26 0.70 0.11 0.07 0.13 Eucalyptus camaldulensis 376 50.8 4.2 1.6 7.7 1027 WB 30 9.6 9.78 6.549 3.25 11.92 0.59 0.13 0.10 0.17 Eucalyptus camaldulensis 460 65.4 4.9 1.7 10.7 513 WB 33 11.4 10.62 5.717 2.84 10.41 0.68 0.11 0.07 0.14 Eucalyptus cladocalyx 557 131.6 7.8 2.6 17.9 2277 BL 36 13.0 15.43 9.126 4.53 16.61 0.64 0.12 0.09 0.15 Eucalyptus cladocalyx 460 64.2 4.8 1.7 14.0 778 BL 36 10.2 5.98 3.708 1.84 6.75 0.62 0.13 0.09 0.16 Eucalyptus cladocalyx 460 71.9 5.1 1.7 6.7 419 WB 30 5.0 1.79 1.558 0.77 2.84 0.49 0.15 0.15 0.21 Eucalyptus cladocalyx 460 68.6 5.0 1.7 6.7 789 WB 30 6.4 4.02 3.378 1.68 6.15 0.50 0.15 0.14 0.20 Eucalyptus cladocalyx 339 39.5 3.7 1.2 98.0 281 BL 36 10.7 0.49 0.275 0.14 0.50 0.66 0.12 0.08 0.14 Eucalyptus cladocalyx 465 120.2 7.3 3.0 14.9 502 BL 36 12.1 3.45 2.195 1.09 3.99 0.61 0.13 0.10 0.16 Eucalyptus cladocalyx 460 65.1 4.8 1.7 6.7 793 BL 33 5.6 2.82 2.539 1.26 4.62 0.48 0.16 0.15 0.21 Eucalyptus cladocalyx 460 64.8 4.8 1.7 10.7 440 BL 30 14.9 13.44 6.757 3.35 12.30 0.71 0.10 0.06 0.12
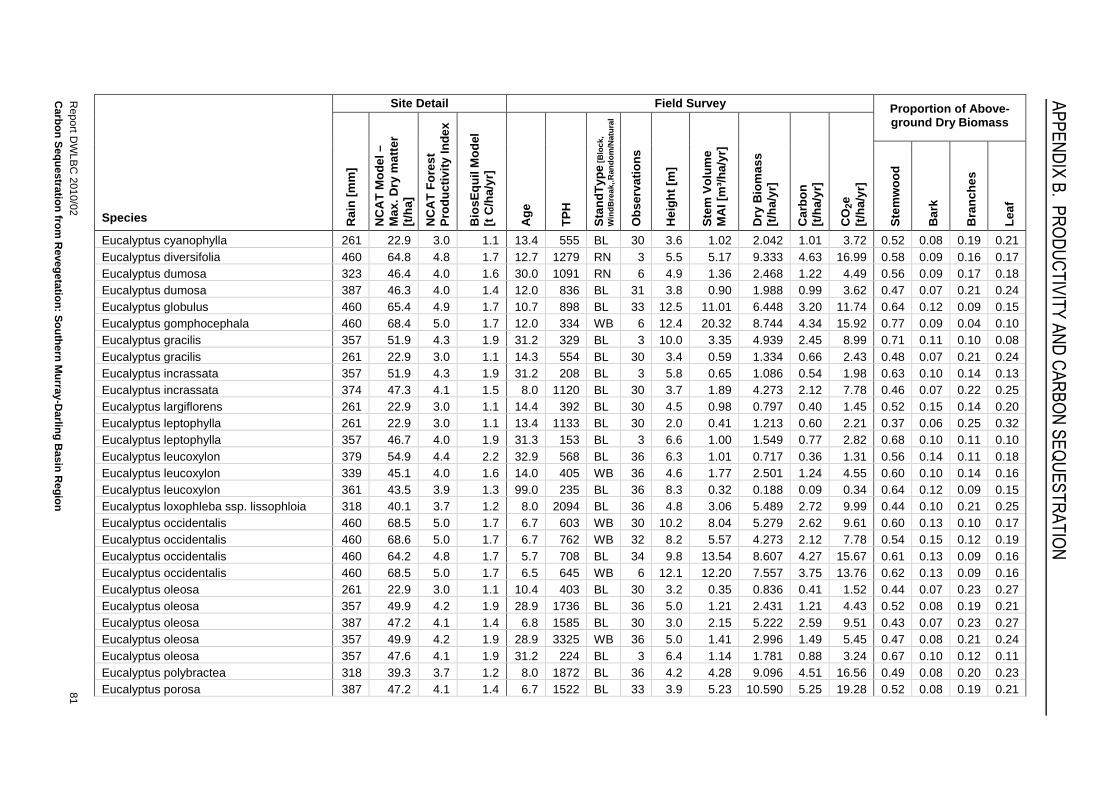
Report D
WLB
C 2010/02
81 C
arbon Sequestration from
Revegetation: S
outhern Murray-D
arling Basin R
egion
AP
PE
ND
IX B
. PR
OD
UC
TIV
ITY
AN
D C
AR
BO
N S
EQ
UE
ST
RA
TIO
N
Site Detail Field Survey Proportion of Above-ground Dry Biomass
Species Rai
n [m
m]
NC
AT
Mod
el –
M
ax. D
ry m
atte
r
[t/ha
]
NC
AT
For
est
Pro
duct
ivity
Inde
x
Bio
sEqu
il M
odel
[t
C/h
a/yr
]
Age
TP
H
Sta
ndT
ype
[Blo
ck,
Win
dBre
ak,.R
ando
m/N
atur
al
Obs
erva
tions
Hei
ght [
m]
Ste
m V
olum
e
MA
I [m
³/ha
/yr]
Dry
Bio
mas
s
[t/ha
/yr]
Car
bon
[t/
ha/y
r]
CO
2e
[t/ha
/yr]
Ste
mw
ood
Bar
k
Bra
nche
s
Leaf
Eucalyptus cyanophylla 261 22.9 3.0 1.1 13.4 555 BL 30 3.6 1.02 2.042 1.01 3.72 0.52 0.08 0.19 0.21 Eucalyptus diversifolia 460 64.8 4.8 1.7 12.7 1279 RN 3 5.5 5.17 9.333 4.63 16.99 0.58 0.09 0.16 0.17 Eucalyptus dumosa 323 46.4 4.0 1.6 30.0 1091 RN 6 4.9 1.36 2.468 1.22 4.49 0.56 0.09 0.17 0.18 Eucalyptus dumosa 387 46.3 4.0 1.4 12.0 836 BL 31 3.8 0.90 1.988 0.99 3.62 0.47 0.07 0.21 0.24 Eucalyptus globulus 460 65.4 4.9 1.7 10.7 898 BL 33 12.5 11.01 6.448 3.20 11.74 0.64 0.12 0.09 0.15 Eucalyptus gomphocephala 460 68.4 5.0 1.7 12.0 334 WB 6 12.4 20.32 8.744 4.34 15.92 0.77 0.09 0.04 0.10 Eucalyptus gracilis 357 51.9 4.3 1.9 31.2 329 BL 3 10.0 3.35 4.939 2.45 8.99 0.71 0.11 0.10 0.08 Eucalyptus gracilis 261 22.9 3.0 1.1 14.3 554 BL 30 3.4 0.59 1.334 0.66 2.43 0.48 0.07 0.21 0.24 Eucalyptus incrassata 357 51.9 4.3 1.9 31.2 208 BL 3 5.8 0.65 1.086 0.54 1.98 0.63 0.10 0.14 0.13 Eucalyptus incrassata 374 47.3 4.1 1.5 8.0 1120 BL 30 3.7 1.89 4.273 2.12 7.78 0.46 0.07 0.22 0.25 Eucalyptus largiflorens 261 22.9 3.0 1.1 14.4 392 BL 30 4.5 0.98 0.797 0.40 1.45 0.52 0.15 0.14 0.20 Eucalyptus leptophylla 261 22.9 3.0 1.1 13.4 1133 BL 30 2.0 0.41 1.213 0.60 2.21 0.37 0.06 0.25 0.32 Eucalyptus leptophylla 357 46.7 4.0 1.9 31.3 153 BL 3 6.6 1.00 1.549 0.77 2.82 0.68 0.10 0.11 0.10 Eucalyptus leucoxylon 379 54.9 4.4 2.2 32.9 568 BL 36 6.3 1.01 0.717 0.36 1.31 0.56 0.14 0.11 0.18 Eucalyptus leucoxylon 339 45.1 4.0 1.6 14.0 405 WB 36 4.6 1.77 2.501 1.24 4.55 0.60 0.10 0.14 0.16 Eucalyptus leucoxylon 361 43.5 3.9 1.3 99.0 235 BL 36 8.3 0.32 0.188 0.09 0.34 0.64 0.12 0.09 0.15 Eucalyptus loxophleba ssp. lissophloia 318 40.1 3.7 1.2 8.0 2094 BL 36 4.8 3.06 5.489 2.72 9.99 0.44 0.10 0.21 0.25 Eucalyptus occidentalis 460 68.5 5.0 1.7 6.7 603 WB 30 10.2 8.04 5.279 2.62 9.61 0.60 0.13 0.10 0.17 Eucalyptus occidentalis 460 68.6 5.0 1.7 6.7 762 WB 32 8.2 5.57 4.273 2.12 7.78 0.54 0.15 0.12 0.19 Eucalyptus occidentalis 460 64.2 4.8 1.7 5.7 708 BL 34 9.8 13.54 8.607 4.27 15.67 0.61 0.13 0.09 0.16 Eucalyptus occidentalis 460 68.5 5.0 1.7 6.5 645 WB 6 12.1 12.20 7.557 3.75 13.76 0.62 0.13 0.09 0.16 Eucalyptus oleosa 261 22.9 3.0 1.1 10.4 403 BL 30 3.2 0.35 0.836 0.41 1.52 0.44 0.07 0.23 0.27 Eucalyptus oleosa 357 49.9 4.2 1.9 28.9 1736 BL 36 5.0 1.21 2.431 1.21 4.43 0.52 0.08 0.19 0.21 Eucalyptus oleosa 387 47.2 4.1 1.4 6.8 1585 BL 30 3.0 2.15 5.222 2.59 9.51 0.43 0.07 0.23 0.27 Eucalyptus oleosa 357 49.9 4.2 1.9 28.9 3325 WB 36 5.0 1.41 2.996 1.49 5.45 0.47 0.08 0.21 0.24 Eucalyptus oleosa 357 47.6 4.1 1.9 31.2 224 BL 3 6.4 1.14 1.781 0.88 3.24 0.67 0.10 0.12 0.11 Eucalyptus polybractea 318 39.3 3.7 1.2 8.0 1872 BL 36 4.2 4.28 9.096 4.51 16.56 0.49 0.08 0.20 0.23 Eucalyptus porosa 387 47.2 4.1 1.4 6.7 1522 BL 33 3.9 5.23 10.590 5.25 19.28 0.52 0.08 0.19 0.21

Report D
WLB
C 2010/02
82 C
arbon Sequestration from
Revegetation: S
outhern Murray-D
arling Basin R
egion
AP
PE
ND
IX B
. PR
OD
UC
TIV
ITY
AN
D C
AR
BO
N S
EQ
UE
ST
RA
TIO
N
Site Detail Field Survey Proportion of Above-ground Dry Biomass
Species Rai
n [m
m]
NC
AT
Mod
el –
M
ax. D
ry m
atte
r
[t/ha
]
NC
AT
For
est
Pro
duct
ivity
Inde
x
Bio
sEqu
il M
odel
[t
C/h
a/yr
]
Age
TP
H
Sta
ndT
ype
[Blo
ck,
Win
dBre
ak,.R
ando
m/N
atur
al
Obs
erva
tions
Hei
ght [
m]
Ste
m V
olum
e
MA
I [m
³/ha
/yr]
Dry
Bio
mas
s
[t/ha
/yr]
Car
bon
[t/
ha/y
r]
CO
2e
[t/ha
/yr]
Ste
mw
ood
Bar
k
Bra
nche
s
Leaf
Eucalyptus salmonophoia 330 39.4 3.7 1.2 95.0 942 BL 36 18.7 2.37 1.259 0.62 2.29 0.69 0.11 0.07 0.13 Eucalyptus socialis 357 46.2 4.0 1.9 26.1 444 WB 3 5.6 1.82 3.795 1.88 6.91 0.66 0.10 0.12 0.11 Eucalyptus socialis 261 22.9 3.0 1.1 14.4 1936 BL 30 3.8 3.11 6.306 3.13 11.48 0.52 0.08 0.19 0.21 Eucalyptus viminalis 460 64.8 4.8 1.7 5.7 526 BL 33 10.0 10.83 6.600 3.27 12.01 0.63 0.13 0.09 0.16 Eucalyptus viminalis ssp. cygnetensis 460 64.8 4.8 1.7 9.0 561 BL 36 12.9 13.04 7.103 3.52 12.93 0.68 0.11 0.07 0.14 Eucalyptus viminalis ssp. cygnetensis 585 130.9 7.7 3.0 9.0 597 WB 6 7.6 5.80 4.599 2.28 8.37 0.62 0.13 0.09 0.16 Leptospermum continentale 546 141.2 8.2 2.8 7.0 339 RN 6 1.6 0.06 0.213 0.11 0.39 0.38 0.08 0.34 0.21 Melaleuca armillaris ssp. armillaris 362 51.3 4.2 2.0 11.0 122 WB 6 2.7 0.44 1.063 0.53 1.93 0.71 0.11 0.10 0.08 Melaleuca lanceolata 357 47.4 4.1 1.9 31.2 458 BL 3 4.0 1.56 2.257 1.12 4.11 0.58 0.11 0.18 0.13 Melaleuca lanceolata 261 22.9 3.0 1.1 12.5 319 BL 30 2.2 0.38 0.641 0.32 1.17 0.49 0.10 0.25 0.17 Melaleuca uncinata 357 50.6 4.2 1.9 16.3 585 WB 3 2.3 0.36 0.651 0.32 1.18 0.46 0.09 0.27 0.18 Pittosporum phylliraeoides 357 47.6 4.1 1.9 16.2 460 WB 3 2.5 0.38 0.657 0.33 1.20 0.48 0.09 0.26 0.17 Senna artemisioides ssp. coriacea 261 22.9 3.0 1.1 13.4 2254 BL 30 1.7 0.44 0.917 0.45 1.67 0.40 0.08 0.32 0.20 Senna artemisioides ssp. coriacea 261 22.9 3.0 1.1 13.4 3518 BL 3 1.6 0.70 1.481 0.73 2.70 0.40 0.08 0.32 0.20 Viminaria juncea 639 88.8 5.9 2.8 7.0 1057 RN 6 4.7 2.61 4.663 2.31 8.49 0.59 0.09 0.20 0.12

APPENDIX C. NATIONAL CARBON ACCOUNTING TOOLBOX SIMULATIONS
Report DWLBC 2010/02 Carbon Sequestration from Revegetation: Southern Murray-Darling Basin Region
83
APPENDIX C. NATIONAL CARBON ACCOUNTING TOOLBOX SIMULATIONS
Use of NCAT FullCAM Software
The first step to creating a simulation or model run with the FullCAM Version 3.1 software is to select the main menu item ‘Document’ and ‘New Plot’ to open the FullCAM Plot module and create a new plot file. Subsequent saving of the Plot file is done via the main menu ‘File’ and ‘Save’ or ‘Save As’ options. When all Plot module data entry is finalised the user can then select ‘Simulate’ and ‘Run Plot Simulation’ to complete the FullCAM simulation and view and/or store model outputs. Plot files can later be stored, edited and re-run with new parameter, species and location settings.
The FullCAM Plot module is designed around eleven windows accessible via menu buttons at the top of screen. The first of these is 'About' (Figure 21) where you define the name of the model run, include descriptive information and set model editing security for the file. The second window, 'Configuration' (Figure 22) requires the user to make a number of choices. At this point under the plot category 'Multilayer forest system' is chosen as the most representative of the options available. The others being: Forest mulch; Forest soil; Agricultural mulch; Agricultural soil; Multilayer agricultural system and; Multilayer mixed (forestry and agricultural) system. Soil and mineral information is included in the model run and set the tree production method to 'Tree yield formula'.
The third window, 'Timing' (Figure 23) allow the entry of the planting date and the end date for the simulation of the site. Once that was done users proceeded to the fourth window, 'Data Builder' (Figure 24). The 'Data Builder' box must be ticked at this point so that the program can access the internet to download the required default parameter sets. The latitude and longitude of the site is now required prior to downloading the spatial data relating to soils, climate and productivity indicies.

APPENDIX C. NATIONAL CARBON ACCOUNTING TOOLBOX SIMULATIONS
Report DWLBC 2010/02 Carbon Sequestration from Revegetation: Southern Murray-Darling Basin Region
84
Figure 21. The ‘About’ window designed for naming, notes and security.
Figure 22. The ‘Configuration’ window offers the opportunity to tailor the model outputs to pre-existing criteria.

APPENDIX C. NATIONAL CARBON ACCOUNTING TOOLBOX SIMULATIONS
Report DWLBC 2010/02 Carbon Sequestration from Revegetation: Southern Murray-Darling Basin Region
85
Figure 23. The 'Timing' window allows the entry of the planting date and the end date for the simulation of the site
Figure 24. The 'Data Builder' window allows the entry of location data and the down loading of data specific to that site and the system chosen for that site.

APPENDIX C. NATIONAL CARBON ACCOUNTING TOOLBOX SIMULATIONS
Report DWLBC 2010/02 Carbon Sequestration from Revegetation: Southern Murray-Darling Basin Region
86
Once the spatial data for the latitude and longitude had been down loaded the default soil for each site is accepted. Users then proceed to the 'Tree species groups' box and select 'Mixed species environmental planting' from the drop down list, as the most appropriate category. In every case examined the list consisted of: 'Eucalyptus globulus (Tasmanian blue gum)'; 'Local species' and; 'Pinus radiata (Radiata Pine)' as well as the 'Mixed species environmental planting' group used in simulations.
With the 'Mixed species environmental planting' group selected the list of tree-species/regimes for this species-group are downloaded. At this point the most appropriate of the available selections (All; InitPlant; Low; 1970-on; WindrowBurn; StripCult; NoPPWC; NoHarvest; NoPrune; NoFert; 2099-recommended) was used for each subsequent simulation, downloading the information for this species.
In the next step the 'Site' window (Figure 25) is chosen. Within this window the 'Area' option a point model is selected rather than indicating a specific area. No other input is required at this point but the simulation's calculated 'Maximum Aboveground Biomass [tdm/ha]' figure is displayed.
The next window is 'Trees' (Figure 26). Under 'Select a Species' selections closely matched choices from 'Data Builder' (Mixed species environmental planting [1970-present All initial Plantation low: on-commercial planting; No prune] 2099). At this point it is interesting to note that the carbon percentages under the plant menu in 'Properties of the Species' are exactly the same as those for Eucalyptus globulus (Figure 27). However, the stem density of the mixed species environmental plantings is set at the single figure of 750.0 kg dm/m³ (Figure 28) (for E. globulus it varies over time, reflecting the amount of extra research data available for that individual species.) No modifications from the default settings found in the 'Soil' and; 'Initial Condition' windows were made.
Within the following 'Events' (Figure 29) window the planting date was inserted for the simulation and ensured that no other events were listed. At this point the 'Output Window' (Figure 30) and selected all outputs generated by the simulation. The simulation is completed by selecting “Run Plot Simulation (F9)” option on the main menu before reviewing and saving the outputs (Figure 31). The last window, 'Explorer' can be ignored as it is simply a navigation tool.
This step-by-step guide of how the FullCAM Version 3.1 software has been used to simulate carbon balances for our survey sites provides an overview of the core considerations to be addressed in FullCAM evaluations of revegetation sites. For further information and explanation of the many ways the program can be used readers should review the Department of Climate Change website where the complete FullCAM Carbon Accounting Model (Version 3.1) User Manual (Richards et al. 2005) can be accessed.

APPENDIX C. NATIONAL CARBON ACCOUNTING TOOLBOX SIMULATIONS
Report DWLBC 2010/02 Carbon Sequestration from Revegetation: Southern Murray-Darling Basin Region
87
Figure 25. The ‘Site’ window allows an area or point model to be set and displays the ‘Maximum Aboveground Biomass’ figure generated for the specific site.
Figure 26. The 'Trees' window displays the selected planting system and gives access to other background plant and growth data.

APPENDIX C. NATIONAL CARBON ACCOUNTING TOOLBOX SIMULATIONS
Report DWLBC 2010/02 Carbon Sequestration from Revegetation: Southern Murray-Darling Basin Region
88
Figure 27. The 'Plant Properties' sub-window displays the carbon and turnover percentages used by the model and is accessed via the plant button on the ‘Trees; window.
Figure 28. The 'Stem Density’ sub-window displays the wood density figures used by the model and is accessed via the plant button on the 'Plant Properties' sub-window.

APPENDIX C. NATIONAL CARBON ACCOUNTING TOOLBOX SIMULATIONS
Report DWLBC 2010/02 Carbon Sequestration from Revegetation: Southern Murray-Darling Basin Region
89
Figure 29. The ‘Events’ window allows the user to enter and model the effects of external events on production.
Figure 30. The ‘Output’ window allows the user to tailor the types of outputs delivered by the model.
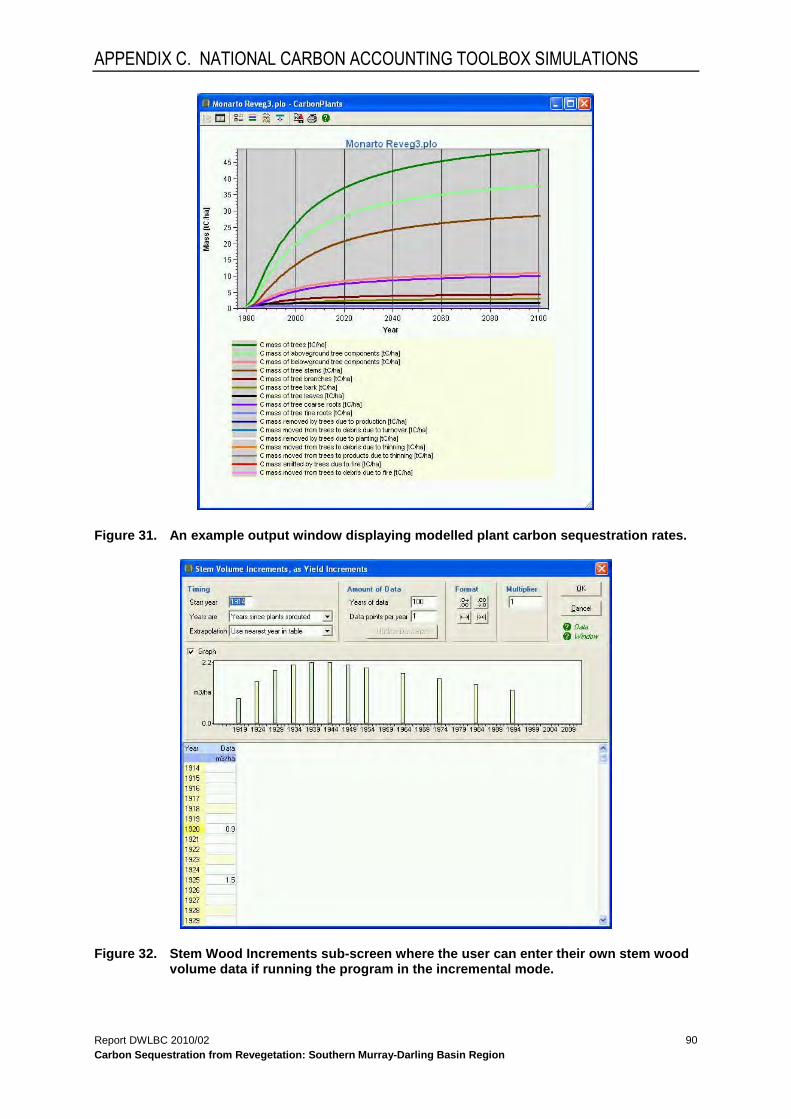
APPENDIX C. NATIONAL CARBON ACCOUNTING TOOLBOX SIMULATIONS
Report DWLBC 2010/02 Carbon Sequestration from Revegetation: Southern Murray-Darling Basin Region
90
Figure 31. An example output window displaying modelled plant carbon sequestration rates.
Figure 32. Stem Wood Increments sub-screen where the user can enter their own stem wood volume data if running the program in the incremental mode.

GLOSSARY
Report DWLBC 2010/02 Carbon Sequestration from Revegetation: Southern Murray-Darling Basin Region
91
GLOSSARY
3-PG — a growth model for predicting forest growth (Physiological Processes Predicting Growth model of Landsberg & Waring (1997).
ArcGIS — a geographic information system developed by ESRI that integrates hardware, software, and data for capturing, managing, analysing, and displaying all forms of spatial information.
BiosEquil (BE) — a steady state biosphere model used for the assessment of carbon, nitrogen, phosphorus and water in Australian landscapes (Raupach et al. 2001).
CABALA — a growth model for predicting forest growth (CArbon BALAnce; Battaglia et al. 2004).
CO2e — carbon dioxide equivalent.
CRC — Cooperative Research Centre.
CSIRO — Commonwealth Scientific and Industrial Research Organisation (Australian Federal Government)/
DCC — Department of Climate Change. (Australian Federal Government)
DEH — Department for Environment and Heritage (Government of South Australia).
DWLBC — Department of Water, Land and Biodiversity Conservation (Government of South Australia).
FPI — Forest Productivity Index. An index of climate and soil parameters that influence forest productivity. (Landsberg & Kesteven 2001).
FullCAM — fully integrated Carbon Accounting Model for estimating and predicting all biomass, litter and soil carbon pools in forest and agricultural systems (Department of Climate Change 2005).
GIS — Geographic Information System; computer software linking geographic data (for example land parcels) to textual data (soil type, land value, ownership). It allows for a range of features, from simple map production to complex data analysis.
IBRA — Interim Biogeographic Regions of Australia; regions containing similar landscapes, climates and native ecosystems (Department of the Environment, Water, Heritage and the Arts 2009).
Indigenous species — a species that occurs naturally in a region.
MAI — mean annual increment; typically used to describe growth of stemwood volumes in forestry.
Model — a conceptual or mathematical means of understanding elements of the real world that allows for predictions of outcomes given certain conditions.
NCAT — National Carbon Accounting Toolbox. A Model that estimate changes in emissions resulting from changed land management actions, such as forest establishment and harvesting, soil cultivation, fire management and fertiliser application (Richards et al. 2005).
NRM — Natural Resources Management; all activities that involve the use or development of natural resources and/or that impact on the state and condition of natural resources, whether positively or negatively.
PIRSA — Primary Industries and Resources South Australia (Government of South Australia).
RIRDC — Rural Industries Research and Development Corporation (Australian Federal Government).
TFL — Trees For Life is a not-for-profit South Australian community environmental organisation and significant provider of native plant for revegetation in the state.
tph — trees per hectare; average number of trees planted per unit area.

GLOSSARY
Report DWLBC 2010/02 Carbon Sequestration from Revegetation: Southern Murray-Darling Basin Region
92

REFERENCES
Report DWLBC 2010/02 Carbon Sequestration from Revegetation: Southern Murray-Darling Basin Region
93
REFERENCES
Andrew MH, Noble IR, Lange RT (1979) A non-destructive method for estimating the weight of forage on shrubs. Australian Rangeland Journal 1, 225-231.
Australian Greenhouse Office & Murray Darling Basin Commission (2001) The contribution of mid to low rainfall forestry and agroforestry to greenhouse and natural resource management outcomes. Australian Greenhouse Office, Canberra.
Bartle J, Shea S (2002) Development of mallee as a large-scale crop for the wheatbelt of WA. In ‘Proceedings Australian Forest Growers 2002 National Conference: Private Forestry - Sustainable accountable and profitable. 13-16 October 2002, Albany.’
Bartle J, Olsen G, Cooper D, Hobbs T (2007) Scale of biomass production from new woody crops for salinity control in dryland agriculture in Australia. International Journal of Global Energy Issues 27, 115-137.
Battaglia M, Sands PJ, White D, Mummery D (2004) CABALA: a linked carbon, water and nitrogen model of forest growth for silvicultural decision support. Forest Ecology and Management 193, 251-282.
Bennell M, Hobbs TJ, Ellis M (2008) Evaluating agroforestry species and industries for lower rainfall regions of southeastern Australia. FloraSearch 1a. Report to the Joint Venture Agroforestry Program (JVAP) and Future Farm Industries CRC. Publication No. 07/079. Rural Industry Research and Development Corporation, Canberra.
Boardman R (1992) A study of the growth and yield of selected plantations of native trees growing in the semiarid zone of South Australia and their capacity to sequester atmospheric carbon dioxide. SA Woods and Forests, Department of Primary Industries, Adelaide.
BRS (2004) Integrated Vegetation Cover 2004. Australian Natural Resources Data Library. Bureau of Rural Sciences, Canberra. http://adl.brs.gov.au/mapserv/intveg/
Crossman ND, Summers DM, Bryan BA (2010) Opportunities and threats for South Australia’s agricultural landscapes under a carbon market. CSIRO Client Report. CSIRO, Adelaide.
CSIRO Land & Water (2001) Mean annual and monthly rainfall (mm). http://adl.brs.gov.au/ADLsearch/index.cfm?fuseaction=FULL_METADATA&inanzlic=ANZCW1202000117. Accessed 20/5/09.
Department of Climate Change (2008) Carbon Pollution Reduction Scheme Green Paper, July 2008. Commonwealth of Australia, Canberra.
Department of Climate Change (2009) National Carbon Accounting Toolbox (NCAT) http://www.climatechange.gov.au/government/initiatives/ncat.aspx. Accessed 18/6/09.
Department of the Environment, Water, Heritage and the Arts (2009) http://www.environment.gov.au/parks/nrs/science/bioregion-framework/ibra/index.html. Accessed 18/6/09.
Emes J, Holman E, Tiller J (2006) Re-establishment of vegetation in South Australia 2005. Report 2006/11. SA Department of Water, Land and Biodiversity Conservation, Adelaide.

REFERENCES
Report DWLBC 2010/02 Carbon Sequestration from Revegetation: Southern Murray-Darling Basin Region
94
Enecon Pty Ltd (2001) Integrated tree processing of mallee eucalypts. Publication No. 01/160. Rural Industries Research and Development Corporation, Canberra.
ESRI (2009) ArcGIS. 9.3 computer software. ESRI, Redlands, California, USA.
Fairlamb J, Bulman P (1994) Farm Tree Improvement Project. SA Department of Primary Industries, Adelaide.
Gifford R (2000a) Carbon Content of Woody Roots: Revised Analysis and a Comparison with Woody Shoot Components. National Carbon Accounting System. Technical Report No. 7 (Revision 1). Australian Greenhouse Office, Canberra.
Gifford R (2000b) Carbon Contents of Above-Ground Tissues of Forest and Woodland Trees. National Carbon Accounting System. Technical Report No. 22. Australian Greenhouse Office, Canberra.
Grierson P, Williams K, Adams M (2000) Review of Unpublished Biomass-Related Information: Western Australia, South Australia, New South Wales and Queensland. National Carbon Accounting System, Technical Report No. 25. Australian Greenhouse Office, Canberra.
Hague J, Freischmidt G, Pongracic S, Fung P (2002) Six best bet products from agroforestry biomass grown in low rainfall areas. Publication No. 09/055. Rural Industries Research and Development Corporation, Canberra.
Harper RJ, Beck AC, Ritson P, Hill MJ, Mitchell CD, Barrett DJ, Smettem KRJ, Mann SS (2007) The potential of greenhouse sinks to underwrite improved land management. Ecological Engineering 29, 329-341.
Harwood CE, Bird R, Butcher T, Bush DJ, Jackson T, Johnson D, Stackpole D, Underdown M (2005) Australian Low Rainfall Tree Improvement Group (ALRTIG), Update of hardwood breeding strategies. Publication No. 05/023. Rural Industry Research and Development Corporation, Canberra.
Harwood CE, Bird R, Bulman P, Bush DJ, Mazanec R, Stackpole D (2001) Compendium of hardwood breeding strategies. Publication No. 01/100. Rural Industry Research and Development Corporation, Canberra.
Hobbs TJ, Bennell M, Bartle J [eds] (2009a) Developing species for woody biomass crops in lower rainfall southern Australia. FloraSearch 3a. Report to the Joint Venture Agroforestry Program (JVAP) and Future Farm Industries CRC. Publication No. 09/043. Rural Industry Research and Development Corporation, Canberra.
Hobbs TJ, Crossman N, Ostendorf B, Bryan B, Lyle G, Neumann C (2009b) Opportunities for carbon sequestration from revegetation in South Australia. Conference Paper. Surveying & Spatial Sciences Institute Biennial International Conference, 28 September – 2 October 2009, Adelaide Convention Centre, Adelaide, Australia
Hobbs TJ [ed] (2009) Regional industry potential for woody biomass crops in lower rainfall southern Australia. FloraSearch 3c. Report to the Joint Venture Agroforestry Program (JVAP) and Future Farm Industries CRC. Publication No. 09/045. Rural Industry Research and Development Corporation, Canberra.

REFERENCES
Report DWLBC 2010/02 Carbon Sequestration from Revegetation: Southern Murray-Darling Basin Region
95
Hobbs TJ, Georgaras PA, Tucker M, Neumann C, Bennell M (2006) Woody biomass productivity and potential biomass industries in the Upper South East. A report for the SA Centre for Natural Resource Management. FloraSearch Series. SA Water, Land and Biodiversity Conservation, Adelaide.
Hobbs TJ, Bennell M (2005) Plant biometrics and biomass productivity in the River Murray Dryland Corridor. A report for the SA Centre for Natural Resource Management. FloraSearch Series. SA Water, Land and Biodiversity Conservation, Adelaide.
Ilic J, Boland D, McDonald M, Downes G, Blakemore P (2000) Wood Density Phase 1 - State of Knowledge. Technical Report No.18. CSIRO Forestry and Forest Products, Canberra.
Kiddle G, Boardman R, van der Sommen F (1987) A study of growth and characteristics of woodlot and amenity tree plantings in semi-arid rural South Australia. Forestry SA, Adelaide.
Landsberg J, Kesteven J (2001) Spatial estimation of plant productivity. Chapter 2. In ‘Biomass Estimation Approaches for Assessment of Stocks and Stock Change’. (Richards G ed). National Carbon Accounting System Technical Report No. 27. Australian Greenhouse Office, Canberra.
Landsberg JJ, Waring RH (1997) A generalised model of forest productivity using simplified concepts of radiation-use efficiency, carbon balance and partitioning. Forest Ecology and Management 95, 209-228
Lyle G, Clarke K, Hobbs T, Kilpatrick A, Summers D, Ostendorf B (2009) Land use planning for sustainable production systems. SA Department of Water, Land and Biodiversity Conservation, Adelaide.
Neumann CR, Hobbs TJ, Tucker M 2010, Carbon Sequestration from Revegetation: River Murray Forest Region. Government of South Australia, through Department of Water, Land and Biodiversity Conservation, Adelaide
Olsen G, Cooper D, Carslake J, Bartle JR, Huxtable D (2004) Search Project - Terminating Report, Vols. 1-3, NHT Project 973849, WA Department of Conservation and Land Management, Perth.
Polglase P, Paul K, Hawkins C, Siggins A, Turner J, Booth T, Crawford D, Jovanovic T, Hobbs T, Opie K, Almeida A, Carter J (2008) Regional opportunities for agroforestry. A report for the Rural Industry Research and Development Corporation /Land and Water Australia / Forest and Wood Products Australia / Murray-Darling Basin Commission, Joint Venture Agroforestry Program. Publication No 08/176 .Rural Industry Research and Development Corporation, Canberra.
Raupach MR, Kirby JM, Barrett DJ, Briggs PR (2001) Balances of Water, Carbon, Nitrogen and Phosphorus in Australian Landscapes: (1) Project Description and Results. Technical Report 40/01. CSIRO Land and Water, Canberra. http://adl.brs.gov.au/ADLsearch/index.cfm?fuseaction=FULL_METADATA&inanzlic=ANZCW1202000100
Richards G, Evans D, Reddin A, Leitch J (2005) The FullCAM Carbon Accounting Model (Version 3.0) User Manual, Australian Greenhouse Office, Canberra. http://www.climatechange.gov.au/ncas/reports/fullcam-usermanual.html. Accessed 15/4/09.
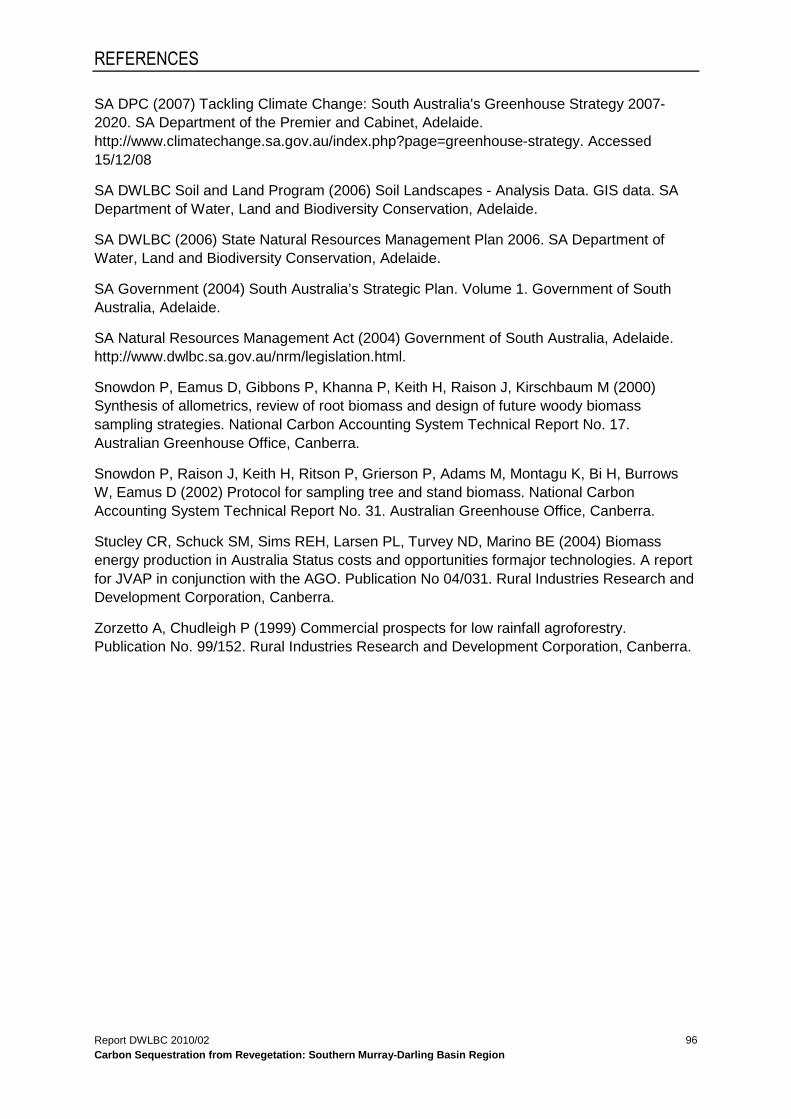
REFERENCES
Report DWLBC 2010/02 Carbon Sequestration from Revegetation: Southern Murray-Darling Basin Region
96
SA DPC (2007) Tackling Climate Change: South Australia's Greenhouse Strategy 2007-2020. SA Department of the Premier and Cabinet, Adelaide. http://www.climatechange.sa.gov.au/index.php?page=greenhouse-strategy. Accessed 15/12/08
SA DWLBC Soil and Land Program (2006) Soil Landscapes - Analysis Data. GIS data. SA Department of Water, Land and Biodiversity Conservation, Adelaide.
SA DWLBC (2006) State Natural Resources Management Plan 2006. SA Department of Water, Land and Biodiversity Conservation, Adelaide.
SA Government (2004) South Australia’s Strategic Plan. Volume 1. Government of South Australia, Adelaide.
SA Natural Resources Management Act (2004) Government of South Australia, Adelaide. http://www.dwlbc.sa.gov.au/nrm/legislation.html.
Snowdon P, Eamus D, Gibbons P, Khanna P, Keith H, Raison J, Kirschbaum M (2000) Synthesis of allometrics, review of root biomass and design of future woody biomass sampling strategies. National Carbon Accounting System Technical Report No. 17. Australian Greenhouse Office, Canberra.
Snowdon P, Raison J, Keith H, Ritson P, Grierson P, Adams M, Montagu K, Bi H, Burrows W, Eamus D (2002) Protocol for sampling tree and stand biomass. National Carbon Accounting System Technical Report No. 31. Australian Greenhouse Office, Canberra.
Stucley CR, Schuck SM, Sims REH, Larsen PL, Turvey ND, Marino BE (2004) Biomass energy production in Australia Status costs and opportunities formajor technologies. A report for JVAP in conjunction with the AGO. Publication No 04/031. Rural Industries Research and Development Corporation, Canberra.
Zorzetto A, Chudleigh P (1999) Commercial prospects for low rainfall agroforestry. Publication No. 99/152. Rural Industries Research and Development Corporation, Canberra.

