dynamic capacity augmentation strategies for …
TRANSCRIPT
CIE42 Proceedings, 16-18 July 2012, Cape Town, South Africa © 2012 CIE & SAIIE
293-1
DYNAMIC CAPACITY AUGMENTATION STRATEGIES FOR HEALTH MANPOWER SUPPLY UNDER VARIOUS DEMAND PATTERNS
M. Mutingi1,2* and C. Mbohwa2
1Department of Mechanical Engineering University of Botswana, Botswana [email protected]
2Department of Quality and Operations Management
University of Johannesburg, South Africa [email protected]
ABSTRACT
Health manpower systems continually face rapidly changing manpower demand due to ever-changing health needs all over the globe. Capacity planning for health manpower supply is a strategic issue with increasing complexity and importance. Under dynamic demand patterns characterised by complex dynamic properties, investment in capacity build-up has to be done more cautiously than ever. Otherwise, the necessary human capital growth is retarded or the training system is left with unutilized capacity. This is a great challenge to decision makers when developing manpower supply strategies in turbulent environments. This paper employs the concepts of system dynamics to simulate the impact of different health manpower demand patterns on supply capacity augmentation. Using a typical health manpower system, capacity augmentation policies are simulated against known demand patterns such as steady, ever-growing and fluctuating demand. The simulation model provides an experimental tool, which can be used to evaluate alternative long-term policies based on demand-supply planning reliability as a performance measure. Validation and numerical experimentations further demonstrate the effectiveness of the proposed model, providing sound managerial insights. The approach is useful in designing decision support systems for capacity augmentation in health manpower systems.
* Corresponding Author
CIE42 Proceedings, 16-18 July 2012, Cape Town, South Africa © 2012 CIE & SAIIE
293-2
1 INTRODUCTION
Decision making on capacity augmentation in the education and training system to meet the manpower demand requirements in the health labour market is complex [1-3]. Health manpower systems are characterised by high variability of manpower demand patterns caused by ever-changing health needs in different societies. Flows of health personnel across the globe are a common occurrence, leading to imbalances in various health labour markets. This has imposed many challenges in manpower demand-supply planning. Various demand patterns have been observed. For instance, demand may be steadily growing in response to rising health needs. This may arise from a steadily growing population. Though capacity augmentation for this scenario appears simple, the inherent dynamics involving manpower demand-supply factors is not trivial. Robust strategies have to be formulated in anticipation of costly imbalances in the labour market.
Sudden rises in health manpower demand is a common occurrence in many labour markets experiencing sudden health needs. This scenario may be caused by sharp changes in health needs due to epidemic outbreaks or sudden outflow of healthcare personnel to other labour markets. However, sudden rises may come in different shapes, including s-shape which somewhat rise smoothly up to a maximum level, and a step shape which comes in form of a very sharp and sudden increase in demand. In response to the anticipated sudden rises in demand, the decision maker has to take a cautious approach to capacity build up in order avoid over- or under-supply of health human resources.
In addition to the above, demand may be fluctuating around a known average over the planning period. In the presence of a fluctuating demand, capacity augmentation should be taken carefully since imbalances are quite likely. The magnitude of rises and falls determines the magnitude of capacity build up. For instance, in the presence of negligible fluctuations, demand may be assumed constant and an average supply capacity may simply be adopted. However, the dynamics and interactions of other demand-supply factors may be a challenge in practice. In the real-world, a combination of factors often leads to demand patterns with hybrid behaviours. These demand patterns are a combination of the basic demand patterns outlined above, which adds to the dynamic complexities of the problem. System dynamics (SD), originated by Forrester [4], is a viable tool in representing the dynamics of capacity building in healthcare manpower supply.
SD is an effective simulation tool that has been applied to numerous problems such as corporate planning and policy design, supply chain management, public management and policy evaluation, economic behaviour, and healthcare modelling [5, 6]. However, the application of SD in healthcare manpower systems has been very limited. SD simulation models have been used for the analysis of personnel policies affecting army personnel training [7, 8]. Park, et al. [9] presented a dynamic manpower forecasting model for information security in industry, emphasising on the integrated dynamics of demand and supply, feedback, delay, and flexible saturation point. Hafeez and Abdelmeguid [10] proposed a dynamic model to illustrate the dynamic relationship between recruitment, training, and skills at firm level. Though there is increased awareness of the dynamic aspects in manpower demand-supply planning, little attention has been given to capacity augmentation in healthcare manpower systems under various demand patterns.
In view of the above demand-supply planning complexities, system dynamics is a viable tool for capturing the interactive dynamics between manpower supply and demand in order to design capacity augmentation strategies from a systems perspective. In this research, we use the system dynamics modelling formalism to build an effective decision support tool for capacity building under different demand patterns over a medium to long-term planning horizon. Thus, the overall purpose of this research is to establish a system dynamics simulation model for capacity augmentation for a healthcare manpower system. In this development, the objectives of this study are as follows:

CIE42 Proceedings, 16-18 July 2012, Cape Town, South Africa © 2012 CIE & SAIIE
293-3
(i) to identify basic capacity augmentation strategies that highlight the necessity of dynamic capacity build-up;
(ii) to identify the major capacity augmentation strategies and the context of their application in terms of demand types; and,
(iii) to highlight important managerial insights that can facilitate robust demand-supply planning in health manpower systems
The rest of this paper is as follows: Section 2 briefly explains the problem statement. The proposed system dynamics simulation model is developed in Section 3. This is followed by simulation experiments in Section 4. Section 5 provides the simulation results and discussion. Conclusions and further research are provided in Section 6.
2 PROBLEM DESCRIPTION
The health manpower system simulated in this study comprises three integrated sectors, namely, training or education sector, the labour market, and the capacity planning sector. Information from the labour market triggers admission of requisite students’ cohorts, and the necessary augmentation of admission capacity of the training system. Accordingly, the training system then supplies trained graduates with a training delay time. Additional sources of manpower come from global talent. As a result, active vacancies are depleted by manpower supply from the training system and from foreign talent. These vacancies arise from replacement demand which result from attrition and new demand which emanates from market growth. The status of the labour market, defined by comparative levels of vacancy and unemployment rates, provides useful information for capacity augmentation heuristic policies.
The overall goal of the entire system is to match manpower demand and supply under assumed demand patterns. To achieve this goal, heuristic supply policies must be designed according to the information fed back from the labour market. Manpower training and supply capacity is the focal point of this study, thus we examine effective ways to dynamically determine their appropriate levels from a systems view. In a steady-state environment, this may be quite simple to determine. On the contrary, it is quite complex in a rapidly changing environment, hence, it is important to examine the supply capacity planning policy from the dynamic viewpoint. In order to gain a full understanding of the implications of capacity planning policies in the health manpower system, two limiting hypothetical conditions are assumed: (a) unlimited capacity, where the desired capacity is readily available, and (b) limited capacity with no capacity augmentation. Under these two conditions the decision maker obtains a useful insight into the limits of variation in the performance of the system.
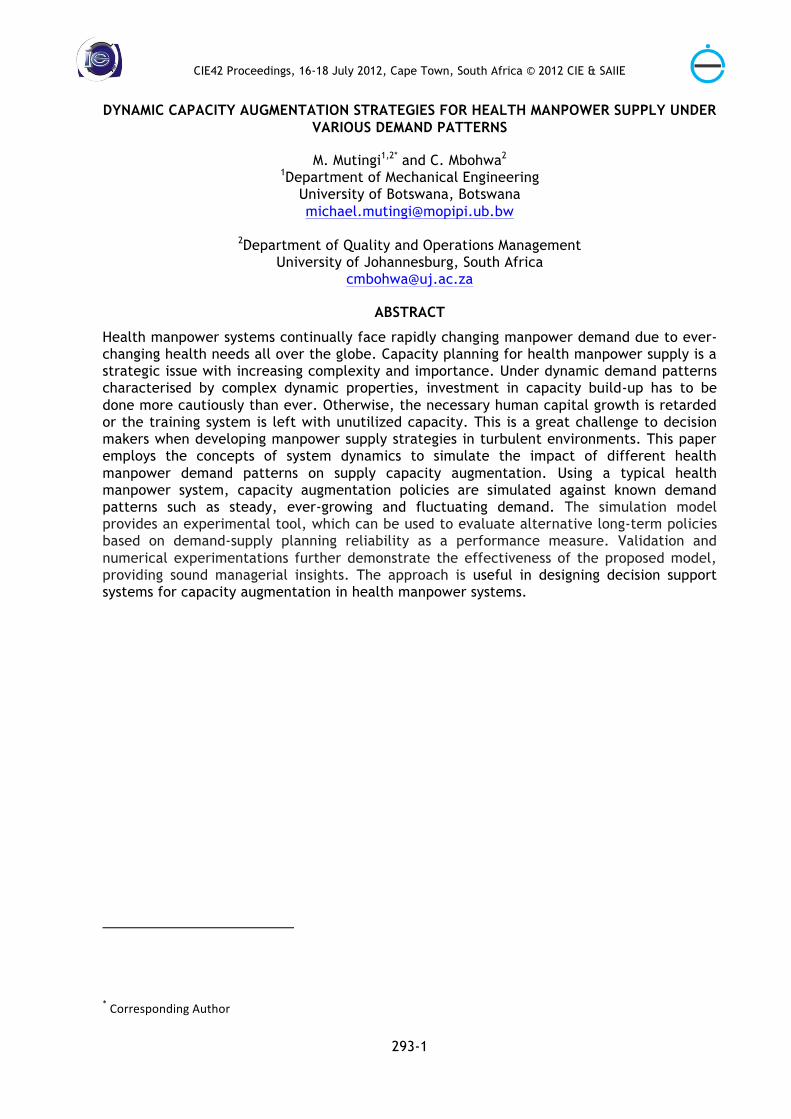
To develop a decision support system for capacity planning, a policy maker also needs to carefully balance the trade-off between maximizing fulfilment of health needs of the society and maximizing capacity utilization. This is possible by either of the following alternatives (see Figure 1):
(1) leading capacity strategy, where excess capacity is used to absorb sudden demand surges; or,
(2) matching capacity strategy, which attempts to closely match demand and capacity over time; or,
(3) trailing capacity strategy, in which capacity lags demand, hence capacity is fully utilized.
Using assumed initial conditions, the manpower system was simulated using the widely known system dynamics software iThink®.
CIE42 Proceedings, 16-18 July 2012, Cape Town, South Africa © 2012 CIE & SAIIE
293-4
Figure 1: Alternative Capacity Expansion Strategies
In the next section, the proposed dynamic simulation model is presented, consisting of three sub-models, training, labour market and capacity planning.
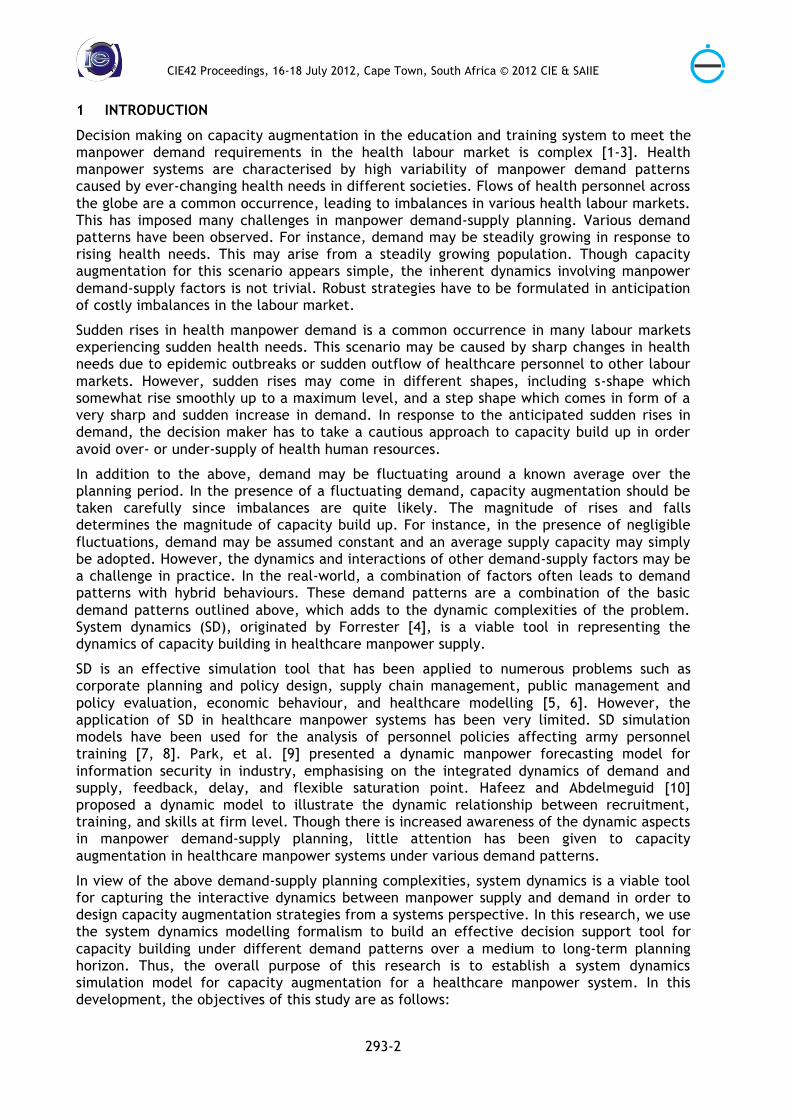
3 DYNAMIC SIMULATION MODEL DEVELOPMENT
The health manpower system is visualised as a system comprising three main interacting sectors; the training or education sector, the labour market, and the capacity planning sector which formulates the capacity augmentation policies. Figure 2 shows the main sectors of a typical health manpower system.
Figure 2: Main Sectors Of A Health Manpower System
3.1 Capacity augmentation
The capacity adjustment model, shown in Figure 2, simulates capacity augmentation strategies under various assumed input conditions. Input parameters are capacity adjustment time (cap_AT) and admission smoothing time (adm_ST). However, the main dynamic influence comes from the labour market status defined by unemployment ratio (u) and vacancy ratio (v). The labour market status drives the capacity augmentation decisions. In this study, we propose a heuristic capacity augmentation method which depends on the current labour market status. The current labour market status is formulated as a function of v and u. Notably, the information on these ratios is readily available quarterly from labour market surveys. We define a heuristic factor h, equivalent to effect_on_adm in the influence diagram in Figure 3;
)(),( uvfvufh −== (1)
Therefore, the change in desired admission, adm_change, can be expressed as a heuristic function of h as follows;
STadmDesAdhDesAdchangeadm _])1([_ −+⋅= (2)
From this analysis, it follows that the current desired admission can be obtained by adjusting the previous admission by adm_change, according to the expression;
dtchangeadmdttDesAdtDesAd ⋅+−= )_()()( (3)
TrainingLabour
market
Capacity
planning
feedback:market status
heuristic policies
time t
leading
matching trailing
demand forecast
capa
city
p 2p

CIE42 Proceedings, 16-18 July 2012, Cape Town, South Africa © 2012 CIE & SAIIE
293-5
Figure 3: Capacity Augmentation Influence Diagram
The desired admission DesAd influences capacity expansion (cap_expansion) which in turn is adjusted according to the following expression:
ATcapAdCapDesAdkexpansioncap _/)max(_ −⋅= (4)
Where, k is the capacity augmentation factor that controls the selection of the augmentation strategies l: leading, m: matching, and t: trailing, such that;
⎪⎩
⎪⎨
⎧
<
=
>
=
1 If 1if 1if
ktkmkl
strategy (5)
Finally, the current capacity is augmented according to the magnitude of previous capacity and the calculated capacity expansion, cap_expansion;
dtansioncapdttAdCaptAdCap ∗+−= )exp_()()( (6)
The admission capacity influences the actual admission to the training sector which in turn affects the rate of manpower supply to the labour market.
3.2 Manpower supply
The education system captures the flow of students under training in healthcare in anticipation of meeting demand for manpower in the healthcare labour market. As such, the proposed model derives from the mental models which rely on feedback information from market trends such as vacancy ratio v, unemployment ratio u, or a function of the two. It is assumed in this study that the vacancy and the unemployment ratios determine the desired admission DeAd, which in turn affects the admission capacity AdCap. Students enter training at a rate admission, and eventually join the unemployed UnEmp at a rate graduation after a training time train time. However, a small percentage may drop out at an average rate droput, which influenced by the average turnover fraction turnover.
3.3 Labour market
As illustrated in Figure 4, the labour market dynamics is represented by four stocks: unemployed (UnEmp), employed (Emp), foreign talent (FTalent) and vacancies (Vac). While the unemployed stocks are replenished by new entrants from the education sector at graduation rate and depleted by leakage and hiring rates. Hiring rate, hire, is influenced by UnEmp, Vac, foreign talent policy Q´, and the hiring time (hire_time). It is assumed that the leakage rate (leak) is influenced by base leakage_fraction and the relative demand rel_dem, which is the ratio Vac/UnEmp. The employment stocks Emp are influenced by hire rate and naturalisation, while depleted by attrition. Similarly, the foreign talent stocks are increased through hiring Fhire and reduced through attrition and naturalization. The dynamics of hiring and attrition of foreign and local talent interact with vacancies Vac which are increased and depleted due to vacancy creation (create) and vacancy closure (close) rates, respectively.
AdCap
DesAd
adm change
cap expansion
nominal cap
cap AT
effect on adm~
adm ST
vu gap u
v

CIE42 Proceedings, 16-18 July 2012, Cape Town, South Africa © 2012 CIE & SAIIE
293-6
Figure 4: Training And Labour Market Influence Diagram
For brevity of presentation, the full set of difference equations corresponding to the model are omitted, however, without loss of clarity. The model was run over a period of 160 quarters using the iThink® system dynamics software.
In the next section, we describe the experimental set up and the performance measures for the proposed simulation model.
4 SIMULATION EXPERIMENTS
Simulation experiments were run in two stages. In the first stage, the simulation experiments were conducted under three possible strategies: (a) unlimited capacity, (b) limited capacity with no capacity augmentation, and (c) limited capacity with capacity augmentation. The aim in this stage is to select the most suitable base strategy from the three extreme strategies, and to obtain useful insights from the evaluation. Simulation runs were performed over a period of 160 quarters for five input demand patterns: (i) fluctuating or seasonal, (ii) steady growth, (iii) s-shaped, (iv) step, and (v) hybrid, which combines fluctuating and steady growth. The graphs in Figure 5 provide sample data on the input demand patterns in terms of vacancy growth over the planning period of 160 quarters. For instance, the s-shaped input demand shows that vacancies are expected to increase from 400 to 9000 within the planning period.
Figure 5: Input Demand Patterns
Stud UnEmp Vac
FTalent Emp
FAttrition naturalize
hire close create
Fhire
admission graduation
AdCap
leak
turnover
train time
dropout
DesAd
attrition
Fhire
effect on leak~
FAttrition Time
hire time
attrition time
desired hire
vac AT
replacement dem
growth
rel dem
FPolicy~rel dem
Untitled
Page 11.00 40.75 80.50 120.25 160.00
Quarters
1:
1:
1:
2:
2:
2:
3:
3:
3:
4:
4:
4:
5:
5:
5:
0
5500
110001: f Dem 2: sDem 3: GDem 4: stDem 5: f s dem
1
1
1
1
2
2
2
2
3
3
3 3
4
4 4 4
5
5
5
5
4: step 5: combined 1&2
1: fluctuating 2: steady growth 3: s-shaped
Dem
and

CIE42 Proceedings, 16-18 July 2012, Cape Town, South Africa © 2012 CIE & SAIIE
293-7
In the second stage, simulation experiments were further performed and evaluated over three sets of capacity augmentation strategies namely, (1) leading capacity strategy, where excess capacity is used to absorb sudden demand surges, (2) matching capacity strategy, which attempts to match capacity and demand closely over time, and (3) trailing capacity strategy, where capacity lags the demand, as explained in section 2. The aim of this set of experiments was to evaluate and determine the best capacity augmentation approach, given various specific scenarios of input demand patterns.
In this simulation study, three main performance metrics were used to evaluate different policy scenarios. The basic metric is the gap between demand and supply, that is gap = demand - supply. However, the major metrics for this work are: (i) demand-supply reliability R, which reflects the reliability of the capacity planning policy, (ii) root mean square error E, which corresponds to the error between demand and supply, and (iii) cost C which corresponds to the cost associated with over- and under-supply of health manpower.
%100⋅⎥⎦
⎤⎢⎣
⎡⎟⎠
⎞⎜⎝
⎛−−= ∑∑∑
tt
ttt
tt VVUVR (7)
( )∑=
−=n
ttt SD
nE
1
21 (8)
∑=
⋅+⋅=n
ttt stsurplus_cocostshortage_ckC
1
)( (9)
where, k and c are are the unit costs associated with shortage and surplus, respectively; and he n is the planning horizon.
In this study, we assume that the unit cost of manpower surplus and manpower shortage is the same. Results of the simulation experiments are provided in the next section.
5 SIMULATION RESULTS AND DISCUSSION
In this section, results of the simulation study are provided for the base experiments as well as for the capacity augmentation strategies as defined in stage 1 and stage experiments, respectively.
5.1 Stage 1: Base experiments
Comparative simulations for the base health manpower system structure were performed according to the first stage of the experimental design. The simulation was performed and evaluated under the three basic capacity augmentation strategies, that is;
(a) unlimited capacity, readily available; (b) limited capacity without augmentation; and, (c) limited capacity with augmentation
Performance of the system under strategies a, b and c was evaluated for each demand input type according to E, R and C metrics as outlined earlier. Table 1 provides the results of the performance of the manpower system based on the E metric. In respect of strategy a, which assumes unlimited capacity, E values average 25 under all demand types, which is much higher than the case with strategy c. This emanates from the fact that unlimited response to market changes end up inducing unwanted fluctuations in the system, leading to costly imbalances labour market labour market. Because strategy b offers no room for augmenting the capacity, the system performs the worst when compared to other strategies. From this analysis, it is realised that capacity augmentation is imperative.

CIE42 Proceedings, 16-18 July 2012, Cape Town, South Africa © 2012 CIE & SAIIE
293-8
Table 1: Performance Of Manpower System Based On E Values
Strategy Demand Type
Fluctuating Steady S-shaped Step Combined
a 25.12 24.98 27.29 25.17 24.66
b 29.23 59.13 100.6 28.74 39.43
c 7.51 13.51 5.63 22.58 5.31
Table 2 provides the performance metrics for the manpower system based on the demand-supply reliability R. A comparative analysis of the R values for different strategies demonstrate that the system performed the worst under strategies a and b. Under strategy a unwanted fluctuations are induced, leading to demand-supply imbalances. Strategy b results in shortages in the system. From this analysis, a and b are not reliable. As such, we conclude that capacity augmentation is imperative if losses due to health labour market imbalances are to be avoided.
Table 2: Performance Of Manpower System Based On R Values
Strategy Demand Type
Fluctuating Steady S-shaped Step Combined
a 64.02 66.76 65.47 63.87 65.77
b 70.17 53.77 41.82 69.88 63.13
c 88.44 81.13 92.14 74.93 92.32
A similar analysis can be deduced from the results shown in Table 3. The system shows higher cost values when the system operates under strategy a and b. This is attributed to introduction of unwanted fluctuations and imbalances in the manpower system. Therefore, from the above analyses, we can conclude that it is necessary to introduce dynamic capacity augmentation strategies in order to minimize unwanted imbalances and fluctuations in the labour market. Without controlled capacity adjustments, losses due to over- and under-investments in capacity build-up are inevitable. In this view, controlled capacity augmentation is desirable.
Table 3: Performance Of Manpower System Based On C
Strategy Demand Type
Fluctuating Steady S-shaped Step Combined
a 34555 35169 38485 35868 54107
b 36947 86593 150704 37640 22007
c 9642 18366 7553 23427 6563
To further illustrate the demand-supply behaviour of the system, we provide the following graphical analyses based on the combined input demand type comprising pattern 1 & 2. The matching strategy is used. Figure 6 demonstrates the system behaviour in regards to demand and supply characteristics. Clearly, it can be seen that using the matching strategy with control factor k = 1, supply follows fluctuating demand closely. There is a slight variation between demand and supply. This indicates the utility of the proposed heuristic capacity augmentation.

CIE42 Proceedings, 16-18 July 2012, Cape Town, South Africa © 2012 CIE & SAIIE
293-9
Figure 6: Demand-Supply Behaviour, Combined (1 & 2), k = 1
We further demonstrate the behaviour of the system based on the gap between demand and supply, that is, gap. As shown by the trend of the graph in Figure 7, gap slightly fluctuates closely to zero, which indicates the effectiveness of the dynamic capacity augmentation policies. Unwanted fluctuations are minimized.
Figure 7: Performance Based On Gap, For Combined, k = 1
A policy maker may also find it necessary to compare the status of the stocks of vacancies and unemployed, which are the basic indicators of the status of the labour market. Figure 8 shows the variation of vacancies and unemployment over time. The graphs of vacancies and unemployment fluctuate according to the variation behavioural pattern of the combined demand input (1 & 2), with some delay.
Figure 8: Vacancies Vs Unemployment For Combined, k = 1
Untitled
Page 11.00 40.75 80.50 120.25 160.00
Quarters
1:
1:
1:
2:
2:
2:
67000
76000
850001: demand 2: supply
1
1
1
1
2
22
2
Untitled
Page 11.00 40.75 80.50 120.25 160.00
Quarters
1:
1:
1:
-1000
0
10001: gap
11
1 1
Untitled
Page 11.00 32.80 64.60 96.40 128.20 160.00
Quarters
1:
1:
1:
2:
2:
2:
0
750
15001: Vac 2: UnEmp
1 11
1
1
2 2
2
2
2
dem
and
/sup
ply
gap
vaca
ncy
/ une
mpl
oym
ent
1: total demand 2: total supply
1: vacancies 2: unemployed

CIE42 Proceedings, 16-18 July 2012, Cape Town, South Africa © 2012 CIE & SAIIE
293-10
As shown in Figure 9, capacity augmentation is triggered by the desired admission which in turn is influenced by the status of the labour market. Due to fluctuating demand input, the desired admission fluctuates accordingly. Capacity is augmented at the beginning of the planning horizon and at simulation peak demands, with a delay. In times of low demand, capacity is under-utilized. This calls for trade-off between capacity utilization to minimize over-investment and capacity under-utilization to maximize supply and avoid any shortages. This mental model can be evaluated using the three major capacity augmentation strategies proposed in this study.
Figure 9: Admission Capacity Vs Desired Capacity, For Combined, k = 1
5.2 Stage 2: Capacity augmentation strategies
This section gives the results of simulation experiments for the three augmentation strategies based on the five common demand input types.
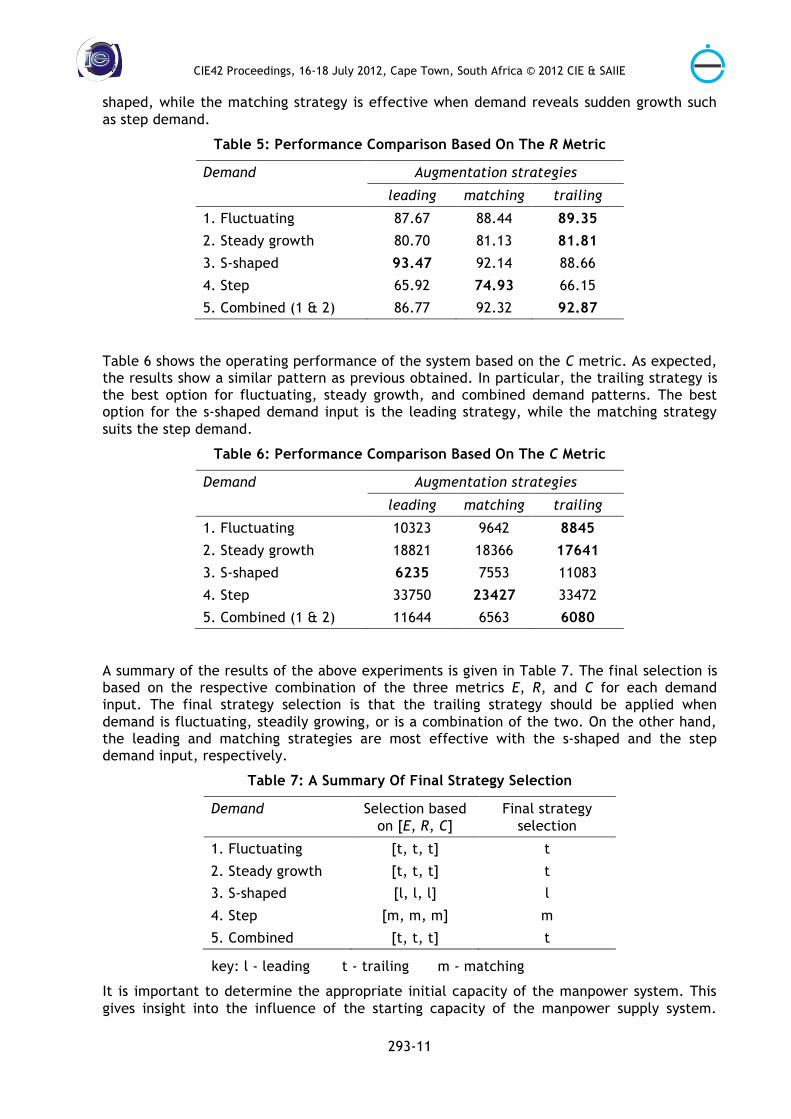
Table 4 shows the comparative analysis of the performance of the system based on the E metric. For the fluctuating demand, the most suitable strategy is ‘trailing’ since it gives the minimum error E. In the same vein steady growth performs best with the trailing strategy. Conversely, for the s-shaped demand input, the system gives the best results with a leading strategy. Surprisingly, the step demand requires a matching strategy. As expected, the system performs best under the trailing strategy when the demand input type is combined (demand type 1 & 2).
Table 4: Performance Comparison Based On The E Metric
Demand Augmentation strategies
leading matching trailing
1. Fluctuating 7.95 7.51 7.02 2. Steady growth 13.84 13.51 12.95 3. S-shaped 4.65 5.63 8.28
4. Step 25.48 22.58 25.43
5. Combined (1 & 2) 8.89 5.31 4.72
Table 5 shows the results of the simulation study based on demand-supply planning reliability R. Using similar analysis and evaluation as above, the same results were obtained as in Table 4. The trailing strategy is the best option when demand is fluctuating, steadily growing or a combination of the two. The leading strategy is suitable when demand is s-
Untitled
Page 21.00 40.75 80.50 120.25 160.00
Quarters
1:
1:
1:
2:
2:
2:
0
750
15001: AdCap 2: DesAd
11 1
1
2
2
2
2
1: capacity 2: desired admission
capa
city
CIE42 Proceedings, 16-18 July 2012, Cape Town, South Africa © 2012 CIE & SAIIE
293-11
shaped, while the matching strategy is effective when demand reveals sudden growth such as step demand.
Table 5: Performance Comparison Based On The R Metric
Demand Augmentation strategies
leading matching trailing
1. Fluctuating 87.67 88.44 89.35 2. Steady growth 80.70 81.13 81.81 3. S-shaped 93.47 92.14 88.66
4. Step 65.92 74.93 66.15
5. Combined (1 & 2) 86.77 92.32 92.87
Table 6 shows the operating performance of the system based on the C metric. As expected, the results show a similar pattern as previous obtained. In particular, the trailing strategy is the best option for fluctuating, steady growth, and combined demand patterns. The best option for the s-shaped demand input is the leading strategy, while the matching strategy suits the step demand.
Table 6: Performance Comparison Based On The C Metric
Demand Augmentation strategies
leading matching trailing
1. Fluctuating 10323 9642 8845 2. Steady growth 18821 18366 17641 3. S-shaped 6235 7553 11083
4. Step 33750 23427 33472
5. Combined (1 & 2) 11644 6563 6080
A summary of the results of the above experiments is given in Table 7. The final selection is based on the respective combination of the three metrics E, R, and C for each demand input. The final strategy selection is that the trailing strategy should be applied when demand is fluctuating, steadily growing, or is a combination of the two. On the other hand, the leading and matching strategies are most effective with the s-shaped and the step demand input, respectively.
Table 7: A Summary Of Final Strategy Selection
Demand Selection based on [E, R, C]
Final strategy selection
1. Fluctuating [t, t, t] t
2. Steady growth [t, t, t] t
3. S-shaped [l, l, l] l
4. Step [m, m, m] m
5. Combined [t, t, t] t
key: l - leading t - trailing m - matching
It is important to determine the appropriate initial capacity of the manpower system. This gives insight into the influence of the starting capacity of the manpower supply system.
CIE42 Proceedings, 16-18 July 2012, Cape Town, South Africa © 2012 CIE & SAIIE
293-12
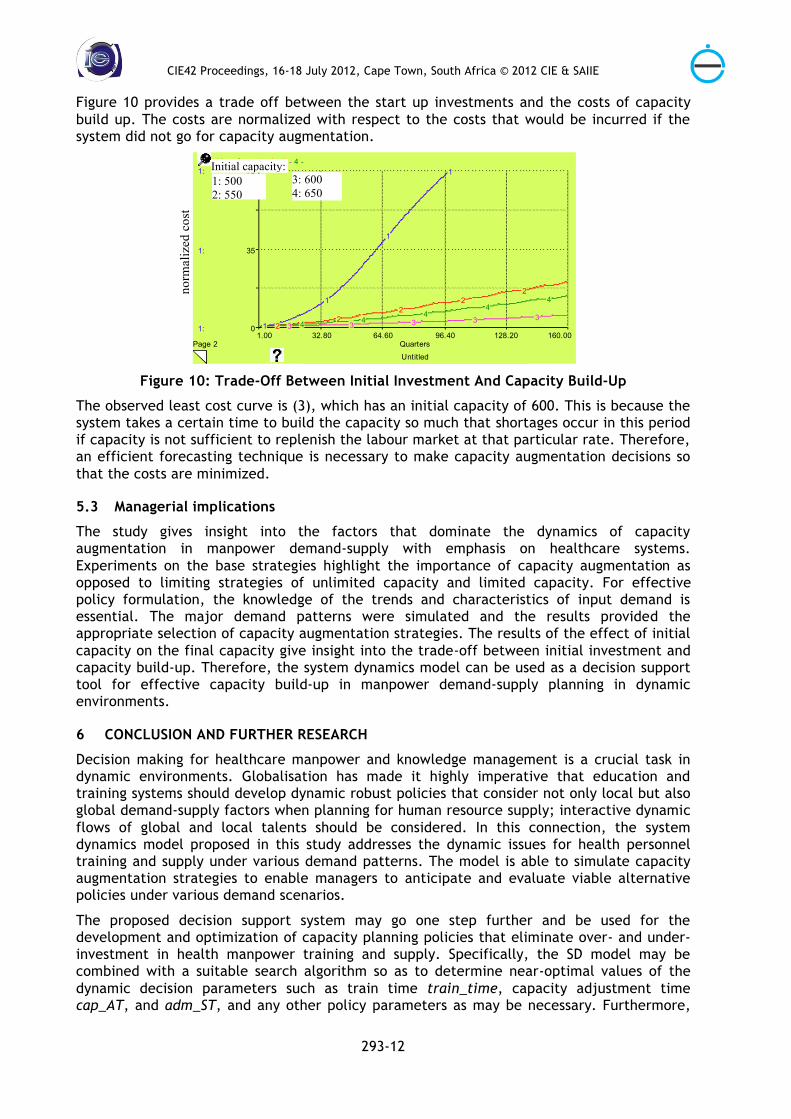
Figure 10 provides a trade off between the start up investments and the costs of capacity build up. The costs are normalized with respect to the costs that would be incurred if the system did not go for capacity augmentation.
Figure 10: Trade-Off Between Initial Investment And Capacity Build-Up
The observed least cost curve is (3), which has an initial capacity of 600. This is because the system takes a certain time to build the capacity so much that shortages occur in this period if capacity is not sufficient to replenish the labour market at that particular rate. Therefore, an efficient forecasting technique is necessary to make capacity augmentation decisions so that the costs are minimized.
5.3 Managerial implications
The study gives insight into the factors that dominate the dynamics of capacity augmentation in manpower demand-supply with emphasis on healthcare systems. Experiments on the base strategies highlight the importance of capacity augmentation as opposed to limiting strategies of unlimited capacity and limited capacity. For effective policy formulation, the knowledge of the trends and characteristics of input demand is essential. The major demand patterns were simulated and the results provided the appropriate selection of capacity augmentation strategies. The results of the effect of initial capacity on the final capacity give insight into the trade-off between initial investment and capacity build-up. Therefore, the system dynamics model can be used as a decision support tool for effective capacity build-up in manpower demand-supply planning in dynamic environments.
6 CONCLUSION AND FURTHER RESEARCH
Decision making for healthcare manpower and knowledge management is a crucial task in dynamic environments. Globalisation has made it highly imperative that education and training systems should develop dynamic robust policies that consider not only local but also global demand-supply factors when planning for human resource supply; interactive dynamic flows of global and local talents should be considered. In this connection, the system dynamics model proposed in this study addresses the dynamic issues for health personnel training and supply under various demand patterns. The model is able to simulate capacity augmentation strategies to enable managers to anticipate and evaluate viable alternative policies under various demand scenarios.
The proposed decision support system may go one step further and be used for the development and optimization of capacity planning policies that eliminate over- and under-investment in health manpower training and supply. Specifically, the SD model may be combined with a suitable search algorithm so as to determine near-optimal values of the dynamic decision parameters such as train time train_time, capacity adjustment time cap_AT, and adm_ST, and any other policy parameters as may be necessary. Furthermore,
Untitled
Page 21.00 32.80 64.60 96.40 128.20 160.00
Quarters
1:
1:
1:
0
35
70NormCost: 1 - 2 - 3 - 4 -
1
1
1
1
22
22
2
3 3 3 3 34 4
44
4
norm
aliz
ed c
ost
Initial capacity:
3: 600 4: 650
1: 500 2: 550

CIE42 Proceedings, 16-18 July 2012, Cape Town, South Africa © 2012 CIE & SAIIE
293-13
the proposed decision tool may also be used to perform several types of “what-if” analyses regarding possible scenario changes in turbulent times so as to gain managerial insight. In so doing, the tool goes a long way to enable policy makers to make informed decisions, thereby avoiding potential investment losses and imbalances in the health labour market.
Further research opportunities in this study are widespread. The model can be calibrated using real data to determine heuristic functions controlling capacity adjustments, that is, rules of the thumb involving market status f(u,v). The model can also be integrated with optimization techniques in order to determine optimal (or near-optimal) policy parameters for the health manpower systems. Apart from its application in health manpower systems the utility of the tool can be extended to other dynamic and complex manpower systems such as engineering and technology which often pose challenges to human capital policy makers. The concepts of heuristic capacity augmentation and dynamic modelling proposed in this model can also be extended to supply chains. Furthermore, it will be interesting to include demand modelling and the effects of task shifting [11] on capacity strategies and demand behaviour from a systems viewpoint.
7 REFERENCES [1] World Health Organization. 2006. Health worker shortages and the response to AIDS.
Available: < http://www.who.int/hiv/toronto2006/TTR2_eng.pdf>, 8 June, 2012.
[2] Ozcan, S., Taranto, Y. & Hornby, P. 1995. Shaping the health future in Turkey: a new role for human resource planning, International Journal of Health Planning and Management 10, pp 305-319.
[3] O'Brien-Pallas, L., Baumann, A., Donner, G., Murphy, G.T., Lochhaas-Gerlach, J., Luba, M. 2001. Forecasting models for human resources in health care, Journal of Advanced Nursing, 33 (1), pp 120-129.
[4] Forrester, J.W. 1961. Industrial dynamics, Waltham, MA: Pegasus Communications.
[5] Morecroft, J.DW. 2007. Strategic Modelling and Business Dynamics: A Feedback Systems Approach, John Wiley & Sons, Chichester, 2007.
[6] Sterman, J. D. 2004. Business Dynamics: Systems Thinking and Modelling for a Complex World Irwin/McGraw-Hill, Boston.
[7] Chan, A.P.C Chiang, Y.H., Mak, S.W.K. Choy L.H.T. & Wong, J.M.W. 2006. Forecasting the demand for construction skills in Hong Kong, Construction Innovation 6 (1), pp 3-19.
[8] Wang, J. 2005. A review of operations research applications in workforce planning and potential modelling of military training. Available: <http://nla.gov.au/nla.cat-vn3428298>, 11 October, 2011.
[9] Park, S., Lee, S.M., Yoon. S.N., & Yeon, S. 2008. A dynamic manpower forecasting model for the information security industry, Industrial Management & Data Systems 108 (3), pp 368-384.
[10] Hafeez, K., & Aldelmeguid, H. 2003. Dynamics of human resource and knowledge management. Journal of the Operations Research Society 54, pp 153-164.
[11] World Health Organisation. 2007. Task shifting to tackle health worker shortages. Available: <http://www.who.int/healthsystems/task_shifting_booklet.pdf>, 7 June, 2012.