ecohydrological conditions associated with the...
TRANSCRIPT

Ecohydrological Conditions Associated With TheDistribution And Phenology Of The Pima Pineapple Cactus
Item Type text; Electronic Thesis
Authors Kidder, Amí Lynne
Publisher The University of Arizona.
Rights Copyright © is held by the author. Digital access to this materialis made possible by the University Libraries, University of Arizona.Further transmission, reproduction or presentation (such aspublic display or performance) of protected items is prohibitedexcept with permission of the author.
Download date 21/05/2018 22:29:19
Link to Item http://hdl.handle.net/10150/347323
1 | P a g e
ECOHYDROLOGICAL CONDITIONS ASSOCIATED WITH THE DISTRIBUTION
AND PHENOLOGY OF THE PIMA PINEAPPLE CACTUS
(Coryphantha scheeri var. robustispina)
by
Amí L. Kidder
____________________________
A Thesis Submitted to the Faculty of the
SCHOOL OF NATURAL RESOURCES AND THE ENVIRONMENT
In Partial Fulfillment of the Requirements
For the Degree of
MASTER OF SCIENCE
In the Graduate College
THE UNIVERSITY OF ARIZONA
2015

2 | P a g e
STATEMENT BY AUTHOR
This thesis has been submitted in partial fulfillment of requirements for an
advanced degree at the University of Arizona and is deposited in the University Library
to be made available to borrowers under rules of the Library.
Brief quotations from this thesis are allowable without special permission,
provided that an accurate acknowledgement of the source is made. Requests for
permission for extended quotation from or reproduction of this manuscript in whole or in
part may be granted by the head of the major department or the Dean of the Graduate
College when in his or her judgment the proposed use of the material is in the interests of
scholarship. In all other instances, however, permission must be obtained from the author.
SIGNED: Amí Lynne Kidder
APPROVAL BY THESIS DIRECTOR
This thesis has been approved on the date shown below:
______________________________________________01/13/2015 _____________
Shirley Anne Papuga Date
Professor, Watershed Management and Ecohydrology
______________________________________________01/13/2015______________
David D. Breshears Date
Professor, Watershed Management and Ecohydrology

3 | P a g e
ACKNOWLEDGEMENTS
This research was possible due to project funding provided by the U.S. Air Force
Life Cycle Management Center environmental compliance team supporting Air Force
Plant 44. Additional support was provided by Raytheon Missile Systems Environmental,
Health, Safety, and Sustainability Department, as well as NSF Critical Zone Observatory
(NSF-EAR-1331408).
I would like to thank my advisors Dr. Shirley Papuga and Dr. David Breshears,
both of whom guided me through this project and were patient while I learned. I am also
thankful for my committee members Dr. Mitchel McClaran and Dr. Darin Law who each
provided me with unique guidance and were always willing to share their insights with
me. I would also like to thank Dr. D. Phillip Guertin and Dr. Prakash Dhakal for their
help when I needed to expand my programming and lab skills. Additional thanks to
Katherine Belzowski and Toni Flora for their review and advice on the final manuscript.
I owe special thanks to the members of the Papuga and Breshears labs for all their
help through the years in learning new skills and discussing new ideas: Cianna, Jason,
Juan, Mallory, Zulia, MaPilar, Zack, Bhaskar, Jessica, Daphne, Adam, Daniel, Matt,
Rachel, and Vanessa.
I would also like to thank the Raytheon Environmental and Industrial Hygiene
team for all their support through this project: Heather, Kate, David, Dianna, Katie,
Richard, and Christine.

4 | P a g e
DEDICATION
This thesis is dedicated to the many people who have helped me along the way,
and without whom I would not be who I am today. To my parents and siblings who love
me: I am ever thankful for your support, encouragement, and Jeep loans. To Tom, who
supported me through the rough patches and is the best field-companion I could ask for:
here’s to finding C. scheeri where it’s supposed to be and to bringing Irish Folk music to
the desert. And finally, to really good hiking boots: I could not have endured my many
crossings of the “Land of Cholla” without you.
5 | P a g e
Table of Contents
List of Figures .................................................................................................................................. 6
List of Tables ................................................................................................................................... 7
Abstract ............................................................................................................................................ 8
Chapter 1: Context ......................................................................................................................... 10
1.1 Climate Change .................................................................................................................... 10
1.2 Precipitation Pulse Dynamics .............................................................................................. 11
1.3 Phenology ............................................................................................................................ 13
1.4 Endangered Species ............................................................................................................. 13
1.5 Pima Pineapple Cactus ......................................................................................................... 14
1.6 Thesis Format ...................................................................................................................... 17
Chapter 2: Present Study ................................................................................................................ 19
2.1 Summary of Results ............................................................................................................. 20
2.2 Summary of Conclusions ..................................................................................................... 21
2.3 Future Research Opportunities............................................................................................. 22
2.3.1 Soil Moisture as an Indicator of Spatial Distribution ................................................... 22
2.3.2 Shifting Phenology as an Additional Threat to Endangered Species............................ 23
2.3.3 Shifting Phenology and Resource Distribution in Alternate Ecosystem Types ............. 23
References ...................................................................................................................................... 25
APPENDX A: CLASSIFICATION TREE ESTIMATION OF THE CLIMATE CHANGE
VELOCITY GAP FOR LITTLE-STUDIED, SLOW-DISPERSING ENDANGERED SPECIES
....................................................................................................................................................... 34
APPENDIX B: ECOHYDROLOGICAL CONTROLS ON CACTUS FLOWERING
PHENOLOGY AND PLANT REPRODUCTIVE CHARACTERISTICS: A TWO YEAR
OBSERVATIONAL STUDY OF AN ENDANGERED SPECIES .............................................. 72
APPENDIX C: SUPPLEMENTAL DATA FROM SANTA RITA EXPERIMENTAL RANGE
ON PLANT PHYISCAL CHARACTERISTICS AND ASSOCIATED ABIOTIC
CHARACTERISTICS ................................................................................................................. 106

6 | P a g e
List of Figures
Figure 1: Map of Coryphantha scheeri var. robustispina distribution, reproduced from:
Baker, Marc, 2004 USGS Report. Within this report, Coryphantha scheeri var.
robustispina is named Coryphantha robustispina var. robustispina…………………….14
Figure 2: Photo of C. scheeri flowering…………………………………………………15

7 | P a g e
List of Tables
Table 1: Journal publications and theses on C. scheeri and other species in the genus; also
included non-comprehensively are some relevant reports……………………………….33
8 | P a g e
Abstract
Climate changes in temperature and precipitation are already occurring and are
projected to further exhibit increasing temperature and precipitation extremes and
increasing variation. Such increased temperature variation and decreased precipitation are
likely to have a profound impact on vegetation communities, particularly in regions that
are dominated by extreme temperatures and strongly seasonal precipitation events. Both
temperature and precipitation are tightly linked to vegetation growth and distribution, and
in regions such as the U.S. desert southwest, there are a number of rare and endangered
species that have a particularly tight knit relationship with their environment. Here, I
examine the relationship between these ecohydrological drivers and a specific, little-
researched cactus: the Pima Pineapple Cactus (Coryphantha scheeri var. robustispina).
C. scheeri is a small, hemispherical cactus that resides in the Santa Cruz and Altar
Valleys of Southern Arizona, and very little is known about the conditions that promote
C. scheeri distribution and growth. To provide information that may aide in managing
this species, I investigate aspects of the distribution and the phenology of this species.
With respect to distribution, I hypothesize that (H1) C. scheeri locations are associated
with spatial physical and climatic data within its geographic limits. A framework
describing the climatic associations of C. scheeri would enable species managers to take
advantage of suitable habitat when opportunities arise. With respect to phenology, within
established C. scheeri habitat we lack a clear understanding of the impact
ecohydrological factors can have on reproduction and size. Therefore, I also hypothesize
(H2) that C. scheeri flowering phenology is triggered by available moisture, which may
be in the form of precipitation, humidity, or soil moisture. My results indicate that
9 | P a g e
through the use of the classification tree, C. scheeri habitat is strongly associated with
climatic and physical variables at a state-wide scale; these associations indicate large
losses of suitable habitat under future projected climate scenarios. Additionally, I find
that C. scheeri flowering phenology appears to be associated with precipitation and the
resulting increase of soil moisture; the data are also suggestive that bud formation might
be associated with water-year growing degree day. Because the results indicate a tight
coupling with climatic variables, with most suitable habitat within the current range in
Arizona projected to be lost under future climate, I suggest managers may be inclined to
increase monitoring C. scheeri in an ecohydrological context relative to the variables
identified here and to consider conditions and locations where supplemental watering or
microclimate amelioration could be beneficial for the species.
Key words: Classification tree, endangered species, phenology, spatial distribution

10 | P a g e
Chapter 1: Context
1.1 Climate Change
Changes in climate are already underway and projected to increase in the future
(Garfin et al., 2013; IPCC, 2013). Projected changes include atmospheric composition
(Isaksen et al., 2009), temperature (Crowley, 2000; Hansen et al., 2006; Karl et al., 1991;
Meehl et al., 2000), precipitation (Christensen & Christensen, 2002; Gorman &
Schneider, 2009; Meehl et al., 2000), and species composition and distribution (Hansen et
al., 2001). Increases in greenhouse gas concentrations are primarily evident in the
changes observed in temperature (Crowley, 2000; Hansen et al., 2006; Karl et al., 1991)
and precipitation (Christensen & Christensen, 2002; Gorman & Schneider, 2009).
Projected temperature changes include increasingly frequent and extreme heat and cold
events (Mearns et al., 1984; Meehl et al., 2000). Additionally, average temperature ranges
are observed to be increasing toward the poles, and are projected to continue to do so
(Seager et al., 2007; Walther et al., 2002). Precipitation changes are projected to exhibit
more extreme flooding and drought events (Meehl et al., 2000), altering the hydrologic
cycle and moisture availability globally.
These changes in temperature and precipitation are impacting species
distributions (IPCC, 2014; Kotwicki & Lauth, 2013; Stevenson & Lauth, 2012) and the
timing of life cycle events—phenology (Kotwicki & Lauth, 2013; Ma et al., 2013;
Stevenson & Lauth, 2012). The magnitude of response to these changes varies across
species and ecosystems, leading to a variety of challenging consequences for natural
resource managers. Additionally, climate conditions are projected to occur so quickly,
even under the least extreme scenarios, that biome shifts are predicted to out-pace the
11 | P a g e
species that exist therein (Sandel et al., 2011; Schloss et al., 2012). Species will require
dispersal and establishment rates to track climate-driven changes in suitable habitat if
they are to offset such losses (IPCC 2014).
Projected climate changes are expected to be particularly pronounced in the
Southwestern U.S. (Garfin et al., 2013). Both hotter and drier conditions are projected for
the Southwestern U.S. and associated deserts (Albright et al., 2010; Feng et al., 2014).
Additionally, greater variability in temperature and precipitation is projected (Albright et
al., 2010; Feng et al., 2014), as well a greater occurrence of extreme events including heat
waves and drought (Kharin et al., 2007; Welbergen et al., 2008). These climate changes
are expected to impact not only individual species, but also ecosystems, with respect to
factors such as nutrient availability and fire disturbance regimes (Hurteau et al., 2014;
Nitschke & Innes, 2007). Consequently, improved regional planning and management of
natural resources is needed to address this challenge.
1.2 Precipitation Pulse Dynamics
Of particular importance to Southwestern ecosystems and other drylands
worldwide is the spatiotemporal variability in available water resources (Cable &
Huxman, 2004; Huxman et al., 2004a; Huxman et al., 2004b), because in these locations
water is the dominant limiting factor for much of the year (Reynolds et al., 2004;
Rosenstock et al., 2005). The seasonal distribution of precipitation is important in the
Southwestern U.S., and varies along a gradient from the Mojave to Sonoran to
Chihuahuan deserts (Brutsaert, 2012; Cañón et al., 2011). The Sonoran desert,
intermediate between the Mojave and Chihuahuan, is characterized by precipitation
limited to a heavy monsoon season, variable winter precipitation, and long dry periods in

12 | P a g e
between (Cable & Huxman, 2004). Much of biological activity in the Sonoran desert and
other dryland ecosystems has been characterized as pulsed responses to precipitation
“pulses” (Cable & Huxman, 2004; Huxman et al., 2004a; Huxman et al., 2004b;
Schwinning et al., 2004; Schwinning & Sala, 2004).
Diverse biological responses to precipitation pulses span microbial responses,
biological soil crusts, and vegetation physiology, growth, phenology and distribution. For
example, microbial responses to precipitation pulses in biological soil crusts exhibit
carbon ecosystem exchange and nutrient cycling pulses (Huxman et al., 2004b).
Precipitation pulses trigger responses even when they are small in magnitude. For
instance, biological soil crusts contribute to both carbon and nitrogen cycling (Belnap,
2006; Cable & Huxman, 2004) as a result of precipitation pulses that are too small to
activate shallow plant roots (Cable & Huxman, 2004). Biological soil crust response to
precipitation pulses also enables small pulses to infiltrate down into the shallow root later
(Belnap, 2006). Similarly, vegetative responses to precipitation pulses are reflected in
observed patterns in distribution (Schmidt et al., 2013), transpiration (Huxman et al.,
2004b; Nagler et al., 2007; Yepez et al., 2005), and phenological events such as growth
(Wu et al., 2009) and frequency and duration of flowering events (Crimmins et al., 2014,
2011, 2013).
In addition to the amount of precipitation occurring in an ecosystem and the
specific pulse dynamics of that precipitation, the seasonal distribution of the precipitation
in drylands is important (DeBano et al., 1995). For example, shifts in the timing of
precipitation can alter timing of phenological events (Lesica & Kittelson, 2010; Neil et
al., 2010). Consequently, shifts in the seasonal patterns of precipitation pulses in
13 | P a g e
combination with other climatic variables (e.g. growing degree day) may impose
challenges for biota.
1.3 Phenology
Phenology examines the timing and magnitude of life-cycle events (Rathcke &
Lacey, 1985) and how they are triggered (Gunarathne & Perera, 2014; Ovaskainen et al.,
2013; Peñuelas et al., 2004). In the water-limited Southwestern U.S., phenological events
are often triggered by precipitation pulses (Angert et al., 2010; Miranda et al., 2014,
2009). Where precipitation pulses are seasonal, so then are the phenological responses
(Crimmins et al., 2014, 2013), which are proportionally greater with the size of the
precipitation pulse (Schwinning & Sala, 2004). The timing of phenological events is
often critical to the reproductive strategy of a species to reduce competition or take
advantage of prime reproductive conditions (Clements et al., 2010; Kaspari et al., 2001).
Understanding the phenology of dominant species is an important characterization of
landscapes (Kurc & Benton, 2010), and is particularly important for providing insight
into risks for threatened or endangered species, as well as identifying opportunities for
natural resource managers to take action (Neveu, 2009; Schiller et al., 2000; Ye et al.,
2006).
1.4 Endangered Species
Projected shifts in temperature and precipitation and associated shifts in suitable
habitat range can disproportionately affect threatened and endangered species (Hannah et
al., 2002; Sodhi et al., 2004; Wernberg et al., 2011). These species may already be more
susceptible to fluctuations in climatic conditions because their populations are typically
smaller, and may be less resilient to typical variations in climate and environment that

14 | P a g e
Figure 1: Map of Coryphantha scheeri var. robustispina
distribution, reproduced from: Baker, Marc, 2004 USGS Report.
Within this report, Coryphantha scheeri var. robustispina is
named Coryphantha robustispina var. robustispina.
induce fluctuation in healthy and robust species populations (Betini et al., 2014; Morita et
al., 2014). There are numerous threatened and endangered species in the Southwestern
U.S. (Dobson et al., 1997). Species in this region are often inherently sensitive to
precipitation and temperature changes, and therefore may be particularly impacted by
projected climate changes (Erickson & Waring, 2014).
1.5 Pima Pineapple Cactus
Of particular concern to natural resource managers are potential climate change
impacts on endangered species. An
additional challenge is that many
endangered species are little
studied, so key information on
basic biological characteristics
such as dispersal rates are lacking.
Vulnerability of an endangered
species to climate change can be
particularly great if dispersal rates
are slow, thereby limiting a species’
ability to track changes in in climate if suitable habitat is projected to be lost.
An example of a little-studied and likely slow-dispersing endangered species is
the Pima Pineapple Cactus (Coryphantha scheeri var. robustispina, here C. scheeri) of
the Sonoran desert. This species has been federally protected since 1993 (Roller, 1996;
Schmalzel et al., 2004; U.S. Fish and Wildlife Service, 2007) and within the U.S. is
located only in a limited region of the Southwest (Roller, 1996; Schmalzel et al., 2004;
15 | P a g e
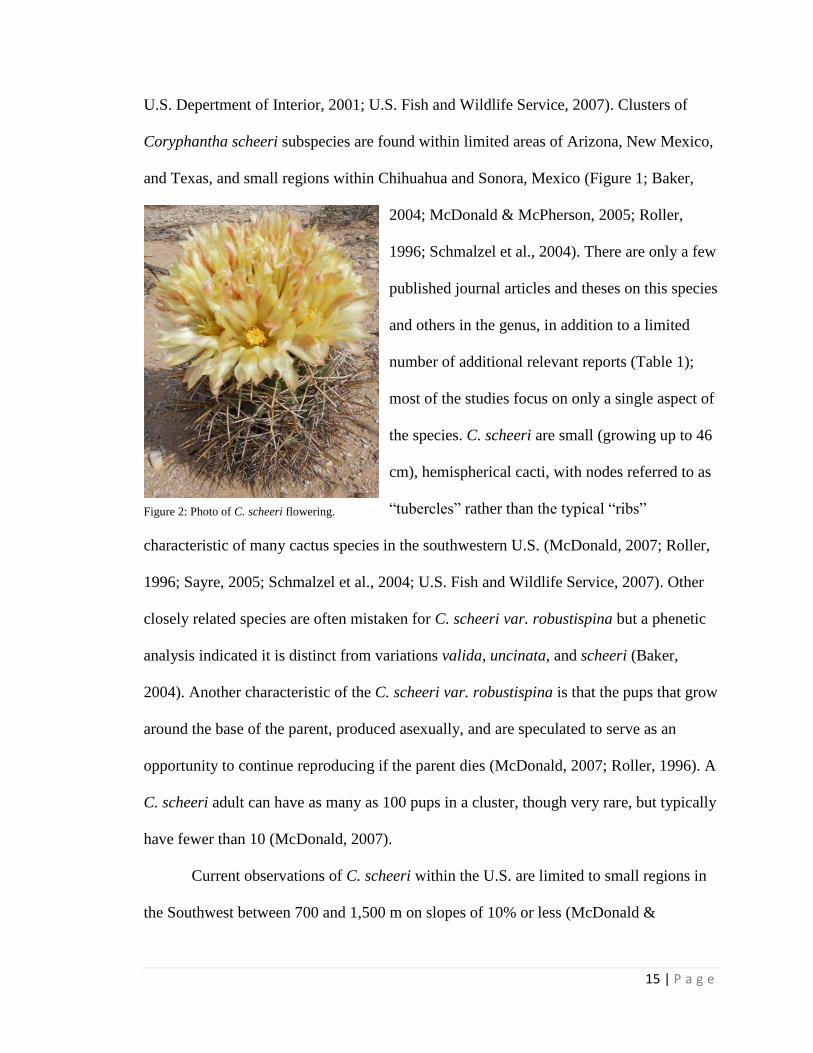
Figure 2: Photo of C. scheeri flowering.
U.S. Depertment of Interior, 2001; U.S. Fish and Wildlife Service, 2007). Clusters of
Coryphantha scheeri subspecies are found within limited areas of Arizona, New Mexico,
and Texas, and small regions within Chihuahua and Sonora, Mexico (Figure 1; Baker,
2004; McDonald & McPherson, 2005; Roller,
1996; Schmalzel et al., 2004). There are only a few
published journal articles and theses on this species
and others in the genus, in addition to a limited
number of additional relevant reports (Table 1);
most of the studies focus on only a single aspect of
the species. C. scheeri are small (growing up to 46
cm), hemispherical cacti, with nodes referred to as
“tubercles” rather than the typical “ribs”
characteristic of many cactus species in the southwestern U.S. (McDonald, 2007; Roller,
1996; Sayre, 2005; Schmalzel et al., 2004; U.S. Fish and Wildlife Service, 2007). Other
closely related species are often mistaken for C. scheeri var. robustispina but a phenetic
analysis indicated it is distinct from variations valida, uncinata, and scheeri (Baker,
2004). Another characteristic of the C. scheeri var. robustispina is that the pups that grow
around the base of the parent, produced asexually, and are speculated to serve as an
opportunity to continue reproducing if the parent dies (McDonald, 2007; Roller, 1996). A
C. scheeri adult can have as many as 100 pups in a cluster, though very rare, but typically
have fewer than 10 (McDonald, 2007).
Current observations of C. scheeri within the U.S. are limited to small regions in
the Southwest between 700 and 1,500 m on slopes of 10% or less (McDonald &
16 | P a g e
McPherson, 2005; Roller, 1996; Schmalzel et al., 2004; U.S. Fish and Wildlife Service,
2007). Distribution is sparse, with existing literature indicating only a single individual
per ~10 ha (McDonald, 2007; McDonald & McPherson, 2005; Sayre, 2005), though they
can be found in much denser clusters (up to 8 plants per ~0.4 ha) (U.S. Depertment of
Interior, 2001; U.S. Fish and Wildlife Service, 2007). Habitat where C. scheeri is found is
characterized as gently sloping alluvial fans within desert scrubland and desert grassland
(McDonald, 2007; McDonald & McPherson, 2005; Roller, 1996; U.S. Fish and Wildlife
Service, 2007).
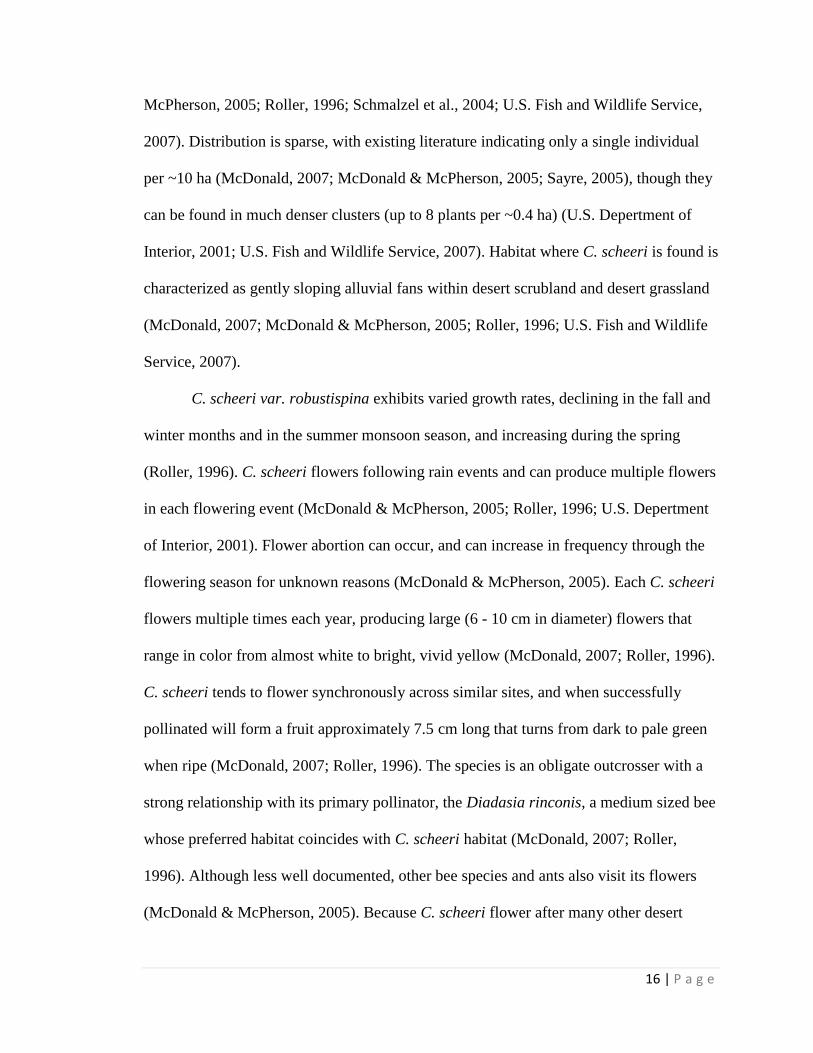
C. scheeri var. robustispina exhibits varied growth rates, declining in the fall and
winter months and in the summer monsoon season, and increasing during the spring
(Roller, 1996). C. scheeri flowers following rain events and can produce multiple flowers
in each flowering event (McDonald & McPherson, 2005; Roller, 1996; U.S. Depertment
of Interior, 2001). Flower abortion can occur, and can increase in frequency through the
flowering season for unknown reasons (McDonald & McPherson, 2005). Each C. scheeri
flowers multiple times each year, producing large (6 - 10 cm in diameter) flowers that
range in color from almost white to bright, vivid yellow (McDonald, 2007; Roller, 1996).
C. scheeri tends to flower synchronously across similar sites, and when successfully
pollinated will form a fruit approximately 7.5 cm long that turns from dark to pale green
when ripe (McDonald, 2007; Roller, 1996). The species is an obligate outcrosser with a
strong relationship with its primary pollinator, the Diadasia rinconis, a medium sized bee
whose preferred habitat coincides with C. scheeri habitat (McDonald, 2007; Roller,
1996). Although less well documented, other bee species and ants also visit its flowers
(McDonald & McPherson, 2005). Because C. scheeri flower after many other desert

17 | P a g e
cactus, they offer pollen to Diadasia later in the year and are likely an important resource
to provide pollen to juvenile Diadasia (McDonald, 2007). Other potential competitors for
pollinator attention include prickly pear (Opuntia) and barrel cactus (Ferocactus), which
tend to flower in the spring and a few weeks after the monsoon season begins,
respectively (McDonald & McPherson, 2005). Distribution of seeds from developed fruit
is not well documented, though small mammals (e.g. rabbits, rodents) are thought to fill
this ecological role (Roller, 1996).
One of the many challenges facing C. scheeri is its proximity to the U.S./Mexico
border, and the resulting human impacts from border patrol and illegal immigration
activities (Marris, 2006). Much C. scheeri habitat is located within range of heavy traffic
from immigration and drug trafficking, which also increases the challenge in studying the
species safely (Marris, 2006). Another challenge to the success of C. scheeri is the
introduction of Lehmann Lovegrass (Eragrostis lehmanniana), which can subject C.
scheeri to increased resource competition and risk from fire damage (Roller, 1996; Sayre,
2005; U.S. Depertment of Interior, 2001; U.S. Fish and Wildlife Service, 2007).
Additional challenges include illegal collection, grazing, habitat fragmentation and loss
from anthropogenic activities such as mining, and development (U.S. Depertment of
Interior, 2001; U.S. Fish and Wildlife Service, 2007).
1.6 Thesis Format
In the following thesis, I present a summary of the key results and conclusions of
my research on ecohydrological associations for the distribution and phenology of C.
scheeri var. robustispina, followed by discussion of possibilities for future work.
Following the summary are two appendices which present manuscripts of papers

18 | P a g e
intended for publication, followed by a third appendix with supplemental data. The
manuscripts present the data collected and analyzed in response to hypotheses on
ecohydrological controls on C. scheeri var. robustispina distribution and on phenology.

19 | P a g e
Chapter 2: Present Study
In 2013, in effort to better understand how to manage the endangered species on
their property, the United States Air Force (hereafter referred to as Air Force) provided
support to study a relatively dense population of C. scheeri var. robustispina at a location
in southern Arizona. This endangered species has little information on many of its key
biological characteristics. In addition to providing an opportunity to study this rarely
examined endangered species, the Air Force study enables the study of C. scheeri var.
robustispina at a site with controlled public access, potentially minimizing the effects of
some factors that may be influencing the cactus associated land disturbances such as
grazing and recreational pedestrian traffic. To advance our understanding of factors
influencing the distribution and phenology of C. scheeri, I take a two-part
ecohydrological approach that considers climate drivers and soil influences, first focusing
on larger scale patterns of distribution and second focusing on specific phenological
responses.
At the larger scale considering distribution, a fundamental conservation challenge
is assessing potential climate change impacts and management options for endemic,
specialized, and rare species (including threatened and endangered species) (Caldow et
al., 2007), many of which have been little studied and for which key information on
dispersal rates are lacking. Of particularly concern are species for which dispersal rates
are expected (even if not robustly documented) to be slow relative to “climate velocity”,
or the speed at which a species must track climate change to remain within suitable
habitat (Loarie et al., 2009; Sandel et al., 2011; Schloss et al., 2012). Given the need for
maximal insights based on limited available information for little-studied and likely slow-

20 | P a g e
dispersing species, classification trees can be especially useful because they offer
potential for high predictive ability without a priori assumptions about functional
relationships between environmental variables used and species suitability (Bhattacharya,
2013; Pal & Mather, 2003). Here I develop classification trees for the little-studied
endangered desert cactus species, Coryphantha scheeri var. robustispina. I examine how
climatic and physical factors contribute to C. scheeri distribution across the landscape.
My hypothesis (H1) is that C. scheeri locations are associated with spatial physical and
climatic data within its geographic limits. Classification trees are developed both with
and without elevation, and with and without seasonal precipitation totals; these trees are
then used to predict current distribution and to project future distribution under climate
change scenarios. Based on functional type and limited literature, C. scheeri is likely a
relatively slow dispersing species and therefore may be particularly sensitive to changes
in suitable habitat associated with projected climate change.
At a smaller scale, I examine the climatic conditions associated with two key
phenological responses: budding and flowering. My hypothesis (H2) is that C. scheeri
flowering phenology is triggered by available moisture, which may be in the form of soil
moisture, humidity, or rainfall. I examine the physical site characteristics that coincide
with C. scheeri habitat including soil texture, infiltration rates, and incoming solar
radiation. I examine parameters associated with C. scheeri phenology, considering
attributes of precipitation, temperature, and soil moisture.
2.1 Summary of Results
For the distribution study, the classification trees correctly estimated either
predicted absence or predicted presence for > 95% of present distribution cases and were
21 | P a g e
most influenced by maximum temperature and average annual precipitation; average
summer precipitation was also a strong influence when included. Using climate
projections for 2050, a classification tree with elevation estimated > 99% loss of suitable
habitat within its current Arizona distribution and only a few locations of additional
suitable habitat in Arizona outside of current Arizona distribution. However, without an
elevation constraint, extensive additional suitable habitat in Arizona was projected
outside the current Arizona distribution. When seasonal precipitation patterns were
included (and elevation was not included), the classification tree estimated only very
limited additions in future suitable habitat elsewhere in Arizona outside the current
Arizona distribution. The data limitations (e.g. spatial resolution) associated with these
estimates should be considered in application of the results, and field surveys will likely
be required for site-specific determinations.
For the phenology study, flowering events are generally associated with
precipitation events > 10 mm and a corresponding increase in soil moisture. Flowering
events occur multiple times within a single monsoon season within 6 days of
precipitation pulses. Soil texture type for study locations were mostly either sandy loam
or sandy clay loam, with larger sized individuals associated with lower sand content.
Higher infiltration rates are associated with smaller cacti and lower node count. Direct
site factor (DSF) values, a measure of the amount of near-ground incoming solar
radiation over a cloudless year, were not associated with metrics of size.
2.2 Summary of Conclusions
Collectively my results indicate that (1) C. scheeri distribution is tightly
associated with climate conditions, (2) flowers can occur multiple times per year,

22 | P a g e
apparently in response to precipitation pulses, and (3) based on the developed
classification trees, this species is estimated to be at risk of large loss of suitable Arizona
habitat under future (2050) climate. Additionally, the classification trees estimate some
new suitable habitat in other parts of Arizona under projected future climate but this
habitat is mostly outside the species’ current range. Assuming that this species is a slow
disperser, the changes in suitable habitat could necessitate assisted migration for this
species to track climate change; however, any such assisted migration would have to
consider numerous complexities, including pollinator movement.
With respect to research approaches, my study highlights that classification tree
results for little-studied but likely slow-dispersing rare species can aide in assessing
species vulnerability, identifying locations within current range where climate velocity
might be tracked, and mapping candidate locations for assisted migration. My study also
highlights how phenological monitoring using time-series data can reveal important
aspects of species biology that are relevant for natural resource manager consideration.
2.3 Future Research Opportunities
Based on the results presented here and considering the relevant literature, I
identify three key possibilities for further research on C. scheeri in the context of its
surrounding environment and the phenology of the desert Southwest.
2.3.1 Soil Moisture as an Indicator of Spatial Distribution
Results from this study indicate the importance of soil moisture for C. scheeri
phenology, but soil moisture data is quite limited, especially relative to C. scheeri
locations. Work is currently underway to enable wide-scale, remotely-sensed spatial data
for soil moisture, which would enable the inclusion of soil moisture in a distribution

23 | P a g e
analysis. Because moisture is such a limiting resource in arid and semi-arid
environments, the inclusion of spatially explicit soil moisture data could strengthen a
future C. scheeri analysis, as well as more fully enable the examination of other species
distribution in relation to soil moisture as a resource.
2.3.2 Shifting Phenology as an Additional Threat to Endangered Species
Existing literature on C. scheeri from the 1990’s and early 2000’s indicates that
bud formation occurs in mid-May and flowering begins in June in response to monsoon
events in June and July (Roller, 1996, McDonald and McPherson, 2005). In this study,
phenological responses occurred later: bud formation was observed nearly 4 weeks later
in mid-June, and flowering events responded to monsoon events in July. A change of this
magnitude in the timing of phenology could potentially affect the ability of C. scheeri to
attract pollinators away from competitors and to attract fruit distributors if those species
do not exhibit similar changes in phenology. Because climate change can affect many
species across the landscape differently, phenological shifts could occur in many species
that desynchronize them from available resources and alter the ecological functional
relationships across the ecosystem. To better understand how these shifts may take shape,
a more comprehensive study on recorded shifts in desert phenology across taxa and
functional groups could be useful.
2.3.3 Shifting Phenology and Resource Distribution in Alternate Ecosystem Types
Such shifts in phenology and their consequences across the ecosystem in terms of
functional group interactions and nutrient redistribution are a topic that I wish to further
pursue my studies as a PhD student. I have gained much knowledge in the duration of
this project that is unrelated to the specifics of C. scheeri. This research experience has

24 | P a g e
given me valuable experience in designing a research project with limited means in order
to best evaluate a set of hypotheses. Related to this, I’ve gained experience in examining
data for a single species, and based on existing knowledge of natural processes,
understanding how the data relates to the broader ecosystem. Although field data and
tools used within the course of this project may be limited in scope, practice in being
methodical in data collections, observations, and field campaigns are useful skills across
disciplines. Specific methods that are cross-functional include the programming and GIS
skills I’ve established in the course of this project which are valuable tools in many
disciplines. It is with these skills that I hope to ask questions of phenological shifts and
the resulting effects on resource availability in other ecosystem types, such as aquatic
freshwater and marine ecosystems.
25 | P a g e
References
Albright, T. P., Pidgeon, A. M., Rittenhouse, C. D., Clayton, M. K., Wardlow, B. D.,
Flather, C. H., Culbert, P. D., Radeloff, V. C. 2010. Combined effects of heat waves
and droughts on avian communities across the conterminous United States.
Ecosphere, 1(5), 1-11. doi:10.1890/ES10-00057.1
Angert, A. L., Horst, J. L., Huxman, T. E., & Venable, D. L. 2010. Phenotypic plasticity
and precipitation response in Sonoran Desert winter annuals. American Journal of
Botany, 97(3), 405–11. doi:10.3732/ajb.0900242
Baker, M. 2004. Phenetic analysis of Coryphantha, section Robustispina (cactaceae),
part 1: stem characters.U.S. Fish and Wildlife Service report (pp. 1–21). Tempe,
Arizona.
Belnap, J. 2006. The potential roles of biological soil crusts in dryland hydrologic cycles.
Hydrological Processes, 20(15), 3159–3178. doi:10.1002/hyp.6325
Betini, G. S., Griswold, C. K., Prodan, L., & Norris, D. R. 2014. Body size, carry-over
effects and survival in a seasonal environment: consequences for population
dynamics. The Journal of Animal Ecology, 83, 1313–1321. doi:10.1111/1365-
2656.12225
Bhattacharya, M. 2013. Bioclimatic modelling: a machine learning perspective.
International Journal of Advanced Computer Science and Applications, 4(2), 1–8.
Brutsaert, W. 2012. Are the North American deserts expanding? Some climate signals
from groundwater storage conditions. Ecohydrology, 5(5), 541–549.
doi:10.1002/eco.263
Cable, J. M., & Huxman, T. E. 2004. Precipitation pulse size effects on Sonoran Desert
soil microbial crusts. Oecologia, 141(2), 317–24. doi:10.1007/s00442-003-1461-7
Caldow, R. W. G., Stillman, R. A, le V. dit Durell, S. E. A., West, A. D., McGrorty, S.,
Goss-Custard, J. D., Wood, P. J., Humphreys, J. 2007. Benefits to shorebirds from
invasion of a non-native shellfish. Proceedings of the Royal Society Biological
Sciences, 274, 1449–1455. doi:10.1098/rspb.2007.0072
Cañón, J., Domínguez, F., & Valdes, J. B. 2011. Vegetation responses to precipitation
and temperature: a spatiotemporal analysis of ecoregions in the Colorado River
Basin. International Journal of Remote Sensing, 32(20), 5665–5687.
doi:10.1080/01431161.2010.507259
Christensen, J. H., & Christensen, O. B. 2002. Severe summertime flooding in Europe.
Nature, 421, 2002–2003.
26 | P a g e
Clements, M. N., Clutton-Brock, T. H., Albon, S. D., Pemberton, J. M., & Kruuk, L. E.
B. 2010. Getting the timing right: antler growth phenology and sexual selection in a
wild red deer population. Oecologia, 164(2), 357–68. doi:10.1007/s00442-010-
1656-7
Crimmins, T. M., Bertelsen, D. C., & Crimmins, M. a. 2014. Within-season flowering
interruptions are common in the water-limited Sky Islands. International Journal of
Biometeorology, 58(4), 419–26. doi:10.1007/s00484-013-0745-9
Crimmins, T. M., Crimmins, M. A., & Bertelsen, C. D. 2011. Onset of summer flowering
in a “Sky Island” is driven by monsoon moisture. The New Phytologist, 191(2),
468–79. doi:10.1111/j.1469-8137.2011.03705.x
Crimmins, T. M., Crimmins, M. A., & Bertelsen, C. D. 2013. Spring and summer
patterns in flowering onset, duration, and constancy across a water-limited gradient.
American Journal of Botany, 100(6), 1137–47. doi:10.3732/ajb.1200633
Crowley, T. J. 2000. Causes of climate change over the past 1000 years. Science,
289(5477), 270–277. doi:10.1126/science.289.5477.270
DeBano, L. F., Ffolliott, P. F., Ortega-Rubio, A., Gottfried, G. J., Hamre, R. H., &
Edminster, C. B. 1995. Biodiversity and management of the Madrean Archipelago:
The sky islands of Southwestern Untied States and Northwestern Mexico. In
Biodiversity and Management of the Madrean Archipelago (p. 669).
Dobson, A. P., Rodriguez, J. P., Roberts, W. M., & Wilcove, D. S. 1997. Geographic
distribution of endangered species in the United States. Science, 275, 16–19.
Erickson, C. C., & Waring, K. M. 2014. Old Pinus ponderosa growth responses to
restoration treatments, climate and drought in a southwestern US landscape. Applied
Vegetation Science, 17(1), 97–108. doi:10.1111/avsc.12056
Feng, W., Hardt, B. F., Banner, J. L., Meyer, K. J., James, E. W., Musgrove, M.,
Edwards, R. L., Cheng, H., & Min, A. 2014. Changing amounts and sources of
moisture in the U.S. southwest since the Last Glacial Maximum in response to
global climate change. Earth and Planetary Science Letters, 401, 47–56.
doi:10.1016/j.epsl.2014.05.046
Garfin, G., Jardine, A., Merideth, R., Black, M., & LeRoy, S. 2013. Assessment of
climate change in the Southwest United States. (G. Garfin, A. Jardine, R. Merideth,
M. Black, & S. LeRoy, Eds.). Washington, DC: Island Press/Center for Resource
Economics. doi:10.5822/978-1-61091-484-0
Gorman, P. A. O., & Schneider, T. 2009. The physical basis for increases in precipitation
extremes in simulations of 21st-century climate change. Proceedings of the National
Academy of Science, 106(35), 14773–14777.

27 | P a g e
Gunarathne, R. M. U. K., & Perera, G. A. D. 2014. Climatic factors responsible for
triggering phenological events in Manilkara hexandra ( Roxb .) Dubard., a canopy
tree in tropical semi-deciduous forest of Sri Lanka. Tropical Ecology, 55(1), 63–73.
Hannah, L., Midgley, G. F., Lovejoy, T., Bond, W. J., Bush, M., Lovett, J. C., Scott, D.,
& Woodward, F. I. 2002. Conservation of biodiversity in a changing climate.
Conservation Biology, 16(1), 264–268. doi:10.1046/j.1523-1739.2002.00465.x
Hansen, A. J., Neilson, R. P., Dale, V. H., Flather, C. H., Iverson, L. R., Currie, D. J.,
Shafer, S., Cook, R., & Bartlein, P. J. 2001. Global change in forests: responses of
species, communities, and biomes. BioScience, 51(9), 765–779.
Hansen, J., Sato, M., Ruedy, R., Lo, K., Lea, D. W., & Medina-Elizade, M. 2006. Global
temperature change. Proceedings of the National Academy of Sciences of the United
States of America, 103(39), 14288–93. doi:10.1073/pnas.0606291103
Hurteau, M. D., Bradford, J. B., Fulé, P. Z., Taylor, A. H., & Martin, K. L. 2014. Climate
change, fire management, and ecological services in the southwestern US. Forest
Ecology and Management, 327, 280–289. doi:10.1016/j.foreco.2013.08.007
Huxman, T. E., Cable, J. M., Ignace, D. D., Eilts, J. A., English, N. B., Weltzin, J., &
Williams, D. G. 2004. Response of net ecosystem gas exchange to a simulated
precipitation pulse in a semi-arid grassland: the role of native versus non-native
grasses and soil texture. Oecologia, 141(2), 295–305. doi:10.1007/s00442-003-
1389-y
Huxman, T. E., Snyder, K. A, Tissue, D., Leffler, A. J., Ogle, K., Pockman, W. T.,
Sandquist, D. R., Potts, D. L., & Schwinning, S. 2004. Precipitation pulses and
carbon fluxes in semiarid and arid ecosystems. Oecologia, 141(2), 254–68.
doi:10.1007/s00442-004-1682-4
IPCC, 2013: Climate Change 2013: The Physical Science Basis. Contribution of Working
Group I to the Fifth Assessment Report of the Intergovernmental Panel on Climate
Change [Stocker, T.F., D. Qin, G.-K. Plattner, M. Tignor, S.K. Allen, J. Boschung,
A. Nauels, Y. Xia, V. Bex and P.M. Midgley (eds.)]. Cambridge University Press,
Cambridge, United Kingdom and New York, NY, USA, 1535 pp,
doi:10.1017/CBO9781107415324
IPCC, 2014: Climate Change 2014: Impacts, Adaptation, and Vulnerability. Part A:
Global and Sectoral Aspects. Contribution of Working Group II to the Fifth
Assessment Report of the Intergovernmental Panel on Climate Change [Field, C.B.,
V.R. Barros, D.J. Dokken, K.J. Mach, M.D. Mastrandrea, T.E. Bilir, M. Chatterjee,
K.L. Ebi, Y.O. Estrada, R.C. Genova, B. Girma, E.S. Kissel, A.N. Levy, S.
MacCracken, P.R. Mastrandrea, and L.L. White (eds.)]. Cambridge University
Press, Cambridge, United Kingdom and New York, NY, USA, 1132 pp.
28 | P a g e
Isaksen, I. S. a., Granier, C., Myhre, G., Berntsen, T. K., Dalsøren, S. B., Gauss, M.,
Klimont, Z., Benestad, R., Bousquet, P., Collins, W., Cox, T., Eyring, V., Fowler,
D., Fuzzi, S., Jockel, P., Laj, P., Lohmann, U., Maione, M., Monks, P., Prevot, A. S.
H., Raes, F., Richter, A., Rognerud, B., Schulz, M., Shindell, D., Stevenson, D. S.,
Storelvmo, T., Wang, W.-C., van Weele, M., & Wuebbles, D. 2009. Atmospheric
composition change: climate–chemistry interactions. Atmospheric Environment,
43(33), 5138–5192. doi:10.1016/j.atmosenv.2009.08.003
Karl, R., Change, J., & Ouayle, G. 1991. Global warming: evidence for asymmetric
diurnal temperature change. Geophysical Research Letters, 18(12), 2253–2256.
Kaspari, M., Pickering, J., Longino, J., & Windsor, D. 2001. The phenology of a
neotropical ant assemblage: evidence for continuous and overlapping reproduction.
Behavioral Ecology and Sociobiology, 50(4), 382–390. doi:10.1007/s002650100378
Kharin, V. V., Zwiers, F. W., Zhang, X., & Hegerl, G. C. 2007. Changes in temperature
and precipitation extremes in the ipcc ensemble of global coupled model
simulations. Journal of Climate, 20(8), 1419–1444. doi:10.1175/JCLI4066.1
Kotwicki, S., & Lauth, R. R. 2013. Detecting temporal trends and environmentally-driven
changes in the spatial distribution of bottom fishes and crabs on the eastern Bering
Sea shelf. Deep Sea Research Part II: Topical Studies in Oceanography, 94, 231–
243. doi:10.1016/j.dsr2.2013.03.017
Kurc, S. A., & Benton, L. M. 2010. Digital image-derived greenness links deep soil
moisture to carbon uptake in a creosotebush-dominated shrubland. Journal of Arid
Environments, 74(5), 585–594. doi:10.1016/j.jaridenv.2009.10.003
Lesica, P., & Kittelson, P. M. 2010. Precipitation and temperature are associated with
advanced flowering phenology in a semi-arid grassland. Journal of Arid
Environments, 74(9), 1013–1017. doi:10.1016/j.jaridenv.2010.02.002
Loarie, S. R., Duffy, P. B., Hamilton, H., Asner, G. P., Field, C. B., & Ackerly, D. D.
2009. The velocity of climate change. Nature, 462(7276), 1052–5.
doi:10.1038/nature08649
Ma, T., Zhou, C., Pei, T., & Xie, Y. 2013. A comparative analysis of changes in the
phasing of temperature and satellite-derived greenness at northern latitudes. Journal
of Geographical Sciences, 23(1), 57–66. doi:10.1007/s11442-013-0993-y
Marris, E. 2006. Wildlife caught in crossfire of US immigration battle. Nature, 442(July).
McDonald, C. J. 2007, April. Pima pineapple cactus: a unique cactus hiding in plain
sight. The Plant Press, 1–4.
29 | P a g e
McDonald, C., & McPherson, G. 2005. Pollination of pima pineapple cactus
(Coryphantha scheeri var. robustispina): does pollen flow limit abundance of this
endangered species. USDA Forest Service Proceedings, 529–532.
Mearns, L., Katz, R. W., & Schneider, S. H. 1984. Extreme high-temperature events:
changes in their probabilities with changes in mean temperature. American
Meteorological Society, 23, 1601–1613.
Meehl, G. A., Zwiers, F., Evans, J., Knutson, T., Mearns, L., & Whetton, P. 2000. Trends
in extreme weather and climate events : issues related to modeling extremes in
projections of future climate change*. Bulletin of the American Meteorological
Society, 81(3), 427–436.
Miranda, J. de D., Jorquera, M. J., & Pugnaire, F. I. 2014. Phenological and reproductive
responses of a semiarid shrub to pulsed watering. Plant Ecology, 215(7), 769–777.
doi:10.1007/s11258-014-0354-7
Miranda, J. de D., Padilla, F. M., Lazaro, R., & Pugnaire, F. I. 2009. Do changes in
rainfall patterns affect semiarid annual plant communities? Journal of Vegetation
Sciencce, 20, 269–276.
Morita, K., Tamate, T., Kuroki, M., & Nagasawa, T. 2014. Temperature-dependent
variation in alternative migratory tactics and its implications for fitness and
population dynamics in a salmonid fish. The Journal of Animal Ecology, 83, 1268–
1278. doi:10.1111/1365-2656.12240
Nagler, P. L., Glenn, E. P., Kim, H., Emmerich, W., Scott, R. L., Huxman, T. E., &
Huete, A. R. 2007. Relationship between evapotranspiration and precipitation pulses
in a semiarid rangeland estimated by moisture flux towers and MODIS vegetation
indices. Journal of Arid Environments, 70(3), 443–462.
doi:10.1016/j.jaridenv.2006.12.026
Neil, K. L., Landrum, L., & Wu, J. 2010. Effects of urbanization on flowering phenology
in the metropolitan phoenix region of USA: findings from herbarium records.
Journal of Arid Environments, 74(4), 440–444. doi:10.1016/j.jaridenv.2009.10.010
Neveu, A. 2009. Incidence of climate on common frog breeding: long-term and short-
term changes. Acta Oecologica, 35(5), 671–678. doi:10.1016/j.actao.2009.06.012
Nitschke, C. R., & Innes, J. L. 2007. Climatic change and fire potential in South-Central
British Columbia, Canada. Global Change Biology, 14(4), 841–855.
doi:10.1111/j.1365-2486.2007.01517.x
Ovaskainen, O., Skorokhodova, S., Yakovleva, M., Sukhov, A., Kutenkov, A.,
Kutenkova, N., Shcherbakov, A., Meyke, E., & Delgado, M. del M. 2013.
Community-level phenological response to climate change. Proceedings of the
30 | P a g e
National Academy of Sciences of the United States of America, 110(33), 13434–
13439. doi:10.1073/pnas.1305533110/-
/DCSupplemental.www.pnas.org/cgi/doi/10.1073/pnas.1305533110
Pal, M., & Mather, P. M. 2003. An assessment of the effectiveness of decision tree
methods for land cover classification. Remote Sensing of Environment, 86(4), 554–
565. doi:10.1016/S0034-4257(03)00132-9
Peñuelas, J., Filella, I., Zhang, X., Llorens, L., Ogaya, R., Lloret, F., Comas, P., Estiarte,
M., & Terradas, J. 2004. Complex spatiotemporal phenological shifts as a response
to rainfall changes. New Phytologist, 161, 837–846. doi:10.1111/j.1469-
8137.2003.01003.x
Rathcke, B., & Lacey, E. P. 1985. Phenological patterns of terrestrial plants. Annual
Review of Ecology and Systematics, 16(1), 179–214.
doi:10.1146/annurev.es.16.110185.001143
Reynolds, J. F., Kemp, P. R., Ogle, K., & Fernández, R. J. 2004. Modifying the “pulse-
reserve” paradigm for deserts of North America: precipitation pulses, soil water, and
plant responses. Oecologia, 141(2), 194–210. doi:10.1007/s00442-004-1524-4
Roller, P. 1996. Distribution, growth, and reproduction of Pima pineapple cactus
(Coryphantha scheeri Kuntz var robustispina Schott). University of Arizona.
Rosenstock, S. S., Bleich, V. C., Rabe, M. J., & Reggiardo, C. 2005. Water quality at
wildlife water sources in the Sonoran Desert, United States. Rangeland Ecology
Management, 58(6), 623–627.
Sandel, B., Arge, L., Dalsgaard, B., Davies, R. G., Gaston, K. J., Sutherland, W. J., &
Svenning, J.-C. 2011. The influence of late quaternary climate-change velocity on
species endemism. Science, 334(6056), 660–4. doi:10.1126/science.1210173
Sayre, N. F. 2005. Interacting effects of landownership, land use, and endangered species
on conservation of Southwestern U. S. Rangelands. Conservation Biology, 19(3),
783–792.
Schiller, J. R., Zedler, P. H., & Black, C. H. 2000. The effect of density-dependent insect
visits, flowering phenology, and plant size on seed set of the endangered vernal pool
plant Pogogyne abramsii (Lamiaceae) in natural compared to created vernal pools.
Wetlands, 20(2), 386–396. doi:10.1672/0277-
5212(2000)020[0386:TEODDI]2.0.CO;2
Schloss, C. A., Nuñez, T. A., & Lawler, J. J. 2012. Dispersal will limit ability of
mammals to track climate change in the Western Hemisphere. Proceedings of the
National Academy of Sciences of the United States of America, 109(22), 8606–

31 | P a g e
8611. doi:10.1073/pnas.1116791109/-
/DCSupplemental.www.pnas.org/cgi/doi/10.1073/pnas.1116791109
Schmalzel, R. J., Nixon, R. T., Best, A. L., & Jr, J. A. T. 2004. Morphometric Variation
in Coryphantha robustispina (Cactaceae). Systematic Botany, 29(3), 553–568.
Schmidt, M., Traoré, S., Ouédraogo, A., Mbayngone, E., Ouédraogo, O., Zizka, A.,
Kirchmair, I., Kabore, E., Thiombiano, A., Hahn, K., & Zizka, G. 2013.
Geographical patterns of woody plants ’ functional traits in Burkina Faso.
Candollea, 68(2), 197–207.
Schwinning, S., & Sala, O. E. 2004. Hierarchy of responses to resource pulses in arid and
semi-arid ecosystems. Oecologia, 141(2), 211–20. doi:10.1007/s00442-004-1520-8
Schwinning, S., Sala, O. E., Loik, M. E., & Ehleringer, J. R. 2004. Thresholds, memory,
and seasonality: understanding pulse dynamics in arid/semi-arid ecosystems.
Oecologia, 141(2), 191–3. doi:10.1007/s00442-004-1683-3
Seager, R., Ting, M., Held, I., Kushnir, Y., Lu, J., Vecchi, G., Huang, H.-P., Hamik, N.,
Leetmaa, A., Lau, N.-C., Li, C., Velez, J., & Naik, N. 2007. Model projections of an
imminent transition to a more arid climate in southwestern North America. Science,
316(5828), 1181–4. doi:10.1126/science.1139601
Sodhi, N. S., Koh, L. P., Brook, B. W., & Ng, P. K. L. 2004. Southeast Asian
biodiversity: an impending disaster. Trends in Ecology & Evolution, 19(12), 654–
60. doi:10.1016/j.tree.2004.09.006
Stevenson, D. E., & Lauth, R. R. 2012. Latitudinal trends and temporal shifts in the catch
composition of bottom trawls conducted on the eastern Bering Sea shelf. Deep Sea
Research Part II: Topical Studies in Oceanography, 65-70, 251–259.
doi:10.1016/j.dsr2.2012.02.021
U.S. Depertment of Interior. 2001. United States Department of the Interior, U. S. Fish
and Wildlife Service AESO/SE 2-21-01-F-271 (pp. 1–16). Phoenix, Arizona.
U.S. Fish and Wildlife Service. 2007. U . S . Fish & Wildlife Service 5-Year Review
Determination Pima Pineapple Cactus. 70 FR 5460. Region 2 Regional Office (pp.
1–17).
Walther, G., Post, E., Convey, P., Menzel, A., Parmesan, C., Beebee, T. J. C., Fromentin,
J.-M., hoegh-Guldberg, O., & Bairlein, F. 2002. Ecological responses to recent
climate change. Nature, 416, 389–395.
Welbergen, J. A, Klose, S. M., Markus, N., & Eby, P. 2008. Climate change and the
effects of temperature extremes on Australian flying-foxes. Proceedings of the
Royal Society Biological Sciences 275, 419–425. doi:10.1098/rspb.2007.1385
32 | P a g e
Wernberg, T., Russell, B. D., Moore, P. J., Ling, S. D., Smale, D. A., Campbell, A.,
Coleman, M., Steinberg, P. D., kendrick, G. A., & Connell, S. D. 2011. Impacts of
climate change in a global hotspot for temperate marine biodiversity and ocean
warming. Journal of Experimental Marine Biology and Ecology, 400(1-2), 7–16.
doi:10.1016/j.jembe.2011.02.021
Wu, J. B., Xiao, X. M., Guan, D. X., Shi, T. T., Jin, C. J., & Han, S. J. 2009. Estimation
of the gross primary production of an old‐ growth temperate mixed forest using
eddy covariance and remote sensing. International Journal of Remote Sensing,
30(2), 463–479. doi:10.1080/01431160802372143
Ye, Q.-G., Yao, X.-H., Zhang, S.-J., Kang, M., & Huang, H.-W. 2006. Potential risk of
hybridization in ex situ collections of two endangered species of Sinojackia Hu
(Styracaceae). Journal of Integrative Plant Biology, 48(7), 867–872.
doi:10.1111/j.1744-7909.2006.00260.x
Yepez, E. A., Huxman, T. E., Ignace, D. D., English, N. B., Weltzin, J. F., Castellanos,
A. E., & Williams, D. G. 2005. Dynamics of transpiration and evaporation following
a moisture pulse in semiarid grassland: A chamber-based isotope method for
partitioning flux components. Agricultural and Forest Meteorology, 132(3-4), 359–
376. doi:10.1016/j.agrformet.2005.09.006

33 | P a g e
Author
Focus (*C. scheeri is focus, ^
C. scheeri is mentioned, "G
enus related only)
Bak
er, 2004
*A
naly
sis of taxo
nom
ic relationsh
ips b
etween
cory
phan
tha ro
bustisp
ina v
ariations, co
nsid
ers C. sch
eeri var. ro
bustisp
ina
separate.
Mills, 1
991
*D
escriptio
n o
f C. sch
eeri surv
ey, d
escriptio
n o
f hab
itat, phy
sical descrip
tion, an
d n
otes o
n sp
ecific pop
ulatio
ns th
rough
vario
us b
iolo
gical
surv
eys, in
cludes sp
eculatio
ns o
n cau
se of lo
w d
ensity
and th
reats(e.g. fire, weev
les, hab
itat loss)
Roller, 1
996
*E
xtensiv
e phy
sical descrip
tion o
f C. sch
eeri, germin
ation p
rocess, gro
wth
rates, and flo
werin
g
Phillip
s et al, 1981
*E
xtensiv
e phy
sical descrip
tion, as w
ell as descrip
tion o
f typ
ical hab
itat, and k
now
n (at th
e time) in
form
ation o
n flo
werin
g and rep
roductio
n,
McD
onald
& M
cPherso
n,
2005
*C
. scheeri m
ore lik
ely to
be p
ollin
ated if n
ear anoth
er, but n
ot p
ollin
ator lim
ited
USF
WS 5
-year rev
iew, 2
007
*D
etermin
ation C
. scheeri sh
ould
remain
listed as en
dan
gered, th
oro
ugh
overv
iew o
f existing literatu
re. Accep
ts Bak
er, 2004 sp
ecies delin
eation
over S
chm
alzel et al, 2
004 b
ased o
n co
mm
ents o
f review
ers.
Sch
malz
el et al, 2004
*C
. scheeri sp
ecies distin
ctions are q
uestio
nab
le, does n
ot th
ink d
istinctio
ns b
etween
subsp
ecies are significan
t.
McD
onald
, 2007
*U
ndergo
ne 9
nam
e chan
ges (robus v
ar robus @
time o
f article), extensiv
e phy
sical descrip
tion o
f C. sch
eeri.
Fox &
Nin
o-M
urcia, 2
0006
^Im
pacts to
threaten
ed an
d en
dan
gered sp
ecies is one o
f the stro
ngest d
rivers o
f conserv
ation b
ankin
g and stro
ng en
forcem
ent o
f regulatio
ns
increases th
e dem
and fo
r cconserv
ation b
ankin
g.
US D
OI C
onsu
ltation, 2
001
^O
verv
iew o
f PP
C h
abitat, th
reats, and k
now
n p
op
ulatio
n d
ynam
ics with
in rep
ort to
dev
elop
er
Say
re, 2005
^P
rivate lan
ds an
d lan
ds w
ith tem
porary
grazin
g exclusio
ns are easier to
restore after fire; th
reatened
and en
dan
gered sp
ecies mak
e restoratio
n
and o
ther activ
ities on state an
d fed
eral lands m
ore ch
allengin
g.
Marris, E
mm
a^T
here is ad
ditio
nal d
anger in
field stu
dies w
ithin
South
ern A
rizona d
ue to
illegal imigran
t crossin
gs and d
rug traffick
ing.
Man
dujan
o et al, 2
002
"Cory
phan
tha p
allida in
cluded
in stu
dy
on asso
ciation w
ith n
urse p
lants. R
elationsh
ip fo
und, b
ut statistically
not ro
bust.
Guad
alup
e et al, 2005
"Cory
phan
tha leu
chten
bergia, geo
rgii, glanduligera, gu
erkean
a, macro
var. m
acrom
eris, vau
pelian
a, ocatcan
tha, p
ullein
eana, d
elicata, nick
elsiae,
radian
s, salinen
sis, sulcata, an
d w
ohlsch
lageri inclu
ded
in rep
resented
species in
ven
tory
of stu
dy
of v
arious lo
cations to
evalu
ate species
div
ersity an
d d
etermin
e where co
nserv
ation actio
ns w
ill be m
ost effectiv
e.
Martin
ez-B
erdja &
Valv
erde, 2
008
"Cory
phan
tha w
erderm
annii in
cluded
in stu
dy
of relatio
nsh
ip b
etween
cactus gro
wth
, soil m
oistu
re, solar red
iation (as th
e noted
contrib
utio
ns
of a n
urse p
lant). A
ll species in
cluded
responded
to so
il moistu
re, no stro
ng resp
onse (if an
y) to
differen
t levels o
f solar rad
iation.
Nobel, 1
981
"Cory
phan
tha v
ivip
ara studied
for freez
ing effects. F
ound n
octu
rnal tem
ps b
elow
-15C
kill so
me, w
hile tem
ps b
elow
-20C
kill all o
bserv
ed
indiv
iduals. C
old
nigh
t temp
s app
ear to affect C
O2 u
ptak
e prio
r to cellu
lar dam
age.
Portilla-A
lonso
and
Marto
rell, 2011
"Cory
phan
tha w
erderm
annii stu
died
for effects o
f chro
nic an
thro
pogen
ic distu
rban
ce at differen
t study
locatio
ns. E
stablish
men
t and fecu
ndity
seems to
positiv
ley relate to
chro
nic d
isturb
ance, w
hereas gro
wth
seems n
egatively
related, in
dicatin
g that C
. werd
erman
nii is relativ
ely
distu
rban
ce-toleran
t.
Thom
as, 2005
"Cory
phan
tha v
ivip
ara inclu
ded
in stu
dy
of resilian
ce to fire d
amage. C
. viv
ipara w
as found to
hav
e 3.7
x high
er mortality
rate and fire d
amage
observ
ed to
decrease b
reedin
g pop
ulatio
n, th
ough
re-establish
men
t app
eared to
restore so
me o
f the p
revio
usly
observ
ed sp
p. d
ensity
.
Yearsley
, 2004
"Cory
phan
tha ro
bbin
soru
m p
resented
as study
species fo
r study
examin
ing th
e robustn
ess and effectiv
eness o
f transien
t dy
nam
ic modellin
g on
short-term
transien
t pop
ulatio
n d
ynam
ics, as com
pared
to lo
ng-term
. Resu
lts expan
d sco
pe o
f model to
inclu
de n
ear-term sen
sitivity
to gro
wth
rate and segregate m
odel in
to co
mp
onen
ts that rem
ove n
eed fo
r species age stru
cture an
d a co
mp
onen
t that co
rrects for th
e removal o
f the age-
structu
re assum
ptio
n.
Table 1
: Jou
rnal p
ub
lication
s and
these
s on
C. sch
eeri and
oth
er species in
the gen
us; also
inclu
ded
no
n-
com
preh
ensively are so
me relevan
t repo
rts..
34 | P a g e
APPENDX A: CLASSIFICATION TREE ESTIMATION OF THE CLIMATE
CHANGE VELOCITY GAP FOR LITTLE-STUDIED, SLOW-DISPERSING
ENDANGERED SPECIES
Amí L. Kidder1,2, Shirley A. Papuga1, David D. Breshears1,3 and Darin J. Law1
Targeted for publication in Conservation Biology
1School of Natural Resources and the Environment, University of Arizona, Tucson, AZ
85721 USA 3Department of Ecology and Evolutionary Biology, University of Arizona, Tucson, AZ
85721 USA 1Present address: School of Natural Resources and the Environment, University of Arizona,
Tucson, AZ [email protected]
35 | P a g e
Abstract
A fundamental conservation challenge is assessing potential climate change
impacts and management options for endemic, specialized, and rare species (including
threatened and endangered species), many of which have been little studied and for which
key information on dispersal rates is lacking. Of particularly concern are species for
which dispersal rates may be undocumented but are expected to be slow relative to
“climate velocity”, or speed at which a species must track climate change to remain
within suitable habitat. Given the need for maximal insights based on limited available
information for little-studied and likely slow-dispersing species, classification trees can
be especially useful because they offer potential for high predictive ability without a
priori assuming functional relationships between environmental variables used and
species suitability. Here we develop classification trees for a little-studied endangered
desert cactus species, Pima Pineapple Cactus (Coryphantha scheeri var. robustispina)
that, based on limited literature and functional type, is likely a relatively slow-dispersing
species. The classification trees correctly estimated either predicted absence or predicted
presence for >95% of present distribution cases and were most influenced by maximum
temperature and average precipitation. Using 2050 climate projections, a classification
tree with elevation estimated > 99% loss of current suitable habitat with little suitable
habitat added. Classification tree results for little-studied but likely slow-dispersing rare
species can highlight species vulnerability, identify locations within current range where
climate velocity might be tracked, and map candidate locations for assisted migration.
Key Words: Coryphantha scheeri var. robustispina, environmental modeling

36 | P a g e
1.0 Introduction
A fundamental conservation challenge is assessing potential climate change
impacts and management options for endemic, specialized, and rare species (including
threatened and endangered species), many of which have been little studied and for which
key information on reproduction and dispersal rates are often lacking. Particularly
important is the potential spatiotemporal lag between the rate of climate change and the
reproductive and dispersal rates of species, described as a “velocity gap” between current
and projected suitable habitat (Loarie et al., 2009; Sandel et al., 2011; Schloss et al.,
2012, IPCC, 2014). Such velocity gaps are further affected by other factors that influence
species movement rates (Robinet & Roques, 2010; Schloss et al., 2012), such as barriers
related to development and urban areas, agricultural lands, and elevational barriers, in
addition to biotic barriers such as those related to competition or pollination (Cassidy &
Grue, 2000; Fischer & Lindenmayer, 2005; Harrison & Rasplus, 2006; Walther et al.,
2009). The uncertainty surrounding the ability of particular plant species and associated
vegetative communities to mobilize in response to their current climate creates a
significant challenge for natural resource managers, particularly in assessing risks for rare
species (Caldow et al., 2007). Rare species often have population sizes too small to
remain resilient to environmental stressors and as such, are suffering disproportionate
loss with increased effects of climate change (Bro-Jørgensen, 2014; Cahill et al., 2013;
Convertino & Valverde, 2013).
Among the more vulnerable are species for which dispersal rates are expected to
be slow relative to the velocity gap (Fordham et al., 2012; Hiddink et al., 2012, IPCC,
2014). Many endemic, specialized, and rare species (including threatened and endangered

37 | P a g e
species) have been little studied and lack key information on dispersal rates. However,
limited information associated with a given rare species, along with related literature such
as that for the genus or functional type, can provide preliminary indications that a species
may be slow dispersing. Information on population dynamics and dispersal requirements
are often lacking in the literature due to the rare nature inherent to endangered species,
with the exception of the charismatic and economically important endangered species
that tend to be more fully researched (Bried & Mazzacano, 2010; Clucas et al., 2008;
Cove et al., 2013; Di Minin et al., 2013). In addition to challenges associated with
locating rare individuals, experiments and data collection possibilities are often limited
by the need for non-destructive methods (Ellender et al., 2012; Metcalf & Swearer,
2005). Additionally, access to existing data may be regulated in effort to protect the
species from interference.
Nonetheless managers need to obtain timely assessments of potential climate
impacts and management options despite data limitations. Expected ecosystem changes
potentially influencing rare species include expansion of invasive species (Pyke et al.,
2008; Rahel & Olden, 2008; Van Klinken et al., 2009), species density changes (Bertrand
et al., 2011; Rubidge et al., 2011; Thaxter et al., 2010), and species distribution shifts
(Chen et al., 2011; Parmesan & Yohe, 2003). In effort to understand the magnitude of
these changes, managers often turn to species distribution modeling, also referred to as
“environmental niche modeling” (Elith & Leathwick, 2009; Segurado & Araujo, 2004)
using an approach also referred to as “Machine Learning” (Bhattacharya, 2013).
Although there is no universally best approach to species distribution modelling (Austin,
38 | P a g e
2007; Bhattacharya, 2013), there are a variety of tools are used for predictive modeling,
each with specific advantages and disadvantages.
Notable tools include the generalized linear model (GLM), the generalized
additive model (GAM), the Genetic Algorithm for Rule Set Production (GARP),
classification and regression trees (CART), artificial neural networks (ANN), and a
variety of specialized interpolation and niche analysis tools typically designed to
accommodate multi-faceted climate space (Anderson et al., 2003; Austin, 2007;
Bhattacharya, 2013; Elith & Leathwick, 2009; Segurado & Araujo, 2004; Stockwell &
Peterson, 2002). With the availability of so many different techniques, it is important to
examine (1) the available data and (2) the desired outcome to select the best suited model
for the species distribution analysis (Austin, 2002; Austin, 2007). One tool, the
classification tree, has specific strengths which are particularly useful in predicting
potential range for an under-informed species. Primarily, classification trees make no a
priori assumptions between the variables used and the species’ preference, or frequency
of species positive relationship to any particular variable (Bhattacharya, 2013; Pal &
Mather, 2003). They also allow for a predictive model to be created with only a few
variables while maintaining predictive accuracy (Aitken et al., 2007). This gives
classification trees additional flexibility when assessing variables that may have a non-
linear relationship with the species (Pal & Mather, 2003). Classification tree results are
such that step-wise rules are given to enable ease of decision making (Hannöver &
Kordy, 2005; Pal & Mather, 2003; Segurado & Araujo, 2004; Yeh et al., 2009).
Weaknesses of the classification tree include over-fitness, which in species distribution
models may translate to an over-abundance of predicted suitable habitat for the given

39 | P a g e
species and variables (Van Ewijk et al., 2014); appropriate spatial scales for analysis and
sufficient number of verified presence locations relative to randomly determined
locations increase classification tree effectiveness (Aitken et al., 2007). Additionally,
since there is no assumption regarding the relationship between variables, the resulting
classification tree can give no indication of the potential probability of arriving at any
given branch of the tree (Haizhou & Chong, 2009). Despite these limitations, given the
need for maximal insights based on limited available information for little-studied and
likely slow-dispersing species, classification trees can be especially useful because they
offer potential for high predictive ability without assuming a priori functional
relationships between environmental variables used and species suitability.
Here we illustrate the functionality and usefulness of environmental modelling
with classification trees via an example endangered desert species: the Pima Pineapple
Cactus (Coryphantha scheeri var. robustispina), hereafter referred to as C. scheeri,
located in the southwestern U.S. and northern Mexico. We focus on the Arizona portion
of the distribution using available data sets. Based on limited literature and functional
type reviewed below, C. scheeri is likely a relatively slow-dispersing species, making
identification of projected changes in potential suitable habitat particularly useful.
Management of this desert species requires consideration of extreme heat in the summer
months in addition to great variability in rainfall patterns between localized heavy
summer monsoons and broad-scale winter rainfall. Because there is no clear
understanding of the climate envelope C. scheeri exists within, land managers are left
guessing at the best way to manage C. scheeri habitat. As projected climate change
scenarios take effect, a better understanding of the climate envelope for C. scheeri could

40 | P a g e
aid in the management of protected lands and surrounding resources to promote the
success of this and other threatened and endangered species.
Highlighting the more general problem where little information is available on the
parameters that contribute to the distribution of a rare species, we use classification trees
to explore associations between climate and environmental (elevation, soil texture)
variables with C. scheeri distribution in both current and projected future climate
conditions. More specifically, our objectives are to: (1) identify the primary factors
associated with C. scheeri distribution, and (2) project how suitable C. scheeri habitat
may shift in response to climate change. More generally, we highlight the utility of
classification trees in determining the spatiotemporal gap between climate change and
species distribution changes, particularly for little-studied and likely slow-dispersing
species.
2. Methods
2.1 Study Species.
C. scheeri is a small, hemispherical species characterized by their tubercles,
which differs from the typical ribs of most cactus species in the southwestern U.S., as
well as by their starburst spine formation that includes a single spine protruding directly
out from the top of the node (Roller, 1996; Schmalzel et al., 2004; U.S. Fish and Wildlife
Service, 2007). C. scheeri are located in the Santa Cruz and Altar Valleys in southern
Arizona (Baker, 2004; McDonald & McPherson, 2005; Roller, 1996; Schmalzel et al.,
2004) and are federally protected within the United States; their distribution does extend
into northern Mexico (Baker, 2004). C. scheeri is small and difficult to detect, especially
in grassy areas, and as a result, has not been widely surveyed across its range (U.S. Fish

41 | P a g e
and Wildlife Service, 2007). Previous research provides some description of the physical
landscape characteristics that C. scheeri is found in, such as on slopes <10% (U.S. Fish
and Wildlife Service, 2007), but there is very little information published and available to
the general public on the effects of climatic factors such as temperature and precipitation
(Table 1). The species depends on a specific pollinator bee species (Diadasia), and a
trace study of pollination patterns suggested pollination may not be limiting, but average
pollination distance was limited and less than the pollination area visited by individual
Diadasia (1 km; McDonald & McPherson, 2005). Little other data regarding
reproduction and dispersal rates exist, but in general cacti as a functional group are
expected to disperse relatively slowly (Butler et al., 2012; Gibbs et al., 2008; Godínez-
Alvarez & Valiente-Banuet, 2004); cacti species may have even slower dispersal rates
than trees, which were the slowest functional group relative to velocity gaps in a recent
synthesis (IPCC, 2014).
2.2 Spatial Data Sets
We conducted a spatial analysis with geographic information systems (GIS)
location data of the C. scheeri, along with shapefiles of environmental variables, to
quantify the association of these factors with the species’ distribution. The Arizona
Heritage Data Management System (AHDMS) group maintains spatial data for both
invasive and endangered species across Arizona as part of the state’s land management
and planning. The spatial data was first submitted to Arizona Game and Fish Department
through various land surveys completed by environmental consultants, development
agencies, land management agencies, and others as guided by the endangered species
management program in the state, and was then managed by AHDMS. Spatial location

42 | P a g e
data for all known C. scheeri in Arizona (6905 individuals, alive and dead) was provided
by AHDMS for this study. This spatial data on the distribution of C. scheeri within
Arizona was combined with spatial data for each environmental factor to identify
parameters associated with C. scheeri.
Spatial data for climate and environmental data used for this analysis was
collected from a variety of sources and loaded into ArcMap 10.2. We identified six
environmental factors for use in our analysis: (1) elevation (Fig. 1a), (2) soil texture type
(Fig. 1b), (3) precipitation (Fig. 1c), (4) maximum annual temperature (Fig. 1d), (5)
minimum annual temperature (Fig. 1e), and (6) annual temperature range (Fig. 1f).
Elevation data (Elev) for the state of Arizona was obtained from the U.S. Geological
Survey (USGS) National Map Viewer (http://viewer.nationalmap.gov/viewer/) at a
resolution of one-third arcsecond. The map was highlighted to select Arizona as the
desired range within the National Map Viewer, which was then sent from USGS as 62
shapefiles. These files were imported into ArcMap and combined into a single raster; the
extraneous data outside of Arizona was clipped and removed from the raster.
Information on soil texture was obtained from the U.S.D.A Natural Resources
Conservation Service SSURGO (http://sdmdataaccess.nrcs.usda.gov/), which is a digital
soil survey database at a 1:24,000 resolution. The data were downloaded as a package
containing several different soil characteristics for the state of Arizona. The SSURGO
polygon shapefile was imported into ArcMap, and the polygon file was joined using the
map unit key field (MUKEY) to join the polygons with the soil texture data, identifying
the soil texture type for each polygon.

43 | P a g e
The PRISM climate group (http://www.prism.oregonstate.edu/) maintains a
dataset of 30-year normal averages for precipitation (ppt) and maximum and minimum
temperature (Tmax and Tmin, respectively), each at a resolution of 800m. The shapefiles
were downloaded for each of these parameters and imported into ArcMap. Each file
contained data for the entirety of the United States and was clipped down to the extent of
Arizona. Using the raster calculator, Tmin was subtracted from Tmax to identify Trange as a
6th factor to evaluate as a contributor to C. scheeri distribution. In addition, the effect of
seasonal ppt was examined by using the raster calculator in ArcMap to sum monthly ppt
data into six-month totals; winter ppt consisted of October – March data (Fig. 1g) and
summer ppt consisted of April – August data (Fig. 1h).
Climate projection spatial data was obtained from WorldClim.org, a collection of
different data layers available for ecological and modeling research (IPCC, 2013). For
this analysis, projection data for the year 2050 via the CCSM4 model at 30 seconds
resolution was used due to the robustness of the model and its inclusion of factors that
directly impact the southwestern U.S., such as the El Nino Southern Oscillation (Gent et
al., 2011). Projections for Tmax, Tmin, and ppt were downloaded for the four available
climate change scenarios: R26, R45, R60, and R85. Each of these scenarios refer to a
representative concentration pathway (RCP), which each respectively indicate an
increasing level of climate change severity. R26 projections assume the maximum
abatement efforts of greenhouse gases (GHG) leading to peak levels of GHG in between
2010-2020 and decreasing after; R45 and R60 each indicate longer durations of GHG
concentration increases (approximately 2040 and 2060, respectively); and R85 assumes
GHG levels increase through the end of the century (IPCC, 2007). The monthly average
44 | P a g e
data from each RCP scenario were averaged to create an annual average, spatially
projected in GCS North American 1983 coordinate system, and clipped to the same
extent as the current data projections.
2.3 Classification Tree Validation/Verification
Classification trees created in MATLAB R2014a were then developed to estimate
predicted presence or predicted absence of C. scheeri under specified environmental
conditions. Spatial data for all six environmental factors (Tmax, Tmin, Trange, ppt, Elev, and
soil texture) were imported as shapefiles into ArcMap along with C. scheeri location
data. All layers originated in GCS North American 1983 except soil texture, which was
transformed for consistency. In addition to verified presence data points specific to C.
scheeri location, we also selected 7000 randomly-generated location points within the
boundaries of Arizona for our analysis. Using a spatial analyst tool in ArcMap, the values
for the six predictors for each C. scheeri verified presence point and random location
point were extracted and exported into data tables.
Using a split sample design, we trained a classification tree in MATLAB with a
data set that combined 75% of points for both C. scheeri verified presence and for
random locations. Using the remaining 25% of the points of each type, we tested the
predictive ability of the tree (Iverson & Prasad, 1998). Points that the tree predicted
presence of C. scheeri (value = TRUE/1) were compared to points with verified presence
of C. scheeri, while points that the tree predicted absence of C. scheeri (value =
FALSE/0), were compared to random locations. To validate our method we randomly
shuffled the data five times, and each time recreated a classification tree.

45 | P a g e
2.4 Classification Tree Model Prediction
To look at the potential distribution of C. scheeri within Arizona, we rasterized
the state into six grids of 695 x 742 pixels each. Using a single classification tree (Fig. 2),
we established the predicted presence or predicted absence of C. scheeri for each pixel.
To do this, environmental factors for the entire state of Arizona (see Section 2.4) were
exported as rasterized grids from ArcMap and loaded into MATLAB. The grids were
reshaped into column vectors, and the values throughout Arizona were evaluated with the
classification tree for C. scheeri habitat suitability. The resulting evaluation was then
reshaped back to the original grid and, with cell sizes identified, imported into ArcMap
displaying the state of Arizona.
Building on projected current suitable C. scheeri habitat, we next evaluated how
that spatial distribution might shift under future climate change scenarios. The climate
projection data (Tmin, Tmax, Trange, ppt) were also exported from ArcMap as rasterized
grids and loaded into MATLAB. Elevation and soil texture type are not expected to
change within this time scale, and as such, current spatial data was used to project future
C. scheeri habitat for 2050. Each future projection scenario was evaluated through the
classification tree, and a projection of suitable C. scheeri habitat was created for each
scenario.
Our initial classification tree included elevation as an important variable, but
because elevation is considered within PRISM climate data calculations, it is removed to
avoid redundancy. Additionally, in regards to plant distribution, elevation restrictions are
due to climate variables, and as such, future climate change might remove elevation
constraints associated with the first model (Beckage et al., 2008; Chen et al., 2011).
46 | P a g e
Therefore, to consider future projected suitable habitat not constrained by elevation, we
developed another classification tree for current distribution that did not include
elevation; we subsequently used this tree to estimate another set of projected changes
under future climate. Finally, because seasonal precipitation distribution within the
species distribution range has been shown to impact growth and distribution of local
species (Cable & Huxman, 2004), we developed a classification tree that included totals
for winter and for summer precipitation (in addition to the annual total previously
considered; this tree also excluded elevation).
3. Results
The classification tree created as the predictor for C. scheeri distribution analysis
was evaluated for accuracy between iterations to review for sampling bias within the
creation data subset. All iterations of the classification tree (Table 2) demonstrate high
accuracy in predicting both verified presence locations and random locations. In creating
the second classification tree without elevation included as a predictor, the same review
of sampling bias was conducted, and again, all iterations of the classification tree
demonstrate high accuracy (Table 3). The third classification tree including winter and
summer precipitation was subject to the same review (Table 4).
The classification tree created in the analysis with elevation (Fig. 2) indicates that
Tmax is the primary predictor in determining suitable C. scheeri habitat, followed by ppt
and Elev as secondary predictors. These three predictors remain the dominant factors
through the top tiers of the classification tree. Tmin and Trange appear as tertiary predictors
with soil texture type as the least common predictor. In the classification tree created for
the second analysis (Fig. 3) without Elev as a predictor, Tmax and ppt remain the primary
47 | P a g e
and secondary predictors, respectively. Trange and Tmin remain the tertiary predictors,
though in this analysis they are contributing factors notably higher on the classification
tree. The least common predictor remains soil texture type in this analysis. The
classification tree created in the third analysis (Fig. 4) that included winter and summer
precipitation indicates that Tmax and summer precipitation are the primary predictors, with
winter precipitation and Tmin as secondary predictors; Trange and ppt occur further down
on this classification tree.
The projections of suitable C. scheeri habitat under current conditions (Fig. 5) are
very similar between the analyses with and without elevation, and both are consistent
with the current known distribution of C. scheeri. The projections indicate that current
suitable C. scheeri habitat extends north and west of the currently observed C. scheeri
habitat at the southern extent of the projections. The projection of suitable habitat in the
analysis including seasonal precipitation (Fig. 5c) is consistent with current known
distribution, though this tree projects less suitable habitat to the north and west than the
first two analyses.
Projections of future C. scheeri habitat differ visibly between analyses with
elevation, without elevation, and including seasonal precipitation. In analysis of future
climate scenarios R26, R45, R60, and R85 with Elev as a predictor, there appears to be
little C. scheeri habitat within the boundaries of Arizona (Fig. 6). In the analysis without
Elev as a variable, each future climate scenario indicates that while little C. scheeri
habitat remains within the current range, there are extensive new areas with potential
suitable habitat in northern and eastern Arizona (Fig. 7). Future projections including
seasonal precipitation display some habitat loss within the current range, with sparse

48 | P a g e
suitable habitat extending north and west of the current distribution (Fig. 8). For all
analyses, projections were consistent across all climate scenarios, indicating little change
between R26, R45, R60, and R85.
4. Discussion
Methodologically, the high accuracy of the classification tree as a model to
predict C. scheeri suitable habitat is notable. This type of model typically has good
results in habitat projection among species that exhibit a tight relationship with their
environment, as highlighted here by a prediction rate over 95% for all iterations of the
model for C. scheeri. The high reliability of the classification tree for current distribution
increases our confidence in its utility for projections for 2050.
It is important to note that these results are evaluating the conditions of C. scheeri
versus the current distribution. Location data for C. scheeri provided by AHDMS is often
collected as a result of development and land use activities such that known locations
may not indicate the full distribution of the species. Given the available resolutions of the
data used here (see section 2.2), projections are sufficient for estimating general suitable
C. scheeri habitat, but where detailed site-specific information is needed, thorough
surveys (e.g. using the approach detailed by Roller, 1996) should be completed to
confirm presence or absence.
An additional caveat is that the spatial data used for this evaluation are mean
values, and are not meant to indicate extreme climate conditions or events. Projections of
suitable habitat displayed here are estimates of where C. scheeri may exist; they are not
verified locations within the whole of the projected range. Results displayed are
indicative of suitable habitat, but these associations with average climate conditions may

49 | P a g e
not correspond to specific conditions determining plant mortality, which may be more
related to extreme events (McDowell et al., 2008).
From a conservation perspective, the classification trees (with and without
elevation, and without or including winter and summer precipitation) all project an
enormous loss of suitable habitat within the species current range. This projection
reinforces the need for protection, active management, and DNA archival of the species
as climate change progresses. Given the severe loss projected, those actions may be
insufficient to conserve the species. The classification tree without elevation as a
constraint also highlights that large portions of Arizona outside the current C. scheeri
range could become suitable habitat. However, given the likely slow dispersal rate of this
species and its dependence on a specific pollinator bee species, the likelihood of this
species tracking the velocity gap of climate change seems low. Also, these additional
areas are not identified as suitable habitat when seasonal precipitation is considered.
Consequently, managers may need to actively intervene through microclimate
manipulations that reduce the maximum temperature and add soil moisture to help
preserve the species. Additionally or alternatively, managers could evaluate
implementing assisted migration to new suitable habitat, but would need to account for
pollinator issues, as well as uncertainties associated with several other aspects of the
species’ biology.
A further challenge to management includes trans-border issues since the
distribution of C. scheeri spans into northern Mexico. We expect that C. scheeri in
Mexico will be subject to the same climatic pressures as the population in southern
Arizona, without the protections assured by U.S. Federal regulations. As is the case for

50 | P a g e
all species distributed across international borders, there is a matrix of land management
and land use practices that contribute to overall species health and distribution. In regards
to conservation efforts, international collaboration is often required from both
governmental and independent agencies to maintain robust ecosystems across political
boundaries.
More generally, our study illustrates how classification tree results for little-
studied but likely slow-dispersing rare species can be useful in a variety of contexts:
predicting existing suitable habitat within the current range of a rare species where other
individuals are most likely to be located; identifying future potential habitat and
associated vulnerabilities, including where climate velocity might be tracked, and
mapping candidate locations for consideration in the context of assisted migration.
Approaches such as this are needed to aide conservation managers in making the best
decisions possible for rare species in a timely manner despite substantial data limitations
on dispersal rates and other aspects of species biology.
Acknowledgements
Support for this project was provided by the Raytheon Company Missile Systems
Environmental, Health, Safety, and Sustainability Department. Additional support was
provided by NSF Critical Zone Observatory (NSF-EAR-1331408). We would like to
acknowledge and thank the members of the Papuga and Breshears labs at the University
of Arizona, School of Natural Resources and the Environment. Additionally, D. P.
Guertin and M. King have provided valuable advice in the approach of this study. A
special thanks to J. Crawford with U.S. Fish and Wildlife Service and S. Tonn with the

51 | P a g e
Arizona Game and Fish Department for assistance in obtaining C. scheeri spatial location
data.
52 | P a g e
References:
Aitken, M., Roberts D. W., & Shultz, L. M. 2007. Modeling distribution of rare plants in
the great basin, western North America. Western North American Naturalist, 67(1),
26-38.
Anderson, R. P., Lew, D., & Peterson, A. T. 2003. Evaluating predictive models of
species’ distributions: criteria for selecting optimal models. Ecological Modelling,
162(3), 211–232. doi:10.1016/S0304-3800(02)00349-6
Austin, M. 2007. Species distribution models and ecological theory: A critical assessment
and some possible new approaches. Ecological Modelling, 200(1-2), 1–19.
doi:10.1016/j.ecolmodel.2006.07.005
Austin, M. 2002. Spatial prediction of species distribution: an interface between
ecological theory and statistical modelling. Ecological Modelling, 157(2-3), 101–
118. doi:10.1016/S0304-3800(02)00205-3
Baker, M. 2004. Phenetic analysis of Coryphantha, section Robustispina (cactaceae),
part 1: stem characters.U.S. Fish and Wildlife Service report (pp. 1–21). Tempe,
Arizona
Beckage, B., Osborne, B., Gavin, D. G., Pucko, C., Siccama, T., & Perkins, T. 2008. A
rapid upward shift of a forest ecotone during 40 years of warming in the Green
Mountains of Vermont. Proceedings of the National Academy of Sciences of the
United States of America, 105(11), 4197–202. doi:10.1073/pnas.0708921105
Bertrand, R., Lenoir, J., Piedallu, C., Riofrío-Dillon, G., de Ruffray, P., Vidal, C., Pierrat,
J.-C., & Gégout, J.-C. 2011. Changes in plant community composition lag behind
climate warming in lowland forests. Nature, 479(7374), 517–20.
doi:10.1038/nature10548
Bhattacharya, M. 2013. Bioclimatic modelling: a machine learning perspective.
International Journal of Advanced Computer Science and Applications, 4(2), 1–8.
Bried, J. T., & Mazzacano, C. A. 2010. National review of state wildlife action plans for
Odonata species of greatest conservation need. Insect Conservation and Diversity,
3(2), 61–71. doi:10.1111/j.1752-4598.2010.00081.x
Bro-Jørgensen, J. 2014. Will their armaments be their downfall? Large horn size
increases extinction risk in bovids. Animal Conservation, 17(1), 80–87.
doi:10.1111/acv.12062

53 | P a g e
Butler, C. J., Wheeler, E. A., Stabler, L. B., The, S., & Society, B. 2012. Distribution of
the threatened lace hedgehog cactus (Echinocereus reichenbachii) under various
climate change scenarios. Journal of the Torrey botanical Society, 139(1), 46–55.
Cable, J. M., & Huxman, T. E. 2004. Precipitation pulse size effects on Sonoran Desert
soil microbial crusts. Oecologia, 141(2), 317–24. doi:10.1007/s00442-003-1461-7
Cahill, A. E., Aiello-Lammens, M. E., Fisher-Reid, M. C., Hua, X., Karanewsky, C. J.,
Ryu, H. Y., Sbeglia, G. C., Spagnolo, F., Waldron, J. B., Warsi, O., & Wiens, J. J.
2013. How does climate change cause extinction? Proceedings. Biological Sciences
/ The Royal Society, 280(1750), 20121890. doi:10.1098/rspb.2012.1890
Caldow, R. W. G., Stillman, R. A, le V. dit Durell, S. E. A., West, A. D., McGrorty, S.,
Goss-Custard, J. D., Wood, P. J., Humphreys, J. 2007. Benefits to shorebirds from
invasion of a non-native shellfish. Proceedings of the Royal Society Biological
Sciences, 274, 1449–1455. doi:10.1098/rspb.2007.0072
Cassidy, K. M., & Grue, C. E. 2000. The role of private and public lands in in
conservation of vertebrates State Washington. Wildlife Society Bulletin, 28(4),
1060–1076.
Chen, I.-C., Hill, J. K., Ohlemüller, R., Roy, D. B., & Thomas, C. D. 2011. Rapid range
shifts of species associated with high levels of climate warming. Science, 333(6045),
1024–6. doi:10.1126/science.1206432
Clucas, B., McHugh, K., & Caro, T. 2008. Flagship species on covers of US conservation
and nature magazines. Biodiversity and Conservation, 17(6), 1517–1528.
doi:10.1007/s10531-008-9361-0
Convertino, M., & Valverde, L. J. 2013. Portfolio decision analysis framework for value-
focused ecosystem management. PloS One, 8(6), e65056.
doi:10.1371/journal.pone.0065056
Cove, M. V., Pardo Vargas, L. E., de la Cruz, J. C., Spínola, R. M., Jackson, V. L.,
Saénz, J. C., & Chassot, O. 2013. Factors influencing the occurrence of the
Endangered Baird’s tapir Tapirus bairdii: potential flagship species for a Costa
Rican biological corridor. Oryx, 48(03), 402–409. doi:10.1017/S0030605313000070
Di Minin, E., Fraser, I., Slotow, R., & MacMillan, D. C. 2013. Understanding
heterogeneous preference of tourists for big game species: implications for
conservation and management. Animal Conservation, 16(3), 249–258.
doi:10.1111/j.1469-1795.2012.00595.x
Elith, J., & Leathwick, J. R. 2009. Species distribution models: ecological explanation
and prediction across space and time. Annual Review of Ecology, Evolution, and
Systematics, 40(1), 677–697. doi:10.1146/annurev.ecolsys.110308.120159
54 | P a g e
Ellender, B. R., Becker, A., Weyl, O. L. F., & Swartz, E. R. 2012. Underwater video
analysis as a non-destructive alternative to electrofishing for sampling imperilled
headwater stream fishes. Aquatic Conservation: Marine and Freshwater Ecosystems,
22(1), 58–65. doi:10.1002/aqc.1236
Fischer, J., & Lindenmayer, D. B. 2005. The sensitivity of lizards to elevation: A case
study from south-eastern Australia. Diversity and Distributions, 11(3), 225–233.
doi:10.1111/j.1366-9516.2005.00139.x
Fordham, D. a, Watts, M. J., Delean, S., Brook, B. W., Heard, L. M. B., & Bull, C. M.
2012. Managed relocation as an adaptation strategy for mitigating climate change
threats to the persistence of an endangered lizard. Global Change Biology, 18(9),
2743–55. doi:10.1111/j.1365-2486.2012.02742.x
Gent, P. R., Danabasoglu, G., Donner, L. J., Holland, M. M., Hunke, E. C., Jayne, S. R.,
Lawrence, D. M., Neale, R. B., Rasch, P. J., Vertenstein, M., Worley, P. H., Yang,
Z.-L., & Zhang, M. 2011. The Community Climate System Model Version 4.
Journal of Climate, 24(19), 4973–4991. doi:10.1175/2011JCLI4083.1
Gibbs, J. P., Marquez, C., & Sterling, E. J. 2008. The role of endangered species
reintroduction in ecosystem restoration: tortoise–cactus interactions on Española
Osland, Galápagos. Restoration Ecology, 16(1), 88–93. doi:10.1111/j.1526-
100X.2007.00265.x
Godínez-Alvarez, H., & Valiente-Banuet, A. 2004. Demography of the columnar cactus
Neobuxbaumia macrocephala: a comparative approach using poipulation projection
matricies. Plant Ecology, 174, 109–118.
Haizhou, D., & Chong, M. 2009. Study on constructing generalized decision tree by
using DNA coding genetic algorithm. 2009 International Conference on Web
Information Systems and Mining, 163–167. doi:10.1109/WISM.2009.41
Hannöver, W., & Kordy, H. 2005. Predicting outcomes of in-patient psychotherapy using
quality management data: comparing classification and regression trees with logistic
regression and linear discriminant analysis. Psychotherapy Research : Journal of the
Society for Psychotherapy Research, 15(3), 236–47.
doi:10.1080/10503300512331334995
Harrison, R. D., & Rasplus, J.-Y. 2006. Dispersal of fig pollinators in Asian tropical rain
forests. Journal of Tropical Ecology, 22(06), 631. doi:10.1017/S0266467406003488
Hiddink, J. G., Ben Rais Lasram, F., Cantrill, J., & Davies, a. J. 2012. Keeping pace with
climate change: what can we learn from the spread of Lessepsian migrants? Global
Change Biology, 18(7), 2161–2172. doi:10.1111/j.1365-2486.2012.02698.x
55 | P a g e
IPCC, 2007: Climate Change 2007: Synthesis Report. Contribution of Working Groups I,
II and III to the Fourth Assessment Report of the Intergovernmental Panel on
Climate Change [Core Writing Team, Pachauri, R.K and Reisinger, A. (eds.)].
IPCC, Geneva, Switzerland, 104 pp.
IPCC, 2013: Climate Change 2013: The Physical Science Basis. Contribution of Working
Group I to the Fifth Assessment Report of the Intergovernmental Panel on Climate
Change [Stocker, T.F., D. Qin, G.-K. Plattner, M. Tignor, S.K. Allen, J. Boschung,
A. Nauels, Y. Xia, V. Bex and P.M. Midgley (eds.)]. Cambridge University Press,
Cambridge, United Kingdom and New York, NY, USA, 1535 pp,
doi:10.1017/CBO9781107415324
IPCC, 2014: Climate Change 2014: Impacts, Adaptation, and Vulnerability. Part A:
Global and Sectoral Aspects. Contribution of Working Group II to the Fifth
Assessment Report of the Intergovernmental Panel on Climate Change [Field, C.B.,
V.R. Barros, D.J. Dokken, K.J. Mach, M.D. Mastrandrea, T.E. Bilir, M. Chatterjee,
K.L. Ebi, Y.O. Estrada, R.C. Genova, B. Girma, E.S. Kissel, A.N. Levy, S.
MacCracken, P.R. Mastrandrea, and L.L. White (eds.)]. Cambridge University
Press, Cambridge, United Kingdom and New York, NY, USA, 1132 pp.
Loarie, S. R., Duffy, P. B., Hamilton, H., Asner, G. P., Field, C. B., & Ackerly, D. D.
2009. The velocity of climate change. Nature, 462(7276), 1052–1055.
doi:10.1038/nature08649
McDonald, C., & McPherson, G. 2005. Pollination of pima pineapple cactus
(Coryphantha scheeri var. robustispina): does pollen flow limit abundance of this
endangered species. USDA Forest Service Proceedings, 529–532.
McDowell, N., Pockman W. T., Allen C. D., Breshears D. D., Cobb N., Kolb T., Plaut J.,
Sperry J., West A., Williams D. G., & Yepez, E.. 2008. Mechanisms of plant
survival and mortality during drought: why do some plants survive while others
succumb to drought? New Phytologist 178(4), 719-739
Metcalf, S. J., & Swearer, S. E. 2005. Non-destructive ageing in Notolabrus tetricus
using dorsal spines with an emphasis on the benefits for protected, endangered and
fished species. Journal of Fish Biology, 66, 1740–1747. doi:10.1111/j.1095-
8649.2005.00704.x
Pal, M., & Mather, P. M. 2003. An assessment of the effectiveness of decision tree
methods for land cover classification. Remote Sensing of Environment, 86(4), 554–
565. doi:10.1016/S0034-4257(03)00132-9
Parmesan, C., & Yohe, G. 2003. A globally coherent fingerprint of climate change
impacts across natural systems. Nature, 421(6918), 37–42. doi:10.1038/nature01286
56 | P a g e
Pyke, C. R., Thomas, R., Porter, R. D., Hellmann, J. J., Dukes, J. S., Lodge, D. M., &
Chavarria, G. 2008. Current practices and future opportunities for policy on climate
change and invasive species. Conservation Biology : The Journal of the Society for
Conservation Biology, 22(3), 585–92. doi:10.1111/j.1523-1739.2008.00956.x
Rahel, F. J., & Olden, J. D. 2008. Assessing the effects of climate change on aquatic
invasive species. Conservation Biology : The Journal of the Society for
Conservation Biology, 22(3), 521–33. doi:10.1111/j.1523-1739.2008.00950.x
Robinet, C., & Roques, A. 2010. Direct impacts of recent climate warming on insect
populations. Integrative Zoology, 5(2), 132–42. doi:10.1111/j.1749-
4877.2010.00196.x
Roller, P. 1996. Distribution, growth, and reproduction of Pima pineapple cactus
(Coryphantha scheeri Kuntz var robustispina Schott). University of Arizona.
Rubidge, E. M., Monahan, W. B., Parra, J. L., Cameron, S. E., & Brashares, J. S. 2011.
The role of climate, habitat, and species co-occurrence as drivers of change in small
mammal distributions over the past century. Global Change Biology, 17(2), 696–
708. doi:10.1111/j.1365-2486.2010.02297.x
Sandel, B., Arge, L., Dalsgaard, B., Davies, R. G., Gaston, K. J., Sutherland, W. J., &
Svenning, J.-C. 2011. The influence of late quaternary climate-change velocity on
species endemism. Science, 334(6056), 660–4. doi:10.1126/science.1210173
Schloss, C. A., Nuñez, T. A., & Lawler, J. J. 2012. Dispersal will limit ability of
mammals to track climate change in the Western Hemisphere. Proceedings of the
National Academy of Sciences of the United States of America, 109(22), 8606–
8611. doi:10.1073/pnas.1116791109/-
/DCSupplemental.www.pnas.org/cgi/doi/10.1073/pnas.1116791109
Schmalzel, R. J., Nixon, R. T., Best, A. L., & Jr, J. A. T. 2004. Morphometric Variation
in Coryphantha robustispina ( Cactaceae ). Systematic Botany, 29(3), 553–568.
Segurado, P., & Araujo, M. B. 2004. An evaluation of methods for modelling species
distributions. Journal of Biogeography, 31, 1555–1568.
Sodhi, N. S., Koh, L. P., Brook, B. W., & Ng, P. K. L. 2004. Southeast Asian
biodiversity: an impending disaster. Trends in Ecology & Evolution, 19(12), 654–
60. doi:10.1016/j.tree.2004.09.006
Stockwell, D. R., & Peterson, A. T. 2002. Effects of sample size on accuracy of species
distribution models. Ecological Modelling, 148(1), 1–13. doi:10.1016/S0304-
3800(01)00388-X
57 | P a g e
U.S. Fish and Wildlife Service. 2007. U . S . Fish & Wildlife Service 5-Year Review
Determination Pima Pineapple Cactus. 70 FR 5460. Region 2 Regional Office (pp.
1–17).
Van Ewijk, K. Y., Randin, C. F., Treitz, P. M., & Scott, N. a. 2014. Predicting fine-scale
tree species abundance patterns using biotic variables derived from LiDAR and high
spatial resolution imagery. Remote Sensing of Environment, 150, 120–131.
doi:10.1016/j.rse.2014.04.026
Van Klinken, R. D., Lawson, B. E., & Zalucki, M. P. 2009. Predicting invasions in
Australia by a neotropical shrub under climate change: the challenge of novel
climates and parameter estimation. Global Ecology and Biogeography, 18(6), 688–
700. doi:10.1111/j.1466-8238.2009.00483.x
Walther, G.-R., Roques, A., Hulme, P. E., Sykes, M. T., Pysek, P., Kühn, I., Zobel, M.,
Bacher, S., Botta-Dukat, Z., Bugmann, H., Czucz, B., Dauber, J., Hickler, T.,
Jarosik, V., Kenis, M., Klotz, K., Minchin, D., Moora, M., Nentwig., Ott, J., Panov,
V. E., Reineking, B., Robinet, C., Semenchenko, V., Solarz, W., Thuiller, W., Vila,
M., Vohland, K., & Settele, J. 2009. Alien species in a warmer world: risks and
opportunities. Trends in Ecology & Evolution, 24(12), 686–93.
doi:10.1016/j.tree.2009.06.008
Yeh, D.-Y., Cheng, C.-H., & Hsiao, S.-C. 2009. Classification knowledge discovery in
mold tooling test using decision tree algorithm. Journal of Intelligent Manufacturing,
22(4), 585–595. doi:10.1007/s10845-009-0321-7

58 | P a g e
List of Tables:
Table 1: Journal publications and theses on C. scheeri and other species in the genus; also
included non-comprehensively are some relevant reports……………………………….60
Table 2: An evaluation of the classification tree created with elevation for consistency
and accuracy and to determine any bias in the data selected to create the tree………….61
Table 3: An evaluation of the classification tree built without elevation as a predictor for
consistency and accuracy and to determine any bias in the data selected to create the
tree………………………………………………………………………………………62
Table 4: An evaluation of the classification tree built including seasonal precipitation as a
predictor (without elevation included) for consistency and accuracy and to determine any
bias in the data selected to create the
tree………………………………………………...63
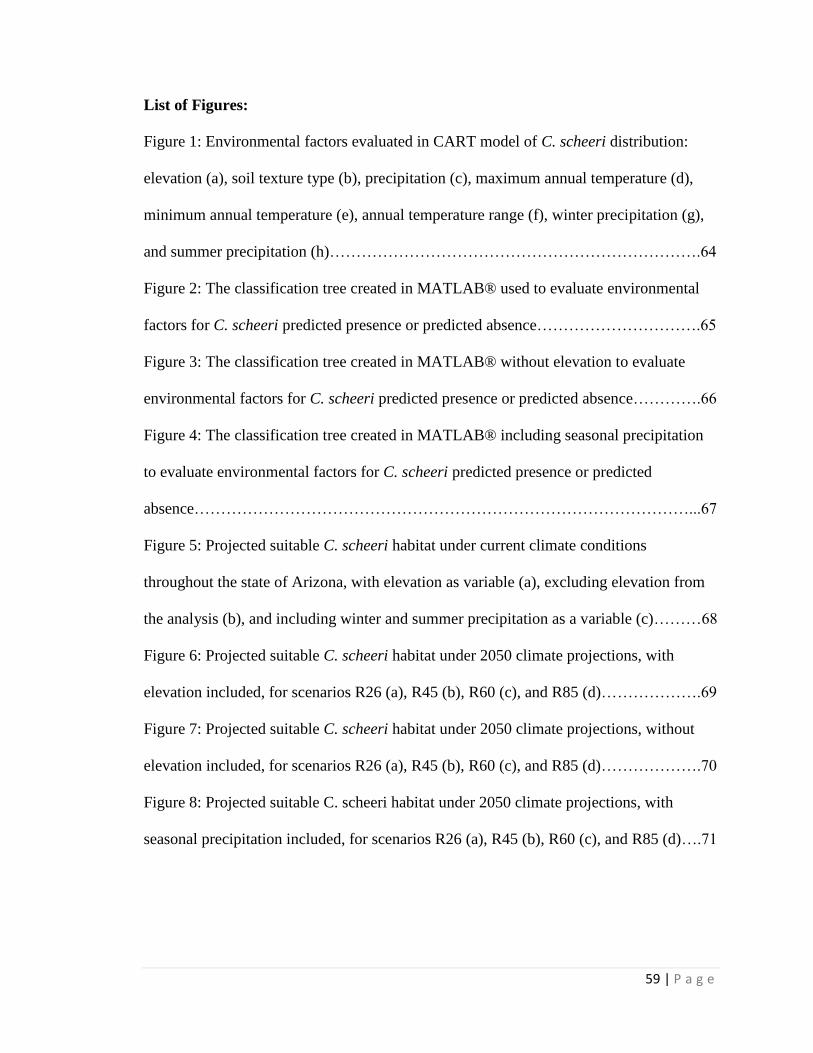
59 | P a g e
List of Figures:
Figure 1: Environmental factors evaluated in CART model of C. scheeri distribution:
elevation (a), soil texture type (b), precipitation (c), maximum annual temperature (d),
minimum annual temperature (e), annual temperature range (f), winter precipitation (g),
and summer precipitation (h)…………………………………………………………….64
Figure 2: The classification tree created in MATLAB® used to evaluate environmental
factors for C. scheeri predicted presence or predicted absence………………………….65
Figure 3: The classification tree created in MATLAB® without elevation to evaluate
environmental factors for C. scheeri predicted presence or predicted absence………….66
Figure 4: The classification tree created in MATLAB® including seasonal precipitation
to evaluate environmental factors for C. scheeri predicted presence or predicted
absence…………………………………………………………………………………...67
Figure 5: Projected suitable C. scheeri habitat under current climate conditions
throughout the state of Arizona, with elevation as variable (a), excluding elevation from
the analysis (b), and including winter and summer precipitation as a variable (c)………68
Figure 6: Projected suitable C. scheeri habitat under 2050 climate projections, with
elevation included, for scenarios R26 (a), R45 (b), R60 (c), and R85 (d)……………….69
Figure 7: Projected suitable C. scheeri habitat under 2050 climate projections, without
elevation included, for scenarios R26 (a), R45 (b), R60 (c), and R85 (d)……………….70
Figure 8: Projected suitable C. scheeri habitat under 2050 climate projections, with
seasonal precipitation included, for scenarios R26 (a), R45 (b), R60 (c), and R85 (d)….71

60 | P a g e
Author
Focus (*C. scheeri is focus, ^
C. scheeri is mentioned, "G
enus related only)
Bak
er, 2004
*A
naly
sis of taxo
nom
ic relationsh
ips b
etween
cory
phan
tha ro
bustisp
ina v
ariations, co
nsid
ers C. sch
eeri var. ro
bustisp
ina
separate.
Mills, 1
991
*D
escriptio
n o
f C. sch
eeri surv
ey, d
escriptio
n o
f hab
itat, phy
sical descrip
tion, an
d n
otes o
n sp
ecific pop
ulatio
ns th
rough
vario
us b
iolo
gical
surv
eys, in
cludes sp
eculatio
ns o
n cau
se of lo
w d
ensity
and th
reats(e.g. fire, weev
les, hab
itat loss)
Roller, 1
996
*E
xtensiv
e phy
sical descrip
tion o
f C. sch
eeri, germin
ation p
rocess, gro
wth
rates, and flo
werin
g
Phillip
s et al, 1981
*E
xtensiv
e phy
sical descrip
tion, as w
ell as descrip
tion o
f typ
ical hab
itat, and k
now
n (at th
e time) in
form
ation o
n flo
werin
g and rep
roductio
n,
McD
onald
& M
cPherso
n,
2005
*C
. scheeri m
ore lik
ely to
be p
ollin
ated if n
ear anoth
er, but n
ot p
ollin
ator lim
ited
USF
WS 5
-year rev
iew, 2
007
*D
etermin
ation C
. scheeri sh
ould
remain
listed as en
dan
gered, th
oro
ugh
overv
iew o
f existing literatu
re. Accep
ts Bak
er, 2004 sp
ecies delin
eation
over S
chm
alzel et al, 2
004 b
ased o
n co
mm
ents o
f review
ers.
Sch
malz
el et al, 2004
*C
. scheeri sp
ecies distin
ctions are q
uestio
nab
le, does n
ot th
ink d
istinctio
ns b
etween
subsp
ecies are significan
t.
McD
onald
, 2007
*U
ndergo
ne 9
nam
e chan
ges (robus v
ar robus @
time o
f article), extensiv
e phy
sical descrip
tion o
f C. sch
eeri.
Fox &
Nin
o-M
urcia, 2
0006
^Im
pacts to
threaten
ed an
d en
dan
gered sp
ecies is one o
f the stro
ngest d
rivers o
f conserv
ation b
ankin
g and stro
ng en
forcem
ent o
f regulatio
ns
increases th
e dem
and fo
r cconserv
ation b
ankin
g.
US D
OI C
onsu
ltation, 2
001
^O
verv
iew o
f PP
C h
abitat, th
reats, and k
now
n p
op
ulatio
n d
ynam
ics with
in rep
ort to
dev
elop
er
Say
re, 2005
^P
rivate lan
ds an
d lan
ds w
ith tem
porary
grazin
g exclusio
ns are easier to
restore after fire; th
reatened
and en
dan
gered sp
ecies mak
e restoratio
n
and o
ther activ
ities on state an
d fed
eral lands m
ore ch
allengin
g.
Marris, E
mm
a^T
here is ad
ditio
nal d
anger in
field stu
dies w
ithin
South
ern A
rizona d
ue to
illegal imigran
t crossin
gs and d
rug traffick
ing.
Man
dujan
o et al, 2
002
"Cory
phan
tha p
allida in
cluded
in stu
dy
on asso
ciation w
ith n
urse p
lants. R
elationsh
ip fo
und, b
ut statistically
not ro
bust.
Guad
alup
e et al, 2005
"Cory
phan
tha leu
chten
bergia, geo
rgii, glanduligera, gu
erkean
a, macro
var. m
acrom
eris, vau
pelian
a, ocatcan
tha, p
ullein
eana, d
elicata, nick
elsiae,
radian
s, salinen
sis, sulcata, an
d w
ohlsch
lageri inclu
ded
in rep
resented
species in
ven
tory
of stu
dy
of v
arious lo
cations to
evalu
ate species
div
ersity an
d d
etermin
e where co
nserv
ation actio
ns w
ill be m
ost effectiv
e.
Martin
ez-B
erdja &
Valv
erde, 2
008
"Cory
phan
tha w
erderm
annii in
cluded
in stu
dy
of relatio
nsh
ip b
etween
cactus gro
wth
, soil m
oistu
re, solar red
iation (as th
e noted
contrib
utio
ns
of a n
urse p
lant). A
ll species in
cluded
responded
to so
il moistu
re, no stro
ng resp
onse (if an
y) to
differen
t levels o
f solar rad
iation.
Nobel, 1
981
"Cory
phan
tha v
ivip
ara studied
for freez
ing effects. F
ound n
octu
rnal tem
ps b
elow
-15C
kill so
me, w
hile tem
ps b
elow
-20C
kill all o
bserv
ed
indiv
iduals. C
old
nigh
t temp
s app
ear to affect C
O2 u
ptak
e prio
r to cellu
lar dam
age.
Portilla-A
lonso
and
Marto
rell, 2011
"Cory
phan
tha w
erderm
annii stu
died
for effects o
f chro
nic an
thro
pogen
ic distu
rban
ce at differen
t study
locatio
ns. E
stablish
men
t and fecu
ndity
seems to
positiv
ley relate to
chro
nic d
isturb
ance, w
hereas gro
wth
seems n
egatively
related, in
dicatin
g that C
. werd
erman
nii is relativ
ely
distu
rban
ce-toleran
t.
Thom
as, 2005
"Cory
phan
tha v
ivip
ara inclu
ded
in stu
dy
of resilian
ce to fire d
amage. C
. viv
ipara w
as found to
hav
e 3.7
x high
er mortality
rate and fire d
amage
observ
ed to
decrease b
reedin
g pop
ulatio
n, th
ough
re-establish
men
t app
eared to
restore so
me o
f the p
revio
usly
observ
ed sp
p. d
ensity
.
Yearsley
, 2004
"Cory
phan
tha ro
bbin
soru
m p
resented
as study
species fo
r study
examin
ing th
e robustn
ess and effectiv
eness o
f transien
t dy
nam
ic modellin
g on
short-term
transien
t pop
ulatio
n d
ynam
ics, as com
pared
to lo
ng-term
. Resu
lts expan
d sco
pe o
f model to
inclu
de n
ear-term sen
sitivity
to gro
wth
rate and segregate m
odel in
to co
mp
onen
ts that rem
ove n
eed fo
r species age stru
cture an
d a co
mp
onen
t that co
rrects for th
e removal o
f the age-
structu
re assum
ptio
n.
Table 1
: Jou
rnal p
ub
lication
s and
these
s on
C. sch
eeri and
oth
er species in
the gen
us; also
inclu
ded
no
n-
com
preh
ensively are so
me relevan
t repo
rts.
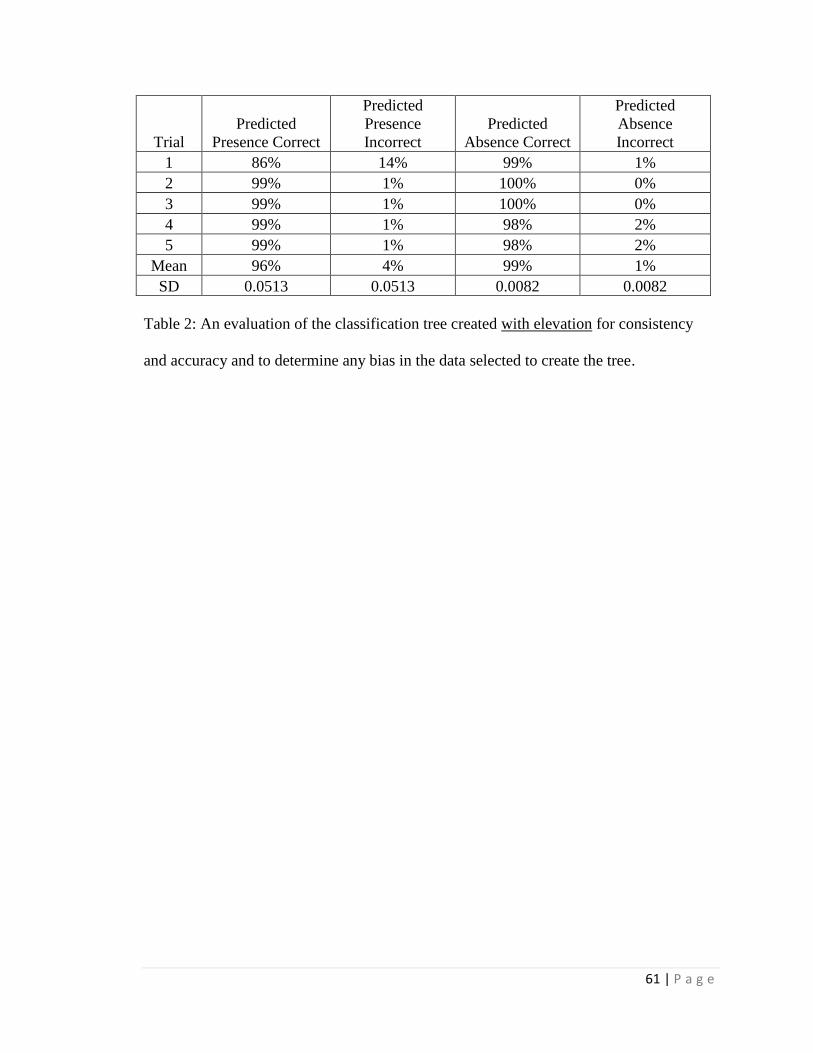
61 | P a g e
Trial
Predicted
Presence Correct
Predicted
Presence
Incorrect
Predicted
Absence Correct
Predicted
Absence
Incorrect
1 86% 14% 99% 1%
2 99% 1% 100% 0%
3 99% 1% 100% 0%
4 99% 1% 98% 2%
5 99% 1% 98% 2%
Mean 96% 4% 99% 1%
SD 0.0513 0.0513 0.0082 0.0082
Table 2: An evaluation of the classification tree created with elevation for consistency
and accuracy and to determine any bias in the data selected to create the tree.

62 | P a g e
Trial
Predicted
Presence Correct
Predicted
Presence
Incorrect
Predicted
Absence Correct
Predicted
Absence
Incorrect
8 90% 10% 100% 0%
9 99% 1% 99% 1%
10 99% 1% 99% 1%
11 99% 1% 97% 3%
12 98% 2% 97% 3%
Mean 97% 3% 98% 2%
SD 0.0346 0.0346 0.0100 0.0100
Table 3: An evaluation of the classification tree built without elevation as a predictor for
consistency and accuracy and to determine any bias in the data selected to create the tree.
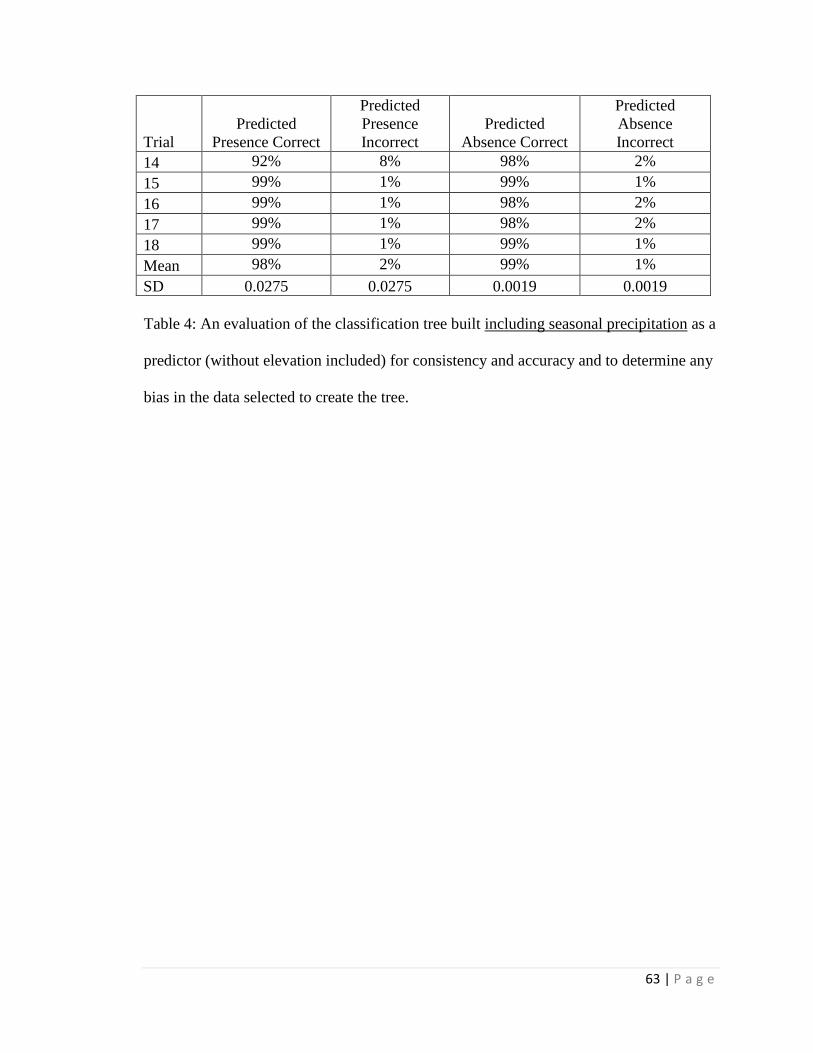
63 | P a g e
Trial
Predicted
Presence Correct
Predicted
Presence
Incorrect
Predicted
Absence Correct
Predicted
Absence
Incorrect
14 92% 8% 98% 2%
15 99% 1% 99% 1%
16 99% 1% 98% 2%
17 99% 1% 98% 2%
18 99% 1% 99% 1%
Mean 98% 2% 99% 1%
SD 0.0275 0.0275 0.0019 0.0019
Table 4: An evaluation of the classification tree built including seasonal precipitation as a
predictor (without elevation included) for consistency and accuracy and to determine any
bias in the data selected to create the tree.
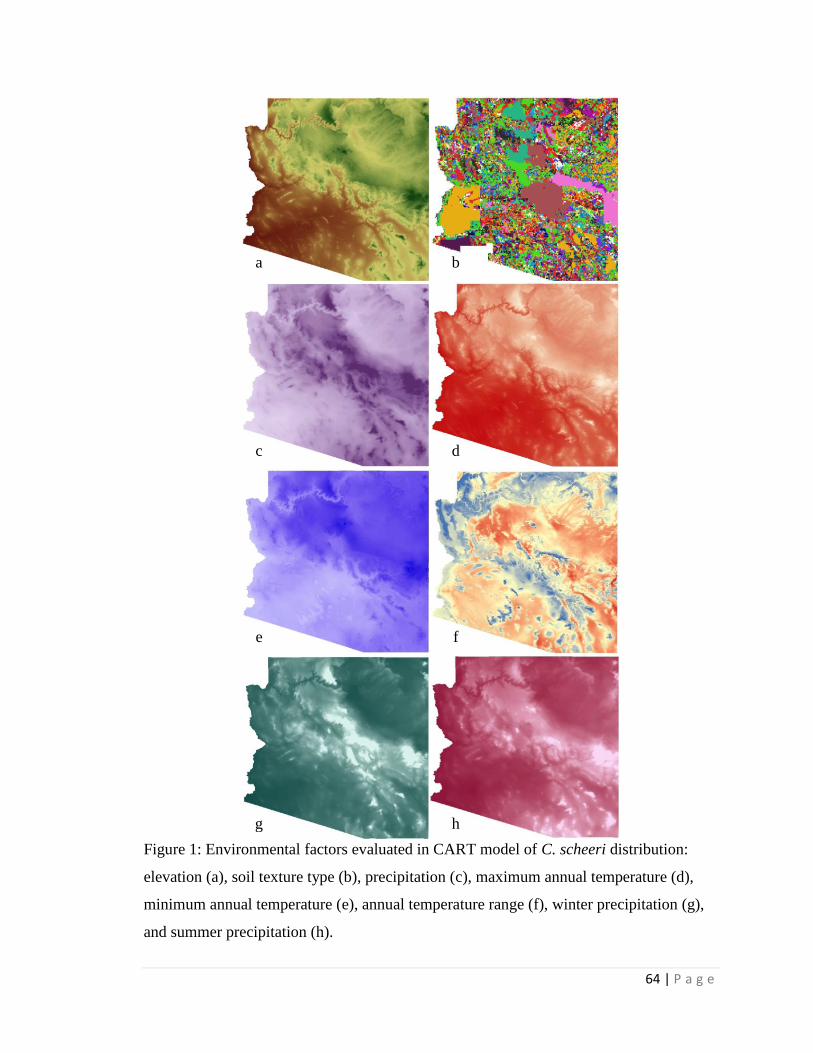
64 | P a g e
Figure 1: Environmental factors evaluated in CART model of C. scheeri distribution:
elevation (a), soil texture type (b), precipitation (c), maximum annual temperature (d),
minimum annual temperature (e), annual temperature range (f), winter precipitation (g),
and summer precipitation (h).
a b
c d
e f
g h
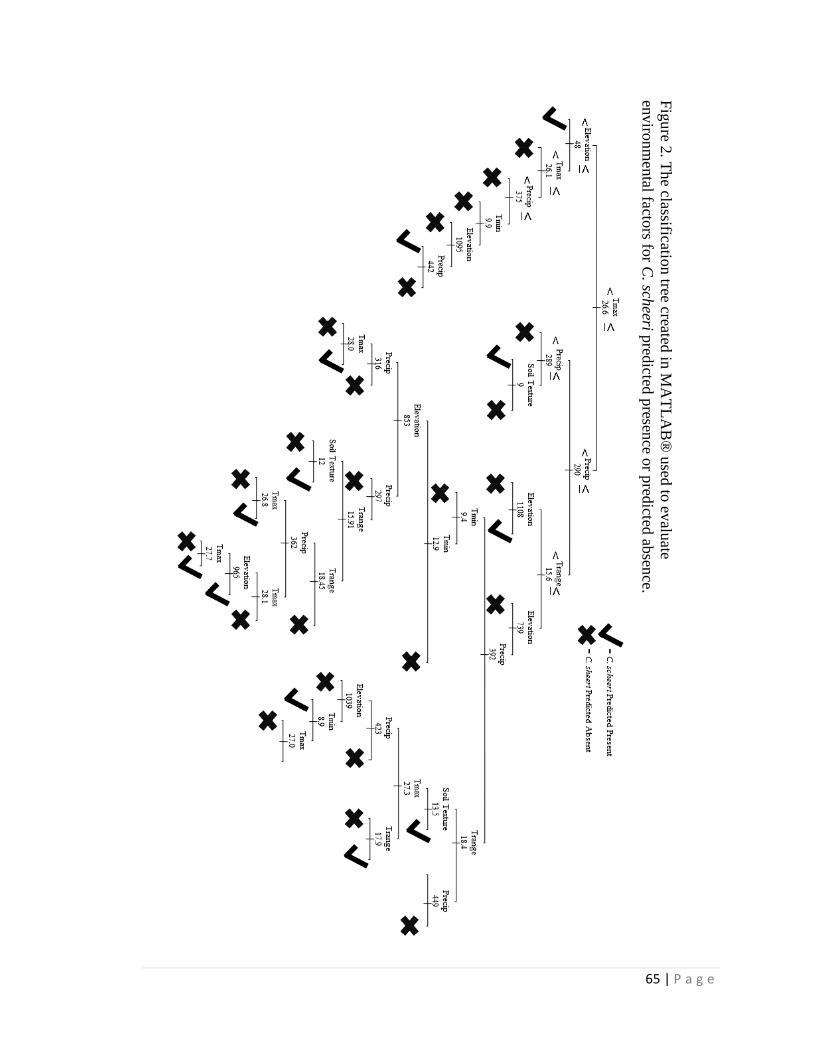
65 | P a g e
Fig
ure 2
. Th
e classification tree created
in M
AT
LA
B®
used
to ev
aluate
enviro
nm
ental facto
rs for C
. scheeri p
redicted
presen
ce or p
redicted
absen
ce.
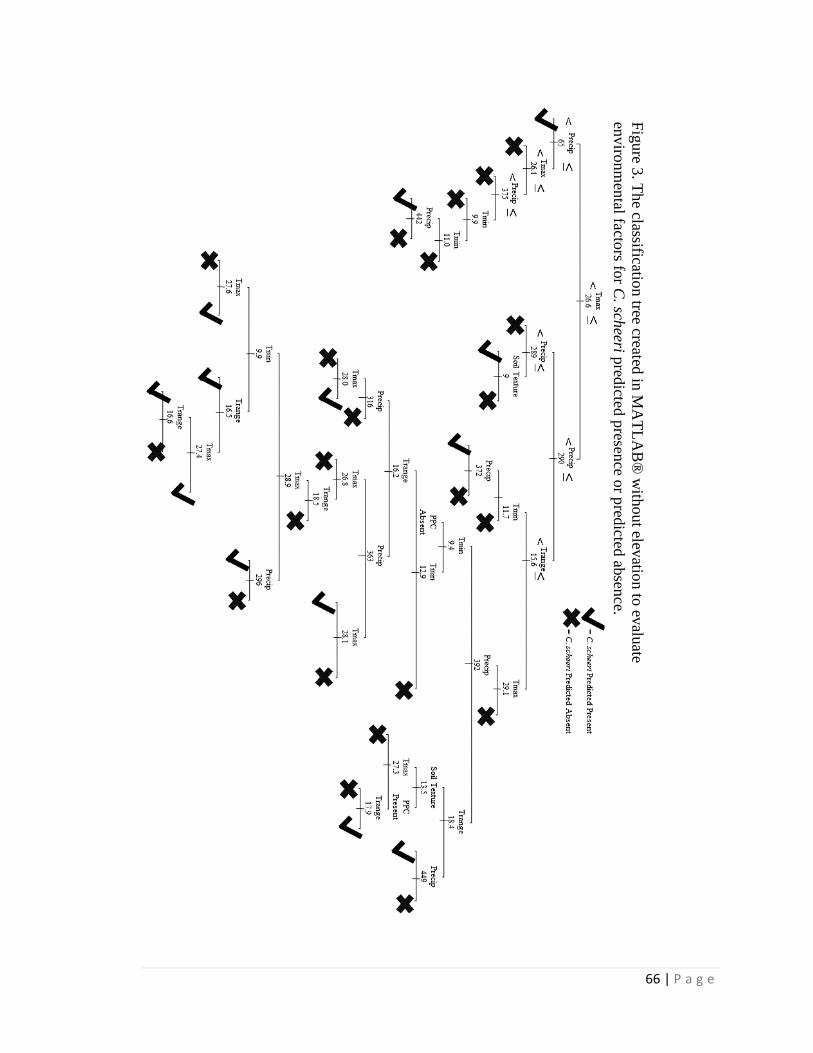
66 | P a g e
Fig
ure 3
. Th
e classification
tree created in
MA
TL
AB
® w
ithout elev
ation to
evalu
ate
enviro
nm
ental facto
rs for C
. scheeri p
redicted
presen
ce or p
redicted
absen
ce.
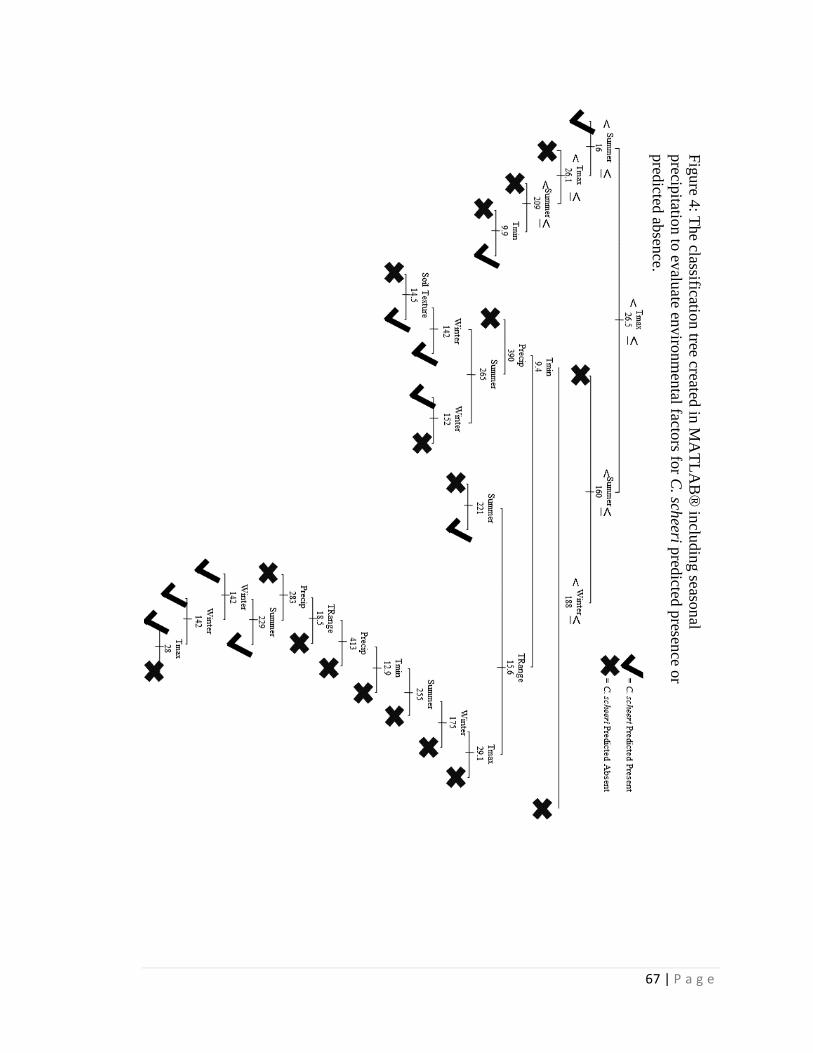
67 | P a g e
Fig
ure 4
: The classificatio
n tree created
in M
AT
LA
B®
inclu
din
g seaso
nal
precip
itation
to ev
aluate en
viro
nm
ental facto
rs for C
. scheeri p
redicted
presen
ce or
pred
icted ab
sence.
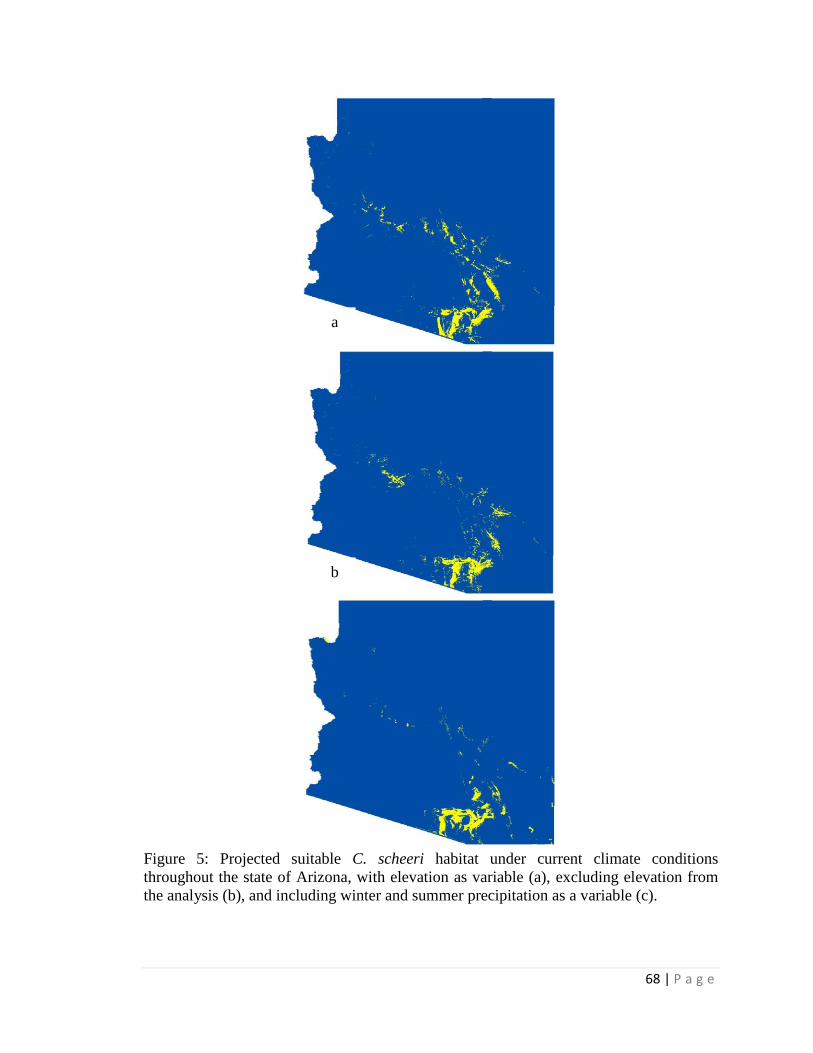
68 | P a g e
Figure 5: Projected suitable C. scheeri habitat under current climate conditions
throughout the state of Arizona, with elevation as variable (a), excluding elevation from
the analysis (b), and including winter and summer precipitation as a variable (c).
b
a
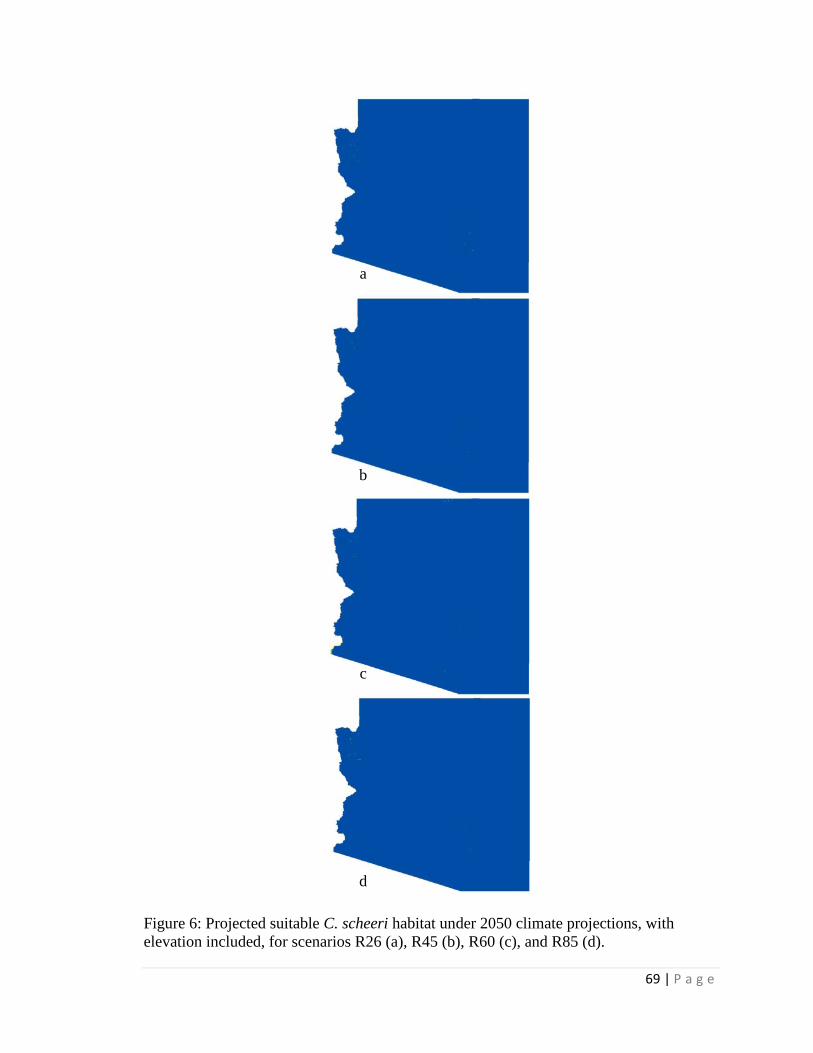
69 | P a g e
Figure 6: Projected suitable C. scheeri habitat under 2050 climate projections, with
elevation included, for scenarios R26 (a), R45 (b), R60 (c), and R85 (d).
a
b
c
d
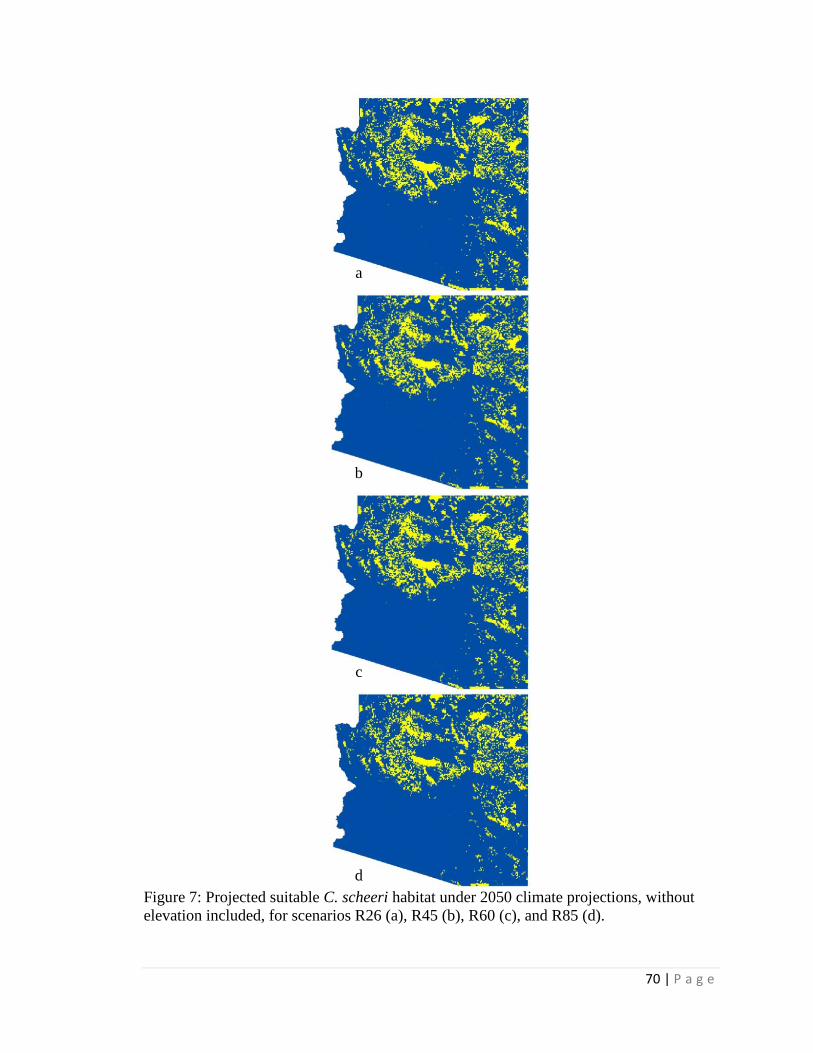
70 | P a g e
Figure 7: Projected suitable C. scheeri habitat under 2050 climate projections, without
elevation included, for scenarios R26 (a), R45 (b), R60 (c), and R85 (d).
a
d
c
b
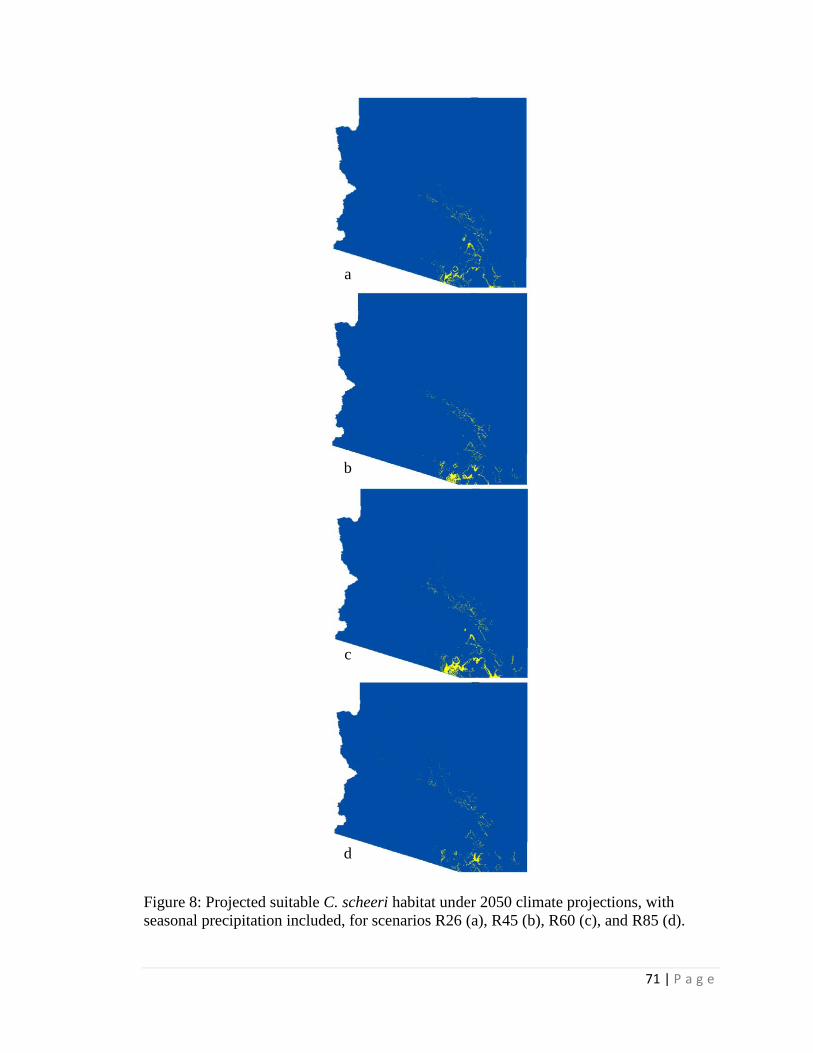
71 | P a g e
Figure 8: Projected suitable C. scheeri habitat under 2050 climate projections, with
seasonal precipitation included, for scenarios R26 (a), R45 (b), R60 (c), and R85 (d).
a
d
c
b
72 | P a g e
APPENDIX B: ECOHYDROLOGICAL CONTROLS ON CACTUS FLOWERING
PHENOLOGY AND PLANT REPRODUCTIVE CHARACTERISTICS: A TWO YEAR
OBSERVATIONAL STUDY OF AN ENDANGERED SPECIES
Amí L. Kidder1, Shirley A. Papuga1, David D. Breshears1, Darin J. Law1
1School of Natural Resources and the Environment, University of Arizona, Tucson, AZ
85721 USA
Targeted for publication in Ecohydrology
73 | P a g e
Abstract
Flowering is a phenological event that plays a critical role in reproductive success, and
therefore influences the health and success of plant populations. Flowering phenology
can be particularly sensitive to changes in climate, especially in water-limited
environments. However, cactus phenology has been little studied and may be relatively
independent of pulse-dependent soil moisture dynamics because cacti are able to store
water in their tissues, or, alternatively, could use their stored moisture to regulate
reproductive phenology. Therefore an improved understanding of cactus phenology is
needed, especially for rare and endangered cactus species that drive natural resource
management decisions and associated economic costs. Our objective was to identify
ecohydrological controls on the flowering phenology and associated plant reproductive
characteristics of Pima Pineapple Cactus (Coryphantha scheeri var. robustispina), an
endangered species inhabiting a limited region of the Sonoran Desert. We focused on a
relatively healthy and dense population located at the northern limit of its range. Over a
two year study period (2013 and 2014), we used this dense population to quantify the
temporal dynamics of flowering phenology and link these dynamics to climate variables.
We examine the relationships between other abiotic factors such as soil texture and
patterns of solar radiation and C. scheeri plant characteristics such as size and number of
nodes. Both bud formation and flowering tended to be synchronous across plants.
Flowering events tended to occur within two to six days of precipitation and associated
peak soil moisture, usually after events larger than 10 mm. C. scheeri were located
mostly on sandy loam or sandy clay loam soils. Fraction of potential annual solar
radiation input near the ground (DSF) was relatively high (>0.95). Higher infiltration

74 | P a g e
rates where soils had greater sand content tended to be associated with smaller
individuals and fewer nodes. These observations provide critical information for natural
resource managers on ecohydrological controls on the variability of flowering phenology
and associated plant physical characteristics for this endangered species. More generally,
our results suggest that cactus flowering phenology can be sensitive to precipitation
pulses, despite water stored within the individual.

75 | P a g e
1.0 Introduction
Phenology has been defined as the study of the seasonal timing, duration, and
abundance of recurring life-cycle events (e.g. Morisette et al. 2009, Rathcke & Lacey
1985) including plant reproductive events such as budding, flowering, fruiting, seed
dispersal and germination. Flowering is a phenological event that plays a critical role in
reproductive success (e.g. Giménez-Benavides 2007, Rathcke & Lacey 1985). Because
reproduction is one of the key processes that influences the health and success of plant
populations, understanding controls on flowering phenology and associated plant
characteristics is essential for effective conservation and management of rare, endemic,
and endangered species (e.g. Kaye 1999, Lara-Romero et al., 2014, Walck et al., 1999).
Flowering phenology can be particularly sensitive to changes in climate
(Borchert, 1983; Inouye, 2008; Pfeifer et al., 2006), especially in water-limited
environments (Bowers, 2007; Crimmins et al., 2010; Liancourt et al., 2012). In water-
limited environments, vegetation is particularly responsive to precipitation pulses that
deliver moisture to the soil (Holmgren et al., 2006; Huxman et al., 2004; Schwinning et
al., 2004; Schwinning & Sala, 2004). In most semiarid ecosystems, these strongly
seasonal precipitation pulses are characterized by brief, sometimes intense, rainfall
events, segregated by periods of drought (Cable & Huxman, 2004). The primary abiotic
factor affecting flowering phenology in water-limited ecosystems has been shown to be
the dynamic soil water availability associated with these precipitation pulses (Borchert
1994, Borchert et al. 2004, Bowers & Dimmitt 1994).
Despite providing essential resources for a numerous insect and animal species
within water-limited desert ecosystems (e.g. Fleming & Holland 1998, Grant et al. 1979,
76 | P a g e
Valiente-Banuet et al. 1996), cacti and other succulents are underrepresented in studies of
precipitation pulse effects on phenological activity. Cactus phenology may be relatively
independent of pulse-dependent soil moisture dynamics because they are able to store
water in their tissues (Pavón & Briones, 2001). Alternatively, this stored moisture could
provide a means to regulate reproductive phenological activity such as flowering and fruit
production. In some cactus species, increases in moisture has been associated with
improved reproductive phenology (Bowers, 1996; De La Barrera & Nobel, 2004),
whereas other cactus species appear to be insensitive to or negatively impacted by
increases in moisture (Petit, 2001; Ruiz et al., 2000). Overall, research identifying
climatic controls on cactus phenology is scarce (Bustamante & Búrquez, 2008), and this
is especially true for rare and endangered cactus species.
The Pima Pineapple Cactus (Coryphantha scheeri var. robustispina, hereafter C.
scheeri), is an endangered species inhabiting a limited region of the southwestern United
States restricted to elevations between 700 m and 2000 m with slopes less than 10%
(Roller, 1996; Schmalzel et al., 2004; U.S. Fish and Wildlife Service, 2007). These
populations are all located in Santa Cruz and Altar Valleys of Arizona with a small
region within Sonora, Mexico (Baker, 2004; McDonald & McPherson, 2005; Roller,
1996; Schmalzel et al., 2004). C. scheeri is a small, hemispherical cactus, with nodes
(also referred to as “tubercles”) rather than ribs that are characteristic of many other
cactus species (Roller, 1996; Schmalzel et al., 2004; U.S. Fish and Wildlife Service,
2007). Because of the limited range and the difficulty in locating individuals, C. scheeri
research is limited, resulting in vague management options. Understanding the controls
on phenological activity for this species is critically important because current
77 | P a g e
populations are at risk from mining and expanding anthropogenic activities that degrade
the habitat currently recorded and restrict new growth (Sayre, 2005; U.S. Depertment of
Interior, 2001; U.S. Fish and Wildlife Service, 2007).
The objective of our study was to identify ecohydrological controls on flowering
phenology and associated plant characteristics of the endangered C. scheeri. We focused
on a relatively healthy and dense population located at the northern limit of the C.
scheeri range on United States Air Force Plant 44. Over a two year study period (2013
and 2014), we used this dense population to quantify the temporal dynamics of flowering
phenology and link these dynamics to climate variables. We examined the relationships
between other abiotic factors such as soil texture, infiltration, and patterns of solar
radiation associated with C. scheeri characteristics, including size, number of nodes, and
pup count.
2.0 Methods
2.1 Site Description
The study site was located at the 567 hectare Air Force Plant 44 (AFP44),
approximately 13 km south of Tucson, Arizona. According to a 2010 survey, the AFP44
property hosts a relatively dense population of 308 C. scheeri (alive and dead) (Harrison
Environmental Report, 2010). The C. scheeri population at AFP44 is at the northern
boundary of the population range (Figure 1). AFP44 and the surrounding area is
predominantly industrial with Tucson International Airport residing to the north and east,
and undeveloped land owned by the Tohono O’odham Nation and private property
owners to the south and west. The landscape is dominated by creosotebush with patches
of mesquite, cholla, and barrel cacti (Harris Environmental Report, 2010). AFP44 is
78 | P a g e
dominated by sandy loam soils with variation is evident across the site. Mean annual
temperatures range from 13.2oC - 28.4°C and, based on 33 years of data, AFP44 receives
294 mm of annual precipitation (http://www.wrh.noaa.gov/twc/climate/tus.php) with over
half falling between July and September (http://www.wrh.noaa.gov/twc/climate/tus.php).
Using location data from the Arizona Heritage Data Management System
(http://www.azgfd.gov/w_c/edits/species_concern.shtml; AHDMS), a map of C. scheeri
within the study areas was generated in ArcMap v10.2 (Figure 1). Using this map, at
AFP44, three study sites (AFP44 1, 2 and 3) were randomly selected and also had to meet
the following minimum criteria: (1) three or more C. scheeri could be identified together
within a 5 m2 area, and (2) the site had to be greater than five meters from any paved
roads or structures. All data were carefully gathered at AFP44 with the guidance of U.S.
Fish and Wildlife Service (USFWS) so as not to harm or disturb the endangered C.
scheeri plants.
2.2 Climate Data
Daily precipitation (precip, mm) and daily air temperature (temp, oC ) data were
obtained from the nearby Tucson International Airport (TIA) meteorological station
(http://www.ncdc.noaa.gov/cdo-web/search). The TIA property is adjacent to AFP44, and
the meteorological station is located near enough that measurements are representative of
conditions at the three AFP44 sites.
Using the TIA air temperature data, growing degree days (GDDs), a measure of
heat accumulation traditionally used by horticulturalists, were calculated as:
𝐺𝐷𝐷 = 𝑇𝑚𝑎𝑥 + 𝑇𝑚𝑖𝑛
2− 𝑇𝑏𝑎𝑠𝑒

79 | P a g e
where Tmax and Tmin are the maximum and minimum daily temperatures in oC respectively
and Tbase is a species-specific base temperature, which for C. scheeri we assumed to be
10oC, as assumed for other plant species (Mix et al., 2012). Traditionally GDD is
calculated as an accumulation of heat by summing of all of the preceding GDD for each
day for that calendar year. In our study, we began the accumulation of heat at the start of
the water year (October 1) as opposed to the start of the calendar year (January 1).
2.3 Soil Moisture Data
In both years, soil moisture measurements were made daily at AFP44 from June
into September to capture the moisture conditions both before and throughout the
flowering season using a handheld Fieldscout TDR soil moisture probe (Spectrum
Technologies, Aurora, IL). By inserting the 12 cm probe vertically into the ground, soil
moisture measurements reflected an averaged value for the top 12 cm of soil. At each
individual C. scheeri, four soil moisture measurements were made at a 45° offset from
the cardinal directions (NW, SW, SE and NE; Figure 2). These measurements were made
1 m away from the C. scheeri to prevent the probe from damaging any C. scheeri roots.
Daily average soil moisture at AFP44 was calculated by first averaging all four
measurements made at each individual C. scheeri, then averaging those averages for each
of the three individuals at each site, and finally averaging together the values for each of
the three sites.
2.4 Phenological Data
Daily visual observations of buds and flowering events were made from June into
September for both years. Additionally, Moultrie I60 game cameras (Moultrie, Calera,
AL) were installed at each of the three AFP44 sites. These cameras were programmed to

80 | P a g e
take hourly photos to capture the phenological activity of the three C. scheeri at each site
and the surrounding vegetation. Each photo is stamped with barometric pressure,
temperature, and time. Memory cards were switched out every 30 – 60 days, and batteries
were changed every 120 – 150 days.
2.5 Other Abiotic Data
Measurements of infiltration rates were made around each individual in each of
the cardinal directions (N, S, E, and W; Figure 2). For each infiltration measurement, a 15
cm-diameter ring infiltrometer was filled with water to a height of 7 cm and allowed to
infiltrate into the soil. Infiltration rates were calculated by using the total time necessary
for the entire 638.5 mL to infiltrate into the soil. Infiltration measurements were made 1
m away from each C. scheeri plant under the guidance of USFWS so as to protect the C.
scheeri root structure from any potential damage by the infiltrometer. These
measurements were obtained once during the dry season within the two-year study
period. An average infiltration was calculated for each C. scheeri plant by averaging all
four measurements made at each individual C. scheeri.
A 5-cm diameter soil core was extracted from the upper 10 cm, located 1 m south
of each C. scheeri plant (9 total; Figure 2). Each soil sample was sieved to remove any
gravel > 2 cm in diameter. The remaining soil was analyzed for soil texture via Particle
Size Analysis by the Center for Environmental Physics and Mineralogy (CEPM) lab at
the University of Arizona.
Direct Site Factor (DSF) is an estimate of potential incoming solar radiation for a
cloudless year that ranges from 0.0 to 1.0, where a value of 1.0 indicates complete
exposure to incoming solar radiation and 0.0 indicates complete shading (Rich, 1989;

81 | P a g e
Rich et al., 1999). The fractional reductions are determined by nearby vegetation
obstructions, as well as topographical effects (the latter are usually relatively small unless
in close proximity to tall topographic features). In our study, we derived DSF using
images taken with a Nikon Coolpix camera instrumented with a fish-eye lens to capture a
full 180° image directly south of each C. scheeri plant (Figure 2). We took images at each
C. scheeri plant (9 total) using the fish-eye lens either at dawn or dusk when there was
still daylight but when the sun was not in the sky to avoid the sun appearing in the photo.
The camera was placed on a small bean bag to level the camera and oriented with a
marker to indicate North in the photo. The image height was at approximately 25 cm
above the ground surface. The photographer was positioned on the north side of each C.
scheeri plant so as not to shade the C. scheeri plant in any way. Each image was
processed in Delta-T Devices HemiView v. 2.1 software to adjust the contrast so that the
sky is white and all other objects which would create shade are black. DSF is the percent
of the image that is white (open). We took these images once at each C. scheeri plant in
the two-year study period, which, based on the path of the sun in the sky at that location,
yields an annual value of DSF.
2.6 C. scheeri Plant Physical Characteristics
The height and diameter of each individual C. scheeri was measured with a
measuring tape; for circumference, a string was used to measure around the C. scheeri
between the spines. Height and diameter were multiplied together to calculate a C.
scheeri size; this size was normalized by dividing by the largest size in our dataset.
Additionally, the nodes on each individual C. scheeri were counted, as well as the
number of pups. Number of nodes and number of pups were also normalized by dividing

82 | P a g e
by the largest number of nodes and largest number of pups in our dataset. C. scheeri were
classified as clusters if they had multiple heads and many more pups than a typical C.
scheeri. The height, diameter, and circumference of the entire cluster were measured,
though nodes were only counted on the C. scheeri heads, excluding the pups.
3.0 Results
3.1 Climate
Throughout the study period, temperature ranged from approximately -10°C in
the winter to 40°C in the summer. In both years, temperature increased in mid-late spring
(~DOY 100) until mid-summer (~DOY 180), when temperatures leveled off after the
summer wet season began (Figure 3a, b). Average temperature for during the warmer half
of the year (here designated as April 1 – September 7) was 28oC for both 2013 and 2014
(www.ncdc.noaa.gov). In both 2013 and 2014, GDD increased relatively steadily each
year, with a slight inflection occurring between May 20 and June 9 (Figure 3c, d).
Winter precipitation was greater in 2013 – 2014 (93 mm; Table 1) than in 2012 –
2013 (73 mm; Table 1). This difference between years was further amplified in total
water year precipitation (248 mm in 2014 versus 170 mm in 2013) due in part to
contributions from a late summer hurricane in 2014. Within the warmer half of the year,
precipitation was sparse prior to the wet season in both years, which began around July 1
(Figure 3e, f). Summer 2013 received fewer large (> 10 mm) storms than summer 2014
(Figure 3e, f).
3.2 Soil Moisture
Prior to the wet season (measured in 2014 only, Figure 3f), soil moisture (upper
12 cm) was low. Soil moisture responded rapidly to precipitation events, reflected in
83 | P a g e
increased water content in same-day measurements, when feasible. Subsequently, soils
dried rapidly, progressing to background soil moisture levels unless altered by additional
precipitation within only a couple of days (Figure 3e, f). Temporal variation in soil
moisture was most influenced by a few large events, which generally yielded longer
subsequent intervals of above-background soil moisture (Figure 3e, f).
3.3 Flowering Phenology
Bud formation (observed only in 2014) tended to be synchronous across plants.
The initial bud event (5 of 9 plants) occurred on single day (June 10; Table 1), with three
of the remaining four plants budding within the next 22 days. This initial bud event was
associated with an inflection point in GDD while temperature was increasing (Figure 3b,
d) and was prior to the onset of the wet season (Figure 3f). For this initial bud event,
GDD reached 2858 and water year precipitation accumulated to 93 mm (Table 1).
Flowering resulting from this bud event occurred on July 11 (8 of 8 budded plants; Table
1), two days following a large 9 mm precipitation event. A second synchronous bud event
(7 of 9 plants; July 15) occurred during a large (14 mm) precipitation event. The majority
of the flowering resulting from this second bud event occurring only five days later (6 of
7 budded plants; July 20; Table 1); the final budded plant flowering the next day (July
21). Three days after the second flowering event, a third bud event occurred (4 of 9
plants; July 23) with no associated precipitation within eight days. Flowering resulting
from this third bud event occurred on August 6 (4 of 4 budded plants), five days
following a large 11 mm precipitation event.
Flowering events (observed in both years) occurred in mid-summer after onset of
the wet season (Figure 3e, f; Table 1). In both years, the first flowering event occurred

84 | P a g e
after the first large (>10 mm) event. Flowering events tended to occur within two to six
days of precipitation and peak soil moisture (Figure 3e, f), usually after events larger than
10 mm (an exception was the August 11, 2013 flowering event following a 4 mm
precipitation event). Consequently, flowering generally occurred while soil moisture was
above baseline levels (Figure 3e, f). No clear relationship was observed between
flowering and temperature or GDD. Each individual bud flowered for only one day.
Some plants had a single lagging flower that opened one or two days after the flowering
date of other buds on that same individual. Duration between initial and final flowering
events was 30 to 40 days for both years, within which up to four unique flowering events
occurred per individual cactus.
3.4 C. scheeri Plant Physical Characteristics
The three C. scheeri plant physical characteristics—size, number of nodes, and
number of pups—all exhibited skewed frequency distributions with many more
individuals in the smallest size class of each and few individuals being in the largest class
(Figure 4). C. scheeri at our study site ranged from 12.9 – 28.7cm tall and 10.5 – 45.0 cm
diameter. Node count ranged from 47 to 462 nodes. For non-cluster C. scheeri
individuals, number of pups ranged from two individual C. scheeri having no pups, to
five individual C. scheeri having between one and ten pups. The smaller of the two C.
scheeri clusters had 18 pups and the largest had 33 pups.
3.5 Abiotic Factors Influencing C. scheeri Plant Physical Characteristics
C. scheeri individuals spanned a range of the three plant physical characteristics
(size, # of nodes, and # of pups) for three abiotic factors: two soil related metrics

85 | P a g e
(infiltration rate and % sand) and a radiation input metric (fraction of potential incoming
solar radiation at a location; DSF).
Both size and node count appear to be related to infiltration, with higher
infiltration rates associated with both smaller and larger individuals, creating a concave-
up relationship (Figure 5a, d). Maximum pup count appears to decrease with infiltration
rate (Figure 5g). At the scale of an individual (for which there were 4 measurements of
infiltration surrounding it; Figure 2), there was little variation in infiltration (0.017 SD)
although the point most downslope of any individual C. scheeri plant tended to exhibit
the slowest rates (personal observation). C. scheeri individuals spanned soil texture types,
but were mostly found on sandy loam (7 sites) or sandy clay loam (2 sites). Sand ranged
from 54-76% across individual C. scheeri locations; associated silt and clay composition
each ranged from approximately 10-30%. Sand composition did not appear to relate to
any of the three size metrics (Figure 5b, e, h). Fraction of potential solar radiation input
near the ground (DSF) was relatively high for all sites ranging from 0.95 to 0.99 (Figure
5c, f, i).
When each of the three the size metrics are aggregated into three size categories,
additional patterns were suggested. There is not a distinct trend with DSF but higher
infiltration rates (Figure 6a, b, c) and sand content (Figure 6d, e, f) appear to be
associated with larger individuals, more nodes, and high pup counts.
4.0 Discussion
4.1 Ecohydrological Controls on C. scheeri Flowering Phenology
The appearance of the first bud of the season in 2014 was associated with an
inflection in the accumulation of GDDs (Figure 3d). Though this observation was only
86 | P a g e
made during a single year, the onset of budding and thus the initiation of the flowering
season for C. scheeri appears to be associated with an accumulation of energy.
Conversely, based on the observations of our two-year study, C. scheeri flowering events
do not appear to be associated with energy or temperature triggers (Figure 3a, b, d).
Instead, flowering events appear to have a moisture trigger associated with large rainfall
events and their associated peak in soil moisture (Figure 3e, f). This is not a surprise since
previous research has shown that C. scheeri flower in response to the monsoon
precipitation pulses (Baker, 2004; McDonald & McPherson, 2005; Roller, 1996;
Schmalzel et al., 2004). However, our research specifically shows that while repeat bud
events tend to occur soon after the C. scheeri plants recover from their last flowering
event, C. scheeri appear to wait to flower until specific moisture conditions are met.
These conditions seem to occur two to six days following a large (> 10 mm) precipitation
event and associated peak in soil moisture. While the flowering phenology of some
cactus species has been shown to be associated with the onset of increasing spring
temperatures (Bustamante & Búrquez, 2008; Crimmins et al., 2010; Fleming et al., 2001),
our results are consistent with other cactus species that flower in the summer (Crimmins
et al., 2011). Notably, our study indicates cactus flowering occurring within a fixed
window of days following a precipitation event that exceeded a minimum threshold (10
mm). This relationship has important implications for climate change impacts. For
reproductive success of C. scheeri precipitation events will need to include appropriately
timed, larger events (generally >10 mm). Current projections indicate precipitation will
be reduced in the future (Garfin et al., 2013), but information on the distribution and
timing of event sizes remains uncertain.
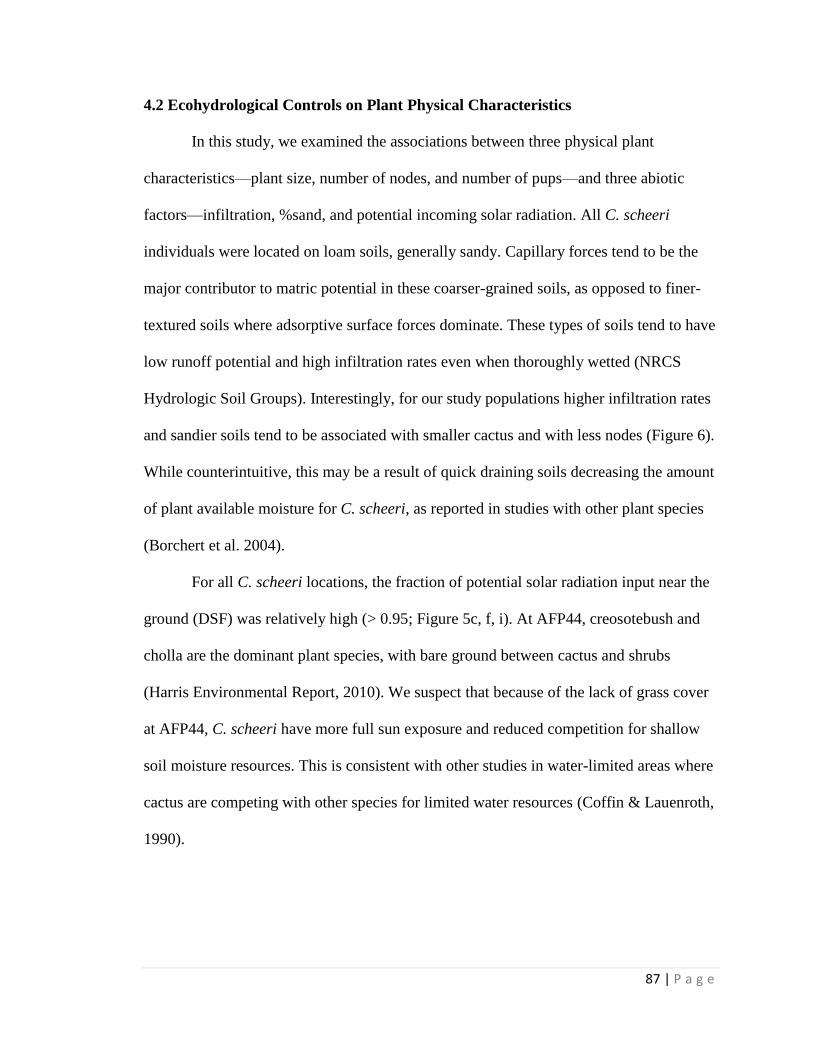
87 | P a g e
4.2 Ecohydrological Controls on Plant Physical Characteristics
In this study, we examined the associations between three physical plant
characteristics—plant size, number of nodes, and number of pups—and three abiotic
factors—infiltration, %sand, and potential incoming solar radiation. All C. scheeri
individuals were located on loam soils, generally sandy. Capillary forces tend to be the
major contributor to matric potential in these coarser-grained soils, as opposed to finer-
textured soils where adsorptive surface forces dominate. These types of soils tend to have
low runoff potential and high infiltration rates even when thoroughly wetted (NRCS
Hydrologic Soil Groups). Interestingly, for our study populations higher infiltration rates
and sandier soils tend to be associated with smaller cactus and with less nodes (Figure 6).
While counterintuitive, this may be a result of quick draining soils decreasing the amount
of plant available moisture for C. scheeri, as reported in studies with other plant species
(Borchert et al. 2004).
For all C. scheeri locations, the fraction of potential solar radiation input near the
ground (DSF) was relatively high (> 0.95; Figure 5c, f, i). At AFP44, creosotebush and
cholla are the dominant plant species, with bare ground between cactus and shrubs
(Harris Environmental Report, 2010). We suspect that because of the lack of grass cover
at AFP44, C. scheeri have more full sun exposure and reduced competition for shallow
soil moisture resources. This is consistent with other studies in water-limited areas where
cactus are competing with other species for limited water resources (Coffin & Lauenroth,
1990).

88 | P a g e
4.3 Implications for Management and Conservation Practices
Although previous research has suggested that precipitation pulses trigger
responses in C. scheeri (McDonald & McPherson, 2005; Roller, 1996), there is still a
paucity of knowledge related to the size and distribution of the pulse needed to trigger
these responses. This leaves species managers without a sufficient understanding of the
conditions C. scheeri require for reproductive success. Our study suggests that C. scheeri
are larger on loamy soils with some sand, perhaps because infiltration can occur but not
too quickly. Soil texture may also be important in the context of its effect on evaporation
loss. Additionally, we show that individuals in this high-density population of C. scheeri
were located in sparsely vegetated and sunny locations, especially those with minimal
competition for surface water resources. With this knowledge, locations that host known
C. scheeri with these abiotic conditions could be preferentially protected to maximize
successful conservation. For reproductive success, our study also suggests that C. scheeri
is dependent on large (> 10 mm) precipitation events that occur in the warm summer
season. With this knowledge, managers could focus on conservation strategies associated
with harvesting seeds (Fox & Nino-Murcia, 2005) in years with good precipitation.
Additionally, this understanding could be used to focus on relocation management
strategies (Bouzat et al., 2008; Massei et al., 2010) in which individuals could be
relocated to areas with ideal abiotic conditions which may be converting to a
precipitation regime conducive to C. scheeri establishment.
We note that the results of this study are based on only 1 year of bud data and two
years of flowering data, both within one population of C. scheeri within the known size
and distribution of this species. Data collected here present C. scheeri response to climate

89 | P a g e
events within the study period and are not indicative of species response to extreme
climate events. Furthermore, results describing flowering phenology and individual site
characteristics presented here do not indicate the health or distribution of the overall
population across its range.
5.0 Conclusions
Here we identify ecohydrological controls on the flowering phenology and
associated plant physical characteristics of an endangered cactus species inhabiting a
limited region of the Sonoran Desert. We used a dense population to quantify the
temporal dynamics of flowering phenology and link these dynamics to climate variables
and examine the relationships between abiotic conditions such as soil texture and patterns
of solar radiation and the reproductive plant characteristics such as size and number of
nodes. We show that while bud events appear to be unassociated with moisture,
flowering events are preceded by large rainfall events and their associated peaks in soil
moisture. We also show that C. scheeri prefer loamy soils, with some sand so that
infiltration can occur but not too quickly and that C. scheeri prefer sparse sunny
locations, especially those with minimal competition for surface water resources. With
this knowledge, locations that host known C. scheeri with these ecohydrological controls
should be preferentially protected to maximize successful conservation.
Acknowledgements
Support for this project was provided in part by the U.S. Air Force Life Cycle
Management Center and Raytheon Company Missile Systems Environmental, Health,
Safety, and Sustainability Department. Soil moisture data collection was made possible
thanks to Dr. Michael Crimmins, and soil particle size analysis measurements were

90 | P a g e
greatly aided by Dr. Prakash Dhakal and the CEPM lab (Center for Environmental
Physics and Mineralogy). Special thanks to Thomas Hafkemeyer, Dianna Holgate, Katie
Merems, and Heather Spitzer for additional assistance for the field campaign. We would
like to acknowledge and thank the members of the Papuga and Breshears labs at the
University of Arizona, School of Natural Resources and the Environment for their
insights and support. A special thanks to Julie Crawford with U.S. Fish and Wildlife
Service and Sabra Tonn with the Arizona Game and Fish Department for assistance in
obtaining PPC spatial location data.

91 | P a g e
References
Baker, M. 2004. Phenetic analysis of Coryphantha, section Robustispina (cactaceae),
part 1: stem characters.U.S. Fish and Wildlife Service report (pp. 1–21). Tempe,
Arizona
Borchert, R. 1983. Phenology and control of flowering in tropical trees. Biotropica, 15,
81–89. doi:10.2307/2387949
Borchert, R. 1994. Induction of rehydration and bud break by irrigation or rain in
deciduous trees of a tropical dry forest in costa-rica. Trees-Structure and Function,
8, 198–204. doi:10.1007/BF00196847
Borchert, R., Meyer, S. A., Felger, R. S., & Porter-Bolland, L. 2004. Environmental
control of flowering periodicity in Costa Rican and Mexican tropical dry forests.
Global Ecology and Biogeography, 13, 409–425. doi:10.1111/j.1466-
822X.2004.00111.x
Bouzat, J. L., Johnson, J. A., Toepfer, J. E., Simpson, S. A, Esker, T. L., & Westemeier,
R. L. 2008. Beyond the beneficial effects of translocations as an effective tool for
the genetic restoration of isolated populations. Conservation Genetics, 10(1), 191–
201. doi:10.1007/s10592-008-9547-8
Bowers, J. E. 1996. More flowers or new cladodes? environmental correlates and
biological consequences of sexual reproduction in a Sonoran Desert prickly pear
cactus, Opuntia engelmannii. Bulletin of the Torrey Botanical Club, 123, 34–40.
Bowers, J. E. 2007. Has climatic warming altered spring flowering date of sonoran desert
shrubs? The Southwestern Naturalist, 52(3), 347–355.
Bowers, J. E., & Dimmitt, M. A. 1994. Flowering phenology of six woody plants in the
northern sonoran desert. Bulletin of the Torrey Botanical Club, 121(3), 215–229.
Bustamante, E., & Búrquez, A. 2008. Effects of plant size and weather on the flowering
phenology of the organ pipe cactus (Stenocereus thurberi). Annals of Botany, 102,
1019–1030. doi:10.1093/aob/mcn194
Cable, J. M., & Huxman, T. E. 2004. Precipitation pulse size effects on Sonoran Desert
soil microbial crusts. Oecologia, 141(2), 317–24. doi:10.1007/s00442-003-1461-7
Coffin, D. P., & Lauenroth, W. K. 1990. A gap dynamics simulation model of succession
in semiarid grassland. Ecological Modelling, 49, 229–266.

92 | P a g e
Crimmins, T. M., Crimmins, M. A, & Bertelsen, C. D. 2011. Onset of summer flowering
in a “Sky Island” is driven by monsoon moisture. The New Phytologist, 191(2),
468–79. doi:10.1111/j.1469-8137.2011.03705.x
Crimmins, T. M., Crimmins, M. A., & David Bertelsen, C. 2010. Complex responses to
climate drivers in onset of spring flowering across a semi-arid elevation gradient.
Journal of Ecology, 98, 1042–1051. doi:10.1111/j.1365-2745.2010.01696.x
De La Barrera, E., & Nobel, P. S. 2004. Carbon and water relations for developing fruits
of Opuntia ficus-indica (L.) Miller, including effects of drought and gibberellic acid.
Journal of Experimental Botany, 55, 719–729. doi:10.1093/jxb/erh084
Fleming, T. H., & Holland, J. N. 1998. The evolution of obligate pollination mutualisms:
Senita cactus and senita moth. Oecologia, 114, 368–375.
doi:10.1007/s004420050459
Fox, J., & Nino-Murcia, A. 2005. Status of species conservation banking in the united
states. Conservation biology, 19(4), 996–1007. doi:10.1111/j.1523-
1739.2005.00231.x
Garfin, G., Jardine, A., Merideth, R., Black, M., & LeRoy, S. 2013. Assessment of
Climate Change in the Southwest United States. (G. Garfin, A. Jardine, R. Merideth,
M. Black, & S. LeRoy, Eds.). Washington, DC: Island Press/Center for Resource
Economics. doi:10.5822/978-1-61091-484-0
Giménez-Benavides, L., Escudero, A., & Iriondo, J. M. 2007. Reproductive limits of a
late-flowering high-mountain Mediterranean plant along an elevational climate
gradient. New Phytologist, 173, 367–382. doi:10.1111/j.1469-8137.2006.01932.x
Grant, V., Grant, K. A., & Hurd, P. D. 1979. Pollination of Opuntia lindheimeri and
related species. Plant Systematics and Evolution, 132, 313–320.
doi:10.1007/BF00982393
Holmgren, M., Stapp, P., Dickman, C. R., Gracia, C., Graham, S., Gutiérrez, J. R., Hice,
C., Jaksic, F,. Kelt, D. A., Letnic, M., Lima, M., Lopez, B. C., Meserve, P. L.,
Milstead, W. B., Polis, G. A., Previtali, M. A., Richter, M., Sabate, S., & Squeo, F.
A. 2006. Extreme climatic events shape arid and semiarid ecosystems. Frontiers in
Ecology and the Environment, 4(2), 87–95.
Huxman, T. E., Cable, J. M., Ignace, D. D., Eilts, J. A., English, N. B., Weltzin, J., &
Williams, D. G. 2004. Response of net ecosystem gas exchange to a simulated
precipitation pulse in a semi-arid grassland: the role of native versus non-native
grasses and soil texture. Oecologia, 141(2), 295–305. doi:10.1007/s00442-003-
1389-y
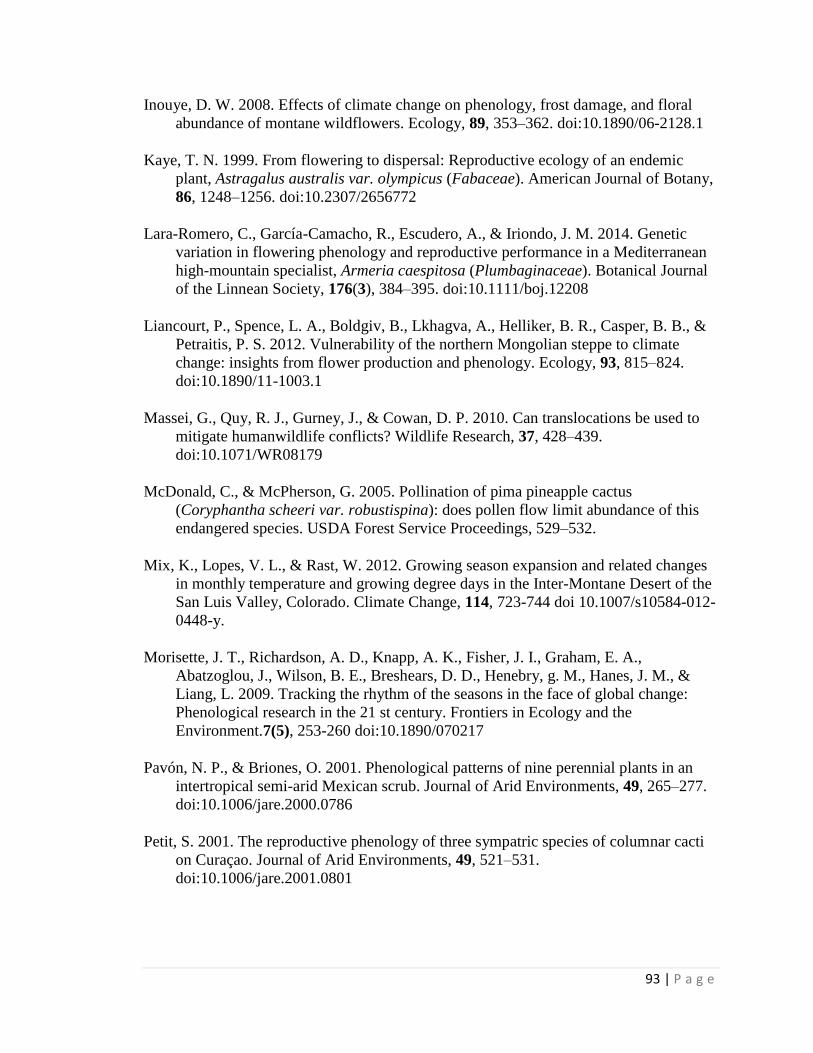
93 | P a g e
Inouye, D. W. 2008. Effects of climate change on phenology, frost damage, and floral
abundance of montane wildflowers. Ecology, 89, 353–362. doi:10.1890/06-2128.1
Kaye, T. N. 1999. From flowering to dispersal: Reproductive ecology of an endemic
plant, Astragalus australis var. olympicus (Fabaceae). American Journal of Botany,
86, 1248–1256. doi:10.2307/2656772
Lara-Romero, C., García-Camacho, R., Escudero, A., & Iriondo, J. M. 2014. Genetic
variation in flowering phenology and reproductive performance in a Mediterranean
high-mountain specialist, Armeria caespitosa (Plumbaginaceae). Botanical Journal
of the Linnean Society, 176(3), 384–395. doi:10.1111/boj.12208
Liancourt, P., Spence, L. A., Boldgiv, B., Lkhagva, A., Helliker, B. R., Casper, B. B., &
Petraitis, P. S. 2012. Vulnerability of the northern Mongolian steppe to climate
change: insights from flower production and phenology. Ecology, 93, 815–824.
doi:10.1890/11-1003.1
Massei, G., Quy, R. J., Gurney, J., & Cowan, D. P. 2010. Can translocations be used to
mitigate humanwildlife conflicts? Wildlife Research, 37, 428–439.
doi:10.1071/WR08179
McDonald, C., & McPherson, G. 2005. Pollination of pima pineapple cactus
(Coryphantha scheeri var. robustispina): does pollen flow limit abundance of this
endangered species. USDA Forest Service Proceedings, 529–532.
Mix, K., Lopes, V. L., & Rast, W. 2012. Growing season expansion and related changes
in monthly temperature and growing degree days in the Inter-Montane Desert of the
San Luis Valley, Colorado. Climate Change, 114, 723-744 doi 10.1007/s10584-012-
0448-y.
Morisette, J. T., Richardson, A. D., Knapp, A. K., Fisher, J. I., Graham, E. A.,
Abatzoglou, J., Wilson, B. E., Breshears, D. D., Henebry, g. M., Hanes, J. M., &
Liang, L. 2009. Tracking the rhythm of the seasons in the face of global change:
Phenological research in the 21 st century. Frontiers in Ecology and the
Environment.7(5), 253-260 doi:10.1890/070217
Pavón, N. P., & Briones, O. 2001. Phenological patterns of nine perennial plants in an
intertropical semi-arid Mexican scrub. Journal of Arid Environments, 49, 265–277.
doi:10.1006/jare.2000.0786
Petit, S. 2001. The reproductive phenology of three sympatric species of columnar cacti
on Curaçao. Journal of Arid Environments, 49, 521–531.
doi:10.1006/jare.2001.0801

94 | P a g e
Pfeifer, M., Heinrich, W., & Jetschke, G. 2006. Climate, size and flowering history
determine flowering pattern of an orchid. Botanical Journal of the Linnean Society,
151, 511–526. doi:10.1111/j.1095-8339.2006.00539.x
Rathcke, B., & Lacey, E. P. 1985. Phenological patterns of terrestrial plants. Annual
Review of Ecology and Systematics, 16(1), 179–214.
doi:10.1146/annurev.es.16.110185.001143
Rich P. M. (1989) A Manual for Analysis of Hemispherical Canopy Photography. Los
Alamos National Laboratory Report LA-11733-M. Los Alamos National
Laboratory, Los Alamos.
Rich P. M.,Wood J., Vieglais D. A., Burek K. & Webb N. (1999) Guide to Hemiview:
Software for Analysis of Hemispherical Photography. Delta-T Devices, Cambridge.
Roller, P. 1996. Distribution, growth, and reproduction of Pima pineapple cactus
(Coryphantha scheeri Kuntz var robustispina Schott). University of Arizona.
Ruiz, A., Santos, M., Cavelier, J., & Soriano, P. J. 2000. Phenological study of Cactaceae
in the dry enclave of Tatacoa, Colombia. Biotropica, 32, 397–407.
Sayre, N. F. 2005. Interacting effects of landownership, land use, and endangered species
on conservation of Southwestern U. S. Rangelands. Conservation Biology, 19(3),
783–792.
Schmalzel, R. J., Nixon, R. T., Best, A. L., & Jr, J. A. T. 2004. Morphometric variation in
Coryphantha robustispina (Cactaceae). Systematic Botany, 29(3), 553–568.
Schwinning, S., & Sala, O. E. 2004. Hierarchy of responses to resource pulses in arid and
semi-arid ecosystems. Oecologia, 141(2), 211–20. doi:10.1007/s00442-004-1520-8
Schwinning, S., Sala, O. E., Loik, M. E., & Ehleringer, J. R. 2004. Thresholds, memory,
and seasonality: understanding pulse dynamics in arid/semi-arid ecosystems.
Oecologia, 141(2), 191–3. doi:10.1007/s00442-004-1683-3
U.S. Depertment of Interior. 2001. United States Department of the Interior, U. S. Fish
and Wildlife Service AESO/SE 2-21-01-F-271 (pp. 1–16). Phoenix, Arizona.
U.S. Fish and Wildlife Service. 2007. U . S . Fish & Wildlife Service 5-Year Review
Determination Pima Pineapple Cactus. 70 FR 5460. Region 2 Regional Office (pp.
1–17).
Valiente-Banuet, A., Arizmendi, M. D. C., Rojas-Martínez, A., & Domínguez-Canseco,
L. 1996. Ecological relationships between columnar cacti and nectar-feeding bats in
Mexico. Journal of Tropical Ecology, 12, 103. doi:10.1017/S0266467400009330

95 | P a g e
Walck, J. L., Baskin, J. M., & Baskin, C. C. 1999. Ecology of the endangered species
Solidago shortii. VII. Survivorship and flowering, and comparison with common,
geographically-widespread Solidago species. Journal of the Torrey Botanical
Society, 126, 124–132. doi:10.2307/2997288

96 | P a g e
List of Figures:
Figure 1: C. scheeri habitat range with AFP44 highlighted. Distribution of C. scheeri is
presented in dark grey and study site is indicated by black area………………………...99
Figure 2: Diagram indicating the measurement design for field data collected.
Measurements depicted here include volumetric water content, infiltration, soil texture
type, and hemispherical photos. Per guidance from Arizona Fish and Wildlife, invasive
measurements were made 1m away from the C. scheeri so as not to risk damaging the
root structure……………………………………………………………………………100
Figure 3: Daily measurements of temperature (a, b), growing degree days (GDD) (c, d),
precipitation and volumetric water content (e, f) are presented here in conjunction with
phenological events (e.g. bud formation, square, and bloom events, diamonds) for both
study years……………………………………………………………………………...101
Figure 4: A histogram of C. scheeri size indicators: size (a), node count (b), and pup
count (c) frequencies……………………………………………………………………102
Figure 5: Physical C. scheeri habitat characteristics as they related to C. scheeri size
indicators. Site characteristics include infiltration rate (a, d, g), % sand as an indicator of
soil texture type (b, e, h), and Direct Site Factor (DSF) for fraction of potential annual
radiation input (c, f, i). Size indicators are normalized for context, and include size (a, b,
c), node count (d, e, f), and pup count (g, h, i)………………………………………….103
Figure 6: C. scheeri histograms of grouped data for infiltration (a, b c), % sand (d, e, f),
and Direct Site Factor (DSF) for fraction of potential annual radiation input (g, h, i); each
as related to size (a, d, g), node count (b, e, h), and pup count (c, f, i). Different letters
above bars indicate significant differences within a given panel; significance was

97 | P a g e
determined by the Friedman’s Rank Test, and is set at P<0.10. Size is determined to be
effected by infiltration (a) and %sand (d) at p=0.096. Node count is determined to be
effected by infiltration (b) and %sand (e) at p=0.079. Other trends are determined to be
non-significant………………………………………………………………………….105

98 | P a g e
List of Tables:
Table 1: Data describing chronology of climatic events and phenological response which
enhances the time series data presented.
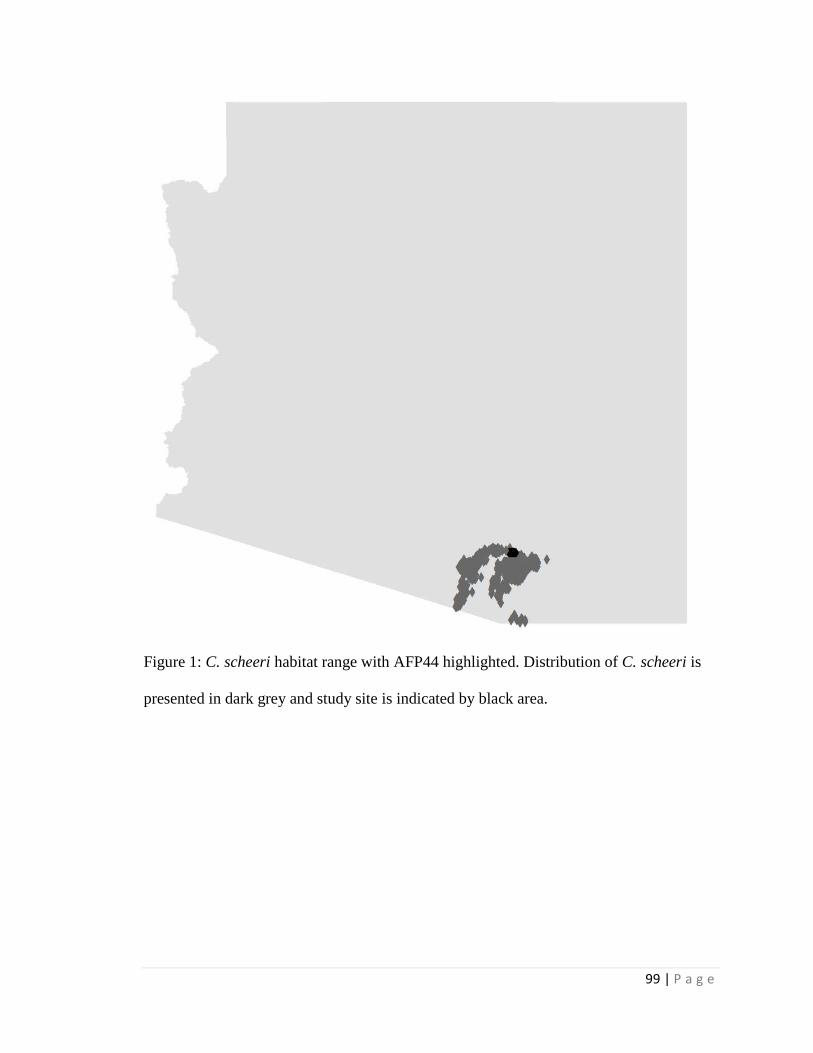
99 | P a g e
Figure 1: C. scheeri habitat range with AFP44 highlighted. Distribution of C. scheeri is
presented in dark grey and study site is indicated by black area.
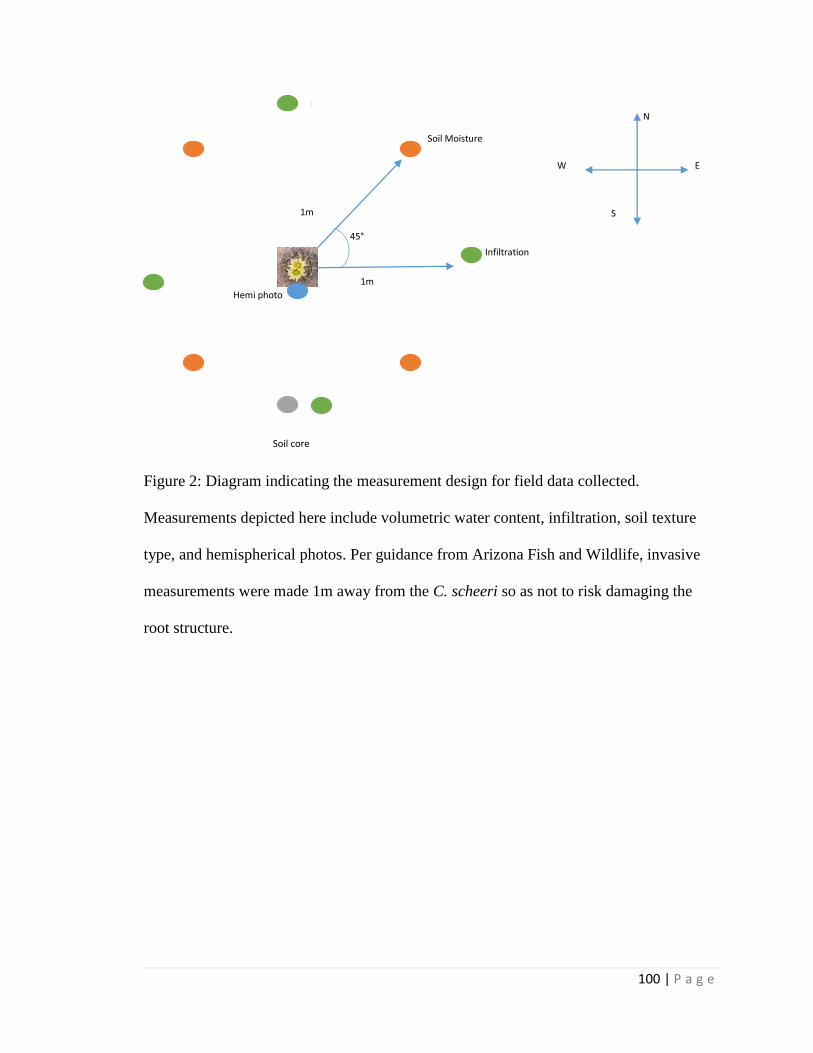
100 | P a g e
Figure 2: Diagram indicating the measurement design for field data collected.
Measurements depicted here include volumetric water content, infiltration, soil texture
type, and hemispherical photos. Per guidance from Arizona Fish and Wildlife, invasive
measurements were made 1m away from the C. scheeri so as not to risk damaging the
root structure.
1m
1m
Soil Moisture
Soil Core
Infiltration
Hemi photo
45°
N
W
S
E
Soil core

101 | P a g e
Figure 3: Daily measurements of temperature (a, b), growing degree days (GDD) (c, d),
precipitation and volumetric water content (e, f) are presented here in conjunction with
phenological events (e.g. bud formation, square, and bloom events, diamonds) for both
study years.
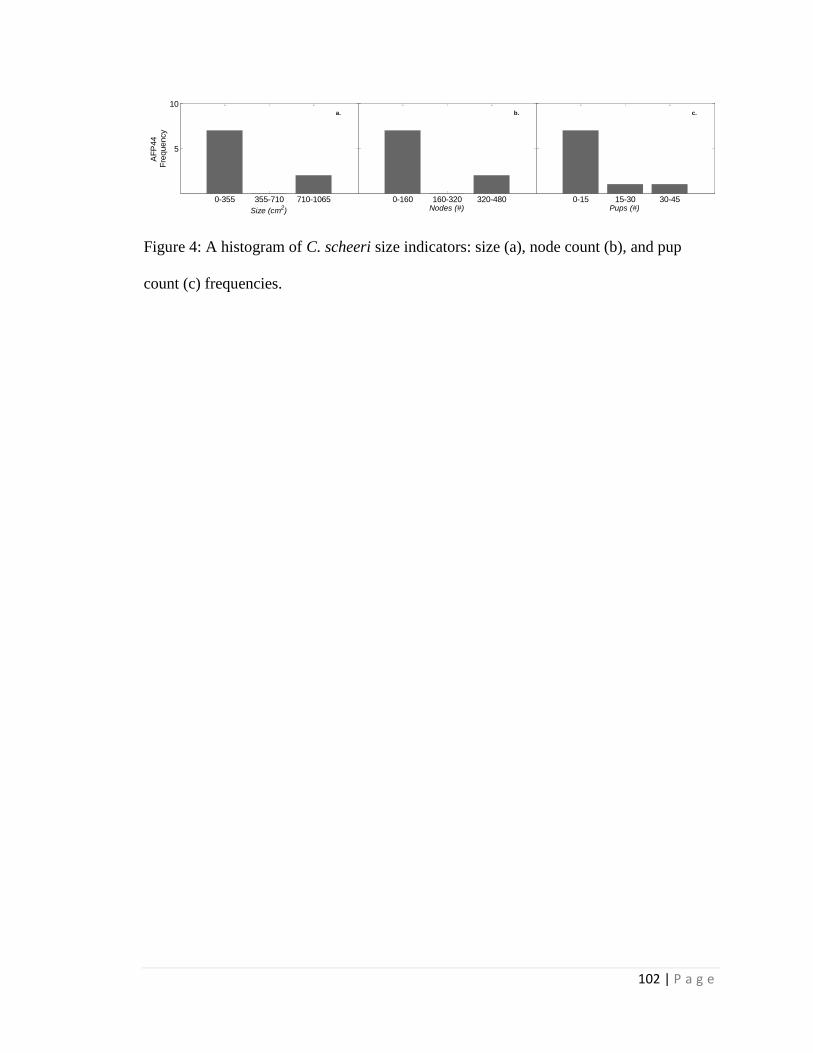
102 | P a g e
Figure 4: A histogram of C. scheeri size indicators: size (a), node count (b), and pup
count (c) frequencies.
0-355 355-710 710-1065
5
10
AF
P44
Fre
quency
a.
Size (cm2)
0-160 160-320 320-480
b.
Nodes (#)0-15 15-30 30-45
c.
Pups (#)

103 | P a g e
Figure 5: Physical C. scheeri habitat characteristics as they related to C. scheeri size
indicators. Site characteristics include infiltration rate (a, d, g), % sand as an indicator of
soil texture type (b, e, h), and Direct Site Factor (DSF) for fraction of potential annual
radiation input (c, f, i). Size indicators are normalized for context, and include size (a, b,
c), node count (d, e, f), and pup count (g, h, i).
0.03 0.04 0.05 0.06
0.25
0.50
0.75
1.0
a.
Norm
aliz
ed
Siz
e
0.03 0.04 0.05 0.06
0.25
0.50
0.75
1.0
d.
Norm
aliz
ed
Node C
ount
.03 .04 .05 .06
0.25
0.50
0.75
1.0
g.
Norm
aliz
ed
Pup C
ount
Infiltration Rate (mm/s)
40 50 60 70 80
b.
40 50 60 70 80
e.
40 50 60 70 80
h.
%Sand
0.9 0.92 0.94 0.96 0.98
c.
0.9 0.92 0.94 0.96 0.98
f.
.90 .92 .94 .96 .98
i.
DSF
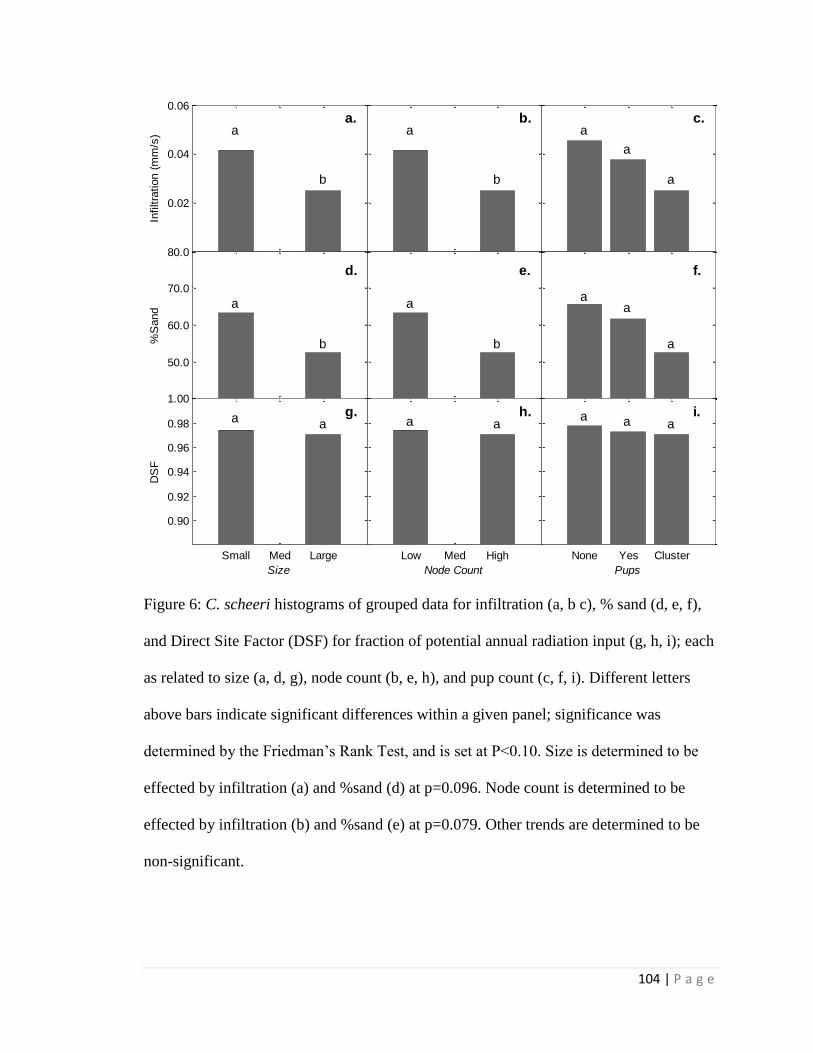
104 | P a g e
Figure 6: C. scheeri histograms of grouped data for infiltration (a, b c), % sand (d, e, f),
and Direct Site Factor (DSF) for fraction of potential annual radiation input (g, h, i); each
as related to size (a, d, g), node count (b, e, h), and pup count (c, f, i). Different letters
above bars indicate significant differences within a given panel; significance was
determined by the Friedman’s Rank Test, and is set at P<0.10. Size is determined to be
effected by infiltration (a) and %sand (d) at p=0.096. Node count is determined to be
effected by infiltration (b) and %sand (e) at p=0.079. Other trends are determined to be
non-significant.
1 2 3
0.02
0.04
0.06a.
a
b
Infiltra
tion (
mm
/s)
1 2 3
b.
a
b
1 2 3
c.
a
a
a
50.0
60.0
70.0
80.0
d.
a
b%S
and
e.
a
b
f.
aa
a
Small Med Large
0.90
0.92
0.94
0.96
0.98
1.00
g.a a
Size
DS
F
Low Med High
h.a a
Node Count
None Yes Cluster
i.a a a
Pups
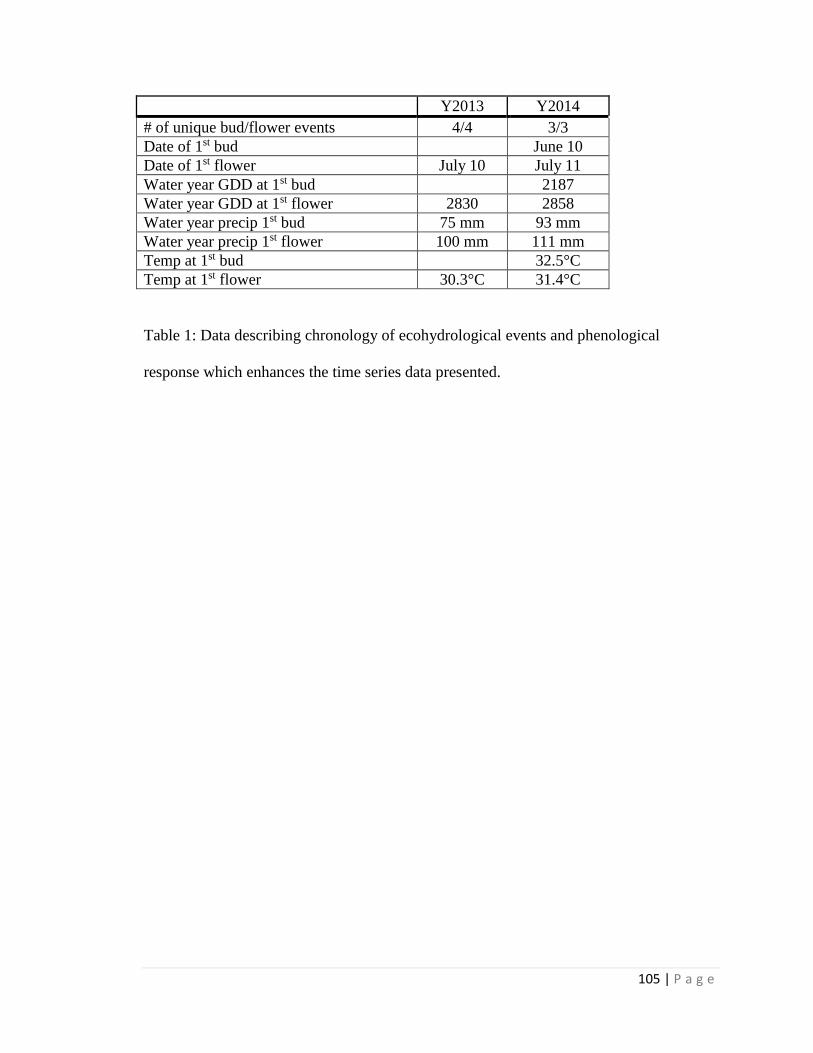
105 | P a g e
Y2013 Y2014
# of unique bud/flower events 4/4 3/3
Date of 1st bud June 10
Date of 1st flower July 10 July 11
Water year GDD at 1st bud 2187
Water year GDD at 1st flower 2830 2858
Water year precip 1st bud 75 mm 93 mm
Water year precip 1st flower 100 mm 111 mm
Temp at 1st bud 32.5°C
Temp at 1st flower 30.3°C 31.4°C
Table 1: Data describing chronology of ecohydrological events and phenological
response which enhances the time series data presented.

106 | P a g e
APPENDIX C: SUPPLEMENTAL DATA FROM SANTA RITA EXPERIMENTAL
RANGE ON PLANT PHYISCAL CHARACTERISTICS AND ASSOCIATED
ABIOTIC CHARACTERISTICS
107 | P a g e
1.0 Methods
1.1 Site Description
The Santa Rita Experimental Range (SRER) is a large, multi-use area located
approximately 40 km south of Tucson, Arizona and covers about 21043 hectares (Figure
1). The area is used for camping, grazing, hunting, and has been a location for study and
experiments for over 100 years, managed initially by the U.S. Forest Service in 1902, and
transferring authority to the University of Arizona in 1987 (http://cals.arizona.edu/srer/).
Soil types and vegetation cover vary greatly within the SRER as a consequence of an
elevational gradient and a variety of different anthropogenic activities (e.g. grazing)
(http://cals.arizona.edu/srer/). Mean annual temperature at the SRER is 18.44°C
(McClaran & Wei, 2014) and based on 80 years of data, mean annual precipitation ranges
between 275 mm – 450 mm across the range (McClaran, 2010).
Using location data from the Arizona Heritage Data Management System
(http://www.azgfd.gov/w_c/edits/species_concern.shtml; AHDMS), maps of C. scheeri
within the study areas were generated in ArcMap v10.2 (Figure 1). Maps generated using
AHDMS data were used to identify locations of C. scheeri within the SRER. However,
because the small C. scheeri are very sparse within the SRER, individuals were difficult
to locate. In the end, our study made use of the randomly selected C. scheeri individuals
that could be successfully located within the SRER (11 total). All data were carefully
gathered with the guidance of U.S. Fish and Wildlife Service (USFWS) so as not to harm
or disturb the endangered C. scheeri plants.

108 | P a g e
1.2 Abiotic Data
A 5-cm diameter soil core was extracted from the upper 10 cm, located 1 m south
of each C. scheeri plant (11 total). Each of these soil samples was sieved to remove any
gravel > 2 cm in diameter. The remaining soil was analyzed for soil texture via Particle
Size Analysis by the Center for Environmental Physics and Mineralogy (CEPM) lab at
the University of Arizona.
Direct Site Factor (DSF) is an estimate of potential incoming solar radiation for a
cloudless year that ranges from 0.0 to 1.0, where a value of 1.0 indicates complete
exposure to incoming solar radiation and 0.0 indicates complete shading (Rich, 1989;
Rich et al., 1999). The fractional reductions are determined by nearby vegetation
obstructions, as well as topographical effects (the latter are usually relatively small unless
in close proximity to tall topographic features). In our study, we derived DSF using
images taken with a Nikon Coolpix camera instrumented with a fish-eye lens to capture a
full 180° image directly south of each C. scheeri plant. We took images at each C.
scheeri plant (11 total) using the fish-eye lens either at dawn or dusk when there was still
daylight but when the sun was not in the sky to avoid the sun appearing in the photo. The
camera was placed on a small bean bag to level the camera and oriented with a marker to
indicate North in the photo. The image height was at approximately 25 cm above the
ground surface. The photographer was positioned on the north side of each C. scheeri
plant so as not to shade the C. scheeri plant in any way. Each image was processed in
Delta-T Devices HemiView v. 2.1 software to adjust the contrast so that the sky is white
and all other objects which would create shade are black. DSF is the percent of the image
that is white (open). We took these images once at each C. scheeri plant in the two-year

109 | P a g e
study period, which, based on the path of the sun in the sky at that location, yields an
annual value of DSF.
1.3 C. scheeri Plant Physical Characteristics
The height and diameter of each individual C. scheeri was measured with a
measuring tape; for circumference, a string was used to measure around the C. scheeri
between the spines. Height and diameter were multiplied together to calculate a C.
scheeri size; this size was normalized by dividing by the largest size in our dataset.
Additionally, the nodes on each individual C. scheeri were counted, as well as the
number of pups. Number of nodes and number of pups were also normalized by dividing
by the largest number of nodes and largest number of pups in our dataset, which included
data from Appendix B.
2.0 Results
2.1 C. scheeri Plant Physical Characteristics
The three C. scheeri plant physical characteristics—size, number of nodes, and
number of pups—all varied substantially among individuals (Figure 2) and exhibited
skewed frequency distributions with many more individuals in the smallest size class of
each and few individuals being in the largest class (Figure 3). C. scheeri at our study sites
ranged from 3.5 -12.0 cm tall and 6.3 -12.5 cm diameter. Node count ranged from 20 to
56 nodes. Number of pups ranged from five individual C. scheeri having no pups, to six
individual C. scheeri having between one and ten pups.
2.2 Abiotic Factors Influencing C. scheeri Plant Physical Characteristics
C. scheeri individuals spanned a range of the three plant physical characteristics
(size, # of nodes, and # of pups) for two abiotic factors: a soil metric (% sand) and a

110 | P a g e
radiation input metric (fraction of potential incoming solar radiation at a location; DSF).
C. scheeri individuals spanned soil texture types, but were mostly found on sandy loam
(6 sites) or sandy clay loam (4 sites), with one individual on clay loam. Sand ranged from
40-78% across individual C. scheeri locations; associated silt and clay composition each
ranged from approximately 10-30%. Sand composition did not appear to relate to any of
the three size metrics (Figure 4b, e, h). Fraction of potential solar radiation input near the
ground (DSF) was relatively high for all sites ranging from 0.90 to 0.99, with most >
0.95.
When each of the three the size metrics are aggregated into three size categories
relative to C. scheeri size values studied at another site (Appendix B), additional patterns
were suggested. Higher DSF values (Figure 4f) appear to be associated lack of pups.
There were not pronounced differences in size with % sand (Figure 4c).

111 | P a g e
References
McClaran, M.P., D.M. Browning, and C. Huang. 2010 Temporal dynamics and spatial
variability in desert grassland vegetation. In R.H. Webb, D.E. Boyer, and R.M.
Turner (eds.). Repeat Photography: Methods and Applications in the Natural
Sciences. Island Press. Pages 145-166.
McClaran, M. P., & Wei, H. Y. 2014. Recent drought phase in a 73-year record at two
spatial scales: implications for livestock production on rangelands in the
Southwestern United States. Agricultural and Forest Meteorology, 197, 40-51. doi:
10.1016/j.agformet.2014.06.004
Rich P. M. (1989) A Manual for Analysis of Hemispherical Canopy Photography. Los
Alamos National Laboratory Report LA-11733-M. Los Alamos National
Laboratory, Los Alamos.
Rich P. M.,Wood J., Vieglais D. A., Burek K. & Webb N. (1999) Guide to Hemiview:
Software for Analysis of Hemispherical Photography. Delta-T Devices, Cambridge.

112 | P a g e
List of Figures:
Figure 1: C. scheeri habitat range with SRER highlighted. Distribution of C. scheeri is
demonstrated in dark grey and study sites are indicated by black area………………...113
Figure 2: Physical C. scheeri habitat characteristics as they related to C. scheeri size
indicators. Site characteristics include % sand as an indicator of soil texture type (a, c, e),
and Direct Site Factor (DSF) for fraction of potential annual radiation input (b, d, f). Size
indicators are normalized for context, and include size (a, b), node count (c, d), and pup
count (e, f)………………………………………………………………………………114
Figure 3: A histogram of C. scheeri size indicators: size (a), node count (b), and pup
count (c) frequencies……………………………………………………………………115
Figure 4: C. scheeri histograms of grouped data for % sand (a, b, c), and Direct Site
Factor (DSF) for fraction of potential annual radiation input (d, e, f); each as related to
size (a, d), node count (b, e), and pup count (c, f). Different letters above bars indicate
significant differences within a given panel; significance was determined by the
Friedman’s Rank Test, and is set at P<0.10. DSF is determined to have a relationship
with pup count with a p-value of 0.054. Other trends are determined to be non-
significant……………………………………………………………………………….116
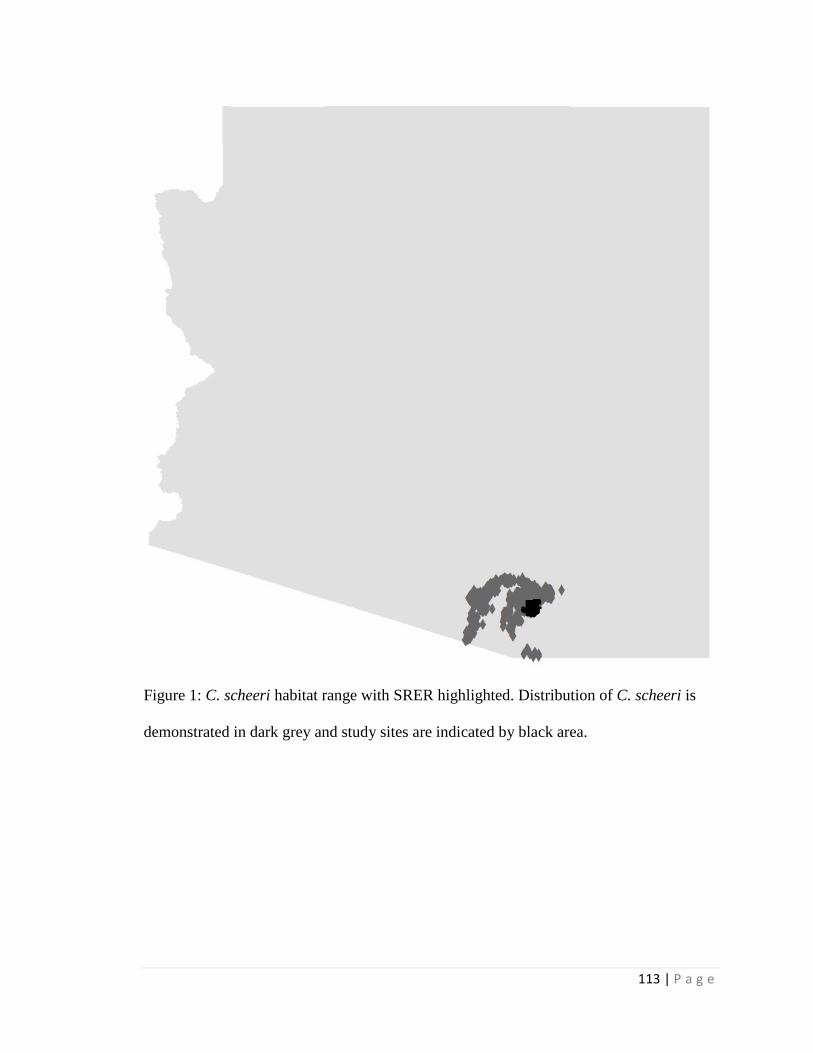
113 | P a g e
Figure 1: C. scheeri habitat range with SRER highlighted. Distribution of C. scheeri is
demonstrated in dark grey and study sites are indicated by black area.
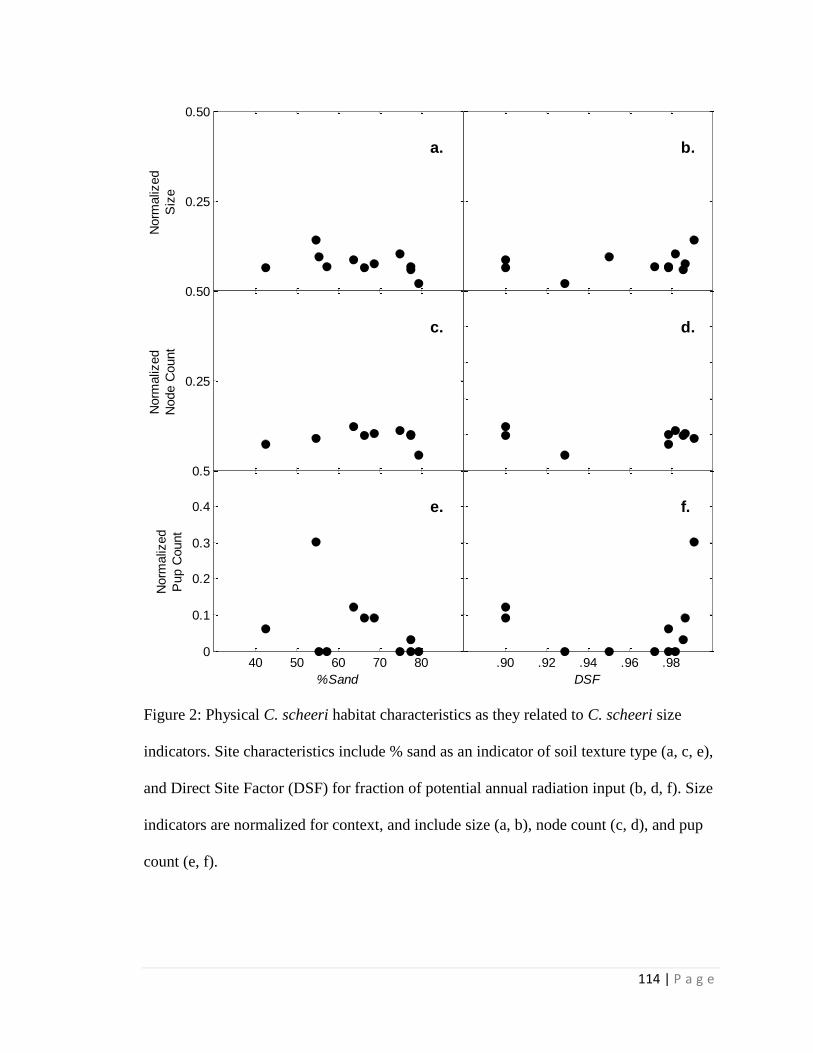
114 | P a g e
Figure 2: Physical C. scheeri habitat characteristics as they related to C. scheeri size
indicators. Site characteristics include % sand as an indicator of soil texture type (a, c, e),
and Direct Site Factor (DSF) for fraction of potential annual radiation input (b, d, f). Size
indicators are normalized for context, and include size (a, b), node count (c, d), and pup
count (e, f).
40 50 60 70 80
0.25
0.50
a.N
orm
aliz
ed
Siz
e
40 50 60 70 80
0.25
0.50
c.
Norm
aliz
ed
Node C
ount
40 50 60 70 800
0.1
0.2
0.3
0.4
0.5
e.
%Sand
Norm
aliz
ed
Pup C
ount
0.9 0.92 0.94 0.96 0.98
b.
0.9 0.92 0.94 0.96 0.98
d.
.90 .92 .94 .96 .98
f.
DSF
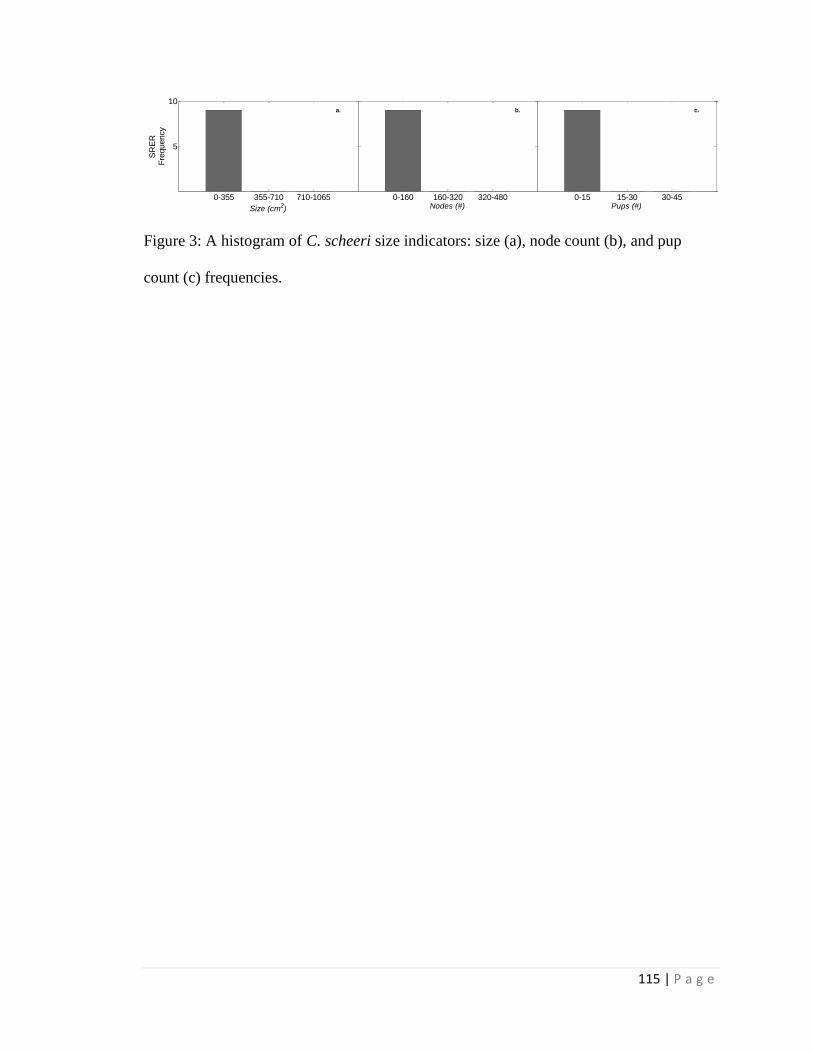
115 | P a g e
Figure 3: A histogram of C. scheeri size indicators: size (a), node count (b), and pup
count (c) frequencies.
0-355 355-710 710-1065
5
10a.
SR
ER
Fre
quency
Size (cm2)
0-160 160-320 320-480
b.
Nodes (#)0-15 15-30 30-45
c.
Pups (#)
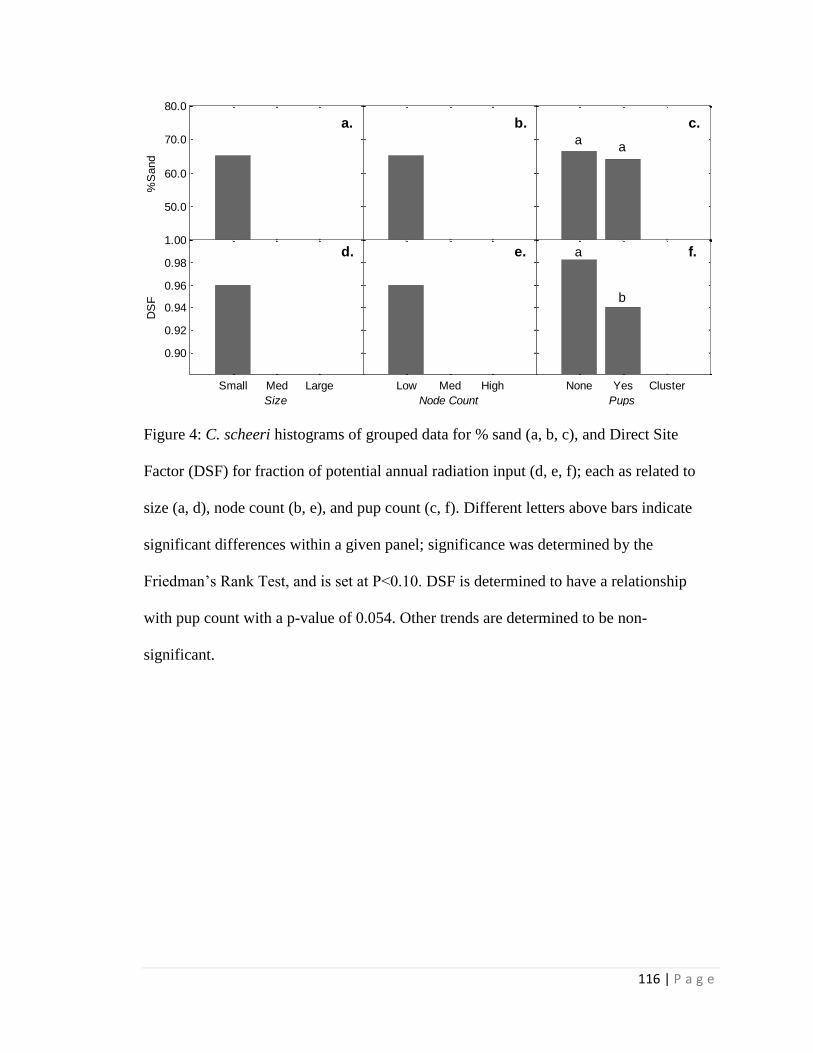
116 | P a g e
Figure 4: C. scheeri histograms of grouped data for % sand (a, b, c), and Direct Site
Factor (DSF) for fraction of potential annual radiation input (d, e, f); each as related to
size (a, d), node count (b, e), and pup count (c, f). Different letters above bars indicate
significant differences within a given panel; significance was determined by the
Friedman’s Rank Test, and is set at P<0.10. DSF is determined to have a relationship
with pup count with a p-value of 0.054. Other trends are determined to be non-
significant.
50.0
60.0
70.0
80.0
a.
%S
and
b.
c.
aa
Small Med Large
0.90
0.92
0.94
0.96
0.98
1.00d.
Size
DS
F
Low Med High
e.
Node Count
None Yes Cluster
f.a
b
Pups