ecohydrological controls on snowmelt partitioning in … pdf/molotch_et_al_eco09.pdf ·...
TRANSCRIPT

ECOHYDROLOGYEcohydrol. 2, 129–142 (2009)Published online 22 May 2009 in Wiley InterScience(www.interscience.wiley.com) DOI: 10.1002/eco.48
Ecohydrological controls on snowmelt partitioning inmixed-conifer sub-alpine forests
Noah P. Molotch,1,2* Paul D. Brooks,3 Sean P. Burns,4,6 Marcy Litvak,5 Russell K. Monson,6
Joseph R. McConnell7 and Keith Musselman2,1
1 Jet Propulsion Laboratory, California Institute of Technology, Pasadena, CA 91109, USA2 Department of Civil and Environmental Engineering, University of California, Los Angeles, CA 90095, USA
3 Department of Hydrology and Water Resources, University of Arizona, Tucson, AZ 85721, USA4 National Center for Atmospheric Research, Boulder, CO 80301, USA
5 Department of Biology, University of New Mexico, Albuquerque, NM 87131, USA6 Department of Ecology and Evolutionary Biology and Cooperative Institute for Research in Environmental Sciences, University of Colorado,
Boulder, CO 80309, USA7 Desert Research Institute, Reno, NV 89512, USA
ABSTRACT
We used co-located observations of snow depth, soil temperature, and moisture and energy fluxes to monitor variability insnowmelt infiltration and vegetation water use at mixed-conifer sub-alpine forest sites in the Valles Caldera, New Mexico(3020 m) and on Niwot Ridge, Colorado (3050 m). At both sites, vegetation structure largely controlled the distribution of snowaccumulation with 29% greater accumulation in open versus under-canopy locations. Snow ablation rates were diminished by39% in under-canopy locations, indicating increases in vegetation density act to extend the duration of the snowmelt season.Similarly, differences in climate altered snow-season duration, snowmelt infiltration and evapotranspiration. Commencement ofthe growing season was coincident with melt-water input to the soil and lagged behind springtime increases in air temperatureby 12 days on average, ranging from 2 to 33 days under warmer and colder conditions, respectively. Similarly, the timing ofpeak soil moisture was highly variable, lagging behind springtime increases in air temperature by 42 and 31 days on average atthe Colorado and New Mexico sites, respectively. Latent heat flux and associated evaporative loss to the atmosphere was 28%greater for the year with earlier onset of snowmelt infiltration. Given the large and variable fraction of precipitation that waspartitioned into water vapour loss, the combined effects of changes in vegetation structure, climate and associated changes tothe timing and magnitude of snowmelt may have large effects on the partitioning of snowmelt into evapotranspiration, surfacerunoff and ground water recharge. Copyright 2009 John Wiley & Sons, Ltd.
KEY WORDS snowmelt infiltration; evapotranspiration; snow-vegetation interactions; vegetation change
Received 21 May 2008; Accepted 7 January 2009
INTRODUCTION
In the higher elevations of the western US, seasonal snowaccumulation provides the primary source of water inputto the terrestrial ecosystem. Understanding the mecha-nisms that control the accumulation, melt and partitioningof melt water into the various hydrologic pathways hasbeen limited by a lack of integrated measurements ofgoverning fluxes and states. Developing this integratedmeasurement strategy is particularly important as recentevidence suggests that the mountain snowpack is declin-ing in response to regional increase in spring air temper-ature (Mote et al., 2005). The impact of these changeson sub-alpine forests remains unknown although a rea-sonable hypothesis is that earlier snowmelt will lead tointensified and prolonged periods of water stress (Baleset al., 2006). These effects will likely vary across gradi-ents in elevation, aspect, and physiographic and climaticfactors, which control energy exchange between the land
* Correspondence to: Noah P. Molotch, Jet Propulsion Laboratory, Cal-ifornia Institute of Technology, M/S 300-233, 4800 Oak Grove Drive,Pasadena, CA 91109, USA. E-mail: [email protected]
surface and the atmosphere during and after the snowcover period.
In areas where winter snowfall dominates over summerrainfall, snowmelt controls the timing and magnitudeof both runoff events and soil moisture, which cansustain photosynthesis and carbon uptake late into thesummer season (Sacks et al., 2007). Complex spatialand temporal heterogeneity in local energy climates,vegetation, topography and associated variability in snowaccumulation and melt processes complicate attempts toquantify and model snow distribution and to estimate thetiming and magnitude of snowmelt (Molotch and Bales,2005), the distribution of soil moisture (Zehe and Bloschl,2004) and rates of evapotranspiration (Wigmosta et al.,1994).
Coniferous forests have profound effects on snowaccumulation and snowmelt (Faria et al., 2000). Large-scale changes in forest distribution associated with beetleinfestation, fire, disease and changes in climate havebearing on downstream water quality due to increasederosion and sediment transport and may impact local soilmoisture availability and future forest spatial patterns
Copyright 2009 John Wiley & Sons, Ltd.

130 N. P. MOLOTCH ET AL.
and biodiversity (Carignan et al., 2000). Additionally,changes in forest ecology from fire suppression haveincreased forest density (Johnson, 1994), which is knownto decrease snow water yield (Golding and Swanson,1986). We currently lack a mechanistic understanding ofthe effects of vegetation on snow distribution necessaryto address the impacts of these annual, decadal and long-term forest dynamics on water resources.
With regard to these mechanisms, studies at thecatchment scale have revealed the general response ofhydrological processes to reductions of forest cover. Forexample, Hibbert (1969) showed that reduction of forestcover decreases water yield, and Kattelmann et al. (1983)and Stednick (1996) showed that the timing and durationof snowmelt-induced runoff is highly sensitive to forestcover properties. Controls of forest canopy on snowpack-atmosphere radiative and turbulent transfer have beenwell documented (Price and Dunne, 1976; Hardy et al.,1997; Link and Marks, 1999; Woo and Giesbrecht, 2000;Gelfan et al., 2004). Similarly, the effects of vegetationon snow accumulation have been extensively evaluated(Golding and Swanson, 1978, 1986; Davis et al., 1997;Faria et al., 2000).
To date, the aforementioned works related to snow–vegetation interactions have not been extended to appli-cations related to soil moisture or vegetation response towater availability. Here it is important to note that sev-eral works have documented the importance of snowmelton water availability and therefore photosynthesis andcarbon uptake during the growing season (Pataki et al.,2000). Direct measurements of these processes are lack-ing and therefore our understanding of governing dynam-ics has been limited. Such understanding is critical forpredicting vegetation response to shifts in climate andfor understanding how vegetation change impacts thebasin-scale water balance. In this regard, the strongestsignal of changes in climate and vegetation distributionmay be observed in snowpack processes; e.g. increasedinterception and prolonged shading of the snow-surfaceassociated with increased vegetation density (Lopez-Moreno and Latron, 2008); earlier snowmelt associatedwith increased temperature (Stewart et al., 2004) andincreased soil freezing due to reduced snow accumula-tion (Brooks et al., 1997; Monson et al., 2002). There-fore, ecohydrological responses to shifts in climate andvegetation change may largely depend on snowpack pro-cesses and the complex interactions between vegetationdistribution, snow redistribution, variability in solar irra-diance, snowmelt, soil moisture and soil temperature.These states and fluxes need to be observed directly andcontinuously, from the onset of snow accumulation to theend of the snowmelt infiltration period—a focus of thisarticle.
Our objective here is to use direct observations toimprove understanding of the spatial and temporal rela-tionships between snow accumulation and melt distri-bution, the distribution of soil moisture and tempera-ture, and vegetation structure. Snow, soil moisture andeddy covariance instrument clusters were used to monitor
water fluxes and states within two mixed-conifer sub-alpine forests at the Valles Caldera, New Mexico (three-year observation period) and Niwot Ridge, Colorado(two-year observation period). Using data from theseinstrument clusters, we evaluate the following questions:
(i) How does vegetation structure influence the magni-tude and timing of snow accumulation and snowmelt?
(ii) How does variability in snow accumulation,snowmelt and snow cover persistence influence thetemporal variability in soil temperature and mois-ture?
(iii) How does the timing and magnitude of snowmeltaffect vegetation water use and the partitioning ofwater into different pathways?
STUDY SITES
Valles Caldera National Preserve, New Mexico
The Valles Caldera Mixed-Conifer instrument clus-ter (35Ð888447 N, 106Ð532114 W) is located in the¾1200 km2 Jemez River basin in north-central NewMexico at the southern margin of the Rocky Mountainecoregion (Figure 1a) (Brooks and Vivoni, 2008). Theinstrument cluster is distributed across the northeast flankof Redondo Peak with snow depth and eddy flux observa-tions at an elevation of 3020 m and soil moisture obser-vations just west of the flux footprint at the RedonditoSaddle at 3240 m. Ancillary precipitation and tempera-ture data were collected at the Vacas Locas SNOwpackTELemetry (SNOTEL) site (2844 m), located 28 km tothe northwest. Precipitation in the region is bimodal,where ¾65% of the annual precipitation falls primar-ily as snow between October and April and ¾35% fallsas rain during the monsoon months between July andSeptember. The primary forest type of the study site is amixed-conifer forest, consisting of Douglas fir (Pseudot-suga menziesii ), white fir (Abies concolor), blue spruce(Picea pungens), southwestern white pine (Pinus strobi-formis), limber pine (Pinus flexilis) and ponderosa pine(Pinus ponderosa) along with scattered aspens (Popu-lus tremuloides) and very little understory. The meancanopy height around the flux tower (Figure 1c) is 19Ð6 mand the Leaf Area Index (LAI) during the growing sea-son is 3Ð43 m2 m�2 (McDowell et al., 2008). The regionprovides a unique setting for study of snow–vegetationinteractions as such studies in mid-latitude ecosystems areunder-represented within the literature. In this regard, theimpact of solar radiation on the snowpack energy balanceis greater relative to higher latitudes. As a result, micro-scale gradients in energy fluxes associated with canopystructure may be more significant as compared to higherlatitude systems.
Niwot Ridge, Colorado, ameriflux site
The Niwot Ridge, Colorado Ameriflux site (40° 10 5800 N;105° 320 4700 W) is located at an elevation of 3050 mapproximately 8 km east of the Continental Divide
Copyright 2009 John Wiley & Sons, Ltd. Ecohydrol. 2, 129–142 (2009)DOI: 10.1002/eco
ECOHYDROLOGICAL CONTROLS ON SNOWMELT PARTITIONING IN MIXED-CONIFER SUB-ALPINE FORESTS 131
Kiowa Pk.N. Arapahoe Pk.
AlbuquerqueRedondo Pk.
(a) (b)
(e)
(c) (d)
0 20 40 60m0 20 40 60m
0 2 3 km1
CO
NM
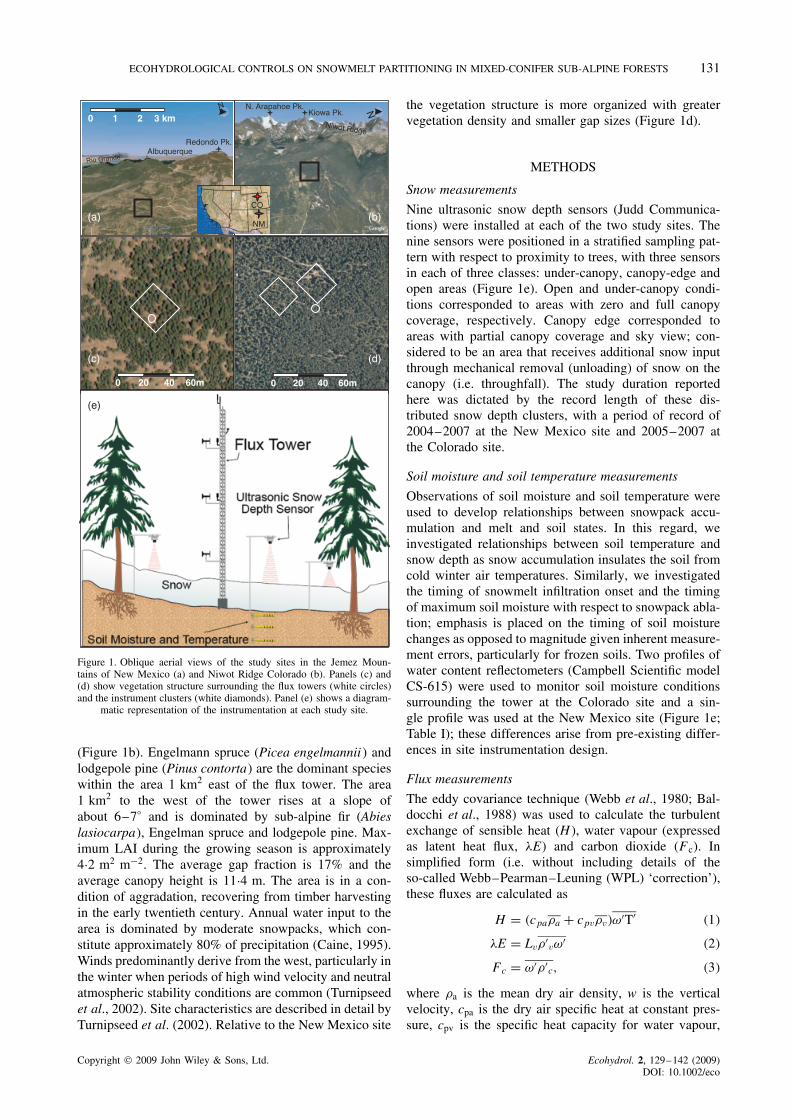
Figure 1. Oblique aerial views of the study sites in the Jemez Moun-tains of New Mexico (a) and Niwot Ridge Colorado (b). Panels (c) and(d) show vegetation structure surrounding the flux towers (white circles)and the instrument clusters (white diamonds). Panel (e) shows a diagram-
matic representation of the instrumentation at each study site.
(Figure 1b). Engelmann spruce (Picea engelmannii ) andlodgepole pine (Pinus contorta) are the dominant specieswithin the area 1 km2 east of the flux tower. The area1 km2 to the west of the tower rises at a slope ofabout 6–7° and is dominated by sub-alpine fir (Abieslasiocarpa), Engelman spruce and lodgepole pine. Max-imum LAI during the growing season is approximately4Ð2 m2 m�2. The average gap fraction is 17% and theaverage canopy height is 11Ð4 m. The area is in a con-dition of aggradation, recovering from timber harvestingin the early twentieth century. Annual water input to thearea is dominated by moderate snowpacks, which con-stitute approximately 80% of precipitation (Caine, 1995).Winds predominantly derive from the west, particularly inthe winter when periods of high wind velocity and neutralatmospheric stability conditions are common (Turnipseedet al., 2002). Site characteristics are described in detail byTurnipseed et al. (2002). Relative to the New Mexico site
the vegetation structure is more organized with greatervegetation density and smaller gap sizes (Figure 1d).
METHODS
Snow measurements
Nine ultrasonic snow depth sensors (Judd Communica-tions) were installed at each of the two study sites. Thenine sensors were positioned in a stratified sampling pat-tern with respect to proximity to trees, with three sensorsin each of three classes: under-canopy, canopy-edge andopen areas (Figure 1e). Open and under-canopy condi-tions corresponded to areas with zero and full canopycoverage, respectively. Canopy edge corresponded toareas with partial canopy coverage and sky view; con-sidered to be an area that receives additional snow inputthrough mechanical removal (unloading) of snow on thecanopy (i.e. throughfall). The study duration reportedhere was dictated by the record length of these dis-tributed snow depth clusters, with a period of record of2004–2007 at the New Mexico site and 2005–2007 atthe Colorado site.
Soil moisture and soil temperature measurements
Observations of soil moisture and soil temperature wereused to develop relationships between snowpack accu-mulation and melt and soil states. In this regard, weinvestigated relationships between soil temperature andsnow depth as snow accumulation insulates the soil fromcold winter air temperatures. Similarly, we investigatedthe timing of snowmelt infiltration onset and the timingof maximum soil moisture with respect to snowpack abla-tion; emphasis is placed on the timing of soil moisturechanges as opposed to magnitude given inherent measure-ment errors, particularly for frozen soils. Two profiles ofwater content reflectometers (Campbell Scientific modelCS-615) were used to monitor soil moisture conditionssurrounding the tower at the Colorado site and a sin-gle profile was used at the New Mexico site (Figure 1e;Table I); these differences arise from pre-existing differ-ences in site instrumentation design.
Flux measurements
The eddy covariance technique (Webb et al., 1980; Bal-docchi et al., 1988) was used to calculate the turbulentexchange of sensible heat (H), water vapour (expressedas latent heat flux, �E) and carbon dioxide (Fc). Insimplified form (i.e. without including details of theso-called Webb–Pearman–Leuning (WPL) ‘correction’),these fluxes are calculated as
H D �cpa�a C cpv�v�ω0T0 �1�
�E D Lv�0vω0 �2�
Fc D ω0�0c, �3�
where �a is the mean dry air density, w is the verticalvelocity, cpa is the dry air specific heat at constant pres-sure, cpv is the specific heat capacity for water vapour,
Copyright 2009 John Wiley & Sons, Ltd. Ecohydrol. 2, 129–142 (2009)DOI: 10.1002/eco

132 N. P. MOLOTCH ET AL.
Table I. Sensor description and sensor heights for the instrument clusters on Niwot Ridge, Colorado and in the Valles Caldera, NewMexico.
Observation Niwot Ridge, Colorado Valles Caldera, New Mexico
Measurementheight, meters
Instrument Measurementheight, meters
Instrument
Relative humidity (%) 21Ð5 HMP-35D, Vaisala, Inc. 21Ð65 HMP-45C, Vaisala, Inc.Air temperature ( °C) 21Ð5 HMP-35D, Vaisala,
Inc./CSAT-3 CampbellScientific
21Ð65 CSAT-3, Campbell Scientific
Pressure (kPa) 12 PT101B, Vaisala, Inc. 2 PT101B, Vaisala, Inc.Net radiation, W m�2 25Ð5 CNR-1, Kipp & Zonen 20 4-component CNR-1, Kipp
& ZonenH2O flux (mg
m�2 s�1)21Ð5 LI-6262, LI-COR
Inc./KryptonHydgrometer/CSAT-3,Campbell Scientific
21Ð65 LI-7500, LI-CORInc./CSAT-3, CampbellScientific
CO2 flux (mgm�2 s�1)
21Ð5 LI-6262, LI-CORInc./CSAT-3, CampbellScientific
21Ð65 LI-6262, LI-CORInc./CSAT-3, CampbellScientific
Wind speed (m s�1) 21Ð5 CSAT-3, Campbell Scientific 21Ð65 CSAT-3, Campbell ScientificWind direction
(degrees)21Ð5 CSAT-3, Campbell Scientific 21Ð65 CSAT-3, Campbell Scientific
Precipitation (mm) 10Ð5 385-L, Met One 2 TE525WS-L, TexasElectronics
Soil heat flux (W m�2) �0Ð1 HFT-1, REBS �0Ð08 HFT-1, REBSSoil moisture (% by
volume)�0Ð05, �0Ð15 CS-615 and CS-616,
Campbell Scientific�0Ð10, �0Ð4 CS-615, Campbell Scientific
Soil temperature ( °C) �0Ð05, �0Ð15, �0Ð35 STP-1, REBS �0Ð01, �0Ð10, �0Ð40 TCAV, Campbell Scientific
T is the temperature, �v is the water vapour density,Lv is the latent heat of vaporization of water (or latentheat of sublimation when no liquid water is present),�c is the partial density of CO2. An overbar indicatesa 30-min mean value and a prime indicates fluctua-tions around the mean (flux parameters were sampledat a rate of 10 Hz). The flux-measuring instrumentationat the Colorado and New Mexico sites were located at21Ð5 and 21Ð65 m above ground, respectively (Table I).Additional details on the Colorado flux measurementsare provided by Monson et al. (2002). The covariance ofthe sonic anemometer temperature fluctuations T0 with w0are corrected for the effect of water vapour and veloc-ity fluctuations following Schotanus et al. (1983). Theprimary instrument measuring �v at the Colorado site isthe open-path krypton hygrometer, where a correctionfor both oxygen and temperature-induced density fluc-tuations (i.e. WPL ‘correction’) are included in the �Ecalculation. The closed-path Licor-6262 is a redundantmeasurement of �v at the Colorado site. A short sectionof copper tubing removes temperature fluctuations fromthe air sample before it enters the LI-6262 sample cell sothat �E does not require the WPL correction; �E mea-sured with the Licor-6262 has been shown to be 3–7%smaller than �E measured with the krypton hygrome-ter though larger differences can occur during the fewdays immediately following snowfall (Turnipseed et al.,2002). From April 2006 to February 2007 the kryptonhygrometer was unavailable at the Colorado site (due toa shortage of krypton source tubes) so �E during thisperiod is calculated exclusively with the Licor-6262. The
primary instrument at the New Mexico site providing �v
observations is an open-path Licor-7500 (Table I).Measurements of above-canopy Fc were used to deter-
mine when latent heat fluxes were associated withecosystem-scale photosynthesis by the forest canopy (i.e.negative Fc values indicate stomatal uptake of carbonand release of water vapour). Prior to this period �Ecan be assumed to be associated with snow sublimation(Molotch et al., 2007). Turbulent flux measurements atthe Colorado site have been evaluated by comparing theavailable energy (i.e. net radiation minus soil heat flux)to the sum of H and �E. During the daytime the sum ofthe turbulent fluxes account for 80–90% of the radiativeenergy input into the system (Turnipseed et al., 2002).At night, under moderate turbulent conditions, the energybalance is comparable to the daytime; however, when thenight-time conditions are either calm or extremely turbu-lent, H and �E only account for 20–60% of the net long-wave radiative flux; Turnipseed et al. (2002) exploredseveral possible reasons for this night-time discrepancy(e.g. instrumental error, footprint mis-match, horizontaladvection), but could not explain the reason for the night-time imbalance.
Ancillary meteorological measurements
Annual differences in climatology were recorded at theSNOTEL sites located adjacent to the study areas (i.e.the University Camp, Colorado and Vacas Locas, NewMexico SNOTEL sites). SNOTEL data were used forthis comparison as the instrumentation is consistent at thetwo sites, facilitating direct comparisons of basic climate
Copyright 2009 John Wiley & Sons, Ltd. Ecohydrol. 2, 129–142 (2009)DOI: 10.1002/eco

ECOHYDROLOGICAL CONTROLS ON SNOWMELT PARTITIONING IN MIXED-CONIFER SUB-ALPINE FORESTS 133
data. In this regard, the temperature and precipitationcomparisons were performed solely to obtain a generalunderstanding of how different the climatological con-ditions were at these two sites during the study period.These comparisons are not the focus of the analyses butprovide useful background information.
RESULTS
Three seasons of data from New Mexico and two sea-sons from Colorado represent a wide range of variabilityin both the amount and timing of snow accumulation,winter temperature, soil moisture and onset of the grow-ing season. Each of these components of the terrestrialwater balance is described below. Sections on Temper-ature and Precipitation describe the general differencesbetween the climatic conditions at these two sites. Vari-ability in snow–vegetation interactions (see Section onSnow–vegetation interactions) and associated observa-tions of soil temperature (see Section on Soil temper-ature) and soil moisture (see Section on Soil moisture)are described as are observed variability in water vapourfluxes to the atmosphere and energy fluxes (see Sectionon Sublimation and Evapotranspiration).
Temperature
A direct comparison of temperature measurements fromthe two local SNOTEL sites indicates a strong lin-ear correlation (R2 D 0Ð89) (Figure 2). The average airtemperature recorded at the Vacas Locas, New Mex-ico SNOTEL site was 0Ð6, 3Ð2 and 2Ð1 °C during the2004–2005, 2005–2006 and 2006–2007 snow seasons,respectively. In 2004–2005, the 10-day average air tem-perature dropped below zero in November and remained
below zero until mid-April (Figure 3). Conversely, in2005–2006, the 10-day average air temperature oscillatedaround the 0° mark, indicating mid-winter periods withconsiderable warming and potential surface snowmelt. In2006–2007, the 10-day mean fell below 0 °C in earlyDecember and remained below zero until mid-March.Spring onset, defined here as the date when the 10-dayrunning mean temperature reached a threshold of 0 °C,began on 12 April 2005, 31 March 2006 and 11 March2007 (Figure 3). Relative to 2004–2005, spring onsetoccurred 13 and 29 days earlier in the 2005–2006 and2006–2007 snow seasons, respectively.
The mean snow-season air temperature at the Coloradosite was 3 °C colder than the New Mexico site duringour study period and was much less variable, averaging�1Ð4 in 2005–2006 and �1Ð07 in 2006–2007. Unlikethe New Mexico site, the 10-day running average airtemperature remained below 0 °C throughout the win-ter period (Figure 3). The 10-day average temperaturedropped below zero in late November for both years androse above zero on 6 April 2006 and 12 March 2007for the two years, respectively. Hence, spring onset com-menced 25 days earlier in 2006–2007.
Precipitation
Measured precipitation at the Vacas Locas SNOTEL sitewas equal to 47, 14 and 37 cm in the 2004–2005,2005–2006 and 2006–2007 water years, respectively(Figure 3); equivalent to 134%, 40% and 106% of thesix-year average. During the 2004–2005 water year, pre-cipitation was spread throughout the winter. Conversely,only one notable precipitation event occurred during thewinter of the 2005–2006 water year (i.e. on 10 March).The 2006–2007 water year was marked by a large earlyseason snow storm around 20 December, a notable dry
20
10
-10
-20
Nov. 1 - June 30
University Camp, Colorado, Temperature °C
0
20
10
-10
-20
0
2010-10-20 0
1:1
Nov. 1 - Feb. 28
2010-10-20 0
Mar. 1 - June 30
2010-10-20 0
Figure 2. Relationship between snow-season air temperatures at the Vaca Locas, New Mexico (y-axis) and University Camp, Colorado (x-axis)SNOTEL sites; a similar seasonal distribution of temperatures, but approximately 3 °C warmer temperatures in New Mexico suggest that these sites
are good comparisons for evaluating the effects of a warming climate on snow–vegetation interactions.
Copyright 2009 John Wiley & Sons, Ltd. Ecohydrol. 2, 129–142 (2009)DOI: 10.1002/eco

134 N. P. MOLOTCH ET AL.
11/1 1/1 3/1 5/1 7/1
11/1 1/1 3/1 5/1 7/1 1/1 3/1 5/1 7/1
1/1 3/1 5/1 7/1 1/1 3/1 5/1 7/1
76543210
20
10
0
-10
-20
-30
Vacas Locas, New Mexico
2004-05 2005-06 2006-07
University Camp, Colorado
6543210
20
10
0
-10
-20
-30
72005-06 2006-07
date
Figure 3. Time series of temperature (red) and precipitation (blue) during the three study seasons at Vacas Locas, New Mexico (top row) and twoseasons at University Camp, Colorado (bottom row).
period from mid-February to mid-April, and a seriesof late season precipitation events from mid-April tomid-May.
Average precipitation during the two-year study periodfor the Colorado site was 66 and 62 cm for 2005–2006and 2006–2007 water years, respectively. These totalsrepresent 88% and 82% of the 29-year average, respec-tively, and represent far less inter-annual variability thanobserved at the New Mexico site over the same timeperiod (Figure 3). In both years, precipitation was evenlydistributed throughout the season relative to the high tem-poral variability observed at the New Mexico site.
Snow–vegetation interactions
Using the ultrasonic snow depth sensors, we observedfour primary interactions between vegetation and snow,including snowfall recorded during individual snowfallevents; total winter snow accumulation; decreases indepth before spring melt due to either settling or sublima-tion and decreases in snow depth during the melt seasonassociated with snow settling and melt. Here it should benoted that with the ultrasonic snow depth sensors, we can-not attribute decreases in snow depth to snow settling andmelt independently and therefore in the section on snowsettling and ablation we describe the combined processesof snow settling and melt using the term snow ablation.
Snow depth. Maximum snow depth at the New Mex-ico site was six times greater in the wet winter of2004–2005 than the dry 2005–2006 winter and 54%greater than in 2006–2007 (Figure 4a–c; Table II). Theinfluence of vegetation on snow depth variability wasmuch greater in 2004–2005 and 2006–2007 (Coefficientof Variation �CV� D 0Ð45 and 0Ð5, respectively) relativeto the dry year of 2005–2006 (CV D 0Ð18) (Table II).In 2004–2005 maximum snow accumulation was 49%
greater in open versus under-canopy areas (Figure 4d).Conversely, during the low snowfall year of 2005–2006,maximum snow accumulation was actually 8% greaterin under-canopy locations (Figure 4e); likely a result ofgreater mid-winter ablation in open relative to under-canopy areas. In 2006–2007 maximum snow accumu-lation patterns were more similar to 2004–2005 withopen areas 15% greater than under-canopy locations(Figure 4f; Table II). The date of peak snow depth wasnot related to the amount of snow fall, occurring on 26March 2005, 23 March 2006 and 2 February 2007. Notethat the peak accumulation in 2006–2007 was followedby additional accumulation and significant ablation didnot begin until 3rd March which is 23 days earlier thanthe 2004–2005 date of peak accumulation.
In contrast to the high inter-annual snow depth vari-ability at the New Mexico site, maximum snow depth atthe Colorado site differed by less than 3% for the twostudy years (Figure 5a–d). Spatial variability in max-imum snow accumulation was significantly greater in2006–2007 relative to 2005–2006 (Figure 5a and b); theCV was 0Ð14 and 0Ð21, respectively (Table II). Vegeta-tion played a strong role in controlling this variabilityas maximum snow depth was 27% and 63% greaterin open versus under-canopy locations in 2005–2006and 2006–2007, respectively (Figure 5c and d; Table II).Additionally, there was a 36-day difference in the timingof maximum snow depth, occurring on 20 March 2006and 25 April 2007.
Snowfall. During the 2004–2005, 2005–2006 and2006–2007 snow seasons, the number of notable snow-fall events (i.e. snowfall greater than 10 cm) measuredat the New Mexico site was 4, 3 and 8, respectively(Figure 4a–f); note that in 2004–2005 the observationperiod began in mid-February and thus all snowfall events
Copyright 2009 John Wiley & Sons, Ltd. Ecohydrol. 2, 129–142 (2009)DOI: 10.1002/eco

ECOHYDROLOGICAL CONTROLS ON SNOWMELT PARTITIONING IN MIXED-CONIFER SUB-ALPINE FORESTS 135
0
10
20
30
40
50
60
0
10
20
30
40
50
60
0
20
40
60
80
0
20
40
60
80
snow
dep
th, c
m
(c)(b)
(f)(e)
date
11/20 1/10 3/1 4/20 6/10
11/20 1/10 3/1 4/20 6/10 11/20 1/10 3/1 4/20 6/10
11/20 1/10 3/1 4/20 6/10
0
20
40
60
80
100
120
0
20
40
60
80
100
120
(a)
(d)
11/20 1/10 3/1 4/20 6/10
11/20 1/10 3/1 4/20 6/10
openunderedge
Figure 4. Time series of snow depth in 2004–2005 (a), 2005–2006 (b) and 2006–2007 (c) observed using nine ultrasonic snow depth sensors at theNew Mexico site. Average snow depth observed at under-canopy (green), canopy-edge (blue) and open (red) areas are shown for the three years in
panels (d)–(f).
Table II. Depth and timing of snowpack accumulation and abla-tion during the course of the study; under, open and edge refer
to sensor position with respect to tree canopy.
Valles Caldera, NM CU-Ameriflux, CO
2004 2005 2006 2005 2006
Snow onset 11/22a 1/25 11/28 11/12 10/18Date max. snow 3/26 3/23 2/02 3/20 4/25
Snow dissap.Under 5/14 4/10 4/19 5/16 5/27Open 5/14 4/08 4/17 5/25 6/11Edge 5/16 4/10 4/27 5/25 6/11
Max. snow (cm)All 124Ð4 17Ð6 80Ð8 115Ð8 112Ð8Under 73Ð8 18Ð6 61Ð1 98Ð8 89Ð6Open 109Ð5 17Ð2 70Ð6 125Ð7 145Ð7Edge 103Ð4 15Ð6 64Ð4 118Ð2 117Ð9Max. snow, CV 0Ð45 0Ð18 0Ð5 0Ð14 0Ð21
a Date inferred from observation at Vacas Locas SNOTEL site.
were not recorded. Total snowfall during these eventswas 20% and 5% greater in open and canopy-edge loca-tions relative to under-canopy locations, respectively.Total snow accumulation during 2004–2005, 2005–2006and 2006–2007 was 38%, 5% and 19% greater in openversus under-canopy locations, respectively; note that dif-ferences were lowest during the low snow year. Snow-fall recorded at canopy-edge locations was 25% and 4%greater than under-canopy locations in 2004–2005 and2006–2007, respectively. Conversely, in the low snowyear of 2005–2006, measured snowfall at canopy-edgelocations was actually 10% lower than under-canopylocations for the three notable events. These differencesindicate significant spatial variability in snow accumula-tion patterns associated with vegetation structure and that
0
50
100
150
0
50
100
150
snow
dep
th, c
m
(b)
(d)
date
0
50
100
150
0
50
100
150
open
edgeunder
(a)
(c)
10/1 1/10 4/20 7/30
10/1 1/10 4/20 7/30
10/1 1/10 4/20 7/30
10/1 1/10 4/20 7/30
Figure 5. Time series of snow depth in 2005–2006 (a) and 2006–2007(b) at the Colorado site. Snow depth averages for under-canopy (under),canopy-edge (edge) and open (open) areas are also shown (c) and (d).
these patterns exhibit considerable inter-annual variabil-ity. Furthermore, these observations suggest that snowaccumulation (and water availability) under the canopymay be less sensitive to inter-annual variability and mid-winter melt relative to open areas.
At the Colorado site, 7 notable snowfall events wereobserved in 2005–2006 and 11 notable events wereobserved in 2006–2007 (Figure 5a–d). It is importantto note that SNOTEL observations were used to identifysnowfall events during a 75-day data gap from 5 Januaryto 22 March 2007; this gap has been filled using a linearregression between SNOTEL snow depth measurementsand observed snow depth at each ultrasonic snow depthsensor (R2 values were 0Ð95 for open and canopy-edgelocations and 0Ð88 for under-canopy locations on aver-age; p < 0Ð005). The timing and magnitude of snowfall
Copyright 2009 John Wiley & Sons, Ltd. Ecohydrol. 2, 129–142 (2009)DOI: 10.1002/eco

136 N. P. MOLOTCH ET AL.
was quite variable for the two years, with the 2005–2006season largely composed of a series of smaller snowfallevents and the 2006–2007 season consisting of relativelylarge magnitude events early in the winter (Figure 5aand b); on average notable snowfall events were 17%greater in 2006–2007 relative to 2005–2006. Averagedfor all snowfall events in both years, total accumula-tion was, respectively, 47% and 31% greater in openand canopy-edge locations relative to under-canopy loca-tions (Figure 5c and d). Interestingly, snowfall in openareas was only 14% greater than under-canopy areas in2005–2006 but was 74% greater in 2006–2007. As withthe New Mexico site, these observations indicate thatconsiderable inter-annual variability exists in the relation-ships between vegetation structure and snow distribution.In general, greater accumulation was observed in openareas, particularly for years with greater total snowfall.
Snow settling and ablation. At the New Mexicosite, onset of the snow ablation season (as definedby the date of local maximum snow accumulation)preceded the spring onset by 14, 6 and 8 days in2004–2005, 2005–2006 and 2006–2007, respectively(Table II). While snow ablation associated with snowmeltis unlikely if air temperatures are significantly below0 °C, our sensors also measure snow settling that beginsimmediately after snowfall. After local maxima in snowdepth, snow ablation rates at the New Mexico site weretwice as rapid in open and canopy-edge locations ver-sus under-canopy areas (Figure 4d–f). In 2004–2005 and2006–2007, snow cover duration in under-canopy loca-tions was equivalent to open areas despite the loweramount of maximum snow accumulation (Figure 4d–f).
The onset of the snow ablation season in Col-orado occurred 36 days later in 2006–2007 relative to2005–2006 (Table II). Ablation began 17 and 5 daysprior to the onset of spring in 2005–2006 and 2006–2007, respectively. During the 2005–2006 ablationperiod, snow settling and ablation rates were 32% and
19% greater in open and canopy-edge locations relativeto under-canopy areas, respectively. Relationships wereconsistent in 2006–2007 with 28% and 16% greater abla-tion rates in open and canopy-edge locations relativeto under-canopy. Despite the more rapid snow ablationin open areas, snow cover duration was 9 and 15 dayslonger in open areas relative to under-canopy areasin 2005–2006 and 2006–2007, respectively (Figure 5cand d); a result of the significantly greater maximumaccumulation in open areas. These snow disappearancedates lagged behind the onset of spring by 46 days in2005–2006 and by 26 days in 2006–2007. While theseresults indicate substantial variability from year to yearand from site to site, the overall signal is clear in thatsnow settling and ablation rates are greater in open areasrelative to under-canopy areas.
Soil temperature
Timing of soil insulation. Soil temperatures were highlysensitive to snow accumulation as indicated by thesignificant differences in winter soil temperatures duringthe three years of observations at the New Mexicosite (Figure 6a–c). The well developed snowpack atthe New Mexico site during the winters of 2004–2005and 2006–2007 insulated the ground from cold winterair temperatures whereas in the shallow snow yearof 2005–2006 soil temperatures remained sensitive todiurnal variability in air temperature throughout muchof the winter season (Figure 6a–c). Average subniveansoil temperatures were colder beneath shallow snow(i.e. 2005–2006) and warmer for deeper snow (i.e.2004–2005) (Table III).
Similar relationships between snow accumulation andsoil temperature were observed at the Colorado site.Despite the colder air temperatures, the deeper snowpackat the Colorado site kept subnivean soil temperatureswell above those observed at the New Mexico site(Table III). Average soil temperatures during the snow
-20-10
010203040
-20-10
010203040
-20-10
010203040
soil
tem
pera
ture
, °C 1 cm
10 cm40 cm
10 cm40 cm
0.0
0.1
0.2
0.3
0.4
0.5
0.0
0.1
0.2
0.3
0.4
0.5
0.0
0.1
0.2
0.3
0.4
0.5
VW
C, m
3 m
-3
(a) (b) (c)
(d) (e) (f)
10/1
date
1/10 4/20 7/30
10/1 1/10 4/20 7/30 10/1 1/10 4/20 7/30 10/1 1/10 4/20 7/30
10/1 1/10 4/20 7/30 10/1 1/10 4/20 7/30
Figure 6. Time series of soil temperatures (a)–(c) and volumetric soil water content (d)–(f) at the New Mexico site for the 2004–2005, 2005–2006and 2006–2007 snow seasons (left to right).
Copyright 2009 John Wiley & Sons, Ltd. Ecohydrol. 2, 129–142 (2009)DOI: 10.1002/eco
ECOHYDROLOGICAL CONTROLS ON SNOWMELT PARTITIONING IN MIXED-CONIFER SUB-ALPINE FORESTS 137
Table III. Date of soil insulation, soil thaw, infiltration onset,and maximum soil moisture, soil temperature and soil moisture
values.
Valles Caldera, NM CU-Ameriflux, CO
2004 2005 2006 2005 2006
Soil insulation 11/08 3/7 12/19 11/13 10/16Soil thaw 5/18 4/11 4/20 5/18 6/14
Avg. soil temp.1 cm �0Ð1 �1Ð8 �0Ð4 0Ð12 0Ð4510 cm 0Ð2 �1Ð5 �0Ð3 0Ð18 0Ð5340 cm 0Ð9 �1Ð0 0Ð45 0Ð56 0Ð91Infiltration onset 5/12 4/2 3/13 4/24 3/18Date of max. moisture 5/18 4/15 4/17 5/21 5/28
Max. VWCSurface 0Ð291 0Ð27 0Ð27 0Ð2 0Ð43Depth 0Ð385 0Ð25 0Ð41 0Ð45 0Ð51
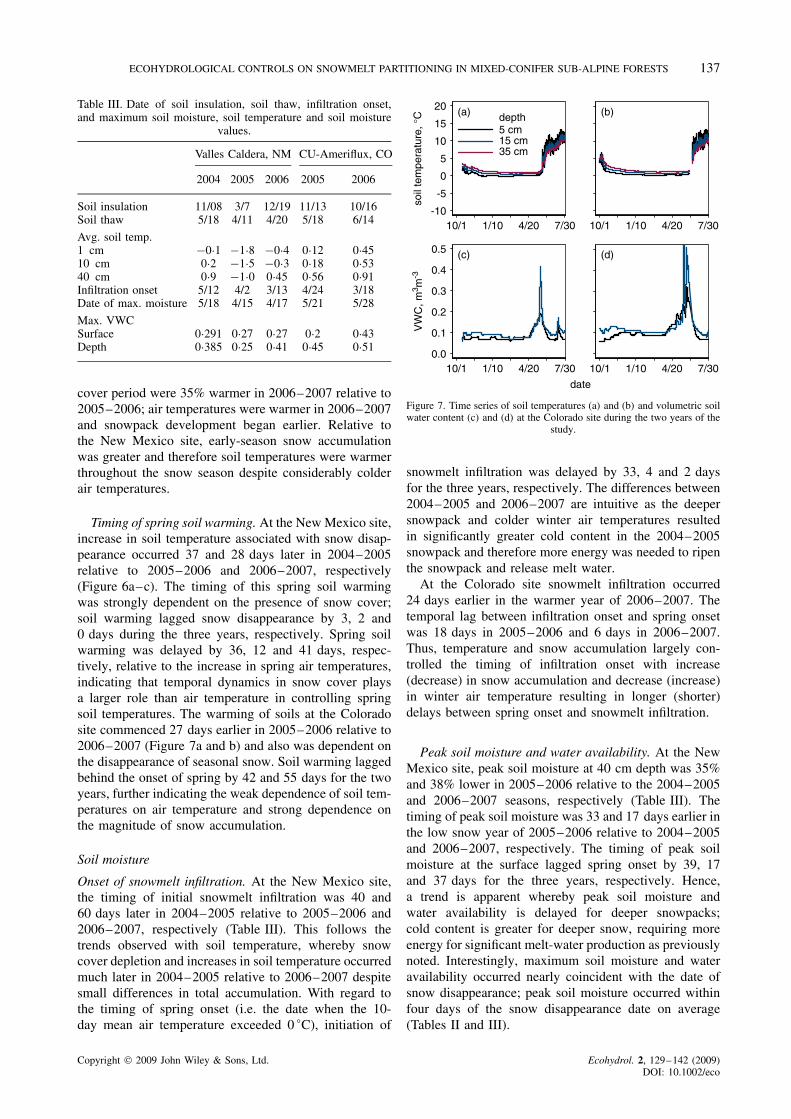
cover period were 35% warmer in 2006–2007 relative to2005–2006; air temperatures were warmer in 2006–2007and snowpack development began earlier. Relative tothe New Mexico site, early-season snow accumulationwas greater and therefore soil temperatures were warmerthroughout the snow season despite considerably colderair temperatures.
Timing of spring soil warming. At the New Mexico site,increase in soil temperature associated with snow disap-pearance occurred 37 and 28 days later in 2004–2005relative to 2005–2006 and 2006–2007, respectively(Figure 6a–c). The timing of this spring soil warmingwas strongly dependent on the presence of snow cover;soil warming lagged snow disappearance by 3, 2 and0 days during the three years, respectively. Spring soilwarming was delayed by 36, 12 and 41 days, respec-tively, relative to the increase in spring air temperatures,indicating that temporal dynamics in snow cover playsa larger role than air temperature in controlling springsoil temperatures. The warming of soils at the Coloradosite commenced 27 days earlier in 2005–2006 relative to2006–2007 (Figure 7a and b) and also was dependent onthe disappearance of seasonal snow. Soil warming laggedbehind the onset of spring by 42 and 55 days for the twoyears, further indicating the weak dependence of soil tem-peratures on air temperature and strong dependence onthe magnitude of snow accumulation.
Soil moisture
Onset of snowmelt infiltration. At the New Mexico site,the timing of initial snowmelt infiltration was 40 and60 days later in 2004–2005 relative to 2005–2006 and2006–2007, respectively (Table III). This follows thetrends observed with soil temperature, whereby snowcover depletion and increases in soil temperature occurredmuch later in 2004–2005 relative to 2006–2007 despitesmall differences in total accumulation. With regard tothe timing of spring onset (i.e. the date when the 10-day mean air temperature exceeded 0 °C), initiation of
-10
-5
0
5
10
15
20
soil
tem
pera
ture
, °C depth
5 cm15 cm35 cm
VW
C, m
3 m-3
(a) (b)
10/1
date
1/10 4/20 7/30 10/1 1/10 4/20 7/30
0.0
0.1
0.2
0.3
0.4
0.5 (c) (d)
10/1 1/10 4/20 7/30 10/1 1/10 4/20 7/30
Figure 7. Time series of soil temperatures (a) and (b) and volumetric soilwater content (c) and (d) at the Colorado site during the two years of the
study.
snowmelt infiltration was delayed by 33, 4 and 2 daysfor the three years, respectively. The differences between2004–2005 and 2006–2007 are intuitive as the deepersnowpack and colder winter air temperatures resultedin significantly greater cold content in the 2004–2005snowpack and therefore more energy was needed to ripenthe snowpack and release melt water.
At the Colorado site snowmelt infiltration occurred24 days earlier in the warmer year of 2006–2007. Thetemporal lag between infiltration onset and spring onsetwas 18 days in 2005–2006 and 6 days in 2006–2007.Thus, temperature and snow accumulation largely con-trolled the timing of infiltration onset with increase(decrease) in snow accumulation and decrease (increase)in winter air temperature resulting in longer (shorter)delays between spring onset and snowmelt infiltration.
Peak soil moisture and water availability. At the NewMexico site, peak soil moisture at 40 cm depth was 35%and 38% lower in 2005–2006 relative to the 2004–2005and 2006–2007 seasons, respectively (Table III). Thetiming of peak soil moisture was 33 and 17 days earlier inthe low snow year of 2005–2006 relative to 2004–2005and 2006–2007, respectively. The timing of peak soilmoisture at the surface lagged spring onset by 39, 17and 37 days for the three years, respectively. Hence,a trend is apparent whereby peak soil moisture andwater availability is delayed for deeper snowpacks;cold content is greater for deeper snow, requiring moreenergy for significant melt-water production as previouslynoted. Interestingly, maximum soil moisture and wateravailability occurred nearly coincident with the date ofsnow disappearance; peak soil moisture occurred withinfour days of the snow disappearance date on average(Tables II and III).
Copyright 2009 John Wiley & Sons, Ltd. Ecohydrol. 2, 129–142 (2009)DOI: 10.1002/eco

138 N. P. MOLOTCH ET AL.
At the Colorado site, peak soil moisture near the sur-face was 115% greater in 2006–2007 versus 2005–2006(Table III); at a depth of 15 cm, peak soil moisture was13% greater in 2006–2007. The overall water availabilitywas greater in 2006–2007 as indicated by the greater areabeneath the snowmelt pulse curve shown in Figure 7cand d. Relative to the spring onset, peak soil moisturewas delayed by 45 and 38 days in the two respectiveyears. Given that total snowfall was consistent for thesetwo years, the differences in the timing of peak soil mois-ture largely result from differences in winter and springair temperature and associated impacts to snowpack coldcontent and surface energy balance. As with the NewMexico site, peak soil moisture occurred nearly coin-cident with the date of snow disappearance (Table III).Although both sites exhibited considerable variability inboth the timing and magnitude of peak soil moisture, thegeneral patterns show that increase (decrease) in snowaccumulation and decrease (increase) in air temperatureresult in longer (shorter) lags between spring onset andpeak soil moisture.
Sublimation and Evapotranspiration
Variability in net radiation and sensible and latent heatfluxes at the New Mexico site are shown in Figure 8a–c.Net radiation averaged 58 W m�2 during the 2006–2007snow cover period. During the period prior to the onset ofsnowmelt (i.e. 28 November to 12 March) net radiationaveraged 18Ð2 W m�2 and after the initiation of snowmelt(i.e. 13 March) net radiation averaged 99Ð8 W m�2.Available energy was largely partitioned into sensibleheat fluxes with a median ratio of sensible heat fluxto net radiation of 0Ð67 relative to a latent heat flux tonet radiation ratio of 0Ð11. Mid-winter latent heat fluxeswere sensitive to the timing and magnitude of snowfalland subsequent sublimation (Figure 8c). Based on theseobservations, total snow sublimation averaged 0Ð66 mmd�1. Latent heat fluxes responded rapidly to soil wateravailability during the snowmelt period as illustratedby the average evapotranspiration during this periodof 2Ð1 mm d�1; note that this represents the combinedvapour flux associated with transpiration, evaporation ofliquid water at the snow–atmosphere interface and snowsublimation. Integrated for the entire 2006-07 season, thetotal water vapour flux to the atmosphere was 386 mm.As flux observations were only available for the singleyear at the New Mexico site, inter-annual comparisonsare focused on the Colorado site in the text below.
Average net radiation at the Colorado site duringthe 2005–2006 and 2006–2007 snow seasons was 91Ð9and 86 W m�2, respectively (Figure 9a and d). Priorto the initiation of snowmelt infiltration (i.e. the pre-snowmelt period) average net radiation was 9% greater in2006–2007. Conversely, after the initiation of snowmeltinfiltration average net radiation was 19% lower in2006–2007. This difference largely results from the per-sistence of storms and cloud cover in the spring of2006–2007 (Figure 3d and e) and the earlier onset of
-200
200
600
1000
-200
200
600
1000
0
200
400
600ne
t rad
iatio
n, W
M-2
sens
ible
hea
t flu
x, W
m-2
Late
nt H
eat F
lux,
W m
-2
10/1
date
1/10 4/20 7/30
10/1 1/10 4/20 7/30
10/1 1/10 4/20 7/30
Figure 8. Net radiation (a), sensible heat flux (b) and latent heat flux(c) at the New Mexico sites during the winter of 2006–2007. The black
line indicates the 10-day running mean.
snowmelt when solar elevation is relatively low. Despitethe relatively low available energy during the 2006–2007snowmelt period, latent heat fluxes were 18% greater than2005–2006 (Figure 9c and f) due to the earlier onsetof snowmelt and greater overall water availability asso-ciated with spring snowfall events (Figure 5a–d). As aresult, the proportion of available energy partitioned intosensible heat flux was lower in 2006–2007 (Figure 9band e); the median sensible heat flux to net radiationratio was 0Ð66 and 0Ð61 for 2005–2006 and 2006–2007,respectively.
Given the greater latent heat flux in 2006–2007, snowsublimation during the pre-snowmelt period was higherin 2006–2007 at 0Ð9 versus 0Ð78 mm d�1 for 2005–2006.After the onset of snowmelt infiltration water vapour fluxaveraged 1Ð84 mm d�1 in 2005–2006 versus 1Ð92 mmd�1 in 2006–2007. Integrated over the entire snowmeltinfiltration period, the total water loss to the atmospherewas 114Ð3 and 163 mm, respectively, for the two years.Integrated for the entire 2005–2006 and 2006–2007seasons, the total water vapour flux to the atmosphere
Copyright 2009 John Wiley & Sons, Ltd. Ecohydrol. 2, 129–142 (2009)DOI: 10.1002/eco

ECOHYDROLOGICAL CONTROLS ON SNOWMELT PARTITIONING IN MIXED-CONIFER SUB-ALPINE FORESTS 139
-200
200
600
1000
net r
adia
tion,
W m
-2
-200
200
600
1000
-200
200
600
1000
sens
ible
hea
t flu
x, W
m-2
-200
200
600
1000
0
200
400
600
late
nt h
eat f
lux,
W m
-2
0
200
400
600
(a) (c)(b)
(d) (e) (f)
date
10/1 7/304/201/10 10/1 7/304/201/10 10/1 7/304/201/10
Figure 9. Net radiation (a), sensible heat flux (b) and latent energy flux (c) at the Colorado sites during the winter of 2005–2006 (top row) and2006–2007 (bottom row). The black line indicates the 10-day running mean.
0
50
100
150
late
nt h
eat f
lux,
W m
-2
0
200
400
600
800
1000
PP
FD
, µm
ol m
2 s-1
0.0
0.5
1.0
1.5
2.0
VP
D, k
Pa
-4
-2
0
2
4
CO
2 flu
x, µ
mol
m2
s-1
0.0
0.1
0.2
0.3
0.4
0.5
VW
C, m
3 m
-3
0.0
0.1
0.2
0.3
0.4
0.5
VW
C, m
3 m
-3
(b)(a) (c)
(e)(d) (f)
1/10
date
3/1 4/20 6/10 7/30 8/20
1/10 3/1 4/20 6/10 7/30 8/20 1/10 3/1 4/20 6/10 7/30 8/20 1/10 3/1 4/20 6/10 7/30 8/20
1/10 3/1 4/20 6/10 7/30 8/20 1/10 3/1 4/20 6/10 7/30 8/20
2006-072005-06
Figure 10. Latent heat flux (a), photon flux density (b), vapour deficit (c), net ecosystem exchange (d), and volumetric water content for the surface(e) and at depth (f) for the 2005–2006 (green) and 2006–2007 (red) snowmelt infiltration period.
was 274 and 351 mm, respectively. This vapour fluxrepresents 41% and 56% of total snow-season precipita-tion for the two respective years with 2006–2007 havinga 28% greater water loss to the atmosphere relative to2005–2006. As precipitation amounts were nearly iden-tical in these two years, these differences in water vapourfluxes result largely from the warmer temperatures in2006–2007, the earlier onset of snowmelt, and associatedlonger snowmelt infiltration period.
The observed differences in water partitioning, withgreater water availability and longer duration snowmeltseason in 2006–2007, significantly affected net ecosys-tem carbon exchange (Figure 10a–f). A series of earlymelt season pulses in latent heat flux were evident in2006–2007 (Figure 10a). Variables controlling vegeta-tion water use such as photon flux density (Figure 10b)and vapour pressure deficit (Figure 10c) do not show
distinct differences in 2005–2006 and 2006–2007 butCO2 flux (Figure 10d) appeared to respond strongly togreater water availability at 15 cm depth (Figure 10e)and 5 cm depth (Figure 10f) in 2006–2007. Here itis evident that net ecosystem CO2 exchange shiftedfrom strong carbon uptake to weak carbon uptake dur-ing the same period that the soil moisture pulse inthe upper 15 cm of soil was decreasing. This suggeststhat drying soil after the snowmelt pulse caused greaterreductions in ecosystem photosynthesis versus ecosystemrespiration.
DISCUSSION
The strong correlation between temperatures at VacasLocas and University Camp SNOTEL sites (Figure 2)suggests that these two regions experience similar annual
Copyright 2009 John Wiley & Sons, Ltd. Ecohydrol. 2, 129–142 (2009)DOI: 10.1002/eco

140 N. P. MOLOTCH ET AL.
temperature regimes. The 3 °C difference between thesites is within the range of predicted warming for theregion (Intergovernmental Panel on Climate Change,2007). These strong correlations suggest that these twosites are ideal for comparing differences in the timingof snowmelt onset and associated vegetation response towater availability.
Snow accumulation and ablation
In boreal regions, inverse relationships between accu-mulation and ablation rates have been observed assnow interception reduces accumulation near trees whileenhanced thermal emission from the canopy increasessnowmelt rates near the canopy (Faria et al., 2000). How-ever, these relationships are dependent upon canopy den-sity and latitude, both of which dictate the effect ofvegetation on net radiation and rates of snowmelt (Sicartet al., 2004). The observations here indicate that thisinverse relationship may not exist at mid-latitudes as wefound that both snow accumulation and ablation rateswere greater in open areas. The greater accumulation ofsnow in under-canopy locations at the New Mexico site in2005–2006 suggests that snow accumulation (and wateravailability) under the canopy may be less sensitive tomid-winter melt or sublimation and therefore these areasmay be less sensitive to shifts in climate.
The role of location (canopy, edge, open) in controllingsnow ablation rates was consistent between years. Snowcover persistence was greater in under-canopy locationsrelative to open areas at the New Mexico site with theopposite true at the Colorado site. Although increasesin forest density are known to reduce snowmelt ratesat these latitudes (Sicart et al., 2004), it is interestingthat these two sites behave differently. It is possible thata combination of lower solar radiation associated withthe more northern latitude and a more uniform canopystructure at the Colorado site results in greater shading inopen areas relative to the open areas at the New Mexicosite. The inter-relationship of these two factors suggestthat as canopy gap size decreases and as latitude increasesoverall sub-canopy net radiation increases relative to openareas (Link et al., 2004).
Soil moisture, temperature and vegetation response
Soil moisture observations from both sites highlight twocritical transitions in the ecohydrology of these seasonallysnow-covered forests. First, the timing of snowmelt infil-tration onset and peak soil moisture was largely depen-dent on winter-season snow accumulation amounts andthe average winter air temperature—both of which con-trol the cold content of the snowpack. Second, maximumsoil moisture roughly coincided with snowpack disap-pearance. This suggests that soil moisture throughoutsnowmelt at both study sites was limited by snowmeltrate, not infiltration rate or field capacity. This is con-sistent with the coincidence of maximum soil moistureat surface and depth. Since snow cover detection andthe date of snow disappearance is routinely measured via
satellite remote sensing (Dozier and Warren, 1982; Hallet al., 1995; Rosenthal and Dozier, 1996; Salomonsonand Appel, 2004), future efforts to estimate the tim-ing of peak soil moisture via remote sensing may befruitful. Given that vegetation response to water availabil-ity was highly sensitive to maximum water availability(Figure 10a–f), these future efforts could also provideinformation on the timing of peak evapotranspiration.Such studies could build on previous efforts to show theimpact of earlier snowmelt on ecosystem photosynthesisduring the growing season, the overall terrestrial carboncycle (Sacks et al., 2007) and the impact of snowmelttiming on forest fire frequency (Westerling, 2006). In thisregard, studies conducted across a variety of biomes andacross grassland-forest ecotones (Vivoni et al., 2008) willbe needed to fully realize these ecohydrological feed-backs.
Similar to other studies, this work highlights the impor-tance of snow cover on soil temperature (Marsh andWoo, 1984; Brooks et al., 1996, 1997, 1999; Groffmanet al., 1999; Fassnacht and Soulis, 2002; Monson et al.,2006a,b). The coldest soils observed in our study wereat the warmer New Mexico site during the warmestwinter (2005–2006) and provide a striking example of‘colder soils in a warmer world’ predicted by Groff-man et al. (1999). The interactions between snowpackdevelopment, soil temperature and soil moisture is crit-ical for the balance between mineralization and immo-bilization of nutrients (Brooks et al., 1996, 1997, 1998),nutrient and dissolved organic matter export during melt(Brooks et al., 1999), and trace gas production (Brookset al., 1996, 1997; Monson et al., 2006a,b). Although theprimary focus of this article is on interactions betweenwater from seasonal snow packs and vegetation, feed-backs involving nutrient availability mediated by soilmicrobial activity before and during snowmelt may affectlonger term ecosystem response. The pulse of water intothe upper 15 cm of the soil that accompanies snow melthad largely diminished by early summer at the Coloradosite (Figure 10f). In fact, by July 15, midway through thesummer growth period, soil moisture had returned to pre-snowmelt values. Past studies at this site have shown thatmost of the fine root biomass is in the upper 15 cm of thesoil profile, presumably due to high nutrient availabilityin the layers with the highest amount of decomposingorganic matter, and most of the soil respired CO2 is pro-duced in these upper layers (Scott-Denton et al., 2003).The fact that net ecosystem CO2 exchange shifted fromstrong carbon uptake to weak carbon uptake during thesame period that the soil moisture pulse in the upper15 cm of soil was decreasing (Figure 10d and f) sug-gests that drying soil in the mid-summer causes greaterreductions in ecosystem photosynthesis than ecosystemrespiration. Furthermore, our observations suggest thatmuch of the snowmelt water disappears as a resourceto trees, at least in the shallower soil layers where thebulk of organic decomposition and mineralization occurs,prior to the regular occurrence of mid-summer droughtand the late-summer onset of convective monsoon rains
Copyright 2009 John Wiley & Sons, Ltd. Ecohydrol. 2, 129–142 (2009)DOI: 10.1002/eco

ECOHYDROLOGICAL CONTROLS ON SNOWMELT PARTITIONING IN MIXED-CONIFER SUB-ALPINE FORESTS 141
(Monson et al., 2002). The pulse of snowmelt at thesehigh-elevation sites may, therefore, be critical in deter-mining the degree to which trees are stressed duringthe mid-summer portion of the growing season beforelate-summer precipitation events arrive to relieve waterstress. The degree to which they are stressed will, ofcourse, be partially offset if they have access to deepermoisture reserves that are recharged during the snowmeltperiod and remain through the summer. The full root-ing profile for the trees at these sites is not known,and is thus a critical piece of information for under-standing the importance of snowmelt water on ecosystemfunction. Similarly, the dynamics of sub-surface flowin these systems are poorly known, motivating studiesaimed at estimating flow-paths in mountainous systems(Liu et al., 2004, 2008; Lyon et al., 2008; Molotch et al.,2008).
The relatively short duration study here adequatelycaptured intuitive differences between the sites andbetween study years. At both sites, significant variabilityin the duration of the snowmelt season and the timingof precipitation resulted in large differences in water andcarbon fluxes during the growing season. These observa-tions suggest that increase in vegetation density may pro-long the persistence of snow cover and buffer forest sen-sitivity to increase in regional air temperature, which actat cross-purpose to diminish snow cover persistence. Inthis regard, snowmelt partitioning may become increas-ingly dominated by vegetation water use as increases inforest density prolong the length of the snowmelt seasonand enhance forest water uptake. This increased partition-ing of snowmelt into atmospheric water loss may alsolead to reductions in groundwater recharge and surfacerunoff. For example, flux observations at both sites in2006–2007 showed that warmer atmospheric conditionsduring the winter and early spring periods contributed togreater partitioning into latent heat fluxes. Conversely, in2005–2006 we observed a late season rapid snowmeltpulse at the Colorado site with an overall lower amountof snowmelt partitioned into vapour flux to the atmo-sphere. Hence, years with warmer spring temperaturesmay result in more water partitioning into evaporativeloss and reduced spring and summer streamflow.
CONCLUSIONS
Although the average snow-season air temperature at theNew Mexico site was 3 °C warmer than the Colorado site,the time series of daily average air temperatures at thetwo sites were highly correlated (R2 D 0Ð89). Compar-isons of snow–vegetation interactions at the two studysites indicated that total snow accumulation was greaterin open areas versus under-canopy locations. Snow set-tling and ablation rates were lower in under-canopy loca-tions, effectively prolonging the snowmelt season in somecases. The deeper snowpack at the Colorado site resultedin warmer soil temperatures throughout the winter perioddespite the colder air temperatures relative to the New
Mexico site. Clear relationships between snow accu-mulation, temperature and soil moisture were observedin which increase (decrease) in snow accumulation anddecrease (increase) in air temperature act to increase(decrease) the lag between onset of spring and snowmeltinfiltration. Associated temporal dynamics in water avail-ability and partitioning of available energy into sensibleand latent heat fluxes were evident, with warmer temper-atures and earlier snowmelt onset associated with greaterwater vapour flux to the atmosphere. Implicit impacts tothe terrestrial carbon budget were evident as decreases insoil moisture after peak snowmelt caused greater reduc-tions in ecosystem photosynthesis relative to ecosystemrespiration.
ACKNOWLEDGEMENTS
This research was supported by the National Sci-ence Foundation, Science and Technology Center forthe Sustainability of semi-Arid Hydrology and Ripar-ian Areas (SAHRA). Additional support was providedby a research fellowship at the Cooperative Insti-tute for Research in Environmental Sciences, Uni-versity of Colorado, Boulder, by the National Sci-ence Foundation, Hydrologic Sciences Program (NSF-EAR0711600) and by the NOAA Office of Hydro-logic Development. The work at Niwot Ridge wasfunded in part by a grant from the Western Sectionof the National Institute for Climate Change Research(NICCR-MPC35TX-A2) administered by Northern Ari-zona University and funded by the US Departmentof Energy (BER Program). R. Bales, M. Williamsand J. Beauregard are acknowledged for technical sup-port. Field teams are acknowledged with thanks. BobParmenter and the Valles Caldera Trust are acknowl-edged for supporting research activities in the VallesCaldera.
REFERENCES
Baldocchi DD, Hicks BB, Meyers TP. 1988. Measuring Biosphere-atmosphere exchanges of biologically related gases with micromete-orological methods. Ecology 69: 1331–1340.
Bales R, Molotch N, Painter T, Dettinger M, Rice R, Dozier J. 2006.Mountain hydrology of the western United States. Water ResourcesResearch 42: W08432, DOI:08410Ð01029/02005WR004387.
Brooks PD, McKnight DM, Bencala KE. 1999. The relationship betweensoil heterotrophic activity, soil dissolved organic carbon (DOC)leachate, and catchment-scale DOC export in headwater catchments.Water Resources Research 35: 1895–1902.
Brooks PD, Schmidt SK, Williams MW. 1997. Winter production of CO2and N2O from Alpine tundra: Environmental controls and relationshipto inter-system C and N fluxes. Oecologia 110: 403–413.
Brooks PD, Vivoni ER. 2008. Mountain ecohydrology: quantifying therole of vegetation in the water balance of montane catchments.Ecohydrology 1: 187–192.
Brooks PD, Williams MW, Schmidt SK. 1996. Microbial activity underalpine snowpacks, Niwot Ridge, Colorado. Biogeochemistry 32:93–113.
Brooks PD, Williams MW, Schmidt SK. 1998. Inorganic nitrogen andmicrobial biomass dynamics before and during spring snowmelt.Biogeochemistry 43: 1–15.
Caine N. 1995. Temporal trends in the quality of streamwater in anAlpine environment: Green Lakes valley, Colorado Front Rand, USA.Geografiska Annaler Series A-Physical Geography 77A: 207–220.
Copyright 2009 John Wiley & Sons, Ltd. Ecohydrol. 2, 129–142 (2009)DOI: 10.1002/eco

142 N. P. MOLOTCH ET AL.
Carignan R, D’Arcy P, Lamontagne S. 2000. Comparative impacts of fireand forest harvesting on water quality in Boreal Shield lakes. CanadianJournal of Fisheries And Aquatic Sciences 57: 105–117.
Davis RE, Hardy JP, Ni W, Woodcock CE, Mckenzie JC, Jordan R,Li X. 1997. Variation of snow cover ablation in the boreal forest:A sensitivity study on the effects of conifer canopy. Journal ofGeophysical Research 102: 29389–29395.
Dozier J, Warren SG. 1982. Effect of viewing angle on the infraredbrightness temperature of snow. Water Resources Research 18:1424–1434.
Faria DA, Pomeroy JW, Essery RE. 2000. Effect of covariance betweenablation and snow water equivalent on depletion of snow-covered areain a forest. Hydrological Processes 14: 2683–2695.
Fassnacht SR, Soulis ED. 2002. Implications during transitional periodsof improvements to the snow processes in the land surfacescheme—Hydrological model WATCLASS. Atmosphere-Ocean 40:389–403.
Gelfan AN, Pomeroy JW, Kuchment LS. 2004. Modeling forest coverinfluences on snow accumulation, sublimation, and melt. Journal ofHydrometeorology 5: 785–803.
Golding DL, Swanson RH. 1978. Snow accumulation and melt in smallforest openings in alberta. Canadian Journal of Forest Research-RevueCanadienne De Recherche Forestiere 8: 380–388.
Golding DL, Swanson RH. 1986. Snow distribution patterns in clearingsand adjacent forest. Water Resources Research 22: 1931–1940.
Groffman PM, Hardy JP, Nolan S, Fitzhugh RD, Driscoll CT, Fahey TJ.1999. Snow depth, soil frost and nutrient loss in a northern hardwoodforest. Hydrological Processes 13: 2275–2286.
Hall DK, Riggs GA, Salomonson VV. 1995. Development of methodsfor mapping global snow cover using Moderate Resolution ImagingSpectroradiometer data. Remote Sensing of Environment 54: 127–140.
Hardy JP, Davis RE, Jordan R, Li X, Woodcock C, Ni W, McKenzie JC.1997. Snow ablation modeling at the stand scale in a borealjack pine forest. Journal of Geophysical Research-Atmospheres 102:29397–29405.
Hibbert AR. 1969. Water yield changes after converting a forestedcatchment to grass. Water Resources Research 5: 634–640.
IPCC. 2007. Climate Change 2007. The Physical Science Basis.Contribution of WGI to the Fourth Assessment Report of theIntergovernmental Panel on Climate Change. Solomon S, Qin D,Manning M, Chen Z, Marquis MC, Averyt KB, Tignor M, Miller HL(eds.). Cambridge University Press: Cambridge; 996.
Johnson M. 1994. Changes in Southwestern forests—stewardshipimplications. Journal of Forestry 92: 16–19.
Kattelmann RC, Berg NH, Rector J. 1983. The potential for increasingstreamflow from sierra-nevada watersheds. Water Resources Bulletin19: 395–402.
Link TE, Flerchinger GN, Unsworth M, Marks D. 2004. Simulation ofwater and energy fluxes in an old-growth seasonal temperate rain forestusing the simultaneous heat and water (SHAW) model. Journal ofHydrometeorology 5: 443–457.
Link TE, Marks D. 1999. Distributed simulation of snowcover mass-and energy-balance in the boreal forest. Hydrological Processes 13:2439–2452.
Liu FJ, Parmenter R, Brooks PD, Conklin MH, Bales RC. 2008.Seasonal and interannual variation of streamflow pathways andbiogeochemical implications in semi-arid, forested catchments in VallesCaldera, New Mexico. Ecohydrology 1: 239–252.
Liu FJ, Williams MW, Caine N. 2004. Source waters and flow pathsin an alpine catchment, Colorado Front Range, United States. WaterResources Research 40: W09401 DOI:10.1029/2004WR003076.
Lopez-Moreno JI, Latron J. 2008. Influence of canopy density on snowdistribution in a temperate mountain range. Hydrological Processes 22:117–126.
Lyon SW, Troch PA, Broxton PD, Molotch NP, Brooks PD. 2008.Monitoring the timing of snowmelt and the initiation of streamflowusing a distributed network of temperature/light sensors. Ecohydrology1: 215–224.
Marsh P, Woo MK. 1984. Wetting front advance and freezing ofmeltwater within a snow Cover.1. Observations In The CanadianArctic. Water Resources Research 20: 1853–1864.
McDowell NG, White S, Pockman WT. 2008. Transpiration and stomatalconductance across a steep climate gradient in the southern RockyMountains. Ecohydrology 1: 193–204.
Molotch N, Bales R. 2005. Scaling snow observations from the point tothe grid-element: implications for observaiton network design. WaterResources Research 41: W11421 DOI: 10Ð1029/2005WR004229.
Molotch NP, Blanken PD, Williams MW, Turnipseed AA, Monson RK,Margulis SA. 2007. Estimating sublimation of intercepted and sub-canopy snow using eddy covariance systems. Hydrological Processes21: 1567–1575.
Molotch NP, Meixner T, Williams MW. 2008. Estimating streamchemistry during the snowmelt pulse using a spatially distributed,coupled snowmelt and hydrochemical modeling approach. WaterResources Research 44: W11429 DOI: 10.1029/2007WR006587.
Monson RK, Burns SP, Williams MW, Delany AC, Weintraub M,Lipson DA. 2006a. The contribution of beneath-snow soil respiration tototal ecosystem respiration in a high-elevation, subalpine forest. GlobalBiogeochemical Cycles 20: GB3030 DOI: 10.1029/2005GB002684.
Monson RK, Lipson DL, Burns SP, Turnipseed AA, Delany AC,Williams MW, Schmidt SK. 2006b. Winter forest soil respirationcontrolled by climate and microbial community composition. Nature439: 711–714.
Monson RK, Turnipseed AA, Sparks JP, Harley PC, Scott-Denton LE,Sparks K, Huxman TE. 2002. Carbon sequestration in a high-elevation,subalpine forest. Global Change Biology 8: 459–478.
Mote PW, Hamlet AF, Clark MP, Lettenmaier DP. 2005. Decliningmountain snowpack in western north America. Bulletin of the AmericanMeteorological Society 86: 39–49.
Pataki DE, Oren R, Smith WK. 2000. Sap flux of co-occurring speciesin a western subalpine forest during seasonal soil drought. Ecology 81:2557–2566.
Price AG, Dunne T. 1976. Energy-balance computations of snowmelt ina Subarctic Area. Water Resources Research 12: 686–694.
Rosenthal W, Dozier J. 1996. Automated mapping of montane snowcover at subpixel resolution from the Landsat Thematic Mapper. WaterResources Research 32: 115–130.
Sacks WJ, Schimel DS, Monson RK. 2007. Coupling between carboncycling and climate in a high-elevation, subalpine forest: a model-datafusion analysis. Oecologia 151: 54–68.
Salomonson VV, Appel I. 2004. Estimating fractional snow cover fromMODIS using the normalized difference snow index. Remote Sensingof Environment 89: 351–360.
Schotanus P, Nieuwstadt FTM, Debruin HAR. 1983. Temperature-measurement with a sonic anemometer and its application to heat andmoisture fluxes. Boundary-Layer Meteorology 26: 81–93.
Scott-Denton LE, Sparks KL, Monson RK. 2003. Spatial and temporalcontrols of soil respiration rate in a high-elevation, subalpine forest.Soil Biology & Biochemistry 35: 525–534.
Sicart JE, Pomeroy JW, Essery RE, Hardy J, Link T, Marks D. 2004. Asensitivity study of daytime net radiation during snowmelt to forestcanopy and atmospheric conditions. Journal of Hydrometeorology 5:774–784.
Stednick JD. 1996. Monitoring the effects of timber harvest on annualwater yield. Journal of Hydrology 176: 79–95.
Stewart IT, Cayan DR, Dettinger MD. 2004. Changes in snowmelt runofftiming in western North America under a ‘business as usual’ climatechange scenario. Climatic Change 62: 217–232.
Turnipseed AA, Blanken PD, Anderson DE, Monson RK. 2002. Energybudget above a high-elevation subalpine forest in complex topography.Agricultural and Forest Meteorology 110: 177–201.
Vivoni ER, Rinehart AJ, Mendez-Barroso LA, Aragon CA, BishtG, Cardenas MB, Engle E, Forman BA, Frisbee MD, Gutierrez-Jurado HA, Hong SH, Mahmood TH, Tai K, Wyckoff RL. 2008.Vegetation controls on soil moisture distribution in the Valles Caldera,New Mexico, during the North American monsoon. Ecohydrology 1:225–238.
Webb EK, Pearman GI, Leuning R. 1980. Correction of flux measure-ments for density effects due to heat and water-vapor transfer. Quar-terly Journal of the Royal Meteorological Society 106: 85–100.
Westerling AL, Hidalgo HG, Cayan DR, Swetnam TW. 2006. Warmingand Earlier Spring Increases Western U.S. Forest Wildfire Activity.Science 313: 940–943.
Wigmosta MS, Vail LW, Lettenmaier DP. 1994. A distributed hydrology-vegetation model for complex terrain. Water Resources Research 30:1665–1679.
Woo MK, Giesbrecht MA. 2000. Simulation of snowmelt in a subarcticspruce woodland: Scale considerations. Nordic Hydrology 31:301–316.
Zehe E, Bloschl G. 2004. Predictability of hydrologic response at theplot and catchment scales: Role of initial conditions. Water ResourcesResearch 40: W10202 DOI: 10.1029/2003WR002869.
Copyright 2009 John Wiley & Sons, Ltd. Ecohydrol. 2, 129–142 (2009)DOI: 10.1002/eco