education policy - institute for fiscal studies - ifs · · 2010-04-26is substantially faster...
TRANSCRIPT


1
Education policy
Haroon Chowdry, Alastair Muriel and Luke Sibieta1
Summary
Education spending has risen by an average of 3.9% per year in real terms under Labour. This
is substantially faster than under the Conservatives between 1979 and 1997 (1.5% per year),
but only slightly faster than the long-run historical trend before Labour came to power (3.7%
per year). Schools, the under-fives and further education institutions have seen the most
generous funding increases under Labour, with spending on higher education growing much
more slowly.
In 2006, the UK had the eighth largest level of education spending as a share of national
income amongst 26 industrial countries. This follows a period between 1995 and 2006 when
the UK saw the fourth largest increase in spending as a share of income amongst this group.
Only the United States, Denmark and Mexico increased spending as a share of national
income by more. UK education spending as a share of national income now exceeds its mid
1970s peak and is at a higher level than at any point since (at least) the mid 1950s.
Within the education budget, the UK is a comparatively ‘big spender’ on early years education
and services. In 2006 the UK had the 2nd highest level of spending per pupil in the pre-
primary sector amongst the 26 OECD countries for which comparable data are available.
England’s early years spending includes free part-time nursery care for three and four year
olds, and the Sure Start programme, providing health and education information to parents
with children under five. The Conservatives have pledged to support the provision of free
nursery care for pre-school children, while the Liberal Democrats have expressed a long-term
ambition to increase the hours of provision funded by the government, and extend the age
range at which it is available. They have not, however, stated when they would seek to
implement this extension.
Labour have committed to protect non-investment funding for Sure Start Children’s Centres in
real terms until 2012–13. The Conservatives have pledged to retain the Sure Start programme,
but plan to refocus it primarily on deprived families, and to change its method of delivery (by
involving more outside organisations).
National school results in England have improved under Labour across all age groups.
However, these improvements have not been as fast as the government hoped, with
numerous national targets being set and subsequently missed. On average, English school
results at ages 9-10 and 13-14 appear to be well above the Western European average for
Mathematics and Science (using TIMSS data), but England’s 15 year olds score around the
OECD average for both reading and Mathematics (using PISA data).
1 This series of Election Briefing Notes has been funded by the Nuffield Foundation, grant OPD/36607. The Nuffield
Foundation is an endowed charitable trust that aims to improve social well-being in the widest sense. It funds research and innovation in education and social policy and also works to build capacity in education, science and social science research. More information is available at http://www.nuffieldfoundation.org/. Any views expressed are those of the authors and not necessarily those of the Foundation. The authors are grateful to Robert Chote, Carl Emmerson and Alissa Goodman for helpful discussions. Any errors and omissions are the responsibility of the authors.
IFS Election Briefing Note 2010
2
All three main parties would introduce a pupil premium into the school funding system in
England. The Liberal Democrats have been quite clear about their proposal for a £2.5 billion
pupil premium largely targeted at pupils poor enough to be eligible for free school meals,
which would be on top of all existing funding. Labour has proposed a ‘local pupil premium’,
which may simply involve a re-badging of existing deprivation funding. It is unclear what the
Conservatives’ proposals for a pupil premium would mean in practice, and it is thus impossible
to quantify its likely impact on individual schools’ funding or overall levels of public spending.
Labour has proposed an expansion of the academy programme, whilst the Liberal Democrats
would replace them with ‘Sponsor-Managed Academies’ and return them to local authority
control. The Conservatives would ‘break down barriers to entry so that any good education
provider can set up a new Academy school’, emulating the Swedish ‘free schools’ system
(which allows charities, businesses and parent co-operatives to open new schools) and charter
schools across a number of US states. However, it is unclear whether such a liberalisation and
increase in school competition would significantly improve pupil achievement.
Under Labour, higher education in the UK has undergone significant and sometimes
controversial reform, accompanied by increases in participation and small increases in
achievement at university. However, despite these reforms, the UK still ranks roughly in the
middle among OECD countries for participation in higher education. Furthermore, recent
tighter funding settlements combined with limits on additional places may impede the
Government’s progress towards its target of a 50% participation rate by 2010.
In this election campaign, the opposition parties have considerably more to say on higher
education than Labour does. The Liberal Democrats have proposed to abolish tuition fees for
both full-time and part-time students over a six-year period, with an eventual cost of £1.8
billion. Meanwhile, the Conservatives have proposed to fund 10,000 additional student places
in 2010–11 by offering graduates a discount if they repay their student loan earlier. While this
policy is likely to bring some cash forward, it has some economically undesirable features.
1. Introduction
In his speech to the Labour Party conference in October 1996, Tony Blair famously stated that his
three main priorities for government would be ’education, education, education’. A commitment to
increasing education spending as a share of national income over the course of the parliament was
then included in the Labour Party’s general election manifestos in 1997, 2001 and 2005.
In this general election briefing note we examine trends in education spending under Labour as
well as plans going forwards (Section 2). We then discuss policy and key trends under Labour to
date and policy proposals from the three main UK political parties in each of the following areas of
education policy: early years (Section 3); schools (Section 4); higher education (Section 5). For the
most part we focus on education policy in England only, though we do discuss trends in UK
education spending in Section 2.
2. Education spending
2.1 Education spending over time
As Table 2.1 shows, across Labour’s three terms of office education spending has risen by an annual
average of 3.9% per year, after taking into account the effects of economy-wide inflation
(henceforth referred to as in real terms). This is higher than the average growth in national income

Education policy
3
over this period, so education spending now represents a larger share of the UK’s total output
(growing from 4.8% of national income in 1996–97 to reach 6.1% of national income in 2010–11).
Table 2.1. Increases in UK education spending
Average annual real increase
Labour Labour years: April 1997 to March 2011 3.9 Labour 1: April 1997 to March 2001 2.9 Labour 2: April 2001 to March 2005 6.2 Labour 3: April 2005 to March 2011 3.0 Conservative April 1979 to March 1997 1.5 Long-run trend April 1956 to March 1997 3.7 Sources: HM Treasury, Public Expenditure Statistical Analyses 2010 and previous PESAs; ONS Blue Book. Forecasts from
HM Treasury, Budget 2010.
Figure 2.1. UK education spending as a share of national income (1955–56 to
2010–11)
Sources: HM Treasury, Public Expenditure Statistical Analyses 2010 and previous PESAs; ONS Blue Book. Forecasts from
HM Treasury, Budget 2010.
In the first three years of Labour’s first term education spending fell to 4.4% of national income, as
Labour kept to the previous Conservative government’s tight plans for public spending, and as a
result of a departmental under-spend repeated across a number of other government departments.
After 1999–00 education spending rose as a share of national income, to reach roughly the same
level by the end of Labour’s first term as at the start of it, with average real-terms growth of 2.9%
per year. Whether the manifesto pledge – to increase education spending as a proportion of
national income over the first parliamentary term – was met or not depends on whether one
classes 2000–01 or 2001–02 as the end of Labour’s first term. However, it is worth noting the
average level of education spending as a share of national income during Labour’s first term is
lower than that seen under previous parliaments going back to the 1960s. Strong growth in
education spending during Labour’s second term (6.0% per year in real terms) meant that the
manifesto commitment to increase education spending as a share of national income was met by a
very large margin over this period. Education spending also grew during Labour’s third term,
though at the reduced rate 3.0% per year on average in real terms, similar level to under Labour’s
first term. It is estimated to have reached 6.3% of national income in 2009–10. Plans going forward
2%
3%
4%
5%
6%
7%
19
55
-56
19
57
-58
19
59
-60
19
61
-62
19
63
-64
19
65
-66
19
67
-68
19
69
-70
19
71
-72
19
73
-74
19
75
-76
19
77
-78
19
79
-80
19
81
-82
19
83
-84
19
85
-86
19
87
-88
19
89
-90
19
91
-92
19
93
-94
19
95
-96
19
97
-98
19
99
-00
20
01
-02
20
03
-04
20
05
-06
20
07
-08
20
09
-10
Per
cen
tage
of
nat
ion
al in
com
e

IFS Election Briefing Note 2010
4
indicate that this will fall slightly to 6.1% of national income in 2010–11, as some capital spending
for 2010–11 had been brought forward to 2009–10 as part of the fiscal stimulus package. However,
the manifesto commitment also seems highly likely to be met over Labour’s third term. Education
spending as a share of national income now exceeds its mid 1970s peak and is at a higher level than
at any point since (at least) the mid 1950s.
Looking back at historical trends, education spending rose from just under 3% of national income
in the mid-1950s to reach a high-point of 6.0% of national income by 1975–76. It then fell to around
5% of national income by the mid-1990s. Average real-terms growth under Labour (3.9% per year)
has been higher than that seen under the Conservatives between 1979 and 1997 (1.5% per year),
but only slightly in excess of the long-run historical trend before Labour came to power (3.7% per
year). The period from April 1999 to March 2010 saw the highest average growth (5.0% per year)
over any 11 year period since April 1965 to March 1976.
However, it should be noted that growth in education spending as a share of national income up to
the mid-1970s was being spread across an increasing school-age population, and thus the growth in
education spending over this period overstates the growth in resources per head. Furthermore, the
decline from the mid-1970s onwards coincides with a decline in the school-age population so that
even though resources were declining as a share of national income and not growing as rapidly as
in other periods, they were being spread across a declining number of pupils.2
Table 2.2. Increases in various components of public spending
Average annual real increase April 1998 to March 2009
Education (England only) 5.2 Schools, of which: 5.6 Capital spending 12.9 Current spending, of which: 5.0 Under 5s 6.1 Primary Schools 3.9 Secondary Schools 5.0 Further education 7.7 Higher education 2.3 Other education spending 5.6 Source: Department for Children Schools and Families, Departmental Report 2009.
In order to illustrate how priorities for education spending have changed under Labour, Table 2.2
shows the average growth in the components of education spending between 1997–98 and 2008–
09 (for England only). Schools spending is broken down between schools capital spending (e.g. new
buildings and ICT) and day-to-day or current expenditure for the under 5s, primary schools and
secondary schools. Spending on further education, higher education and other education spending
combines both day-to-day and capital spending.3
The components that have seen the fastest growth over this period under Labour have been schools
capital spending (12.9% per year) and further education spending (7.7% per year). Other education
spending (5.6% per year), day-to-day under 5s spending (6.1% per year) and day-to-day secondary
2 See Figure 4.7 and surrounding text of R. Crawford, C. Emmerson and G. Tetlow (2009), A survey of Public Spending in
the UK, Briefing Note No. 43, London: Institute for Fiscal Studies (http://www.ifs.org.uk/publications/1791). 3 Note that the average growth in education spending for England over this time period (5.2% per year) is higher than the
growth in UK education spending shown in Table 2.1 (3.9% per year). This difference arises partly due to the fact that the former relates to England only and the latter to the UK, but also because the figure in Table 2.2 only covers the period 1997–98 to 2008–09 instead of 1996–97 to 2010–11.

Education policy
5
school spending (5.0% per year) have each grown at a similar rate to total education spending in
England over this period (5.2% per year). Average growth in day-to-day primary school spending
has been slightly lower at 3.9% per year. However, higher education spending experienced the
lowest growth over this period (2.3% per year).
Figure 2.2. Spending per student across different education sectors, 1997–98 to
2010–11)
Notes: School spending per pupil relates to revenue spending per pupil and excludes capital spending. Further education
spending per student relates to funding per full-time equivalent student; the break in the series reflects a change in the
month in which the number of students was measured. Higher education spending per pupil is measured as the level of the
teaching grant per DIUS-supported full-time equivalent student: it excludes research funding, grants and the cost of
providing loans. Prior to 2002–03, figures for higher education spending per student are imputed based on the growth in
higher education spending per student, including both public spending and private contributions through tuition fees.
Sources: Schools spending per pupil taken from Department for Children Schools and Families, Departmental Report 2009.
Further education (all years) and Higher Education (2002–03 onwards) spending per student is taken from Department for
Innovation, Universities and Skills, Departmental Report 2008. Higher education spending per student (before 2002–03) is
based on authors’ calculations using Department for Children, Schools and Families, Departmental Report 2007.
Given that pupil and student numbers have not been constant over this period, it is also important
to examine trends in measures of spending per head across different education sectors. Figure 2.2
shows the level of day-to-day public spending per head in schools, further education and higher
education over time (in 2010 prices). It makes clear the extent to which growth in schools spending
per pupil has outstripped growth in other areas of education (with higher education public
spending per pupil barely growing at all in real terms). The Figure shows that in 1997–98 spending
per student in the further and higher education sectors both stood at a little over £4,000 compared
with schools spending per pupil of about £3,000. Schools spending per pupil then grew strongly
across Labour’s period in office at about 5% per year in real-terms. Plans for the current financial
year, if delivered, suggest that it will reach just under £5,700 per pupil in 2010–11.
In Budget 2006, the then Chancellor Gordon Brown promised to increase state school spending per
pupil to the level seen in the independent sector in 2005–06. However, there was no timescale
attached and it is important to remember that achieving this pledge would not imply closing the
contemporaneous gap between the state and independent sectors. For the purposes of the pledge
Mr Brown used the average day fee in day schools as a measure of spending per head across
independent schools (which in 2005–06 was £8,500 in today’s prices). In 2010–11, state school
spending per head is due to reach £6,670 in 2010–11 prices (including capital spending, the
0
1,000
2,000
3,000
4,000
5,000
6,000
7,000
Spen
din
g p
er s
tud
ent
(20
10
pri
ces)
Further Education Further Education (old student numbers)Higher Education Higher Education (imputed)Schools

IFS Election Briefing Note 2010
6
measure of spending per head in the state sector Mr Brown chose to use). Therefore, the
government is still quite a way off from meeting this pledge and, given that the government’s
current spending plans going forward imply a real-terms freeze in schools spending per head (see
section 2.3), this pledge is unlikely to be met in the near future either. However, such a settlement
would still be more generous than that for most public services, at least under current plans.4
Further education spending per student has also grown during Labour’s period in office, at about
2.7% per year on average in real-terms, and current plans suggest it will represent just under
£5,900 per student in 2010–11. Further education spending per student is thus still likely to be
greater than schools spending per pupil in 2010–11, but, due to higher growth in schools spending
per pupil, the difference is much lower than it was in 1997–98.5
In contrast, average growth in higher education spending per student has been much lower at 0.7%
per year in real-terms. This means that by 2010–11, higher education spending per pupil will be
over £1,000 lower than school spending per pupil, having been over £1,000 greater than it in 1997–
98. Public spending priorities thus seem to have shifted from higher education towards schools
spending across Labour’s period in office. However, it should be noted that resources per student in
higher education would be higher if we included private contributions via tuition fees, and growth
would be higher after the increase in tuition fees in 2006 from £1,175 to £3,000 (see Section 5 for
more details). However, there is currently no easily available series detailing the combined level of
public and private contributions to higher education spending after the 2006 reforms.
2.2 International comparisons
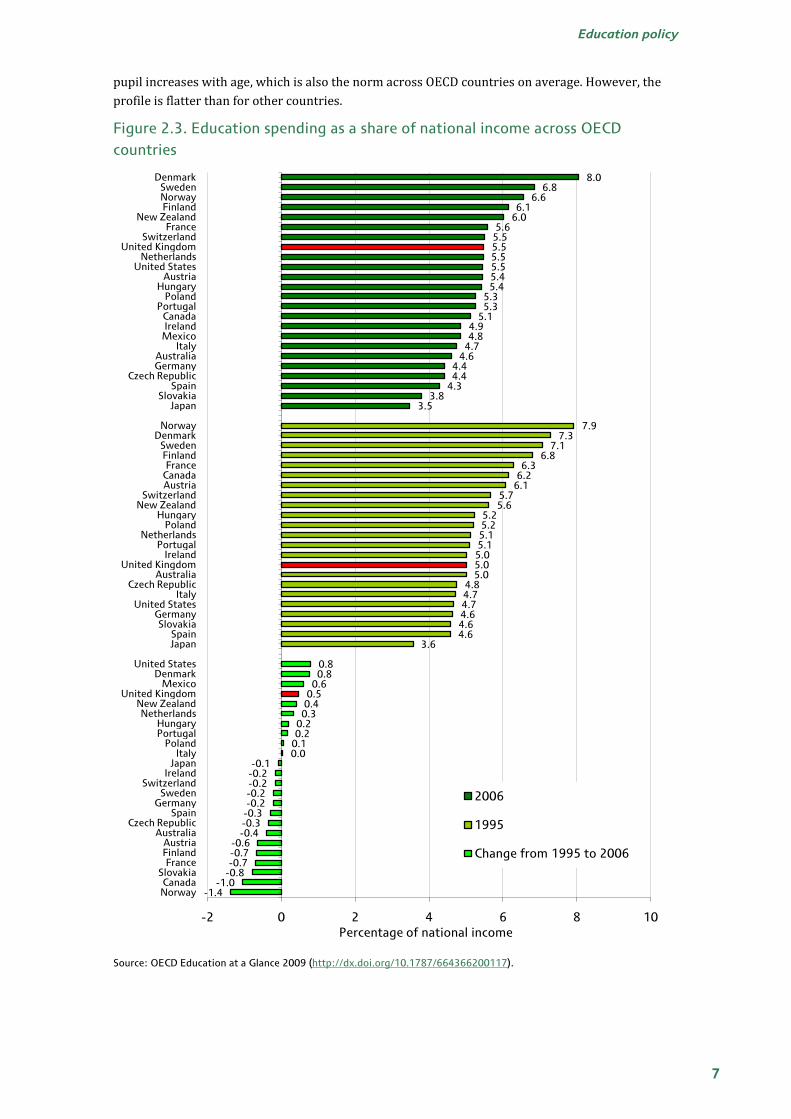
How does the UK’s education spending compare with that of other developed countries? Figure 2.3
shows public spending on education as a share of national income in 1995 and 2006 across a set of
OECD countries for which comparable information is available.6 It shows that in 1995, two years
before Labour came to power, the UK had the 15th highest level of education spending as a share of
national income amongst these 24 countries. However, between 1995 and 2006 the UK saw the 4th
largest increase in education spending as a share of national income, so that by 2006 it has the 8th
highest level amongst this set of countries.
Figure 2.4 shows total spending per student across different stages of education in 2006 in the UK,
the (weighted) average in the OECD and the level in the G7 countries (excluding Canada for which
comparative data are not available). These spending figures include both public and private
expenditure, and are measured using US$ converted using purchasing power parities. It shows that
the UK spends more per pupil in the pre-primary sector than the OECD average. In fact, in 2006 the
UK had the 2nd highest level of spending per pupil in the pre-primary sector amongst the 26
countries for which comparable data are available (only the USA had a higher level of spending per
pupil). The UK also spends above the OECD average in both primary and secondary schools. In
2006, the UK had a higher level of spending per pupil in primary and secondary schools than
Germany, Italy and Japan, though a lower than the USA at both stages. Spending per student is
below the OECD average in the tertiary sector (which includes universities). However, it was higher
than in France, Germany and Italy. Spending per student was higher in Japan and much higher in
the USA, largely reflecting the higher levels of private contributions to tertiary education spending
in both of these countries. In broad terms, these data show that the UK’s profile of spending per
4 See the forthcoming election briefing note examining the fiscal plans of the three main political parties.
5 It should be noted that schools spending per pupil represents an average across 3-19 year olds. Since more tends to be
allocated to older pupils, it is likely that schools spending per sixth form student is higher than further education spending per student in the same age-range.
6 The closest available data-point to 1997 when Labour came to power and the latest available data-point, respectively
Education policy
7
pupil increases with age, which is also the norm across OECD countries on average. However, the
profile is flatter than for other countries.
Figure 2.3. Education spending as a share of national income across OECD
countries
Source: OECD Education at a Glance 2009 (http://dx.doi.org/10.1787/664366200117).
8.06.8
6.66.1
6.05.6
5.55.55.55.55.45.4
5.35.3
5.14.94.8
4.74.6
4.44.4
4.33.8
3.5
7.97.3
7.16.8
6.36.2
6.15.75.6
5.25.25.15.15.05.05.0
4.84.74.74.64.64.6
3.6
0.80.8
0.60.50.40.3
0.20.2
0.10.0
-0.1-0.2-0.2-0.2-0.2
-0.3-0.3-0.4
-0.6-0.7-0.7
-0.8-1.0
-1.4
-2 0 2 4 6 8 10
DenmarkSwedenNorwayFinland
New ZealandFrance
SwitzerlandUnited Kingdom
NetherlandsUnited States
AustriaHungary
PolandPortugal
CanadaIreland
MexicoItaly
AustraliaGermany
Czech RepublicSpain
SlovakiaJapan
NorwayDenmark
SwedenFinlandFrance
CanadaAustria
SwitzerlandNew Zealand
HungaryPoland
NetherlandsPortugal
IrelandUnited Kingdom
AustraliaCzech Republic
ItalyUnited States
GermanySlovakia
SpainJapan
United StatesDenmark
MexicoUnited Kingdom
New ZealandNetherlands
HungaryPortugal
PolandItaly
JapanIreland
SwitzerlandSweden
GermanySpain
Czech RepublicAustralia
AustriaFinlandFrance
SlovakiaCanadaNorway
Percentage of national income
2006
1995
Change from 1995 to 2006

IFS Election Briefing Note 2010
8
Figure 2.4. Profile of spending per student across stages of education in 2006, G7
countries (excluding Canada) and OECD average
Source: OECD Education at a Glance (2009), (http://dx.doi.org/10.1787/664234230084).
2.3 Plans for the future
The current government has only announced detailed spending plans by department up to 2010–
11. However, it has produced forecasts for overall public spending up to 2014–15 that imply a real-
terms freeze between 2010–11 and 2014–15 (as part of the planned fiscal tightening). Given the
expected real-terms growth in debt interest payments, social security spending and other annually
managed expenditure; this would require deep real-terms cuts to some areas of departmental
spending over this period. In the 2009 Pre-Budget Report, the Government announced that certain
aspects of education spending would be protected from these cuts in 2011–12 and 2012–13 (it has
not said whether such protection would continue into 2013–14 and 2014–15):
Non-investment spending on schools would receive a 0.7% a year real increase, which given
expected growth in pupil numbers over this period implies a real-terms freeze in non-
investment spending per pupil.
Non-investment spending on 16-19 participation would received a 0.9% a year real increase.
Non-investment spending on Sure Start would be maintained in real terms.
The Conservatives and Liberal Democrats have not announced plans for total levels of education
spending over this period, nor growth in specific areas of education. However, they have
announced plans for specific policy changes that imply higher levels of public spending in some
areas, and cuts to others. For instance, the Conservatives have announced plans for greater
numbers of Sure Start health visitors, whilst the Liberal Democrats have announced plans for a £2.5
billion pupil premium partly funded by cuts to other areas of education spending (as well as cuts to
tax credits). They have both announced plans to reduce the ‘Train to Gain’ budget for employer-
provided training in order to fund a greater number of apprenticeships. In what follows we go
through three specific areas of education (early years, schools and higher education), discussing
both key policy changes and trends under Labour, and policy proposals from the three main
parties. We do not discuss further education policies in detail.
0
5,000
10,000
15,000
20,000
25,000
United Kingdom
OECD average
France Germany Italy Japan United States
Spen
din
g p
er s
tud
ent
($ a
t P
PP
) Pre-Primary Primary Secondary Tertiary
Education policy
9
3. Early years
Since Labour came to power in 1997 they have introduced a number of early years education and
childcare initiatives in England, with a particular emphasis on offering free nursery places. In 1998,
Labour launched a National Childcare Strategy7, which included a commitment to offer all 4-year-
olds free part-time nursery places, with the intention to extend this opportunity to 3-year-olds over
time. From September 1998, all 4-year-olds were offered free nursery places for 12½ hours a week
(to be taken in up to five 2½-hour sessions) and for 38 weeks of the year. This was extended to
include all 3-year-olds in April 2004.
As part of its 10-year national childcare strategy launched in 20048, Labour proposed to extend this
to 15 hours a week for all 3- and 4-year-olds from 2010 onwards – this is now due to take place
from September 2010 (having been available to the most disadvantaged 25% of children from
September 2009). Labour’s commitment to this policy was confirmed in its 2010 general election
manifesto. Furthermore, Labour’s manifesto included a commitment to expand the number of free
nursery places for disadvantaged 2-year-olds, with a long-term goal of expanding this to all 2-year-
olds (though no timescale is attached).
Another major element of the government’s early years strategy has been the Sure Start initiative,
which the government began piloting in deprived areas in 1999 and subsequently rolled out
nationally. The initiative involved the creation of a range of local programmes offering advice on
education, health and child development to families with children under 5. These programmes
were later brought together into Sure Start Children’s Centres, designed to be ‘hubs’ where families
could receive such information, plus employment advice and links to local Jobcentres, in one place.
As part of the 10-year national childcare strategy, Labour pledged to expand the Sure Start
Children’s programme such that there would be 3,500 Sure Start Children’s Centres across the
county by 2010. Budget 2010 confirmed that this commitment had been met. Labour has
committed to protect non-investment funding for Sure Start Children’s Centre in real-terms up to
2012–13.
The Conservatives have stated in their 2010 general election manifesto that they support the
provision of free nursery care for pre-school children. However, they further state (p42) that they
would ‘review the way the childcare industry is regulated and funded to ensure that no providers,
including childminders, are put at a disadvantage’. Currently, in order to receive government
funding to offer free places, accredited childminders must become part of an approved network of
early education providers. Amongst other factors, this means that they must be regularly inspected
by OFSTED. Given that the government provides a significant subsidy to early years providers, it
seems sensible that such providers should continue to be regulated. It is unclear whether the
Conservative proposal for a review of such arrangements would lead to significant changes to
current regulation.
The Conservative’s manifesto says that they would keep the Sure Start programme. However, it
states (p43) that they would ‘take Sure Start back to its original purpose of early intervention,
increase its focus on the neediest families, and better involve organisations with a track record in
supporting families’. It is unclear whether this would involve an overall reduction in real-terms
funding or a shift of existing resources towards deprived families (perhaps through means-testing).
The Conservatives also say that they would pay Sure Start providers by results, though again it is
unclear what this would mean in practice.
7 http://www.dcsf.gov.uk/everychildmatters/earlyyears/surestart/aboutsurestart/challenge/1998greenpaper/
8 http://www.hm-treasury.gov.uk/pre_budget_report/prebud_pbr04/assoc_docs/prebud_pbr04_adchildcare.cfm

IFS Election Briefing Note 2010
10
The Conservatives also propose a further 4,200 Sure Start Health Visitors, over and above
government plans going forward. The Conservatives have previously stated this policy would cost
about £200 million and that funding would come from ‘diverting spending from the ‘outreach
workers’ budget within the existing Sure Start budget and from the Department of Health budget,
where we have pledged real increases’.9 However, it should be noted that real-increases in health
spending increase the level of cuts required in public spending outside the Conservatives protected
areas of spending on the NHS and overseas development assistance.
The Liberal Democrats have indicated in their manifesto that they would seek to protect existing
childcare support arrangements. They also state a long-term ambition to increase the level of free
nursery provision to 20 hours per week and extend this to all children from the age of 18 months
up until they start school. However, the Liberal Democrats’ manifesto does not state when they
would aim to achieve this, instead saying that it would only be provided when ‘the nation’s finances
can support [it]’.
4. Schools
With nearly 7.5 million pupils attending England’s primary and secondary schools10, and the
schools budget comprising 60% of the total education budget, policies towards the school system
always form an important electoral issue. As we saw in Section 2, spending on England’s schools
increased substantially over the past thirteen years, with both capital investment (rebuilding and
refurbishing schools) and current or day-to-day spending (much of it spent on teachers’ salaries)
growing rapidly in real terms. Section 4.1 therefore asks ‘what did we get for our money?’ Did
results in England’s schools improve substantially as their resources were increased? In Section 4.2
we move on to consider the plans for the schooling system outlined in the three main parties’
election manifestos.
4.1 Schools results under Labour
Much of our information about the performance of English schools comes from standardised tests,
known as Standard Attainment Tests (SATs), which were first introduced in 1991.11 These tests are
given to children at the ages of 7, 11, and 14 (known as Key Stages 1, 2 and 3, respectively) with
GCSE (or equivalent) exams at age 16, also known as Key Stage 4. From the time of their
introduction to the present day, the results of these tests – especially those in English and
Mathematics – have been the subject of numerous national targets. Results in all Key Stage tests
have improved since their introduction, but they have not improved as fast as successive
governments had hoped for, with many of the national targets being missed.
Beginning with the tests given to 11-year-olds (Key Stage 2), Figure 4.1 shows that results
improved rapidly over the course of the late 1990s, but from around 2000 onwards the rate of
improvement slowed substantially. The government’s first national target for Key Stage 2 results,
set in 1997, was for 80% of 11-year-olds to reach the expected level (Level 4) in English and 75% in
Mathematics by 2002. This target was missed – the English target by five percentage points, the
Mathematics target by two percentage points.
9http://www.conservatives.com/News/News_stories/2010/01/~/media/Files/Downloadable%20Files/Labours%20Dodgy%
20Dossier.ashx
10 DCSF: Education and Training Statistics for the United Kingdom: 2009, Table 1.02
www.dcsf.gov.uk/rsgateway/DB/VOL/v000891/index.shtml
11 SATs for 7 year olds were introduced in 1991, while those for 11 year olds began in 1995.

Education policy
11
National literacy and numeracy strategies were announced by the government in 1998, with the
introduction of a compulsory, tightly-structured daily ‘literacy hour’ in primary school classes,
rolled out nationally in September 1998, and a ‘numeracy hour’ added in September 1999.
Academic research12 suggests that these literacy and numeracy strategies were effective in raising
Key Stage 2 results, and that the more years of exposure children had to these strategies, the more
their results improved (though as we have already seen, this improvement was not sufficient for
the government to hits its 2002 targets for Mathematics and English results at Key Stage 2).
After the 2002 Key Stage 2 target was missed, a new one was set for 2006: for 85% of 11-year-olds
to reach the expected level in English and Mathematics. In the face of growing complaints from
schools, however, in 2003 the target date was pushed back two years, to 2008.13 Nonetheless, as
Figure 4.1 shows, the target was still missed: 81% of 11 year olds reached the expected level in
English, and 79% in Mathematics, in 2008.
Undaunted, the government has a new target for Key Stage 2 results in 2011: for 78% of 11-year-
olds to reach the expected level in both English and Mathematics combined. This combined
standard was reached by 72% of pupils in 2009 – 70% of boys and 75% of girls.
Figure 4.1 Key Stage 2 results in England, pupils attaining Level 4 or above, 1995
to 2009
Notes: Key Stage 2 Science tests have been scrapped as of 2010. Key Stage 2 tests are voluntary for private schools, but
the results of private school pupils are included in the data where the tests were taken.
Source: DCSF, National Curriculum Assessments at Key Stage 2 in England 2008/09 (Revised).
Turning to Key Stage 3 results, the standardised tests for 14-year-olds, we have also seen
significant improvement under Labour, as shown in Figure 4.2 – at least until these tests were
abolished in 2009 (see below). However, once again this improvement has not been as fast as the
government would have liked, with national targets set and then subsequently missed. In July 2001
the government announced a target of 75% of 14-year-olds reaching the expected level (Level 5) in
English and Mathematics, and 70% reaching that level in Science, by 2004. A longer term target was
also set, for 85% of pupils to reach this level in English and Mathematics by 2007, and 80% in
science. As Figure 4.2 shows, every one of these targets was missed.
12 See S. Machin and S. McNally (2008) ‘The literacy hour’, Journal of Public Economics, 92(5-6), pp. 1441-1462, and S.
Machin and S. McNally (2010), The Three Rs: How Effective are the National Strategies?, www.econ.upf.edu/docs/seminars/mcnally.ppt
13 See e.g. http://news.bbc.co.uk/1/hi/education/3043101.stm
30
40
50
60
70
80
90
100
1995 1996 1997 1998 1999 2000 2001 2002 2003 2004 2005 2006 2007 2008 2009
Per
cen
tage
of
pu
pils
Science
English
Mathematics

IFS Election Briefing Note 2010
12
Figure 4.2 Key Stage 3 results in England, pupils attaining Level 5 or above, 1995
to 2008
* 2008 figures are not perfectly comparable with earlier years due to the removal of ‘borderlining’. For more details see
www.dcsf.gov.uk/rsgateway/DB/SFR/s000847/index.shtml
Notes: Compulsory Key Stage 3 tests were abolished in 2009.
Source: DCSF, National Curriculum Assessments at Key Stage 3 in England, 2008 (Updated)
Quite apart from trends in national results, the very existence of Key Stage tests at 11 and 14
remains a controversial topic in education policy. On the one hand, nationally standardised tests
have clear benefits for policymakers – allowing them to monitor standards both nationally and
within individual schools, and set targets for the future. Such monitoring creates pressure on
schools to improve results, but critics of the system argue that this pressure has pathological, rather
than beneficial, consequences. ‘Teaching to the test’ leads to an impoverished curriculum, they
argue, and pupils themselves are placed under excessive pressure.14 Teachers’ unions have argued
for an evaluation system based on teachers’ own assessments of pupils’ progress, rather than
nationally standardised tests.15
In response to this criticism (and in the wake of high-profile problems with the marking of Key
Stage tests in 2008) the Government has abolished standardised Key Stage 3 tests entirely,
replacing them with a teacher-assessed system. The Key Stage 2 test in Science has also been
abolished, though tests in English and Mathematics remain in place. However, union leaders have
argued that these concessions do not go far enough, with two large unions (the National Union of
Teachers and National Association of Head Teachers) voting to boycott the English and
Mathematics Key Stage 2 tests this year.
Turning to results for 16 year olds (GCSE and equivalent exams), we again see a steady
improvement in results, as shown in Figure 4.3. Here too, the government introduced national
targets, the first of them in 1998: for at least half of all 16-year-olds to achieve five ‘good’ GCSE
passes (grades A* to C), by 2002. This target was hit (over 51% of pupils attained five A* to C passes
in summer 2002). However, in response to complaints from employers that having five ‘good’
GCSEs did not guarantee that an individual was literate or numerate16, the government
14 See e.g. www.telegraph.co.uk/education/educationnews/7559726/Sats-exams-promote-teaching-to-the-test.html, or
http://news.bbc.co.uk/1/hi/education/7311863.stm
15 See e.g. www.guardian.co.uk/education/2010/apr/06/nut-conference-sats-tests-blower
16 See e.g. http://news.bbc.co.uk/1/hi/education/4365212.stm
30
40
50
60
70
80
90
100
1995 1996 1997 1998 1999 2000 2001 2002 2003 2004 2005 2006 2007 2008*
Per
cen
tage
of
pu
pils
Science
English
Mathematics

Education policy
13
subsequently changed its headline GCSE measure to one requiring the five GCSEs to include English
and Mathematics (also shown in Figure 4.3).
The government has also set several targets for the minimum percentage of pupils within
individual schools who gain 5 good GCSEs. Most recently, Mr Brown declared in 2007 that he would
‘eradicate failure’ by requiring that at least 30% of pupils in all secondary schools gain at least 5
good GCSEs, including English and Mathematics.17 In 2008, the year after this target was set, 638
schools fell below this threshold. By September 2009, that number had fallen to 270. These
improvements – and improvements in GCSE results in general – remain controversial, however,
with critics attributing some or all of the improvement to ‘dumbing down’ of exams rather than a
true improvement in learning.18
Figure 4.3 GCSE (and equivalent) results in England, 1995–96 to 2008–09
+ Reporting of this series was discontinued after 2007–08, replaced with a non-comparable measure (counting the
percentage of pupils at end of Key Stage 4, instead of the percentage of 15 year olds). We have imputed a 2008–09 figure
assuming a constant trend in the difference between the old and new measures.
Notes: Unlike Key Stage 2 tests, GCSE tests are taken by private school pupils, so they are included in the Figure.
Source: DCSF, GCSE and Equivalent Results in England, 2008/09 (Revised),
Another way to assess the attainment of the nation’s children is to turn to international tests
administered to students in many different countries. Two commonly used sources are the Trends
in International Mathematics and Science Study (TIMSS), based on tests given to children aged 9-10
and 13-14 in a number of countries around the world every four years, and the Program for
International Student Assessment (PISA), administered to 15-year-olds every three years. These
tests have somewhat different aims, with the TIMMS tests broadly aiming to assess ‘what pupils
know’, while the PISA tests aim to assess students’ ability to apply their knowledge in real world
situations.
17 See www.number10.gov.uk/Page13675
18 See e.g. news.bbc.co.uk/1/hi/education/883484.stm. It is worth noting that the regulator of exams and qualifications in
England, Ofqual, published several reports on GCSE standards in 2009, investigating whether standards had slipped. These reports concluded that standards in English and Mathematics had generally been maintained in recent years, but that standards in science GCSEs had not been maintained and were a cause for concern. See Ofqual’s ‘Review of standards in GCSE English literature from 2000 to 2007’, ‘GCSE mathematics monitoring report, 2008’ and ‘GCSE science monitoring report, 2007-2008’, all published on March 27
th 2009.
30
35
40
45
50
55
60
65
70
75
Per
cen
tage
of
15
yea
r o
lds
5+ A*-C grades
5+ A*-C grades inc. English & Mathematics GCSEs
IFS Election Briefing Note 2010
14
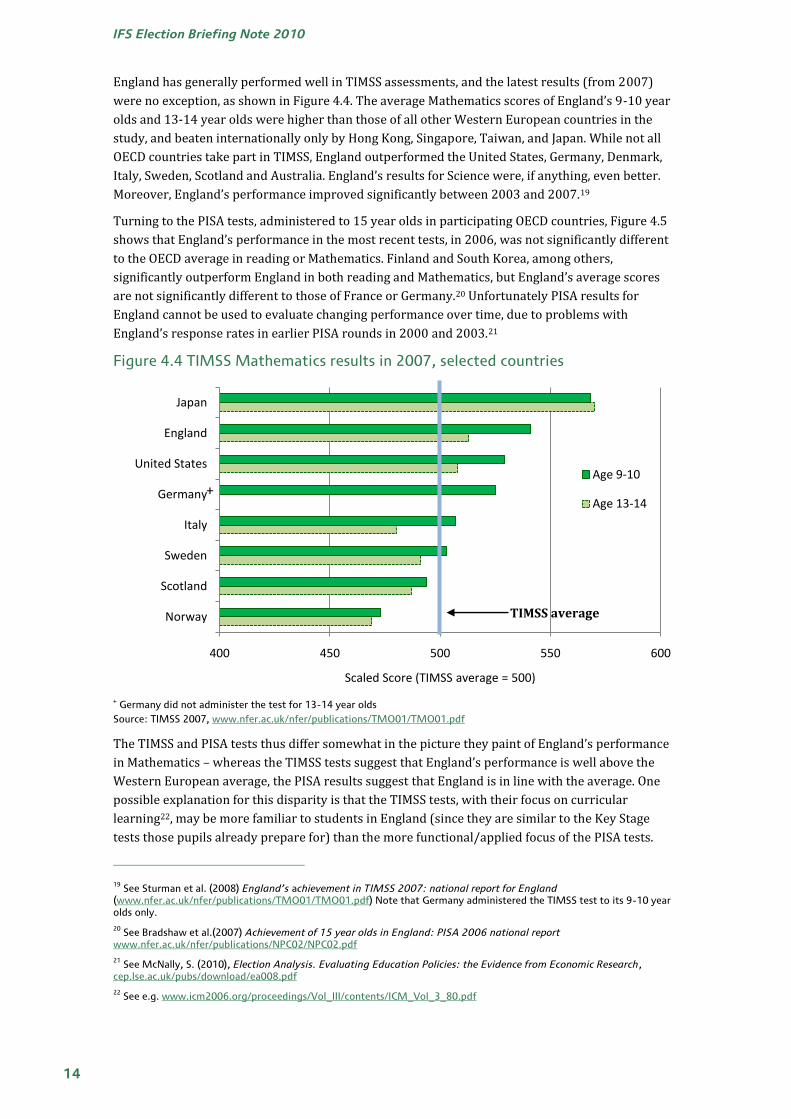
England has generally performed well in TIMSS assessments, and the latest results (from 2007)
were no exception, as shown in Figure 4.4. The average Mathematics scores of England’s 9-10 year
olds and 13-14 year olds were higher than those of all other Western European countries in the
study, and beaten internationally only by Hong Kong, Singapore, Taiwan, and Japan. While not all
OECD countries take part in TIMSS, England outperformed the United States, Germany, Denmark,
Italy, Sweden, Scotland and Australia. England’s results for Science were, if anything, even better.
Moreover, England’s performance improved significantly between 2003 and 2007.19
Turning to the PISA tests, administered to 15 year olds in participating OECD countries, Figure 4.5
shows that England’s performance in the most recent tests, in 2006, was not significantly different
to the OECD average in reading or Mathematics. Finland and South Korea, among others,
significantly outperform England in both reading and Mathematics, but England’s average scores
are not significantly different to those of France or Germany.20 Unfortunately PISA results for
England cannot be used to evaluate changing performance over time, due to problems with
England’s response rates in earlier PISA rounds in 2000 and 2003.21
Figure 4.4 TIMSS Mathematics results in 2007, selected countries
+ Germany did not administer the test for 13-14 year olds
Source: TIMSS 2007, www.nfer.ac.uk/nfer/publications/TMO01/TMO01.pdf
The TIMSS and PISA tests thus differ somewhat in the picture they paint of England’s performance
in Mathematics – whereas the TIMSS tests suggest that England’s performance is well above the
Western European average, the PISA results suggest that England is in line with the average. One
possible explanation for this disparity is that the TIMSS tests, with their focus on curricular
learning22, may be more familiar to students in England (since they are similar to the Key Stage
tests those pupils already prepare for) than the more functional/applied focus of the PISA tests.
19 See Sturman et al. (2008) England’s achievement in TIMSS 2007: national report for England
(www.nfer.ac.uk/nfer/publications/TMO01/TMO01.pdf) Note that Germany administered the TIMSS test to its 9-10 year olds only.
20 See Bradshaw et al.(2007) Achievement of 15 year olds in England: PISA 2006 national report
www.nfer.ac.uk/nfer/publications/NPC02/NPC02.pdf
21 See McNally, S. (2010), Election Analysis. Evaluating Education Policies: the Evidence from Economic Research,
cep.lse.ac.uk/pubs/download/ea008.pdf
22 See e.g. www.icm2006.org/proceedings/Vol_III/contents/ICM_Vol_3_80.pdf
400 450 500 550 600
Norway
Scotland
Sweden
Italy
Germany
United States
England
Japan
Scaled Score (TIMSS average = 500)
Age 9-10
Age 13-14+
TIMSS average
Education policy
15
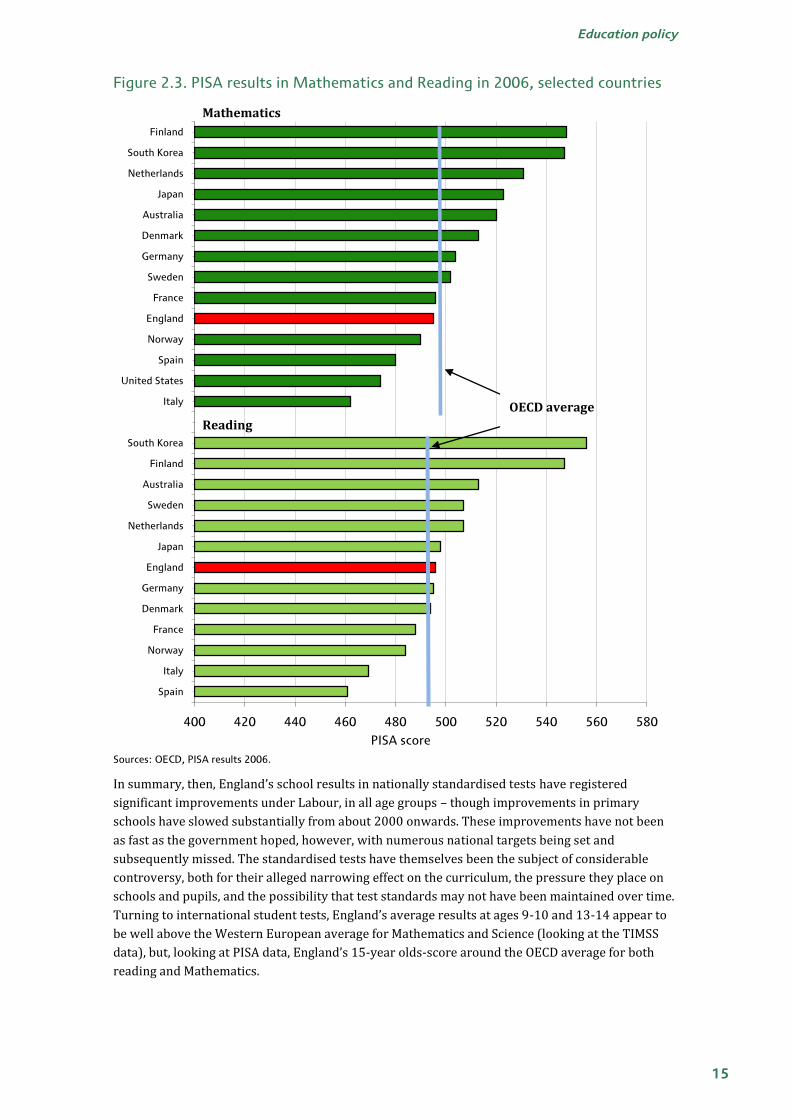
Figure 2.3. PISA results in Mathematics and Reading in 2006, selected countries
Sources: OECD, PISA results 2006.
In summary, then, England’s school results in nationally standardised tests have registered
significant improvements under Labour, in all age groups – though improvements in primary
schools have slowed substantially from about 2000 onwards. These improvements have not been
as fast as the government hoped, however, with numerous national targets being set and
subsequently missed. The standardised tests have themselves been the subject of considerable
controversy, both for their alleged narrowing effect on the curriculum, the pressure they place on
schools and pupils, and the possibility that test standards may not have been maintained over time.
Turning to international student tests, England’s average results at ages 9-10 and 13-14 appear to
be well above the Western European average for Mathematics and Science (looking at the TIMSS
data), but, looking at PISA data, England’s 15-year olds-score around the OECD average for both
reading and Mathematics.
400 420 440 460 480 500 520 540 560 580
Finland
South Korea
Netherlands
Japan
Australia
Denmark
Germany
Sweden
France
England
Norway
Spain
United States
Italy
South Korea
Finland
Australia
Sweden
Netherlands
Japan
England
Germany
Denmark
France
Norway
Italy
Spain
PISA score
Mathematics
Reading
OECD average
IFS Election Briefing Note 2010
16
For the sake of brevity, this discussion has focused on average results. However, distributional
issues – such as the gap in results between students from privileged and deprived backgrounds –
are clearly of great importance. Despite England’s acceptable performance in international tests, it
has often been argued that the ‘long tail’ of low achievers, often from disadvantaged backgrounds, is
the key problem in our education system.23 Compared with other Northern European countries, in
particular, we appear to have a particularly large fraction of very low achievers.24
Achievement gaps between pupils from richer and poorer backgrounds can be seen from a very
early age and continue to widen as children get older. By the time children take their GCSEs at age
16, for example, less than a quarter of pupils from deprived backgrounds gain 5 ‘good’ GCSEs
including English and Mathematics, compared with more than half of non-deprived pupils.25 While
this gap is large, and will make a significant contribution to later-life income and earnings
inequalities, we have shown in previous work that the gap has been narrowing in recent years.26
Whether these results represent ‘value for money,’ given the large increases in school spending
under Labour, will doubtless be a matter of fierce debate in the election campaign. For now,
however, we turn to the parties’ proposals for the future of the English schools system.
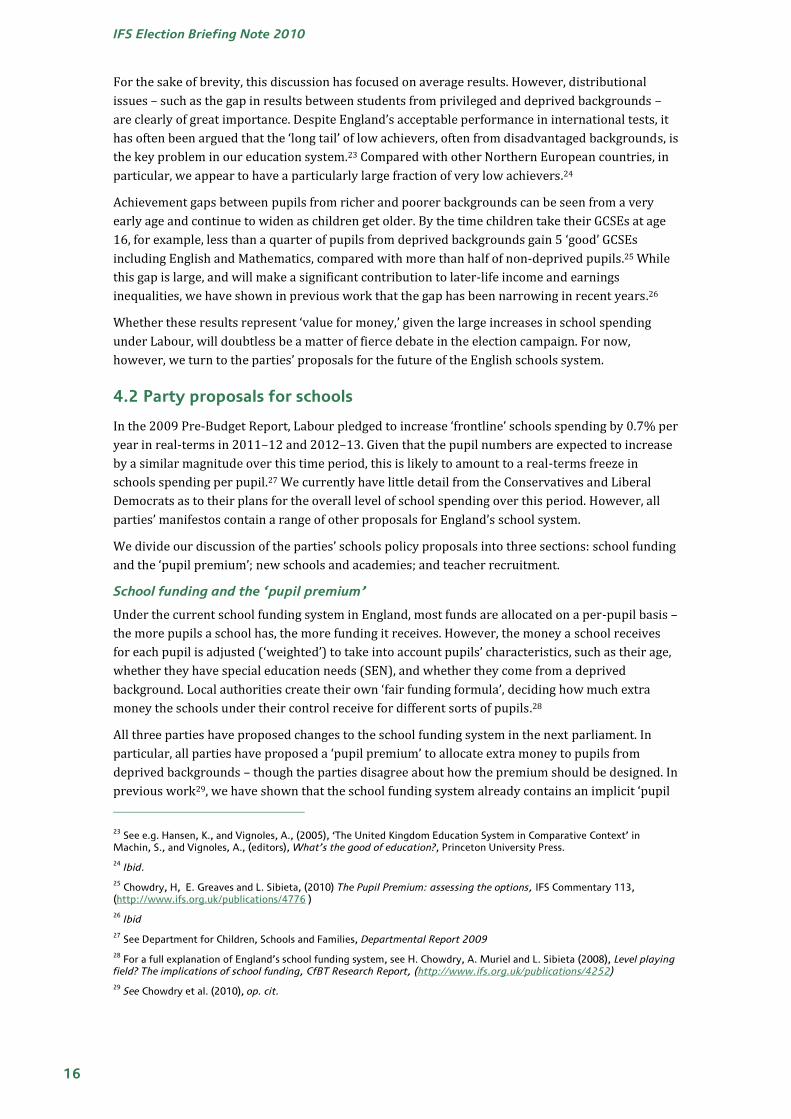
4.2 Party proposals for schools
In the 2009 Pre-Budget Report, Labour pledged to increase ‘frontline’ schools spending by 0.7% per
year in real-terms in 2011–12 and 2012–13. Given that the pupil numbers are expected to increase
by a similar magnitude over this time period, this is likely to amount to a real-terms freeze in
schools spending per pupil.27 We currently have little detail from the Conservatives and Liberal
Democrats as to their plans for the overall level of school spending over this period. However, all
parties’ manifestos contain a range of other proposals for England’s school system.
We divide our discussion of the parties’ schools policy proposals into three sections: school funding
and the ‘pupil premium’; new schools and academies; and teacher recruitment.
School funding and the ‘pupil premium’
Under the current school funding system in England, most funds are allocated on a per-pupil basis –
the more pupils a school has, the more funding it receives. However, the money a school receives
for each pupil is adjusted (‘weighted’) to take into account pupils’ characteristics, such as their age,
whether they have special education needs (SEN), and whether they come from a deprived
background. Local authorities create their own ‘fair funding formula’, deciding how much extra
money the schools under their control receive for different sorts of pupils.28
All three parties have proposed changes to the school funding system in the next parliament. In
particular, all parties have proposed a ‘pupil premium’ to allocate extra money to pupils from
deprived backgrounds – though the parties disagree about how the premium should be designed. In
previous work29, we have shown that the school funding system already contains an implicit ‘pupil
23 See e.g. Hansen, K., and Vignoles, A., (2005), ‘The United Kingdom Education System in Comparative Context’ in
Machin, S., and Vignoles, A., (editors), What’s the good of education?, Princeton University Press.
24 Ibid.
25 Chowdry, H, E. Greaves and L. Sibieta, (2010) The Pupil Premium: assessing the options, IFS Commentary 113,
(http://www.ifs.org.uk/publications/4776 )
26 Ibid
27 See Department for Children, Schools and Families, Departmental Report 2009
28 For a full explanation of England’s school funding system, see H. Chowdry, A. Muriel and L. Sibieta (2008), Level playing
field? The implications of school funding, CfBT Research Report, (http://www.ifs.org.uk/publications/4252)
29 See Chowdry et al. (2010), op. cit.

Education policy
17
premium,’ allocating substantially more funds (on average) to pupils from deprived backgrounds.
Children eligible for free school meals (one measure of deprivation) attract about double the
amount of funding to their school, on average, that children who are not eligible attract. However,
this average masks significant variation across different local authorities.
As discussed in our recent analysis of options for a pupil premium, such a system could take many
different forms. It could simply be an additional amount of money added on top of the existing
funding system, it could replace some (but not all) of the funding streams in the existing system, or
it could be created as part of an overhaul of the entire school funding system in England.
The Liberal Democrats’ proposal clearly falls into the first of these categories. Their manifesto
pledges a £2.5 billion fund in the schools budget, to be allocated to schools according to their
proportion of pupils from deprived backgrounds (mainly children eligible for free school meals).
This proposal has the advantage of simplicity – the rest of the school funding system remains
unchanged. However, this premium will therefore not change the fact that different Local
Authorities allocate different amounts of money to deprived pupils – existing disparities in
deprivation funding will persist. Moreover, this proposal requires an injection of new money into
the schools budget, at a time of fiscal retrenchment in other areas.
In our recent report we attempted to model the impact on schools budgets of the key elements of
the Liberal Democrats’ proposals for a pupil premium. We presented a number of policy options,
showing large proportionate increases for schools with the most deprived pupils. For instance, the
£2.5 billion pupil premium proposed by the Liberal Democrats could allow for an extra £2,400 for
each pupil eligible for free school meals, and a 20% boost to the funding of the most deprived
schools.
The Conservatives’ proposal is much less clearly defined. Their manifesto states that ‘we will
introduce a pupil premium – extra funding for children from disadvantaged backgrounds,’ but
provides no further details. In an earlier statement, the Conservatives have announced an ambition
to move to a single national funding formula for all schools in England30, with a pupil premium on
top. Such a system could potentially eliminate the disparities in deprivation funding between
different local authorities. However, any move to a single national funding formula would take
some time to design and implement, and we have shown in earlier work that such a system would
create significant winners and losers among schools.31
It remains unclear, therefore, whether the Conservatives would introduce a pupil premium only as
part of a complete centralisation of England’s school funding system, or whether they would
introduce some form of ‘stopgap’ pupil premium, pending a broader review of the school funding
system. Such a ‘stopgap’ premium could come either on top of the existing funding system, like the
Liberal Democrats’ proposal (therefore requiring additional funding from the Treasury), or in place
of parts of the existing budget, by redirecting funds from other uses within the schools budget.
In response to our report analysing the options for a pupil premium, a Conservative spokesman
was quoted as saying that ‘We have always said that any pupil premium will be extra money and
will not be taken from other schools. This is still our position and we'll release more details in due
course. It will not involve taking money from other schools.’32 Unfortunately, no further details
were provided in their manifesto. In the absence of such details, there is little more we can say
30 Speech by Michael Gove, 6 November 2009,
http://www.conservatives.com/News/Speeches/2009/11/Michael_Gove_A_comprehensive_programme_for_state_education.aspx.
31 Chowdry et al. (2010), op. cit.
32 http://news.bbc.co.uk/1/hi/education/8544221.stm

IFS Election Briefing Note 2010
18
about the Conservatives plans for a pupil premium. It is impossible to quantify its likely impact on
individual schools’ funding or overall levels of public spending.
Labour recently announced that it, too, would introduce a pupil premium, though they prefer a
‘local pupil premium’ to the centralised alternatives proposed by the Liberal Democrats and
Conservatives. Again, however, we have little detail on exactly how this would work. Labour’s
manifesto simply states (ch3, p4) that ‘we will introduce a local pupil premium to guarantee that
extra funding to take account of deprivation follows the pupil.’ When the Secretary of State for
Children, Schools and Families, Ed Balls, announced this policy, he stated that existing funds for
deprivation would be used (so no new funds would be required), and that the levels of support for
deprived pupils would be determined locally.33 Since this already happens under the existing school
funding system, it is unclear what changes (if any) Labour is proposing to the status quo. The local
pupil premium could be nothing more than a new label for the existing system of deprivation
funding.
In summary, then, while all three parties are committed to the introduction of a pupil premium,
Labour and the Conservatives have so far been vague about exactly what their proposals would
entail. Only the Liberal Democrats have given a clear indication of how their pupil premium would
be designed, and how much it would cost.
New Schools and Academies
England’s school system has historically seen little entry of new providers.34 While the
government’s 2005 Schools White Paper set out a vision of a schools system ‘that is dynamic, with
weak schools replaced quickly by new ones,’35 in reality the government has largely focused on
investing in existing schools, rather than encouraging the entry of new providers. The government
has, however, introduced a new type of school to England’s secondary system: the Academy. These
schools look set to be an area of significant debate during the election campaign.
Academy schools have several features which set them apart from most other state-funded
secondary schools: they are ‘independent’, in the sense that they are outside of local authority
control, they have greater freedom to set their own pay and work conditions (outside of the
national collective bargaining agreements which bind most state schools), and they have been given
greater flexibility regarding teaching methods and curriculum. There are currently 203 Academy
schools open in England, with a further 100 due to open by September 2010.36
For the moment, however, most Academies have opened in place of previously ‘failed’ schools.
Persistently underachieving schools are closed, their buildings are refurbished, and the school is
then reopened as an Academy, under new management (but retaining most of the original staff),
and removed from local authority control (Academies are answerable directly to the Department
for Children, Schools and Families).
The parties’ manifestos show clear differences in their plans for the Academy model. Labour plans
to open a further 200 Academies (their manifesto states, ch3 p4, that these are ‘in the pipeline’),
following the existing model of supply, with most Academies replacing existing underperforming
schools. In their manifesto the Liberal Democrats, in contrast, propose (p37) to abolish the
Academy model entirely and replace it with ‘[their] own model of “Sponsor-Managed Schools”’.
33 See e.g. ‘Balls supports “pupil premiums”’, news.bbc.co.uk/1/hi/education/8568527.stm
34 Chowdry et al., (2008), op. cit.
35 Department for Education and Skills (2005), op. cit., p. 20
36 www.standards.dfes.gov.uk/academies/projects/?version=1

Education policy
19
Sponsor-Managed Schools, unlike Academies, will be commissioned and maintained by local
authorities, removing a major difference between Academies and other secondary schools.
Perhaps the most radical Academies proposals, however, come from the Conservative manifesto.
Taken at face value, the Conservative proposals suggest that Academy status is their preferred
model for virtually all schools in the English system. Their manifesto states (p53) that ‘all existing
schools will have the chance to achieve academy status, with “outstanding” schools pre-approved’.
Moreover, the manifesto promises to ‘extend the Academy programme to primary schools’, an area
which has hitherto not seen Academy schools set up. In addition, the Conservatives propose (p53)
to ‘break down barriers to entry so that any good education provider can set up a new Academy
school’, emulating the Swedish ‘free schools’ system (which allows charities, businesses and parent
co-operatives to open new schools). Unlike the Swedish system, however, new Academies will not
be permitted to make a profit.
The impact that this reform would have on school quality, and educational outcomes, is difficult to
predict. The extent to which increased school competition improves educational outcomes remains
a hotly debated topic in the academic literature.37 Böhlmark and Lindahl38 studied the impact of
Sweden’s reforms on pupils’ attainment, and found a moderate improvement in short-run
educational outcomes, but no significant impact on medium- or long-term outcomes. This evidence
suggests that competition may have benefits, but that they may not be sustained.
What are the implications of these plans for public spending? The Conservatives plan to fund these
new schools on a per-pupil basis (so that they only attract funds in proportion to the number of
pupils they attract). Such a system would require significant reforms to the system of school
funding in England, but could be made to be revenue-neutral in practice. However, the creation of
these schools would incur significant capital costs, to fund school buildings and other start-up costs.
The Conservatives have proposed to fund these costs from the governments’ Building Schools for
the Future budget (a capital fund set aside by the government, largely for the refurbishment of
secondary schools). However, the Building Schools for the Future budget has not been set beyond
2011. Furthermore, under current plans, capital investment across all areas of government is due to
be cut significantly as part of the fiscal tightening planned across the next parliament. Finding the
money to fund an expansion in the supply of school places looks set to be a major challenge to the
Conservatives’ proposed ‘schools revolution’.
Teacher Recruitment
All parties agree that teachers matter enormously for children’s educational success – a fact backed
up by a significant body of academic research.39 However, the evidence also suggests that attracting
and retaining better teachers is far from straightforward. Indeed, simply identifying which teacher
applicants will make good teachers has so far proven difficult, if not impossible. A recent study
concludes that ‘credentials, degrees and teacher test scores are not consistently or strongly
37 For a non-technical overview, see the debate between C. Hoxby and J. Rothstein at
gsppi.berkeley.edu/faculty/jrothstein/hoxby/wsj.pdf
38 Böhlmark, A. And Lindahl, M. (2008), ‘Does school privatization improve educational achievement? Evidence from
Sweden’s voucher reform’, Institute for the Study of Labour (IZA), Discussion Paper no. 3691
39 See e.g. the summary in Hanushek, E. (2003), The failure of input-based schooling policies, Economic Journal 113(485),
F64–F98

IFS Election Briefing Note 2010
20
correlated with teaching skill’40, with a separate study of UK teachers agreeing that ‘observed
teachers’ characteristics explain little of their estimated effectiveness’.41
One initiative to attract high-calibre new teachers, Teach First, has received the support of all three
main parties. Teach First is an independent charity which seeks to attract top graduates into
teaching, by recruiting and training around 500 graduates per year, and placing them in some of the
country’s most challenging schools. These graduates are only committed to two years of teaching
(allowing them to pursue another career thereafter, if they choose), though it has been reported
that around half of Teach First graduates stay in teaching.42 All three parties’ manifestos include a
commitment to expand the Teach First scheme.43
The parties do differ, however, in their proposed approach to recruiting new teachers. Labour and
the Liberal Democrats both promise to improve teacher training, with Labour’s manifesto pledging
(ch3, p3) a new ‘right to continuous professional development’ for teachers, while the Liberal
Democrats plan to expand the Graduate Teacher Programme, which allows prospective teachers to
train while they work.
The Conservatives’ manifesto appears to take a different approach, with a proposal (p51) to ‘raise
the status of teaching,’ by restricting entry to the teaching profession to graduates who gained a 2:2
or above in their studies. Since teachers’ education appears to have no significant predictive power
for their subsequent effectiveness in the classroom, however, this proposal does not appear to be
grounded in the academic literature on improving teacher quality.
5. Higher education
Higher education has seen some important – and, at times, controversial – reforms under Labour.
While agreement is widespread on the importance of a well-funded higher education sector with
lower barriers to entry as a vehicle for long-term national prosperity and social justice, there
remain, as set out below, some disagreements on how best to achieve this.
Figure 2.2 of this briefing note illustrated that public spending on higher education teaching (per
student) has been broadly flat under Labour, but certain key reforms enacted since 1997 have
increased the amount of student support provided by the government and the contribution sought
from graduates. Overall, therefore, total expenditure per student in higher education has risen. This
section summarises how higher education has evolved over the last 13 years – in terms of funding,
participation and achievement – to see whether the increase in overall expenditure has led to any
improvements in outcomes. It then considers the parties’ respective manifesto proposals in this
area.
5.1 Higher education funding
When Labour came to power in May 1997, it inherited a higher education system financed by
general taxation alone, with no individual contribution to tuition required. Students did not pay
40 Hanushek E. and S. Rivkin,, (2004), ‘How to improve the supply of high quality teachers’, Brookings Papers on Education
Policy, No.7, pp. 7–44.
41 Slater, H., N. Davies and S. Burgess (2009), 'Do teachers matter? Measuring the variation in teacher effectiveness in
England', CMPOWorking Paper No. 09/212.
42 See e.g. www.timesonline.co.uk/tol/life_and_style/education/article6721763.ece
43 The Conservatives also propose to add two similar schemes alongside Teach First – ‘Teach Now’, which would recruit
individuals wishing to change careers into teaching, and ‘Troops to Teachers’, to attract ex-service personnel into the profession (emulating a similar scheme in the United States).

Education policy
21
fees and could also take out universal mortgage-style maintenance loans, which were repaid via
direct debit in equal monthly payments over a fixed term – typically five or seven years. The size of
the repayments did not depend on earnings, although it was possible for graduates to postpone
repayments for up to 12 months if their earnings fell below a certain gross annual income threshold
(£15,792 gross in 1996–97). The loans were subsidised by the Government: they carried an interest
rate equal to RPI inflation (in March of the previous academic year), which would normally be less
than the Government’s cost of borrowing. On top of this, poorer students were eligible for a means-
tested grant of up to £1,710.
Two months later, the Dearing Report on the future of higher education (commissioned by the
previous Conservative government) was published.44 Two of its recommendations were that:
(i) graduates make a contribution, once in employment, roughly equal to a quarter of the average
cost of higher education tuition (about £4,000 a year at the time);
(ii) a system of income-contingent repayments for loans and fees be implemented by 1998–99, as
a replacement for the mortgage-style loans.
In February 1998 the then Secretary of State for Education and Employment, David Blunkett,
presented the Government’s response45 to the Dearing Report, which included plans for a tuition
fee of £1,000 per year (with full or partial exemptions for students from poorer families), a system
of maintenance loans with income-contingent repayments, and the abolition of grants. The fee was
to be paid up-front, so it remained the case that only maintenance loans would be repaid after
graduation.46 Under the income-contingent system, monthly repayments depended only on a
graduate’s earnings, amounting to 9% of gross income above £10,000 a year. These features,
enshrined in the Teaching and Higher Education Act, were implemented across the UK with
immediate effect in September 1998.
Further changes were afoot five years later. In January 2003 the Government published a White
Paper, The Future of Higher Education, containing plans to restore means-tested maintenance
grants47 and replace the up-front tuition fee with a deferred fee of up to £3,000 a year, which would
be met by a fee loan issued to students and then recouped after graduation via the income-
contingent system that was already in place. The gross annual income threshold above which
deductions were made was to be raised from £10,000 to £15,000, and a new debt forgiveness
provision stipulated that any debts remaining after 25 years would be written off. Finally, a bursary
scheme was proposed, whereby students who were eligible for the full maintenance grant would
also receive at least £300 a year from their higher education institution, if it charged the maximum
tuition fee.
These measures made their way onto the statute book when the Higher Education Act 2004 was
narrowly passed, and came into effect in England and Northern Ireland in September 2006. With
the exception of some changes to student support announced in 2007, 2008 and 2009 (and the
annual up-rating by inflation of fees, grants and loans), this is the system of higher education
funding that exists at present in England and Northern Ireland. The reforms announced in 2007
44 National Committee of Inquiry into Higher Education, Higher Education in the Learning Society, 1997, London: NCIHE
(http://www.leeds.ac.uk/educol/ncihe).
45 Department for Education and Employment, Higher Education for the 21st Century: Response to the Dearing Report,
1998, London: HMSO.
46 The maintenance loan was increased by the amount of the fee, however, so there was arguably an implicit fee deferral.
47 In 2004–05 the Higher Education Grant of up to £1,500 was introduced for students from the poorest families, in order
to help them with the costs of university. This was combined with the existing fee remission of up to £1,200 in 2006–07 and repackaged as the maintenance grant that is now in place.

IFS Election Briefing Note 2010
22
increased the overall generosity of student support, while those announced in 2008 and 2009
served to reduce it.48
A different funding system now operates in the other countries of the UK. Following devolution, the
Scottish parliament abolished tuition fees in 2001 for Scottish students at Scottish institutions,49
who would instead have to pay the new Graduate Endowment (a contribution paid upon the
completion of a degree to help fund future cohorts of students). This was then removed in 2007. In
September 2006, the fees paid by non-Scottish, UK-domiciled students at Scottish institutions were
increased to £1,700 (£2,700 for medical degrees) in order to avoid a sudden influx of students from
elsewhere in the UK following the introduction of the £3,000 top-up fee.
The Welsh Assembly shared this concern, and therefore followed in the steps of England and
Northern Ireland by adopting top-up fees in September 2007. However, Welsh-domiciled students
were granted a partial exemption worth £1,800, and effectively continued to pay fees at the
previous level of £1,200.
This section has so far summarised the evolution of the higher education funding system up to the
present day, but a review of the arrangements is currently taking place and the next parliament
may see the introduction of further reforms. Box 5.1 below describes the outlook for higher
education funding and sets out some of the avenues that may be explored for future reform.
Box 5.1. Where next for higher education funding?
While the current parliament has seen considerable reform to the system of higher education
funding, further changes may be on the way. As part of the Higher Education Act 2004, the
Government undertook to commission a review of funding and student support arrangements
three years after the policy was implemented. In November 2009 the Independent Review of
Higher Education Funding and Student Finance, chaired by Lord Browne, was launched, tasked
with making recommendations about the future balance of contributions between students,
graduates, universities, employers and the Government. It is due to report its findings in the
autumn of this year.
One reform that the review may consider is an increase in the fee cap from its current level of
£3,225 (in 2009–10), a move endorsed by some business representatives.a University groups,
meanwhile, have maintained that additional resources are needed in order to deliver
improvements in teaching and compete internationally, and surveys suggest that a majority of
vice-chancellors would be in favour of increasing fees.b However, under the current system, an
increase in the fee cap – matched by an increase in fee loans – would actually cost the Government
more money. The generous repayment terms means that the loans are effectively subsidised to
the tune of 33p for every £1 of fee loans, and extending these loans further without additional
reforms would increase the value of the subsidy considerably.c In 2010–11, the total cost to the
taxpayer of issuing fee loans is expected to reach £782m,d and given the likely squeeze on public
spending over the next parliament, increasing fees (and fee loans) may not be an attractive option
to a fiscally-conscious policymaker.
48 In 2007, maintenance grants were increased for students with family incomes between £17,500 and £60,000. On top of
this, a ‘repayment holiday’ of up to five years during which graduates could put their loan repayments on hold, was also introduced. See Department for Innovation, Universities and Skills press release, 5 July 2007 (http://nds.coi.gov.uk/clientmicrosite/Content/Detail.aspx?ClientId=380&NewsAreaId=2&ReleaseID=297045&SubjectId=36). In 2008, the means-testing of maintenance grants was increased in response to higher than expected eligibility for the full grant. See written ministerial statement provided by John Denham to the House of Lords, 29 October 2008 (http://www.publications.parliament.uk/pa/ld200708/ldhansrd/text/81029-wms0001.htm). In 2009, the repayment holiday was reduced from five years to yeas. See Department for Business, Innovation and Skills press release, 20 July 2009 (http://nds.coi.gov.uk/clientmicrosite/Content/Detail.aspx?ClientId=431&NewsAreaId=2&ReleaseID=404961&SubjectId=36).
49 Non-Scottish students studying in Scotland continued to face the same tuition fee regime as elsewhere in the UK.

Education policy
23
The review may also look closely at ways of reducing the overall size of loan subsidies, which for
fee and maintenance loans together is expected to be £1.4 billion in 2010–11. This approach has
also been favoured by influential commentatorse and could be achieved by charging a positive real
interest rate, lowering the income threshold above which payroll deductions are made, increasing
the rate at which those deductions are made, or deferring the point of debt forgiveness.
IFS researchers have examined these issues in detail in a recent commentary.f The report considers
a range of potential policy options for modifying various features of the current system of fees
and loans, and analyses the likely impact of each option on graduates and the public finances.
a. Association of Graduate Recruiters, A manifesto for graduate recruitment, 2010 (http://www.agr.org.uk/Content/AGR-
A-manifesto-for-graduate-recruitment); CBI, Stronger together: Business and universities in turbulent times, 2009
(http://highereducation.cbi.org.uk/uploaded/CBI_HE_taskforce_report.pdf).
b. “Universities push for higher fees”, BBC News, 17 March 2009 (http://news.bbc.co.uk/1/hi/education/7946912.stm).
c. This is known as the RAB (Resource Accounting and Budgeting) charge for fee loans. House of Commons Hansard
Written Answers, 4 February 2008
(http://www.publications.parliament.uk/pa/cm200708/cmhansrd/cm080204/text/80204w0046.htm).
d. Department for Innovation, Universities and Skills, Departmental Report 2009, Annex 1, Table 11
(http://www.bis.gov.uk/assets/biscore/corporate/migratedD/publications/D/DIUS-Annual%20Report-2009).
e. N. Barr (2004), “Higher Education Funding”, Oxford Review of Economic Policy, Vol. 20, No. 2, pp. 264–283.
f. L. Dearden, A. Goodman, G. Kaplan and G. Wyness, Future arrangements for funding higher education, IFS Commentary
C115, 2010 (http://www.ifs.org.uk/publications/4837).
5.2 Participation in higher education
Increasing the proportion of young people in higher education has been an important element of
the Labour government’s long-term economic and social objectives. In 1999, Tony Blair announced
an ambitious target of 50% of young people entering higher education by 2010.50 At the time, this
measure – known as the Initial Participation Rate51 – stood at 39%; Figure 6.1 below shows how
this measure, shown by the light green line, and the total number of UK-domiciled students enrolled
on their first degree, shown by the dark green line, have evolved since 1996–97 (though the former
is only available from 1999–00 onwards).
Both statistics grew in the years immediately following the target’s announcement, but then tailed
off – and in the case of the Initial Participation Rate, actually fell – in around 2006–07. This dip
coincides with the controversial introduction of top-up fees, which some commentators argued
might dissuade young people from applying to university. However, the fee reforms do not seem to
have stopped the participation rate from growing over time, as it reached a high of 45 per cent in
2008–09 (provisional); this finding is consistent with evidence submitted by IFS researchers to the
Browne Review.52 Overall, since 1997, the continued expansion of higher education over which
Labour has presided, has resulted in an additional 400,000 UK undergraduates each year.
The increase in higher education participation under Labour, while noticeable, is very modest
relative to the earlier rapid increases in the participation rate during the ‘massification’ of higher
education in the 1990s, during which many newer institutions were granted university status.
50 Speech to Labour Party conference in Bournemouth, 28 September 1999
(http://news.bbc.co.uk/1/hi/uk_politics/460009.stm).
51 This measure of participation is defined as the sum of participation rates at each age between 17 and 30; in other words,
it roughly equates to the cumulative probability that a 17-year-old faces of entering HE by the age of 30.
52 L. Dearden, A. Goodman and G. Wyness, Reforms to tuition fees and student support had no overall impact on the
number of 18 or 19 year olds attending university in England, January 2010 (http://www.ifs.org.uk/publications/4726).

IFS Election Briefing Note 2010
24
Between 1985 and 2000, for example, the Age Participation Index53 (the Internal Participation
Rate’s predecessor) more than doubled from less than 15% to 30%.
It is unclear whether the 2010 target will be met. While the Government remains committed to
working towards it, fiscal pressures – particularly increases in student support costs – have led it to
impose stringent caps on the number of additional higher education entrants: 10,000 in 2009–10
(revised down from 15,000) and 10,000 in 2010–11 (revised down from 25,000). Alongside this is
a reduction in funding of £449m compared with planned expenditure in 2010–11.54 However, the
rising demand for university places caused by the economic downturn prompted the Department
for Business, Innovation and Skills to announce last July a one-off injection of cash to fund the
student support costs of up to 10,000 extra students in 2009–10.55 On top of this, the £270m
University Modernisation Fund, announced in last month’s Budget, will provide a one-off increase
in funding sufficient for an extra 20,000 university entrants in 2010–11.
Figure 5.1. Enrolment in UK higher education under Labour
Note: Number of UK-domiciled undergraduates includes part-time students.
Sources: HESA Students and Qualifiers Data Tables 1996–97 to 2008–09
(http://www.hesa.ac.uk/index.php?option=com_datatables&Itemid=121&task=show_category&catdex=3) and DIUS
Statistical First Release 02/2009, 31 March 2009 (http://www.dcsf.gov.uk/rsgateway/DB/SFR/s000839/SFR02-
2009webversion1.pdf). *Initial Participation Rate for 2008– 09 provisional only. Source: BIS Statistical First Release, 31
March 2010 (http://stats.berr.gov.uk/he/Participation_Rates_in_HE_2008-09.pdf).
Figure 5.2 provides an illustration of how the UK compares internationally for the proportion of
young people entering higher education, using OECD data. The three sets of horizontal bars plot the
net entry rate into higher education for OECD countries in 2007, in 2000, and finally the change in
this rate between 2000 and 2007.56
53 This measure is defined differently so comparability is somewhat limited. The Age Participation Index was equal to the
number of full-time higher education entrants under 21, dividing by the average number of 18 and 19 year olds in the population.
54 HEFCE Circular Letter 02/2010, 1 February 2010 (http://www.hefce.ac.uk/pubs/circlets/2010/cl02_10/).
55 Department for Business, Innovation and Skills press release, 20 July 2009 (op. cit.).
56 The net entry rate is conceptually similar to the Initial Participation Rate above: it is obtained by taking the number of
new entrants into higher education of a particular age, dividing it by the size of that age group in the population, and then adding up the age-specific rates across all the ages that apply.
38%
39%
40%
41%
42%
43%
44%
45%
46%
1,000,000
1,100,000
1,200,000
1,300,000
1,400,000
1,500,000
1,600,000
1,700,000
1,800,000
Academic year
Number of UK-domiciled undergaduate students (left axis)
Initial Participation Rate (right axis)

Education policy
25
Figure 5.2. International comparison of entry rates into higher education
Note: The specific definition used here is “tertiary type-A education”, consisting of university-level courses of a more
formal and academic nature. Figure shows only the subset of countries for which data were available in both 2000 and
2007. It therefore excludes Belgium, Canada, France, Luxembourg and Portugal.
Source: OECD, Education at a Glance 2009, Table A2.5 (www.oecd.org/edu/eag2009).
85.776.3
74.073.173.1
71.265.9
64.663.2
61.260.1
57.555.4
53.752.9
46.144.3
43.341.541.3
39.034.4
32.229.0
95.171.2
67.567.2
65.663.6
59.053.3
52.247.146.9
45.242.9
39.639.2
36.733.6
32.030.229.829.2
26.824.7
20.8
37.329.0
26.721.7
15.913.713.5
12.39.9
8.38.27.97.56.86.55.95.45.3
4.2-0.1-0.4
-1.5-5.5
-18.7
-40 -20 0 20 40 60 80 100 120
AustraliaNew Zealand
SlovakiaIceland
SwedenFinlandNorway
United StatesHungary
South KoreaNetherlands
DenmarkUnited Kingdom
Czech RepublicItaly
JapanIrelandGreeceAustria
SpainSwitzerland
GermanyMexicoTurkey
New ZealandFinlandNorwaySwedenIceland
HungaryAustralia
NetherlandsDenmark
United KingdomSpain
South KoreaUnited States
JapanItaly
SlovakiaAustriaIreland
GermanyGreece
SwitzerlandMexico
Czech RepublicTurkey
SlovakiaCzech Republic
AustraliaUnited States
South KoreaItaly
GreeceIreland
SwitzerlandUnited Kingdom
TurkeyAustriaIceland
NetherlandsJapan
SwedenMexico
DenmarkGermany
FinlandHungaryNorway
SpainNew Zealand
Tertiary education net entry rate (%)
2007
2000
Change from 2000 to 2007

IFS Election Briefing Note 2010
26
The UK’s university net entry rate, shown by the red bars, stood at 47% in 2000 and grew by 8
percentage points to 55% in 2007. Compared with the other countries on the graph, the UK appears
to rank ’mid-table’ in terms of net entry in both 2000 and 2007, as well as the change over time –
indeed, the net entry rate for the UK coincides almost exactly with the OECD average and EU19
average, both in 2000 and 2007. The UK’s performance relative to the average masks some
interesting individual comparisons, however. For example, over the last decade South Korea and
the US appear to have overtaken the UK on this measure, while Australia has pulled even further
ahead of the UK in 2007 than it was in 2000. On the other hand, the UK has remained ahead of
Japan throughout this period.
Focusing on European countries, the UK’s net entry rate generally compares poorly to that of the
Nordic countries (which have maintained a relative advantage over the UK of around 20 percentage
points throughout this period), but is only slightly lower than Denmark’s. The UK compares more
favourably against central and southern European countries such as Germany, Switzerland, Austria,
Spain, Italy and Greece, though it was ahead of all these countries to start with in 2000.
5.3 Achievement in higher education
The previous section examined Labour’s record on Higher Education in terms of quantity (the
number of people at university), but the Government’s progress since it came to power can also be
assessed in terms of the quality of the output (qualifications obtained). One possible measure of
quality is the total number of ‘good first degrees’ – those with a final classification of First Class or
Upper Second Class Honours – awarded to graduates in a particular year. The dark green line in
Figure 5.3, below, shows how this has evolved since 1996–97 for UK-domiciled graduates
(including those who studied part-time).
Figure 5.3. Qualifications obtained in UK higher education under Labour
Note: Figure shows number of first degrees awarded, either part-time or full-time, to UK-domiciled students at UK higher
education institutions over the period in question.
Source: HESA Students and Qualifiers Data Tables 1996–97 to 2008–09
(http://www.hesa.ac.uk/index.php?option=com_datatables&Itemid=121&task=show_category&catdex=3).
0%
10%
20%
30%
40%
50%
60%
70%
80%
100,000
110,000
120,000
130,000
140,000
150,000
160,000
170,000
180,000
Academic year
First degrees awarded at 2.1 or above (left axis)
As a proportion of all first degrees awarded (right axis)

Education policy
27
Over this period, the number of UK students graduating with good first degrees rose by 50% to
nearly 170,000 in 2008–09, but a large part of this is attributable simply to increases in the total
number of graduates, brought about by the HE sector’s rapid expansion (during which the number
of UK undergraduates grew by 31%).
A more informative measure of quality, therefore, expresses the number of good first degrees as a
proportion of all first degrees awarded that year. This is depicted by the light green line on the
same graph, shows much more modest progress over this period. In 1996–97, just under half of UK
graduates were awarded a 2.1 or above; by 2008–09, the fraction stood at 56%. That said, any
increase in the proportion of good first degrees could be considered an achievement: today’s
graduates are better qualified than in 1996–97, despite the potentially lower academic ability, on
average, of recent cohorts of entrants as access to higher education has been widened.
5.4 Party proposals for higher education
Higher education plays a less prominent role in Labour’s manifesto than it does in the manifestos of
the two opposition parties. Apart from a plan to boost outreach activities, the only other proposals
relate to the promotion of commercially beneficial research via the University Enterprise Capital
Fund and the creation of an additional 20,000 places for 2010–11 entry. Both of these measures
were announced in last month’s Budget.
The major higher education proposal from the Liberal Democrats is the abolition of tuition fees, and
their manifesto contains an undertaking to phase these out over a six-year period starting in 2010–
11 for all first degrees (including those studied part-time). The timetable set out to achieve this is as
follows: abolish fees for final-year full-time students in Year 1 (costing £600m); ‘regulate’ part-time
fees in Year 2; extend fee loans to part-time students in Year 3; abolish fees for full-time students
not in their first of study in Year 4; abolish fees for part-time students not in their first of study in
Year 5; extend the abolition of fees to all first degree student in Year 6.57 According to the Liberal
Democrats’ manifesto, by the end of this period (in 2014–15) the cost of the policy is projected to
be £1,765 million. This is only the cost for England: the full cost across the UK – including increases
in devolved administration budgets via the Barnett formula – would therefore be higher.58
Some other reforms have also been proposed by the Liberal Democrats, such as scrapping the 50%
participation rate target by 2010, introducing a National Bursary Scheme, and providing more
university places for pupils from low-performing schools. While there will clearly be little scope for
an incoming government to influence this year’s participation rate, the 50% benchmark is still
maintained by the Labour government as a longer-term aspiration to work towards; the Liberal
Democrats’ therefore propose a shift in policy focus away from this and towards wider measures of
educational attainment.
The Conservative manifesto contains one policy proposal regarding higher education: the pledge of
10,000 additional fully-funded university places in 2010–11. They claim that this would be funded
via an ‘early repayment bonus’: a discount offered to existing graduates if they make loan
repayments ahead of schedule, thereby releasing more cash (compared with the existing
arrangements) in the short term. While the manifesto has not provided the specific details of this
policy, previous Conservative announcements59 have stated that an early repayment bonus,
57 While the staged manner of this policy might save money, it could give also rise to anticipation effects whereby people
postpone their entry into higher education in order to avoid paying tuition fees.
58 However, the Liberal Democrats have also proposed to abolish the Barnett formula and replace it with a new needs-
based method of allocating funding to the devolved governments.
59 Conservative Party press release, Willetts: Conservatives will provide an extra 10,000 university places next year, 5
October 2009.

IFS Election Briefing Note 2010
28
inspired by schemes in Australia and New Zealand, would offer existing graduates a 10% discount
for voluntary early or up-front repayments of at least £500.
Based on early evidence from the New Zealand experience, the Conservatives believe that the offer
of a 10% discount would increase the amount of voluntary early repayments by a third
(approximately £100 million a year). Under their assumption that a fully-funded place at university
carries a cash-flow cost to the taxpayer of £10,000 a year, implementing the scheme over three
years would therefore finance an increase of 10,000 places for one cohort of students throughout a
three-year degree.
While this policy may well incentivise an increase in the amount of voluntary early repayments, it is
likely to have some negative implications for the public finances if graduates are well-informed and
respond to it rationally – in which case they would take the offer up only if they expect to gain
financially from it. The graduates who stand to gain are those with the highest lifetime earnings, for
whom the loan subsidy is very small: they make large monthly repayments and tend to pay off their
debt in full over a short period of time. An effective 10% subsidy, as proposed by the Conservatives,
would clearly be preferred by these individuals over the current arrangements. Hence graduates
who understand the policy and expect to have high lifetime earnings would take it up; the present
value of their repayments would be lower than currently, in which case the taxpayer would be
worse off.
At the other end of the spectrum, graduates with low lifetime earnings are currently heavily
subsidised. The effective 10% subsidy offered by this policy would be less attractive in financial
terms than the status quo; these graduates would be expected not to take it up if they were well-
informed, rational individuals. If they were to take it up, perhaps mistakenly or out of some
aversion to holding low-cost debt, then they would give up the generous loan subsidy they
currently receive in exchange for a smaller one. The taxpayer would therefore be better off, but the
graduate would be financially worse off.
Consequently, if graduates are informed about the current system, the proposed discount and their
likely future earnings, then only high earners would take the policy up. As a result, cash would
undoubtedly be brought forward, but in the long run the public finances would be weaker because
the present value of repayments would be lower for these individuals. The only way in which this
policy could be implemented without a long-run cost to the taxpayer is if low-earning graduates
also take it up – against their own financial interests – and back more than they do currently. Yet it
is unlikely that a government would wish to encourage ignorant decision-making – particularly by
those on low incomes.
Related to this is a potential equity concern. The current system is progressive among graduates –
those who earn the least are subsidised the most – but this policy, if implemented, would partially
offset that. High-earning graduates who make voluntary repayments would be financially better off,
while low-earning graduates who do so would be worse off. Hence if the offer is taken up by some
(irrespective of their position in the distribution of graduate lifetime earnings), then the policy is
likely to have a regressive impact.
It is worth considering how this method of unlocking the future streams of repayments currently
tied up in student loans compares to an existing one: selling off the student loan book to the private
sector. The Government has the power to do so under the Sale of Student Loans Act 2008, and in
October 2009 it announced it would sell a £3 billion tranche of this by 2011.
While there might be grounds to suspect that an early repayment scheme would lead to a long-term
fiscal loss (as the cash brought forward would likely be less than the present value of the stream of
repayments), selling the student loan book might involve a similar risk. The generous subsidies

Education policy
29
built in to these loans serve to reduce the potential return for private investors; such loans may
have to be offered at a discount in order to remain attractive enough to be securitised.60
Ultimately, however, it is difficult to compare the two methods of raising liquidity from outstanding
student loans. First, the likely discounts or losses (against face value) from each option are not
comparable: while a tranche of student debt pools together the loans of many graduates, the
repayments brought forward via an early repayment scheme are likely to be from higher-earners
only, so the implicit loss incurred is not a representative figure. Second, and perhaps more
importantly, the student loan book counts as public debt in the national accounts: sales of it are
therefore financial transactions. As these are scored outside total managed expenditure, this form
of monetisation of future student loan repayments would not bring in a flow of revenue that could
be used to finance additional spending.61
6. Conclusion
It may be many years before a party places ‘education, education, education’ at the heart of its
election campaign again: for the foreseeable future, British politics looks set to be dominated, at
least on the domestic front, by ‘deficits, deficits, deficits.’ While the last thirteen years have seen a
surge in education spending, with annual increases more than twice as generous as under the
Conservatives, the years of munificent public spending increases are almost certainly behind us.
The two key questions for voters, then, are: Did we get our money’s worth, and what should we
change in the future?
The government can certainly point to some concrete results from its largesse. From the expansion
of free nursery places and the introduction of Sure Start, to the refurbishment of England’s schools
and the overall rise in higher education enrolment, our education system today is broader in scope,
and richer in resources, than it was when Labour came to power. We have also seen a clear shift in
funding priorities towards younger children, with the UK becoming one of the developed world’s
biggest spenders on early years programmes. With a wealth of academic evidence pointing to the
critical importance of skills formed during the early years of childhood, this shift in emphasis is to
be welcomed – provided, of course, that the money is spent effectively. There appears to be a
consensus on the importance of early years investment among all three main political parties.
This shift in emphasis continues higher up the education system, with public spending on school-
age children catching up with (and set to overtake) spending on college and university students.
The Government’s progress should not be judged, however, on the inputs to the school system
(money, class sizes and so on), but on the outputs – a population of skilled, literate and numerate
children. Here Labour’s record is more mixed. Despite the introduction of national literacy and
numeracy strategies, on top of considerable investment in early years programmes, improvements
in primary school results have been slow. Secondary school results have improved faster, but still
not at the rate the government had hoped for (as a slew of missed national targets attest).
International comparisons suggest that England’s pupils perform about as well as their peers in
much of the developed world – providing little cause for panic, but also little cause for celebration.
However, it is worth noting that the potential benefits of expanded early years programmes, such
as Sure Start, may well yet to be fully felt.
60 In addition, the discount required would potentially be affected by the early repayment scheme. If graduates who make
early repayments are generally high-earners who would have expected to pay off their student loans in full anyway, then the remaining student debt may be perceived by investors as riskier and poorer-quality. It would therefore be more expensive (from the Government’s perspective) to securitise.
61 However, a reduction in the stock of public debt could lead to lower debt interest payments and thus lower annually
managed expenditure.

IFS Election Briefing Note 2010
30
Some of the parties’ most radical manifesto proposals relate to England’s school system, though for
the moment these plans remain ‘radically vague’: they have potentially far-reaching consequences
but frustratingly little detail. All parties propose a ‘pupil premium’ for the funding system, for
example, yet only the Liberal Democrats have made clear how theirs would be structured. All
parties propose to expand and/or reform the Academies programme, but this apparent consensus
disguises widely differing approaches. Liberal Democrat plans to return academies to local
authority control could mark the effective abolition of the Academies programme (or at least the
removal of one of its defining characteristics). In contrast, Conservative plans to turn ever more
schools into academies, and encourage parents to open academies in their area, could herald the
effective abolition of local education authorities. Yet how these new schools’ start-up costs would
be funded, where the money would come from, and whether this would mark the end of collective
wage-bargaining for teachers, has not been made clear.
Turning to higher education, Labour’s time in office has seen an expansion in participation (without
reaching the infamous ‘50% of young people’ participation target), as well as the introduction of the
controversial top-up fees. Whether – and, if so, how – higher education funding will be reformed in
future is a hugely important question, yet one which has received little discussion in the election
debate. The Liberal Democrats have again proposed to scrap tuition fees; beyond that, however, all
the parties are effectively ‘waiting for the Browne review’ before deciding further policy. In our
view, this is unfortunate. An issue as important as university funding should be part of the electoral
debate, not kicked into the long grass.
In summary, then, the next parliament may see some of the most radical reforms to the education
system in decades. Despite (or perhaps because of) the enormous pressure on the public finances,
virtually all aspects of England’s education system could, in theory, see changes – from early years
provision to the structure and funding of the school system, to university finance. However, it is
impossible to be sure: with the possible exception of the Liberal Democrats, the parties’ manifesto
proposals are short of detail in certain key areas. On an issue of such fundamental importance to
our nation’s future prosperity, this is unfortunate.