effect of socialization on ethnic identity formation … · psychology august 2013 winston-salem,...
TRANSCRIPT

EFFECT OF SOCIALIZATION ON ETHNIC IDENTITY FORMATION WHILE
PARTICIPATING IN AN ETHNIC SOCIAL ORGANIZATION
BY
SHIVANI ULKESH DESAI
A Thesis Submitted to the Graduate Faculty of
WAKE FOREST UNIVERSITY GRADUATE SCHOOL OF ARTS AND SCIENCES
in Partial Fulfillment of the Requirements
for the Degree of
MASTER OF ARTS
Psychology
August 2013
Winston-Salem, North Carolina
Approved By:
Deborah L. Best, Ph.D., Advisor
Lisa Kiang, Ph.D., Chair
Samuel Gladding, Ph.D.
Eric R. Stone, Ph.D.

ii
ACKNOWLEDGMENTS
I would first like to thank my advisor, Dr. Debbie Best, for all of her guidance and
support over these last two years. Regardless of how I felt going into a meeting with her,
I always felt better coming out of the meeting, even if I ended up with more work. I
would also like to thank my thesis committee, Dr. Lisa Kiang, Dr. Lara Kammrath, Dr.
Eric Stone, and Dr. Sam Gladding, for their time and effort through this entire process.
I would like to thank all of my classmates for the HELP that they provided over
these two years. I am better for knowing each and every one of you.
I would like to thank my family and friends for all of their encouragement and
support. I would not be where I am today without them.
Finally, I would like to thank all the sevikas and swayamsevaks who helped me
complete this project. The number of emails and phone calls that all of you put in to get
this project done was tremendous. I also want to thank all of you for being my support
system and guiding me through my academic endeavors as well as my life endeavors.

iii
TABLE OF CONTENTS
LIST OF TABLES AND FIGURES.................................................................................. iv
LIST OF APPENDICES ......................................................................................................v
ABSTRACT ....................................................................................................................... vi
INTRODUCTION ...............................................................................................................1
Theories of Identity Formation ................................................................................3
Ethnic Identity ..........................................................................................................5
Hindu Swayamsevak Sangh (HSS) ..........................................................................6
Factors Influencing Ethnic Identity Development ...................................................7
METHOD ..........................................................................................................................14
Participants .............................................................................................................14
Child Measures ......................................................................................................14
Parent Measures .....................................................................................................20
RESULTS ..........................................................................................................................24
DISCUSSION ....................................................................................................................36
REFERENCES ..................................................................................................................45
APPENDICES ...................................................................................................................48
CURRICULUM VITAE ....................................................................................................62

iv
LIST OF TABLES AND FIGURES
TABLES
1 Time Family Members Have Spent in Both Cultures ...............................................15
2 Means and Standard Deviations of Scales Used with Child .....................................24
3 Means and Standard Deviations of Scales Used with Parent ...................................25
4 Correlations of Variables ..........................................................................................26
5 Correlations of Child’s Ethnic Identity and Familial Ethnic Socialization (FESM) 28
6 Correlations of Child’s Social Identity and Familial Ethnic Socialization (FESM) .29
7 Correlations of Language Proficiency, Ethnic Peer Interaction, and Culture Knowledge with Ethnic Identity ...............................................................................31
8 Correlations of Acculturation with Ethnic Identity ..................................................35
FIGURES
1 Model of Organization Motivation, Ethnic Identity, and Ethnic Peer Interaction ....33
2 Model of Organization Motivation, Ethnic Identity, and Ethnic Language Proficiency ................................................................................................................33
3 Model of Organization Motivation, Ethnic Identity, and Culture Knowledge .........34

v
LIST OF APPENDICES
APPENDIX
A Child – Revised –Multigroup Ethnic Identity Measure ............................................48
B Child – Familial Ethnic Socialization Measure ........................................................49
C Child – Language Proficiency ..................................................................................50
D Child – Ethnic Peer Interaction .................................................................................51
E Child – Culture Knowledge ......................................................................................52
F Child – Acculturation Index ......................................................................................53
G Child – Three-Factor Model of Social Identity.........................................................54
H Child – Organization Open-Ended............................................................................55
I Parent – Familial Ethnic Socialization Measure .......................................................56
J Parent – Acculturation Index ....................................................................................57
K Parent – Organization Motivation .............................................................................58
L Parent – English Proficiency .....................................................................................59
M Parent – Organization Open-Ended ..........................................................................60
N Parent – Demographic and General Information ......................................................61

vi
ABSTRACT
Today’s immigrant parents in the United States are trying to maintain their ethnic culture
in the hope that their children will become a part of the culture. In order to do that, some
parents take part in cultural organizations that try to promote the ethnic culture in the
United States. This study investigated ethnic identity development in children (N = 63)
who actively participate in a cultural group called Hindu Swyamsevak Sangh (HSS),
which promotes Indian/Hindu culture in the United States. Ethnic socialization by the
parents and HSS as well as the child’s ethnic language proficiency, ethnic peer
interaction, and culture knowledge were all related to the child’s ethnic identity
development. Further, the motivation behind parents making their children take part in
HSS predicted the child’s ethnic identity and was mediated by the child’s ethnic peer
interaction and knowledge of the culture.

1
INTRODUCTION
The landscape of the American society has changed rapidly in the last 30 years
with a noticeable increase in the immigrant population in the United States (US Census
Bureau, March 2011). The US Bureau of the Census reported that the population of those
that self-identify as Asian increased from 10.2 million to 14.7 million people between
2000 and 2010 (US Census Bureau, March 2011). This new American landscape is filled
with not only families that move from another country, but also includes international
students, international business people, and refugees. This study examines Asian Indian
immigrant families who have chosen to permanently move from another country as that
experience is different from the temporary sojourner experience of international students
and business people and the experience of fleeing one’s home country.
With the substantial increase in the immigrant population in the USA, the concept
of the “melting pot” also seems to be dwindling. The term, used as a metaphor to describe
an interaction of cultures in the USA, began in 1908 and since then has been employed to
describe a wide variety of ideas (Gardner, Gabriel, & Dean, 2004). One interpretation of
the metaphor describes complete assimilation by immigrants into the mainstream culture
with no remnant of their original ethnic culture. Another interpretation describes the
entire mainstream culture as a melting pot where all other cultures fuse together to form
an entirely new culture (Gleason, 1979). In either of these interpretations, the final
outcome shows no distinction between the immigrant and a member of the mainstream
culture (Gardner et al., 2004).
Either of these interpretations may have fit the wave of European immigrants that
arrived before 1960 as some of their core values may have matched those generally found

2
in the United States (Gardner et al., 2004). More recently however, there has been an
influx of immigrants from all parts of the world, including from places that do not share
the general United States culture or belief system (set of practices, beliefs, and
knowledge of a group of people). Individuals from these immigrant cultures may not be
ready to mix and melt into the mainstream culture as readily as previous immigrants.
Instead, the current idea of the “melting pot” is seen more as a metaphor that describes
multicultural diversity instead of complete assimilation (Gardner et al., 2004). Recent
immigrant families are not trying to completely shed their previous identity for the new
American one. Instead, immigrant families are raising their children to be a part of two
different cultures simultaneously.
Asian Indians comprise one such group that comes from a culture with values that
are quite different from the United States. The Indian culture is more collectivistic than
the United States culture (Hofstede, 2001). The social customs of India are quite different
from the social customs in the United States, with grandparents living with their
grandchildren. Marriage practices are very different in India, where a focus of marriage is
the connection of two families and not just two individuals. Parents may do a variety of
things to try to balance both the Indian/Hindu culture and the American culture and raise
their children as a member of both cultures. This study investigated how children of
Asian Indian immigrant parents navigate these two cultures and develop a sense of who
they are, a process called ethnic identity formation.
Because the American culture is the mainstream culture, it is prevalent
everywhere and it may not be necessary for Indian immigrant parents to actively try to
expose their children to it for them to learn “the American ways.” However, the
3
Indian/Hindu culture is more difficult for parents to expose their children to in the United
States. Consequently, some parents have chosen to be a part of a unique cultural
organization, where meeting regularly with planned cultural activities provides exposure
to the Indian/Hindu culture. The current study investigated ethnic identity development in
children who actively participate in Hindu Swayamsevak Sangh’s (HSS) local chapter
meetings called shakhas.
Theories of Identity Formation
Erikson was one of the first researchers to study identity and he emphasized that it
was a process answering the question “Who am I?” at each and every stage of life
(Erikson, 1980). Along with this question is also the question “Which group do I belong
to?” While it may seem that this process would not start to occur until late childhood, he
emphasized that identity formation starts shortly after birth (Erikson, 1980). Even at the
youngest age, identity starts to build when the child begins to trust a caregiver to provide
and take care of him or her. As individuals develop through the stages Erikson identified,
they overcome a crisis at each stage and incorporate trust, autonomy, initiative, and
industry into their identity (Erikson, 1980). The individual’s identity builds until
adolescence where the greatest conflict arises between identity and repudiation versus
identity diffusion. In this stage the individual goes through puberty as well as starts to
make decisions about the future. The individual sees many different possible roles for the
self and begins to put them together to make a complete identity. The individual may
seek out different types of people in order to understand more about him or herself. Due
to this apparent conflict a great deal of research has focused on the adolescence period.
However, during the stage before, that of industry versus inferiority, the individual is

4
learning through each of his or her own successes and failures. This foundational stage
sets the stage for identity development and it is certainly appropriate to study the
prepubescent age. By this age children have experienced their parents’ ethnic culture as
well as the mainstream culture but have not yet put them together to create an identity for
themselves.
Building on Erikson’s ideas of identity, Marcia provided four categories to
describe how adolescents react to identity formation, using the two axes of exploration
and commitment (Marcia, 1966). Identity diffusion is displayed when the individual
neither explores nor commits to an identity. In the moratorium stage, the individual has
explored possible identities but is unable to commit to anything. Foreclosure is shown
when the individual commits to an identity without having explored other possible
options. Often times the individual has just accepted the views of his or her parents. The
healthiest reaction to identity formation is identity achievement because the individual
has explored as well as committed to an identity. These categories have been applied to
specific identity types like political and religious identity.
On the other hand, Jean Phinney has identified three stages of ethnic identity
development that can be somewhat compared to Marcia’s stages (Phinney, 1989). The
first stage is similar to identity foreclosure and identity diffusion. It involves blindly
accepting the values of the majority culture. This could be because the individual has
negative views of the minority culture, but it could also be because he or she has just not
thought about ethnicity (their cultural tradition) at all. Overall, the individual has not
explored ethnic identity. The second stage is similar to Marcia’s identity moratorium. The
individual is exploring ethnic identity and trying to understand the meaning of being a

5
part of that ethnicity. The second stage seems to be brought about by the individual’s
growing awareness of ethnic differences. These differences may sometimes cause
conflict between the majority culture and the positive image that the individual has about
him or herself, or the larger ethnic group in general. The third and final stage, like
identity achievement, is when the individual has formed their ethnic identity (Phinney,
1989).
Ethnic Identity
Ethnic identity has been conceptualized as the psychological relationship that
ethnic minority groups have with their own group (Phinney, 1990). Ethnic identity
development involves the individual exploring the ethnic group and culture (exploration).
It also involves deciphering how much the individual feels attached to his or her ethnic
group and a personal assessment of the individual’s relationship with the ethnic group
(affirmation) (Roberts et al., 1999).
Formation of an ethnic identity has been associated with many aspects of personal
well-being and this association is stronger for adolescents and young adults than it is for
adults over the age of 40 (Smith & Silva, 2011). Across ethnic groups, ethnic identity
seems to predict self-esteem (Phinney, Cantu, & Kurtz, 1997). Ethnic identity is also
associated with fewer symptoms of depression or anxiety (Yasui, Dorham, & Dishion,
2004), and more coping skills to deal with racism and discrimination (Greene, Way, &
Pahl, 2006). Ethnic identity also seems to be negatively associated with illegal substance
use, with adolescents at higher levels of ethnic identity formation reporting less illegal
substance use (Choi, Harachi, Gillmore, & Catalano, 2006). With such positive outcomes
6
associated with ethnic identity formation, it is important to understand the factors that
influence ethnic identity formation.
Hindu Swayamsevak Sangh (HSS)
HSS has been a registered organization in the United States since 1989 and
currently has over 140 chapters (called shakhas). HSS is a “voluntary, non-profit, social,
and cultural organization” that aims to “preserve, practice, and promote Hindu ideals and
values” (http://www.hssus.org/content/view/18/112/). Planned activities in shakha
include games, yoga, discussions and lectures on Hindu culture. Activities in shakha
focus on developing strong character and leadership skills among members by training
volunteers to plan and execute all activities. In addition to weekly shakha meetings, HSS
plans weekend camps for the entire family, celebration of festivals, and service activities.
They “encourage maintaining Hindu cultural identity in harmony with the larger
community”(http://www.hssus.org/content/view/18/112/). As indicated by parents who
attend weekly shakha meetings, shakha also teaches children to be proud of their ethnic
culture.
Given all the activities that HSS conducts, the main one being weekly shakha
meetings, parents have to devote a great deal of time to be involved. Many parents may
be involved since their children were born and have local or national level responsibilities
in HSS. With this kind of deliberate focus on attending shakha meetings and teaching
their children about the ethnic culture, one question that seems to arise is whether
attending shakha meetings is actually doing what parents hope it is doing.
HSS provides a place for members of the same ethnic group (Indian/Hindu) to
interact and work together to maintain the Hindu culture in the United States. Finding a

7
community of other Indian/Hindu people may be difficult when a family moves to the
United States or even moves to another city in the United States. HSS offers this type of
ethnic group community to those that wish to participate.
Factors Influencing Ethnic Identity Development
Ethnic socialization. A variety of factors such as familial ethnic socialization, the
child’s ethnic language proficiency, and ethnic peer interaction have been shown to be
involved in ethnic identity formation (Juang & Syed, 2010; Phinney, Romero, Nava, &
Huang, 2001). These factors may be proximal or distal to the family unit. In the family
setting, ideas and values are transmitted to the children. These may be implicitly or
explicitly taught to the children in the family. Cultural transmission is influenced by the
emotional climate of the family as well as the continuity of parental values (Schönpflug,
2001). Enculturation generally describes a child’s socialization into any culture that does
not involve explicit teaching. The enculturation of immigrant children into the ethnic
culture can include direct socialization, such as teaching the children skills, values, and
the ethnic language, or more indirect socialization, such as specific lifestyle differences,
and food habits (Kim Park, 2007). Family socialization practices vary from those that
have covert influences, like celebrating ethnic holidays and listening to ethnic music, to
parents explicitly underlining the importance of ethnic practices.
Supple, Ghazarian, Frambutt, Plunkett, and Sands (2006) found that family ethnic
socialization was directly related to ethnic identity exploration and part of ethnic identity
affirmation (developing a sense of what membership in the group means to him or her) in
Latino adolescents, but not with feelings of positive group membership that is also part of
ethnic identity affirmation. The effects of family socialization practices also seem to

8
extend into young adulthood. In a study of college students from six pan-ethnic groups,
Juang and Syed (2010) found that family socialization was more strongly associated with
ethnic identity exploration than with ethnic identity affirmation. This suggests that while
socialization practices which immigrant parents implement to transmit culture may create
an environment for the child to explore identity, these practices may not, in reality, lead
to a positive commitment to the ethnic identity.
Familial ethnic socialization is an important influence of ethnic identity to study
because the family unit is where a great deal of cultural information is passed from
parents to children. Often immigrant children only have exposure to the ethnic culture at
their home. In order to maintain the ethnic culture in children, it would seem that familial
ethnic socialization would be necessary.
Nonetheless, the current sample involves a unique group of parents and children.
These children are not just exposed to the ethnic culture at home; they are also exposed to
it by attending shakha. These parents are likely providing some ethnic socialization at
home, but they are also all attending a local shakha where ethnic socialization is also
occurring. Previous literature suggests that ethnic identity affirmation may not be related
to familial ethnic socialization (Supple et al., 2006), but the shakha families appear to
have a strong commitment to their ethnic culture as evidenced by their regular attendance
at shakha and appreciation for the socialization it provides. Shakha also teaches children
how to maintain and be proud of the Hindu culture while living in the mainstream
American culture. This likely leads to children feeling like they are part of the ethnic
culture and have a positive association with the ethnic culture (both part of ethnic identity
affirmation). Thus, my first hypothesis is that familial ethnic socialization and

9
socialization from the shakha chapter meetings will be positively related to children’s
ethnic identity exploration and ethnic identity affirmation. I will also investigate whose
perception of ethnic socialization (parent or child’s) is more predictive of the child’s total
ethnic identity.
As described earlier, ethnic identity affirmation involves how attached the
individual is to the ethnic group and the individual’s personal relationship with the ethnic
group. Ethnic identity affirmation is similar to concepts of social identity with social
connections to the ingroup (same as the individual) and the outgroup (different from the
individual). Analogous to the way ethnic socialization should be positively related to
ethnic identity affirmation, I hypothesized that familial ethnic socialization and
socialization by the HSS chapter meetings will be positively related to connection with
the ethnic group (the ingroup). I also hypothesized that this familial ethnic socialization
and socialization by the HSS chapter meetings will decrease connection to other
American people (the outgroup). How central the ingroup is to one’s identity is another
factor of social identity and should also be related to ethnic socialization. I hypothesized
that ethnic socialization should be positively related to centrality of ingroup because a
stronger connection to the culture and ingroup should also lead to the ingroup being
central to one’s identity.
Ethnic language proficiency. Ethnic language is one of the most salient features
of an ethnic group. The instant connection that individuals feel when they speak the same
language can be seen across cultures. As a result, proficiency in the ethnic language is
cited as an element of ethnic identity (Phinney et al., 2001). The ethnic language can be
part of the family unit, but it is also a part of the greater ethnic cultural experience. Often
10
exposure to the ethnic culture is accompanied with the ethnic language. Imbens-Bailey
(1996) found that bilingual Armenian American children felt more connected to the
Armenian American community than monolingual English-speaking Armenian American
children. In a study of Armenian, Vietnamese, and Mexican adolescents, Phinney et al.
(2001) found that all three groups showed a positive correlation between ethnic language
proficiency and ethnic identity. Consequently, I hypothesize that the child’s ethnic
language proficiency would be positively related to the child’s ethnic identity exploration
and affirmation.
Ethnic peer interaction. Another factor that influences ethnic identity
development is the peer group. The peer group may provide either a similar or
contrasting milieu for the child depending on the type of family environment present.
Interacting with ethnic group peers provides additional exposure to the ethnic culture in
addition to the one available at home. The familiarity and similar cultural experiences
that ethnic group peers share provide additional connections to the ethnic culture.
Interacting with peers who experience the same conflicts with their immigrant parents or
the same difficulties in explaining cultural differences to non-ethnic group peers may
help the child to feel less isolated and more confident about who they are. Interaction
with same ethnic peers from Armenian, Vietnamese, and Mexican adolescents has been
found to be related to ethnic identity (Phinney et al., 2001). Thus, I hypothesize that the
child’s ethnic peer interactions would be positively related to the child’s ethnic identity
exploration and affirmation.
Culture knowledge. Knowledge about the culture should also increase
connections with the ethnic culture. Knowing and understanding the values, practices and

11
history of the culture increases the awareness a child has about his or her ethnic group
and can provide avenues to explore the culture. While ethnic identity exploration
involves how much the child has explored his or her ethnic culture, culture knowledge is
more about the actual knowledge obtained. In the shakha meetings, children learn about
the culture through stories that highlight key personalities of the culture, festivals
associated with the culture, and reasons for certain cultural practices. This knowledge
increases connectivity to the culture. Although culture knowledge has been
conceptualized as a dimension of acculturation (Gim Chung, Kim, & Abreu, 2004), it
should also be related to ethnic identity. For this reason, I hypothesize that culture
knowledge will be positively related to ethnic identity exploration and affirmation.
Shakha. One factor that has not been explored in the previous literature is the
influence of cultural organizations on a child’s ethnic identity. Cultural organizations
may provide access to an environment to meet with others in the same ethnic group.
Researchers have noted that some ethnic groups have language classes or other cultural
classes where parents take their children (Phinney et al., 2001); however, their influence
has not been studied. Hindu Swayamsevak Sangh is one such cultural organization with
shakhas across the United States. Shakhas are all conducted by volunteers, mostly parents
of children who also attend the chapter meetings.
Parents’ motivation to take children to these shakhas should influence children’s
ethnic identity because shakhas provide a place for ethnic language learning as well as a
place for children to interact with ethnic group peers. I hypothesize that parent’s
motivation to take their children to these shakhas will affect the child’s ethnic identity

12
and will be mediated by the child’s ethnic language proficiency and the child’s
interaction with ethnic peers.
Acculturation. Another factor that should relate to the child’s ethnic identity
development is acculturation. Acculturation is the process by which individuals choose to
maintain their ethnic culture or adopt their mainstream culture. The context in which
children are exposed to the two cultures is created by parents, the child’s developmental
niche (Super & Harkness, 1986). This niche combines the parents’ beliefs about
caregiving, the physical setting of the family, and the customs of child rearing that come
from the culture. Thus, the child’s developmental niche may contain aspects of both the
ethnic Indian/Hindu culture as well as the host American culture. As a result, the level of
the ethnic culture that parents provide and the amount of the mainstream culture that the
parents have adopted should relate to the child’s ethnic identity. While all previous
factors related to ethnic identity have focused on exposure to the ethnic culture,
acculturation is a possible measure assessing exposure to the American culture as well.
Often acculturation is regarded as a two dimensional process with individuals choosing
how much of each culture to accept or reject (Berry, 2001). However, I have chosen to
use a relative measure asking parents to judge which culture is more representative of
their behavior.to see which they consider they choose to emphasize more.
In summary, first I hypothesized that ethnic socialization (overt, covert, shakha,
and pride) would be related to the child’s ethnic identity (exploration and affirmation)
and the child’s social identity (ingroup ties, outgroup ties, and centrality of ingroup).
Second, I hypothesized that the child’s proficiency with the ethnic language, the child’s
interaction with ethnic group peers, and the child’s knowledge about the culture would be

13
related to the child’s ethnic identity. Third, I hypothesized that the parent’s motivation to
take their children to shakha would be related to the child’s ethnic identity, and that
relation would be mediated by the child’s ethnic language proficiency and the child’s
ethnic peer group interaction. Fourth, I hypothesized that which culture the parent’s
behavior emphasized more, would be related to the child’s ethnic identity.
14
METHOD
Participants
Participants in this study were 63 Indian American parent-child pairs (26 boys and
37 girls, 47 born in the US/Canada and 16 born in India). The average age of the children
was 13 years 5 months. All mothers and all fathers except for one were born outside of
the US. Table 1 describes the ages at which the mothers, fathers, and children came to the
United States. All participants were members of the volunteer organization called Hindu
Swayamsevak Sangh (HSS). They were recruited through national, regional, and local
coordinators of this organization. All coordinators personally informed families with
children that were attending local shakha meetings and fit the age range (11.5 – 15.5
years). The children have been attending local shakha meetings for an average of 8.25
years. In 71.4% of families one or both parents have a responsibility in the organization
(locally or above). HSS is a national organization and therefore participants were
recruited from across the country, wherever local chapters existed (South-East = 12.7%,
North-East = 11.1%, Mid-West = 14.3%, South-West = 17.5%, West Coast = 34.9%).
Parents identified themselves as Indian (41.3%), Hindu (15.9%), Asian (17.5%), and
Asian Indian (14.3%).
Child Measures
Revised Multigroup Ethnic Identity Measure (R-MEIM) . The Revised
Multigroup Ethnic Identity Measure (Roberts et al., 1999) was used to measure ethnic
identity achievement (see Appendix A for list of items). The measure consists of 12 items
which are split into two subscales that measure ethnic identity exploration and ethnic
identity affirmation. Participants were asked to assess how much they agreed with each of

15
_______________________________________________________________________
Table 1
Time Family Members Have Spent in Both Cultures
________________________________________________________________________
Mother Father Child a
Time in US 15.42 (3.46) 26.63 (3.97) 11.36 (2.41)
Age to US 26.63 (3.97) 28.64 (4.23) 2.29 (1.68)
________________________________________________________________________
Note. Standard deviations are in parentheses. a Only 17 children in this group
the items. The ethnic identity affirmation subscale consists of seven items, one of which
is “I am happy that I am a member of the group I belong to.” The ethnic identity
exploration subscale consists of five items (one item loads on both subscales). A sample
item of the ethnic identity exploration subscale is “In order to learn more about my ethnic
background, I have often talked to other people about my ethnic group.” The items are
rated on a 4-point scale with anchors at 1 (“strongly disagree”) and 4 (“strongly agree”).
Scores for each subscale are determined by averaging the appropriate items. High scores
indicate strong ethnic identity. The Cronbach’s alpha for this scale is above .80 with
various ethnic groups. For the current study the Cronbach’s alpha is .88.
Familial Ethnic Socialization Measure (FESM). The Familial Ethnic
Socialization Measure (Umaña-Taylor, Yazedjian, & Bámaca-Gómez, 2004) was used to
measure the perceived level of socialization by the family (see Appendix B for list of
items). The original measure consists of 12 items that measure covert and overt familial
ethnic socialization in two subscales. Participants were asked to rate how much they

16
agreed with the items. A sample item of the covert subscale is “Our home is decorated
with things that reflect my ethnic/cultural background.” A sample item of the overt
subscale is “My family teaches me about my ethnic/cultural background.” The items are
rated on a 5-point Likert scale with anchors at 1 (“not at all”) and 5 (“very much”).
Scores for each subscale are determined by averaging the appropriate items. Higher
scores indicate higher levels of familial ethnic socialization. The Cronbach’s alpha for
this scale is .94 with a sample of various ethnicities. For the current study the Cronbach’s
alpha is .89.
The overt subscale was also modified to measure the perceived amount of
socialization occurring by attending shakha. A sample item of this five item subscale is
“Shakha teaches me about the history of my ethnic/cultural background.” These items
were rated on the same 5-point Likert scale with anchors at 1 (“not at all”) and 5 (“very
much”). Scores for this subscale were determined by averaging the appropriate items.
Higher scores indicate higher levels of socialization through shakha. The Cronbach’s
alpha for this scale is .93.
In addition, six items measuring the amount of socialization involving pride for
the ethnic culture were created for this study. Sample items include “My family teaches
me to feel good about my cultural or ethnic background” and “Shakha teaches me to be
proud of my ethnic group and its accomplishments.” These items were rated on the same
5-point Likert scale with anchors at 1 (“not at all”) and 5 (“very much”). Scores for this
subscale were determined by averaging the appropriate items. Higher scores indicate
higher levels of socialization involving pride in the ethnic culture. The Cronbach’s alpha
for this scale is .94.
17
Language proficiency. The language proficiency scale was devised for this study
and included two subscales, with four items in each subscale, asking how proficient the
child believes he/she is in the ethnic language as well as in English (see Appendix C for
list of items). A sample item in the ethnic language subscale includes “How well do you
speak your ethnic language?” A sample item in the English language subscale includes
“How well do you write in English?” The items are on a 5-point Likert scale with anchors
at 1 (“not at all”) and 5 (“very well”). Scores for the subscales were determined by
averaging the appropriate items. Higher scores in the ethnic language subscale indicate
higher levels of reported ethnic language proficiency while higher scores in the English
language subscale indicate higher levels of reported English language proficiency. The
Cronbach’s alpha for the ethnic language proficiency subscale is .79.
Ethnic peer interaction. The ethnic peer interaction scale was devised for this
study and includes nine items (one reverse scored) measuring the child’s interaction with
ethnic group peers (see Appendix D for list of items). The scale is split into two subscales
with three items assessing attitude and six items assessing behavior. Participants were
asked to assess how much they agree with the items. A sample item of the attitude
subscale is “In my spare time, I like to hang out with people from my ethnic group.” A
sample item of the behavior subscale is “At school, I hang out with people from my
ethnic group.” The items are on a 5-point scale with anchors at 1 (“strongly disagree”)
and 5 (“strongly agree”). Scores for the subscales were determined by averaging the
appropriate items. Higher scores indicate greater interaction with ethnic group peers. The
Cronbach’s alpha for the ethnic peer interaction scale is .86.

18
Culture knowledge. The culture knowledge scale was adopted from the Asian
American Multidimensional Acculturation Scale (Gim Chung et al., 2004) (see Appendix
E for list of items). The items were reworded to better fit the current participants as well
as to put the items on the same 5-point scale. The culture knowledge scale consisted of
three items assessing the perception of ethnic culture knowledge. A sample item included
“How knowledgeable are you about the culture and traditions of your ethnic culture?”
The items are on a 5-point scale with anchors at 1 (“not very much”) and 5 (“very
much”). Higher scores indicate greater ethnic culture knowledge. For the current study,
the Cronbach’s alpha is .85.
Acculturation. This scale was modified from Ward and Kennedy (1994) and in
eight items asks the degree to which the child feels his or her behaviors align with the
ethnic culture and with the American culture (see Appendix F for list of items). Items
were reworded to minimize confusion, and some items were removed as they were not
relevant for these participants. Sample items included “Are your food habits similar to
those of people from your ethnic culture or American culture?” and “Are your
recreational activities similar to those of people from your ethnic culture or American
culture?” The items were rated on a 5-point scale with anchors at 1 (“mostly ethnic
culture”) and 5 (“mostly American culture”). Scores for the acculturation scale were
determined by averaging the items. Scores in the middle indicate similarity to both the
ethnic culture and the American culture. For the current study, the Cronbach’s alpha is
.82.
Three-Factor model of social identity. The social identity scale was modified
from Cameron (2004). Cameron’s ingroup affect subscale was omitted and an outgroup

19
ties scale was created. Overall, this scale assesses the participant’s self-identification with
a certain social group. The items were divided into 3 subscales (see Appendix G for list
of items).
Ingroup ties. This subscale includes four items (one item was reverse scored),
which were averaged together, about how participants feel about their ethnic group.
Sample items include “I have a lot in common with other people of my group” and “In a
group of my peers I really feel that I belong.” The items are on a 5-point scale with
anchors at 1(“strongly disagree”) and 5 (“strongly agree”). Higher scores indicate greater
ties to the ethnic group. The Cronbach’s alpha for this subscale ranges from .77 to .82.
For the current study, the Cronbach’s alpha is .70.
Outgroup ties. This subscale includes four items (one item was reverse scored),
which were averaged together, about how the participants feel about other American
people (those who are not part of the ethnic group). These were modified from the
Ingroup Ties subscale to refer to the outgroup instead of the ingroup. Sample items
include “I really ‘fit in’ with other American people (members not part of my group)”
and “I have a lot in common with other American people (members not part of my
group).” These items are on a 5-point scale with anchors at 1 (“strongly disagree”) and 5
(“strongly agree”). Higher scores indicate greater ties to the American group. For the
current study, the Cronbach’s alpha is .81.
Centrality of ingroup. This subscale includes three items (two items were reverse
scored), which were averaged together, about how much the participants feel the ethnic
social group is central to their identity. A sample item is “In general, being a member of
my group is an important part of my self-image.” These items are on a 5-point scale with

20
anchors at 1 (“strongly disagree”) and 5 (“strongly agree”). Higher scores indicate
stronger views that the ethnic group is central to their identity. The Cronbach’s alpha for
this subscale ranges from .67 to .78. However, for the current study the Cronbach’s alpha
is .10. Consequently these scores will be evaluated cautiously.
Organization open-ended. Organization open-ended items were created for this
study and asked questions about the organization (see Appenddix H for list of items). A
sample item is “What do you like most about shakha?”
Parent Measures
Two of the parent measures, the Familial Ethnic Socialization Measure and the
Acculturation measure, parallel the child measures. The items are the same, but were to
be answered from the parent’s perspective.
Familial Ethnic Socialization Measure (FESM). This scale was modified from
the FESM (Umaña-Taylor et al., 2004) to measure the amount of socialization by the
parents (see Appendix I for list of items). The original scale is given to children to assess
the family’s socialization behaviors. For the purposes of this study, the original scale was
reworded to ask parents about their own socialization behaviors. The scale consisted of
12 items, split into two subscales that measured covert and overt familial ethnic
socialization. Participants were asked to assess how much their behaviors match each of
these items. A sample item of the covert subscale is “Our home is decorated with things
that reflect my ethnic/cultural background.” A sample item of the overt subscale is “I
teach my child about my ethnic/cultural background.” The items are rated on a 5-point
Likert scale with anchors at 1 (“not at all”) and 5 (“very much”). Scores for the subscales
21
were determined by averaging the appropriate items. Higher scores indicate higher levels
of familial ethnic socialization. For the current study, the Cronbach’s alpha is .92.
The overt subscale was also modified to measure the perceived amount of
socialization that parents believed was occurring for their child by attending shakha.
Participants were asked to assess how much they agreed with the items. A sample item of
this subscale is “Shakha teaches my child about the history of our ethnic/cultural
background.” These items are rated on the same 5-point Likert scale with anchors at 1
(“not at all”) and 5 (“very much”). Scores for this subscale were determined by averaging
the items together. Higher scores indicate a greater amount of perceived socialization
parents believed was occurring by attending shakha. The Cronbach’s alpha for this scale
is .96.
In addition, six items measuring the amount of socialization involving pride for
the ethnic culture were created. Sample items include “I teach my child to be proud of
our ethnic group and its accomplishments” and “Shakha teaches my child to feel good
about our cultural or ethnic background.” These items are rated on the same 5-point
Likert scale with anchors at 1 (“not at all”) and 5 (“very much”). Scores for this subscale
were determined by averaging the six items. Higher scores indicate a greater amount of
socialization involving pride for the ethnic culture. The Cronbach’s alpha for this scale is
.92.
Acculturation. This scale was modified from Ward and Kennedy (1994) and asks
the degree to which the parent feels their behaviors align with the ethnic culture and with
the host culture (see Appendix J for list of items). Items were reworded to minimize
confusion. Some items were also removed because they were not relevant for these

22
participants. This scale is identical to the scale given to the child. Sample items include
“Are your food habits similar to those of people from your ethnic culture or American
culture?” and “Are your recreational activities similar to those of people from your ethnic
culture or American culture?” The items are rated on a 5-point scale with anchors at 1
(“mostly ethnic culture”) and 5 (“mostly American culture”). Scores for the acculturation
scale were determined by averaging the items. Scores in the center indicate similarity to
both the ethnic culture and the American culture. The Cronbach’s alpha for this scale is
.91.
Organization motivation. These 13 items were devised for this study and assess
the parent’s reasons for attending shakha (see Appendix K for list of items). Participants
were asked to assess how much they agreed with the items. Sample items include “I
attend shakha because I enjoy spending time with the people there” and “I attend shakha
because I feel obligated to go.” The items are rated on a 5-point scale with anchors at 1
(“strongly disagree) and 5 (“strongly agree”). Factor analysis indicated that the items did
not coalesce into any separate factors. For this reason scores for the organization
motivation scale were determined by averaging the items. Higher scores indicate a
stronger motivation for the parent to attend shakha. The Cronbach’s alpha for this scale is
.79.
English proficiency. The English proficiency scale was devised for this study and
included four items asking how proficient the parent believes he/she is in English (see
Appendix L for list of items). A sample item includes “How well do you speak English?”
The items are on a 5-point Likert scale with anchors at 1 (“not at all”) and 5 (“very

23
well”). Scores for the scale were determined by averaging the four items. Higher scores
indicate higher levels of reported English language proficiency.
Organization open-ended. These items included a set of four free response
questions about why and how parents take their kids to shakha (see Appendix M for list
of items). A sample item includes “Sometimes do you have to convince your kids to go to
shakha? If so, what do you tell them?”
Demographics and general information. These items assessed the age and
gender of the child as well as how long the parents have been in the United States (see
Appendix N for list of items). In terms of HSS involvement, parents were asked and how
long they have been a part of HSS and if they currently held any type of responsibility in
the organization. Parents were also asked to self-identify their ethnic group.
Procedure
All measures were administered through Qualtrics. First the questionnaires for the
parents appeared on the screen then the questionnaires for the child appeared.

24
RESULTS
Scores were calculated for each child and parent measure according to the scoring
procedures described in the Method section. Across all the variables there were no gender
differences for child or parent scores, therefore all further analyses did not differentiate
between males and females. Furthermore, in the current sample there was also no relation
between any of the variables and the child’s age so age differences were not considered
in the analyses. In the current sample, there were no differences in the variables studied
between the children born in the United States and the children born in India. For this
reason, further generational effects were not examined. Table 2 and Table 3 include the
means and standard deviations of all variables used and Table 4 includes the correlations
between variables.
________________________________________________________________________
Table 2
Means and Standard Deviations of Scales Used with Child
________________________________________________________________________
Mean Standard Deviation
Ethnic Identity b 3.37 .40
Ethnic Identity Exploration 3.21 .46
Ethnic Identity Affirmation 3.51 .42
Familial Ethnic Socialization 4.48 .53
Covert 4.44 .57
Overt 4.40 .67

25
Shakha 4.50 .64
Pride 4.56 .60
Ethnic Language Proficiency 3.17 .92
Ethnic Peer Interaction 3.55 .80
Behavior 3.26 .89
Attitude 4.13 .81
Culture Knowledge 4.03 .72
Acculturation 2.27 .73
Social Identity
Ingroup Ties 4.14 .68
Outgroup Ties 3.63 .83
Centrality of Ingroup 3.33 .64
________________________________________________________________________
b Scale was 1-4
________________________________________________________________________
Table 3
Means and Standard Deviations of Scales Used with Parent
________________________________________________________________________
Mean Standard Deviation
Familial Ethnic Socialization 4.43 .50
Overt 4.32 .66
Covert 4.22 .62
Shakha 4.62 .51

26
Pride 4.60 .52
Acculturation 1.85 .72
Organization Motivation 3.96 .56
English Proficiency 4.71 .52
________________________________________________________________________
________________________________________________________________________
Table 4
Correlations of Variables
________________________________________________________________________
1 2 3 4 5 6 7
1. Ethnic Peer Interaction Behavior
2. Ethnic Peer Interaction Attitude .69**
3. Culture Knowledge .38** .62**
4. Ethnic Language Proficiency .20 .19 .36**
5. Parent Organization Motivation .47** .49** .45** .28*
6. Child Acculturation -.40** -.46** -.24 -.10 -.03
7. Parent Acculturation -.29* -.41** -.26* -.18 -.37** -.40**
________________________________________________________________________
*p < .05, **p < .01
Due to the small sample size, multiple regression analyses were limited to only
two predictors (Tabachnick & Fidell, 2007). For this reason, some variables have been
27
combined in the multiple regression analyses. The ethnic identity measure was also
combined as the outcome variable to limit the number of tests. In a previous study the
subscales of this measure have been combined to assess total ethnic identity when using
multiple factors to predict ethnic identiy (Phinney et al., 2001).
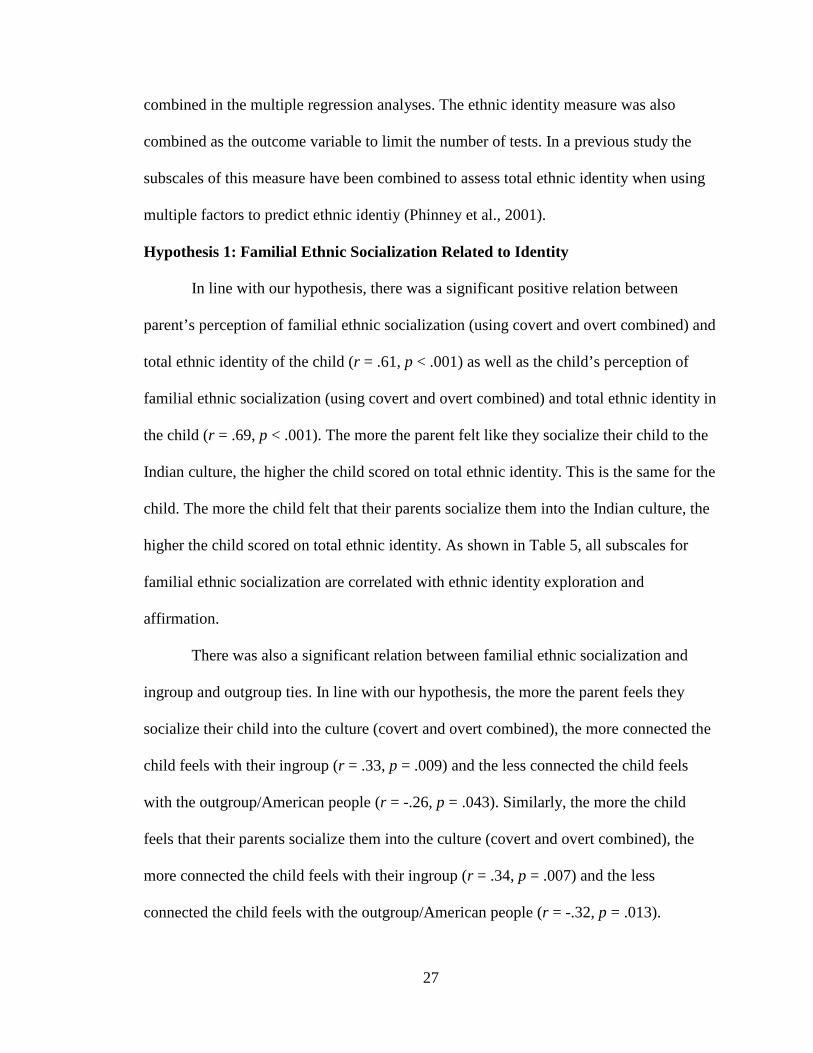
Hypothesis 1: Familial Ethnic Socialization Related to Identity
In line with our hypothesis, there was a significant positive relation between
parent’s perception of familial ethnic socialization (using covert and overt combined) and
total ethnic identity of the child (r = .61, p < .001) as well as the child’s perception of
familial ethnic socialization (using covert and overt combined) and total ethnic identity in
the child (r = .69, p < .001). The more the parent felt like they socialize their child to the
Indian culture, the higher the child scored on total ethnic identity. This is the same for the
child. The more the child felt that their parents socialize them into the Indian culture, the
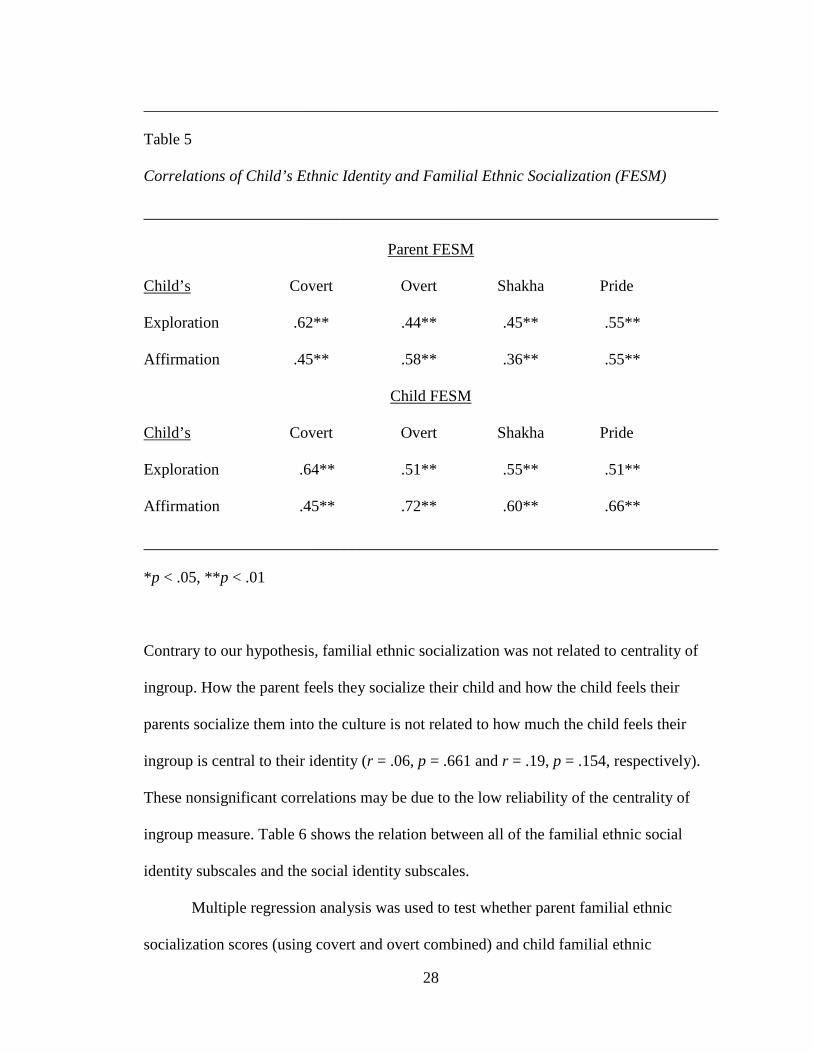
higher the child scored on total ethnic identity. As shown in Table 5, all subscales for
familial ethnic socialization are correlated with ethnic identity exploration and
affirmation.
There was also a significant relation between familial ethnic socialization and
ingroup and outgroup ties. In line with our hypothesis, the more the parent feels they
socialize their child into the culture (covert and overt combined), the more connected the
child feels with their ingroup (r = .33, p = .009) and the less connected the child feels
with the outgroup/American people (r = -.26, p = .043). Similarly, the more the child
feels that their parents socialize them into the culture (covert and overt combined), the
more connected the child feels with their ingroup (r = .34, p = .007) and the less
connected the child feels with the outgroup/American people (r = -.32, p = .013).
28
________________________________________________________________________
Table 5
Correlations of Child’s Ethnic Identity and Familial Ethnic Socialization (FESM)
________________________________________________________________________
Parent FESM
Child’s Covert Overt Shakha Pride
Exploration .62** .44** .45** .55**
Affirmation .45** .58** .36** .55**
Child FESM
Child’s Covert Overt Shakha Pride
Exploration .64** .51** .55** .51**
Affirmation .45** .72** .60** .66**
________________________________________________________________________
*p < .05, **p < .01
Contrary to our hypothesis, familial ethnic socialization was not related to centrality of
ingroup. How the parent feels they socialize their child and how the child feels their
parents socialize them into the culture is not related to how much the child feels their
ingroup is central to their identity (r = .06, p = .661 and r = .19, p = .154, respectively).
These nonsignificant correlations may be due to the low reliability of the centrality of
ingroup measure. Table 6 shows the relation between all of the familial ethnic social
identity subscales and the social identity subscales.
Multiple regression analysis was used to test whether parent familial ethnic
socialization scores (using covert and overt combined) and child familial ethnic

29
________________________________________________________________________
Table 6
Correlations of Child’s Social Identity and Familial Ethnic Socialization (FESM)
________________________________________________________________________
Parent FESM
Child’s Covert Overt Shakha Pride
Ingroup Ties .30* .32* .21 .41**
Outgroup Ties -.28* -.19 -.31* -.24
Centrality of Ingroup .11 -.02 -.10 -.03
Child FESM
Child’s Covert Overt Shakha Pride
Ingroup Ties .29* .34** .36** .37**
Outgroup Ties -.30* -.28* -.29* -.29*
Centrality of Ingroup .24 .08 -.04 -.09
________________________________________________________________________
*p < .05, **p < .01
socialization scores (using covert and overt combined) predicted child’s total ethnic
identity. Child’s and parent’s perception of familial socialization explained a significant
proportion of variance in total ethnic identity scores, R2 = .48, F(2, 59) = 28.58, p < .001.
When both variables were used as predictors, the child’s perception of how their parents
socialize them into the culture significantly predicted the child’s total ethnic identity,
β = .55, t(59) = 3.83, p < .001, but parent’s perception of ethnic socialization was not a
significant predictor.

30
Hypothesis 2: Language, Peer Interaction, and Culture Knowledge Related to
Identity
Supporting our hypothesis, the child’s reported ethnic language proficiency was
significantly correlated with total ethnic identity (r = .35, p = .006); the more the child
thinks he/she knows the ethnic language the higher the child scored on total ethnic
identity. Neither the child’s reported proficiency in English nor the parent’s reported
proficiency in English was related to the child’s total ethnic identity (r = -.01, p = .920
and r = -.03, p = .793, respectively).
Ethnic peer interaction was also significantly correlated with total ethnic identity.
The more time the child spent with other ethnic peers (behavior), the higher the child
scored on total ethnic identity (r = .46, p < .001). The more the child liked to spend time
with other ethnic peers (attitude), the higher the child scored on total ethnic identity
(r = .65, p < .001). The more the child believed they knew their ethnic culture, the higher
the child scored on total ethnic identity (r = .75, p < .001). Table 7 shows the correlations
of the child’s ethnic identity exploration and affirmation with reported language
proficiency, peer interactions and attitudes, and the child’s reported culture knowledge.
Multiple regression analyses were also conducted to test which of these variables
predicted total ethnic identity. First, culture knowledge and perceived ethnic language
proficiency were tested as predictors of total ethnic identity. Culture knowledge and
perceived ethnic language proficiency explained a significant portion of variance in total
ethnic identity scores, R2 = .56, F(2, 59) = 39.17, p < .001. However, only culture
knowledge significantly predicted total ethnic identity when ethnic language proficiency
was also in the model, β = .72, t(59) = 7.86, p < .001.

31
________________________________________________________________________
Table 7
Correlations of Language Proficiency, Ethnic Peer Interaction, and Culture Knowledge
with Ethnic Identity
________________________________________________________________________
Child’s Child’s Ethnic Language Child’s English Parent English
Exploration .43** .02 -.05
Affirmation .19 -.06 -.02
Peer Behavior Peer Attitude Peer Total Culture Knowledge
Exploration .41 .60** .51** .74**
Affirmation .39** .55** .48** .64**
________________________________________________________________________
*p < .05, **p < .01
Second, ethnic peer interaction behavior and ethnic peer interaction attitude were
tested as predictors of total ethnic identity. Ethnic peer interaction behavior and ethnic
peer interaction attitude explained a significant portion of variance in total ethnic identity
scores, R2 = .40, F(2, 59) = 21.55, p < .001. However, only ethnic peer interaction
attitude significantly predicted total ethnic identity when ethnic peer interaction behavior
was also in the model, β = .63, t(59) = 4.61, p < .001.
Lastly, multiple regression analysis was used to test if culture knowledge and
ethnic peer interaction attitude predicted total ethnic identity. Culture knowledge and
ethnic peer interaction attitude explained a significant portion of variance in total ethnic

32
identity scores, R2 = .61, F(2, 59) = 48.10, p < .001. Both culture knowledge and ethnic
peer interaction attitude significantly predicted total ethnic identity, β = .57, t(59) = 5.54,
p < .001 and β = .30, t(59) = 2.95, p = .004, respectively.
Hypothesis 3: Parent’s Organization Motivation Influence Child’s Ethnic Identity
The total score for the reasons that parents take their children to shakha were also
related to the child’s total ethnic identity. The higher the motivation to take their children
to shakha the higher the child scored on total ethnic identity (r = .39, p = .002).
The relation between parent’s organization motivation and child’s total ethnic
identity was mediated by child’s total ethnic peer interaction. As Figure 1 illustrates, the
standardized regression coefficient between organization motivation and total ethnic
identity decreased substantially when controlling for total ethnic peer interaction.
Organization motivation was a significant predictor of total ethnic identity and of total
ethnic peer interaction. Total peer interaction was a significant predictor of total ethnic
identity controlling for organization motivation. A Sobel test (Sobel, 1982) confirmed
that the effect of organization motivation on child’s total ethnic identity was mediated by
the child’s total ethnic peer interaction (z = 2.73 , p = .006 ).
Contrary to our hypothesis, the relation between parent’s organization motivation
and child’s total ethnic identity was not mediated by child’s ethnic language proficiency
as the effect of ethnic language proficiency on ethnic identity was not significant. As
Figure 2 illustrates, the standardized regression coefficient between organization
motivation and total ethnic identity decreased slightly when controlling for ethnic
language proficiency.
Although child’s culture knowledge was not originally hypothesized to be a

33
mediator of the relation between parent’s organization motivation and child’s total ethnic
identity, child’s culture knowledge was tested as a mediator because of its significant
Organization Motivation
Total Ethnic Identity
Ethnic Language Proficiency
.28* .23a
.33 (.39*)
Figure 2. Standardized regression coefficients for the relation between parent’s organization motivation and child’s total ethnic identity as mediated by child’s reported ethnic language proficiency. *p < .05. ap = .066
Figure 2: Model of Organization Motivation, Ethnic Identity, and Ethnic Language Proficiency
Organization Motivation
Total Ethnic Identity
Total Ethnic Peer Interaction
.51* .45*
.16 (.39*)
Figure 1. Standardized regression coefficients for the relation between parent’s organization motivation and child’s total ethnic identity as mediated by child’s total ethnic peer interaction. *p < .05.
Figure 1: Model of Organization Motivation, Ethnic Identity, and Ethnic Peer Interaction

34
relation to child’s total ethnic identity. The relation between parent’s organization
motivation and child’s total ethnic identity was mediated by child’s reported culture
knowledge. As Figure 3 illustrates, the standardized regression coefficient between
organization motivation and total ethnic identity decreased substantially when controlling
for the child’s reported culture knowledge. Organization motivation was a significant
predictor of culture knowledge and of total ethnic identity. Culture knowledge was a
significant predictor of total ethnic identity controlling for organization motivation. A
Sobel test (Sobel, 1982) confirmed that the effect of organization motivation on child’s
total ethnic identity was mediated by the child’s reported culture knowledge (z = 3.41 ,
p = .001).
Hypothesis 4: Parent Acculturation Influences Child’s Ethnic Identity
In line with our hypothesis, the stronger that parents felt that their behaviors
reflect the ethnic culture, the higher the child scored on total ethnic identity (r = -.29,
Organization Motivation
Total Ethnic Identity
Culture Knowledge
.45* .71*
.07 (.39*)
Figure 3. Standardized regression coefficients for the relation between parent’s organization motivation and child’s total ethnic identity as mediated by child’s reported culture knowledge. *p < .05.
Figure 3: Model of Organization Motivation, Ethnic Identity, and Culture Knowledge

35
p = .021). Table 8 shows the correlations of acculturation and both ethnic identity
exploration and affirmation.
________________________________________________________________________
Table 8
Correlations of Acculturation with Ethnic Identity
________________________________________________________________________
Parent Acculturation Child Acculturation
Exploration -.25 -.39**
Affirmation -.28* -.50**
________________________________________________________________________
*p < .05, **p < .01
Multiple regression analysis was used to test if parent acculturation and child
acculturation both predict child’s total ethnic identity in the same model. Parent
acculturation and child acculturation explained a significant portion of variance in total
ethnic identity scores, R2 = .24, F(2, 56) = 10.38, p < .001. Only child acculturation
significantly predicted total ethnic identity when parent acculturation was also in the
model, β = -.48, t(56) = -3.85, p < .001.
Child acculturation is also significantly correlated with the length of time the
mother (r = .39, p = .003) and the father (r = .33, p = .013) have been living in the United
States. The longer either of the parents lived in the United States the more the child felt
like their behaviors were more in line with the American culture than the ethnic culture.

36
DISCUSSION
Hindu Swayamsevak Sangh has been actively working in the United States as an
official organization for almost 25 years. With currently over 140 shakhas across the
country and activities for all ages, the question arises about whether attending shakha is
actually doing what parents hope it is doing.
From previous literature we know that familial ethnic socialization, interaction
with ethnic group peers, and ethnic language proficiency are all factors that are related to
ethnic identity development in the child (Juang & Syed, 2010; Phinney et al., 2001). The
presence of all of these factors in the child’s environment may not require an organization
or a regular time commitment to achieve. They may exist in the home or in the social
circle created by the parents. However, all of the parents from my sample are proactively
taking their children to shakha every week. When asked about why they take their
children to shakha, one parent said “because I believe that shakha will help them feel
proud and confident about their culture.” Is shakha actually providing an environment
where the child can learn to be proud and confident about their culture? Are these
children feeling more connected to the culture and consider him/herself to be a part of the
culture?
Ethnic Socialization
My first hypothesis was that ethnic socialization, as perceived both by the parent
and by the child, would be positively related to ethnic identity. I found that this was the
case. Covert and overt familial ethnic socialization were related to the child’s ethnic
identity exploration and ethnic identity affirmation. Shakha ethnic socialization and
socialization messages about having pride for the ethnic culture were also related to the

37
child’s ethnic identity exploration and ethnic identity affirmation. The messages that
shakha and the parents are sending the children about the culture are important factors in
the development of ethnic identity.
Another part of the first hypothesis was that ethnic socialization would make
children feel more connected to others in their ethnic group and also make them feel
more disconnected from other American individuals. This was also the case. Specifically,
the child’s perception of familial ethnic socialization, shakha ethnic socialization, and
socialization messages about ethnic pride were all related to the child’s feelings of being
connected with other members of their ingroup and lack of connection with other
American individuals. Interacting with ethnic group peers is an opportunity for children
to engage with other children who look just like them and whose parents act like their
parents. This type of familiarity can increase a feeling of connection with the ingroup and
decrease connection with African American or European American children who are less
familiar.
The child’s perception of socialization seems to be the primary predictor of ethnic
identity. The parent and child both reported having similar socialization messages from
the home and from shakha, yet the child’s report of the socialization messages present
was the primary predictor of ethnic identity. In contrast to the actual behaviors of parents,
the child’s perceptions of those behaviors are significant for the child’s ethnic identity
development.
Ethnic Language Proficiency, Ethnic Peer Interaction, and Culture Knowledge
My second hypothesis was that ethnic language proficiency, interaction with
ethnic group peers, and knowledge about the culture would be positively related to the

38
child’s ethnic identity. In line with the previous literature, proficiency of the ethnic
language and interaction with ethnic group peers are related to ethnic identity (Phinney et
al., 2001).
The ethnic language connects children to the culture and allows for exploration of
the culture as well as affirmation of its role in a child’s identity. Proficiency in the ethnic
language allows the child to communicate with grandparents, other family members, and
other members of the ethnic culture. In this sample of parents, English proficiency was
extremely high, likely due to their education and professional jobs here in the United
States. Yet certain nuances and meaning derived from the ethnic culture can only be
communicated through the ethnic language, often times the primary language of some of
the family members. For example, contrary to English, Hindi has specific pronouns to
address someone elder or someone deserving respect which are different from pronouns
used with friends or those younger in age. This enhances the Indian/Hindu cultural value
of respecting elders by practicing that respect not just through behaviors but also through
speech. Understanding and being able to effectively communicate increases the
connection to the culture.
The connection to the culture from interacting with ethnic group peers is also
similar to the effect of ethnic language proficiency in increasing connection to the
culture. Peers from the same ethnic group may be the only ones who can understand a
certain aspect of a child’s life. For example, waking up a half hour earlier in the morning
to start the daily routine of showering and performing a prayer before starting the day’s
activities may not be common or understood amongst other American peers. Interacting
with ethnic group peers also brings about connection to the culture, because interactions

39
with parents, family members, and other ethnic or non-ethnic group members are likely
influenced by the ethnic culture. For example, the Indian/Hindu tradition of taking the
blessings of the elders by touching their feet is influenced by the respect-for-elders value
that exists in the culture. However when a child is with an ethnic group peer and both of
them are taking blessings, both of them get a chance to observe another person just like
them behave in a way dictated by the ethnic culture. Interacting with ethnic group peers
offers another avenue to experience the ethnic culture instead of just with the nuclear
family at home (Phinney et al., 2001), thus increasing the connection to the culture.
Culture knowledge also seems to be a major predictor of ethnic identity.
Providing information about why certain practices exist in the culture can lead to further
exploration of the culture. For example, understanding why Hindu people greatly revere
cows can lead to further exploration into ideas of vegetarianism and other related topics.
Growing up in a country different from the country where one’s parents grew up can
result in children being bombarded with various questions about their ethnic culture.
Having some understanding and knowledge of the culture, permits children to feel
confident about their background and respond to those questions from non-ethnic group
peers. This increase in exploration and knowledge of the culture can also supply the
connection to the culture that leads to ethnic identity affirmation. Interestingly, the
participants in this study reported greater culture knowledge than found in previous
studies with Asian Americans (Gim Chung et al., 2004), suggesting that participation in
shakha may contribute to their enhanced knowledge.

40
Organization Motivation
My third hypothesis was that organization motivation would be positively related
to ethnic identity achievement and that ethnic language proficiency and ethnic peer
interaction would mediate that relation. While ethnic language proficiency was not a
mediator, ethnic peer interaction and culture knowledge were both mediators of the
relation between parent’s organization motivation and child’s ethnic identity. This
suggests that the parent’s motivation to take their children to shakha may influence
children’s ethnic identity because of the opportunity children have to interact with ethnic
group peers and to learn about the culture, and not because of the exposure to the ethnic
language. Families that go to shakha speak a variety of different languages at home
because there are 780 languages spoken in India today (Newstrack India, 2013). The
most common mode of communication between individuals who speak different Indian
languages is English. This leads to a shakha environment that is not saturated with one
specific Indian language, but with a variety of Indian languages as well as English.
Parents recognize that shakha provides a place for the child to interact with peers
from the same ethnic group and interacting with ethnic group peers is a means by which
shakha influences the child’s ethnic identity achievement. The influence shakha has as a
place to interact with ethnic group peers is a general theme amongst parents and children.
One parent described taking their children to shakha because they wanted their kids to
“understand that kids from our ethnic background face the same challenges as them and
they are not alone.” Another child answered that he/she goes to shakha “to interact with
all of my friends and to learn more about my ethnic culture.”

41
Shakha both provides knowledge about the culture and emphasizes pride in the
culture. Children in shakha are not only taught about why various cultural practices exist,
but also why these practices are important and beneficial for individuals to have. For
example, children in shakha learn not only why they should revere the cow but also why
it is important to revere the cow. They are taught that in villages in India many families
greatly benefit from having a cow. The cow provides labor for the farm, provides milk
for the family, and provides waste that goes back to fertilize the field. Children in shakha
are taught to respect and appreciate things that provide great aid to them, similar to the
way cows are respected and appreciated. They are taught about the history and traditions
of the culture and are given reasons to be proud to be a part of their ethnic culture.
Indeed, pride in the culture has resulted in various shakha traditions of taking
specific cultural messages to the greater American public. For example, Raksha Bandhan
is a Hindu festival in which individuals tie a sacred thread (called as rakhi) to an
individual who protects them. The rakhi is a symbol of continued care and protection
between the two individuals. As a part of public outreach, shakha families tie rakhis to
police officers, firefighters, and EMT’s because of the protection they offer the local
community. The pride in the Indian/Hindu culture among the shakha-going parents and
children has given them the confidence to step out of the ethnic group and share their
culture with other American people. It has also led to a blending of cultures in the United
States.
Acculturation
My fourth hypothesis was that the amount of acculturation, the blending of both
the American mainstream culture and the Indian/Hindu ethnic culture, would be related

42
to the child’s ethnic identity. This was the case. When parents felt that their behaviors
reflected the ethnic culture more than the American culture, the child tended to have a
stronger ethnic identity.
Shakha’s Effects
Compared to other ethnic groups, previous research using the same scale has
shown that Indian American and Pakistani American children have a relatively high
ethnic identity score (Roberts et al., 1999), suggesting a strong sense of connection and
understanding of their ethnic group. The scores of the current study’s sample of shakha-
going children are similar to Indian and Pakistani children in previous research (Roberts
et al., 1999). Chinese American and Central American children score relatively lower
than Indian and Pakistani children, while European Americans score even lower. Roberts
and colleagues (1999) suggest that ethnicity may not be important for European
American children, as they are often times part of the dominant, majority group. At the
same time, ethnicity seems to be more important for Indian American and Pakistani
American children, possibly because of having stronger ties to the ethnic group locally
than the Chinese American and Central American children.
No information was reported in the Roberts et al. (1999) study about whether or
not the Indian American and Pakistani American children were participating in any
groups or organizations similar to shakha. Furthermore, the data for that study were
collected in 1994, and it is unclear whether Indian American and Pakistani American
children would continue to score so highly today.
Some previous literature suggests that ethnic identity affirmation is not related to
familial ethnic socialization (Juang & Syed, 2010; Supple et al., 2006), but these studies
43
differ from the current one. For example, Supple et al. (2006) studied Latino adolescents
and Juang and Syed (2010) studied emerging adults. Affirmation may be reached during
adolescence for these shakha going children due to the shakha ethnic socialization and
Hindu-American/Indian-American centered activities, they experience during early
adolescence. Sessions in shakha are often about growing up as a Hindu/Indian American.
Such intentional and specific activities may lead children to think about their ethnic
culture and their place in that ethnic culture at a younger age than other children. Shakha
provides an environment to interact with peers and to gain more knowledge about the
culture, and the influence of these two factors on ethnic identity is clear. Attending
shakha may not be the only way to promote a child’s ethnic identity development and
other cultural linguistic organizations may do the same. Yet, the direct intentional ethnic
socialization that shakha provides may be hard to replicate at home because of the unique
opportunity for children to interact with ethnic group peers while also learning about the
culture.
Future Directions and Limitations
This study focused on ethnic identity development in immigrant children. Another
aspect to identity development in immigrant children is the development of an American
identity and how the ethnic identity and the American identity can be integrated together
to form a bicultural identity. While the current study’s sample displayed high ethnic
identity, they may or may not display high American identity. Future studies should
investigate the process of bicultural identity formation in children attending local
shakhas.

44
The participants in this study were families that attended HSS shakhas in their
local area. This sample may be skewed due to the parent’s commitment to attend shakha
regularly and presumably their desire to maintain their ethnic culture. These children may
already be high in ethnic identity because of the parents’ desire to maintain the ethnic
culture.
One challenge during data collection was ensuring the child’s response was not
influenced by the parent. To maintain the participant’s anonymity with the researchers,
the parent’s and child’s responses needed to be attached before being observed by the
researcher. These restrictions lead to the parent and child taking the survey consecutively
and in the same sitting. Unfortunately, there is no way to know whether the child’s
responses were entirely his or her own and not influenced by others.
While ethnic socialization, proficiency of the ethnic language, ethnic group peer
interaction, and culture knowledge influence ethnic identity, it is important to recognize
that ethnic identity also influences each of these factors. For example while proficiency in
the ethnic language may increase attachment to the ethnic group and therefore ethnic
identity, ethnic identity and attachment to the ethnic group may also lead to a desire to
learn the ethnic language.

45
REFERENCES
“780 languages spoken in India, 250 died out in last 50 years.” (n.d.). Retrieved July 18, 2013, from http://www.newstrackindia.com/newsdetails/2013/07/16/356--780-languages-spoken-in-India-250-died-out-in-last-50-years-.html
Berry, J. W. (2001). A Psychology of Immigration. Journal of Social Issues, 57(3), 615–631. doi:10.1111/0022-4537.00231
Cameron, J. E. (2004). A three-factor model of social identity. Self and Identity, 3(3), 239–262. doi:10.1080/13576500444000047
Choi, Y., Harachi, T. W., Gillmore, M. R., & Catalano, R. F. (2006). Are multiracial adolescents at greater risk? Comparisons of rates, patterns, and correlates of substance use and violence between monoracial and multiracial adolescents. American Journal of Orthopsychiatry, 76(1), 86–97. doi:10.1037/0002-9432.76.1.86
Erikson, E. H. (1980). Identity and the Life Cycle. W. W. Norton & Company.
Gardner, W. L., Gabriel, S., & Dean, K. K. (2004). The individual as “melting pot”: The flexibility of bicultural self-construals. Cahiers de Psychologie Cognitive/Current Psychology of Cognition, 22(2), 181–201.
Gim Chung, R. H., Kim, B. S. K., & Abreu, J. M. (2004). Asian American multidimensional acculturation scale: Development, factor analysis, reliability, and validity. Cultural Diversity and Ethnic Minority Psychology, 10(1), 66–80. doi:10.1037/1099-9809.10.1.66
Gleason, P. (1979). Confusion compounded: The melting pot in the 1960s and 1970s. Ethnicity, 6(1), 10–20.
Greene, M. L., Way, N., & Pahl, K. (2006). Trajectories of perceived adult and peer discrimination among Black, Latino, and Asian American adolescents: Patterns and psychological correlates. Developmental Psychology, 42(2), 218–238. doi:10.1037/0012-1649.42.2.218
Hindu Swayamsevak Sangh USA - An introduction | Hindu Swayamsevak Sangh USA. (n.d.). Retrieved December 7, 2012, from http://www.hssus.org/content/view/18/112/
Hofstede, G. H. (2001). Culture’s Consequences: Comparing Values, Behaviors, Institutions and Organizations Across Nations. SAGE.

46
Imbens-Bailey, A. L. (1996). Ancestral language acquisition: Implications for aspects of ethnic identity among Armenian American children and adolescents. Journal of Language and Social Psychology, 15(4), 422–443. doi:10.1177/0261927X960154002
Juang, L., & Syed, M. (2010). Family cultural socialization practices and ethnic identity in college-going emerging adults. Journal of Adolescence, 33(3), 347–354. doi:10.1016/j.adolescence.2009.11.008
Kim Park, I. J. (2007). Enculturation of Korean American adolescents within familial and cultural contexts: The mediating role of ethnic identity. Family Relations, 56(4), 403–412.
Marcia, J. E. (1966). Development and validation of ego-identity status. Journal of Personality and Social Psychology, 3(5), 551–558. doi:10.1037/h0023281
Phinney, J. S. (1989). Stages of Ethnic Identity Development in Minority Group Adolescents. The Journal of Early Adolescence, 9(1-2), 34–49. doi:10.1177/0272431689091004
Phinney, J. S. (1990). Ethnic identity in adolescents and adults: Review of research. Psychological Bulletin, 108(3), 499–514. doi:10.1037/0033-2909.108.3.499
Phinney, J. S., Cantu, C. L., & Kurtz, D. A. (1997). Ethnic and American identity as predictors of self-esteem among African American, Latino, and White adolescents. Journal of Youth and Adolescence, 26(2), 165–185. doi:10.1023/A:1024500514834
Phinney, J. S., Romero, I., Nava, M., & Huang, D. (2001). The role of language, parents, and peers in ethnic identity among adolescents in immigrant families. Journal of Youth and Adolescence, 30(2), 135–153. doi:10.1023/A:1010389607319
Roberts, R. E., Phinney, J. S., Masse, L. C., Chen, Y. R., Roberts, C. R., & Romero, A. (1999). The structure of ethnic identity of young adolescents from diverse ethnocultural groups. The Journal of Early Adolescence, 19(3), 301–322. doi:10.1177/0272431699019003001
Schönpflug, U. (2001). Intergenerational transmission of values: The role of transmission belts. Journal of Cross-Cultural Psychology, 32(2), 174–185. doi:10.1177/0022022101032002005
Smith, T. B., & Silva, L. (2011). Ethnic identity and personal well-being of people of color: A meta-analysis. Journal of Counseling Psychology, 58(1), 42–60. doi:10.1037/a0021528
Sobel, M. E. (1982). Asymptotic confidence intervals for indirect effects in structural equation models. Sociological Methodology, 13, 290–312. doi:10.2307/270723
47
Super, C. M., & Harkness, S. (1986). The developmental niche: A conceptualization at the interface of child and culture. International Journal of Behavioral Development, 9(4), 545–569. doi:10.1177/016502548600900409
Supple, A. J., Ghazarian, S. R., Frabutt, J. M., Plunkett, S. W., & Sands, T. (2006). Contextual influences on Latino adolescent ethnic identity and academic outcomes. Child Development, 77(5), 1427–1433. doi:10.1111/j.1467-8624.2006.00945.x
Tabachnick, B. G., & Fidell, L. S. (2007). Using multivariate statistics (5th ed.): Boston Pearson.
Umaña-Taylor, A. J., Yazedjian, A., & Bámaca-Gómez, M. (2004). Developing the ethnic identity scale using Eriksonian and social identity perspectives. Identity: An International Journal of Theory and Research, 4(1), 9–38. doi:10.1207/S1532706XID0401_2
US Census Bureau. (2011, March). Overview of race and Hispanic origin. Retrieved September 27, 2012, from http://www.census.gov/population/race/
Ward, C., & Kennedy, A. (1994). Acculturation strategies, psychological adjustment, and sociocultural competence during cross-cultural transitions. International Journal of Intercultural Relations, 18(3), 329–343. doi:10.1016/0147-1767(94)90036-1
Yasui, M., Dorham, C. L., & Dishion, T. J. (2004). Ethnic identity and psychological adjustment: A validity analysis for European American and African American adolescents. Journal of Adolescent Research, 19(6), 807–825. doi:10.1177/0743558403260098
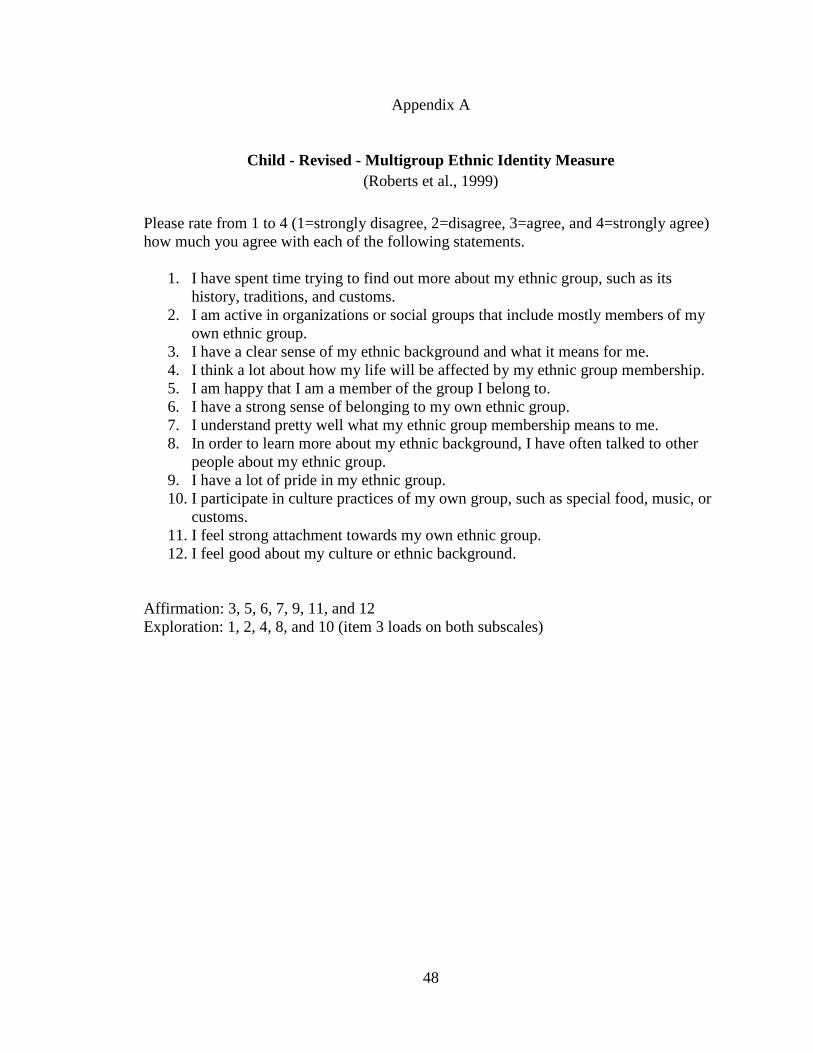
48
Appendix A
Child - Revised - Multigroup Ethnic Identity Measure (Roberts et al., 1999)
Please rate from 1 to 4 (1=strongly disagree, 2=disagree, 3=agree, and 4=strongly agree) how much you agree with each of the following statements.
1. I have spent time trying to find out more about my ethnic group, such as its history, traditions, and customs.
2. I am active in organizations or social groups that include mostly members of my own ethnic group.
3. I have a clear sense of my ethnic background and what it means for me. 4. I think a lot about how my life will be affected by my ethnic group membership. 5. I am happy that I am a member of the group I belong to. 6. I have a strong sense of belonging to my own ethnic group. 7. I understand pretty well what my ethnic group membership means to me. 8. In order to learn more about my ethnic background, I have often talked to other
people about my ethnic group. 9. I have a lot of pride in my ethnic group. 10. I participate in culture practices of my own group, such as special food, music, or
customs. 11. I feel strong attachment towards my own ethnic group. 12. I feel good about my culture or ethnic background.
Affirmation: 3, 5, 6, 7, 9, 11, and 12 Exploration: 1, 2, 4, 8, and 10 (item 3 loads on both subscales)
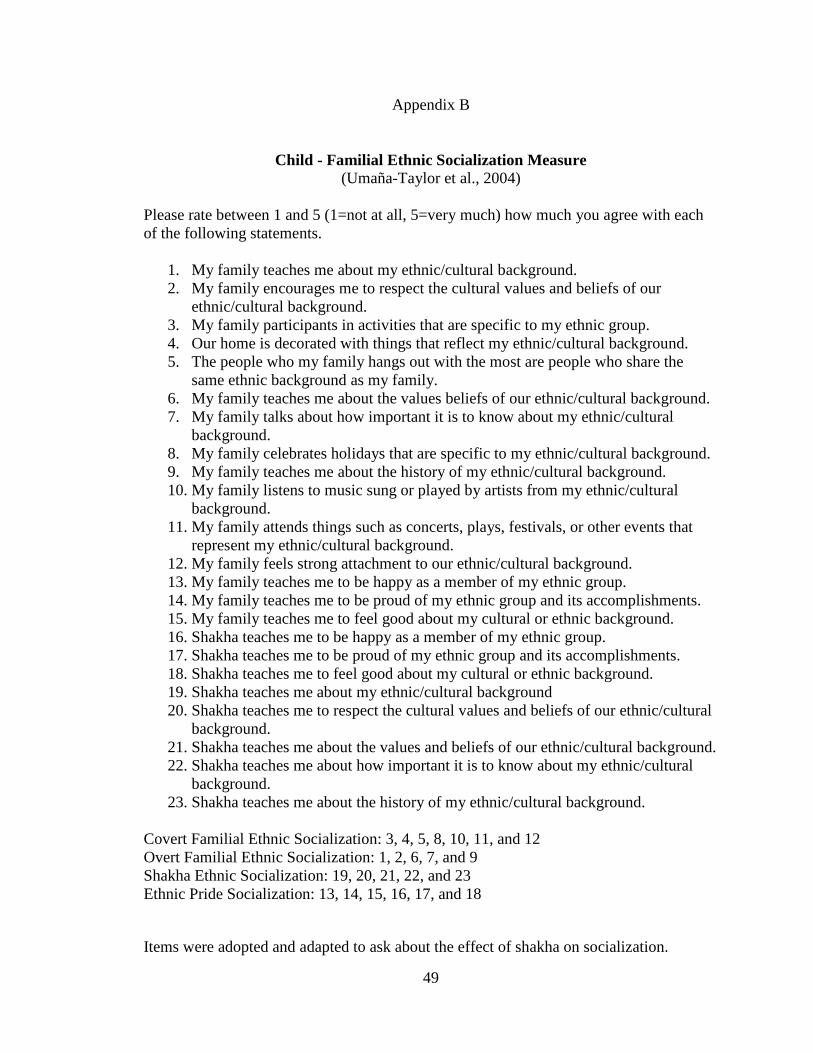
49
Appendix B
Child - Familial Ethnic Socialization Measure (Umaña-Taylor et al., 2004)
Please rate between 1 and 5 (1=not at all, 5=very much) how much you agree with each of the following statements.
1. My family teaches me about my ethnic/cultural background. 2. My family encourages me to respect the cultural values and beliefs of our
ethnic/cultural background. 3. My family participants in activities that are specific to my ethnic group. 4. Our home is decorated with things that reflect my ethnic/cultural background. 5. The people who my family hangs out with the most are people who share the
same ethnic background as my family. 6. My family teaches me about the values beliefs of our ethnic/cultural background. 7. My family talks about how important it is to know about my ethnic/cultural
background. 8. My family celebrates holidays that are specific to my ethnic/cultural background. 9. My family teaches me about the history of my ethnic/cultural background. 10. My family listens to music sung or played by artists from my ethnic/cultural
background. 11. My family attends things such as concerts, plays, festivals, or other events that
represent my ethnic/cultural background. 12. My family feels strong attachment to our ethnic/cultural background. 13. My family teaches me to be happy as a member of my ethnic group. 14. My family teaches me to be proud of my ethnic group and its accomplishments. 15. My family teaches me to feel good about my cultural or ethnic background. 16. Shakha teaches me to be happy as a member of my ethnic group. 17. Shakha teaches me to be proud of my ethnic group and its accomplishments. 18. Shakha teaches me to feel good about my cultural or ethnic background. 19. Shakha teaches me about my ethnic/cultural background 20. Shakha teaches me to respect the cultural values and beliefs of our ethnic/cultural
background. 21. Shakha teaches me about the values and beliefs of our ethnic/cultural background. 22. Shakha teaches me about how important it is to know about my ethnic/cultural
background. 23. Shakha teaches me about the history of my ethnic/cultural background.
Covert Familial Ethnic Socialization: 3, 4, 5, 8, 10, 11, and 12 Overt Familial Ethnic Socialization: 1, 2, 6, 7, and 9 Shakha Ethnic Socialization: 19, 20, 21, 22, and 23 Ethnic Pride Socialization: 13, 14, 15, 16, 17, and 18
Items were adopted and adapted to ask about the effect of shakha on socialization.

50
Appendix C
Child - Language Proficiency
Please rate between 1 and 5 (1=not at all, 5=very much) how well you know your ethnic language and English.
1. How well do you speak your ethnic language? 2. How well do you understand your ethnic language? 3. How well do you write your ethnic language? 4. How well do you read your ethnic language? 5. How well do you speak English? 6. How well do you understand English? 7. How well do you write in English? 8. How well do you read in English?

51
Appendix D
Child – Ethnic Peer Interaction
Please rate between 1 and 5 (1=not at all, 5=very much) how much you agree with the following statements.
1. Most of my friends are from my ethnic group. 2. In my spare time, I hang out with people from my ethnic group that do not go to
shakha. 3. In shakha, I enjoy spending time with people my age. 4. In my spare time, I hang out with friends from shakha. 5. At school, I hang out with people from my ethnic group. 6. Most of my friends are not part of my ethnic group. 7. I enjoy hanging out with people from my ethnic group. 8. I would like to spend more time with people from my ethnic group. 9. I spend more time hanging out with friends in my ethnic group than friends not
part of my ethnic group. Behavior: 1, 2, 4, 5, 6 (reversed), and 9 Attitude: 3, 7, and 8

52
Appendix E
Child - Culture Knowledge (Gim Chung et al., 2004)
Please rate between 1 and 5 (1=not very much, 5=very much) how much you know about your ethnic culture.
1. How much do you know about the culture and traditions of your ethnic group? 2. How much do you know about the history of your ethnic group? 3. How much do you actually practice the traditions and keep the holidays of your
ethnic group?
53
Appendix F
Child – Acculturation Index (Ward & Kennedy, 1994)
Please rate between 1 and 5 (1=mostly ethnic culture, 3=both, 5=mostly American culture) how similar your behaviors are to your ethnic culture or American culture.
1. Are your food habits similar to those of people from your ethnic culture or American culture?
2. Are your religious beliefs similar to those of people from your ethnic culture or American culture?
3. Are your recreational activities similar to those of people from your ethnic culture or American culture?
4. Are your family life customs similar to those of people from your ethnic culture or American culture?
5. Are your values similar to those of people from your ethnic culture or American culture?
6. Are your cultural activities similar to those of people from your ethnic culture or American culture?
7. Are your language habits similar to those of people from your ethnic culture or American culture?
8. Are your social customs similar to those of people from your ethnic culture or American culture?

54
Appendix G
Child - Three-Factor Model of Social Identity (Cameron, 2004)
Please rate between 1 and 5 (1=strongly disagree, 2=disagree, 3=neutral, 4=agree, 5=strongly agree) how well the following statements describe you.
1. I have a lot in common with other people of my group. 2. I really “fit in” with other people of my group. 3. In a group of my peers I really feel that I belong. 4. I don’t feel a sense of being “connected” with other people of my group. 5. I have a lot in common with other American people (members not part of my
group). 6. I really “fit in” with other American people (members not part of my group). 7. In a group of American people I really feel that I belong (members not part of my
group). 8. I don’t feel a sense of being “connected” with other American people (members
not part of my group). 9. Overall, being a member of my group has very little to do with how I feel about
myself. 10. In general, being a member of my group is an important part of my self-image. 11. I am not usually conscious of the fact that I am a member of my group.
Ingroup Ties: 1, 2, 3, and 4 (reversed) Outgroup Ties: 5, 6, 7, and 8 (reversed) Centrality of Ingroup: 9 (reversed), 10, and 11 (reversed) Cameron’s ingroup affect subscale was omitted. The outgroup ties subscale was modified from the ingroup ties subscale to ask about the perceived connection to the American people (not members of the ethnic group).

55
Appendix H
Child – Organization Open-Ended
1. How long have you been going to shakha? 2. Why do you go to shakha? 3. What do you like most about shakha? 4. What do you like least about shakha? 5. In general, do you enjoy going to shakha?

56
Appendix I
Parent – Familial Ethnic Socialization Measure (Umaña-Taylor et al., 2004)
Please rate between 1 and 5 (1=not at all, 5=very much) how much you agree with each of the following statements.
1. I teach my child about our ethnic/cultural background. 2. I encourage my child to respect the cultural values and beliefs of our
ethnic/cultural background. 3. My family participates in activities that are specific to my ethnic group. 4. Our home is decorated with things that reflect our ethnic/cultural background. 5. The people who my family hangs out with the most are people who share our
same ethnic background. 6. I teach my child about the values and beliefs of our ethnic/cultural background. 7. I talk to my child about how important it is to know about our ethnic/cultural
background. 8. My family celebrates holidays that are specific to our ethnic/cultural background. 9. I teach my child about the history of our new ethnic/cultural background. 10. My family listens to music sung or played by artists from our ethnic/cultural
background. 11. My family attends things such as concerts, plays, festivals, or other events that
represent our ethnic/cultural background. 12. My family feels a strong attachment to our ethnic/cultural background. 13. I teach my child to be happy as a member of our ethnic group. 14. I teach my child to be proud of our ethnic group and its accomplishments. 15. I teach my child to feel good about our cultural or ethnic background. 16. Shakha teaches my child about our ethnic/cultural background. 17. Shakha teaches my child to respect the cultural values and beliefs of our
ethnic/cultural background. 18. Shakha teaches my child about the values and beliefs of our ethnic/cultural
background. 19. Shakha teaches my child about how important it is to know about our
ethnic/cultural background. 20. Shakha teaches my child about the history of our ethnic/cultural background. 21. Shakha teaches my child to be happy as a member of our ethnic group. 22. Shakha teaches my child to be proud of our ethnic group and its accomplishments. 23. Shakha teaches my child to feel good about our cultural or ethnic background.
Covert Familial Ethnic Socialization: 3, 4, 5, 8, 10, 11, and 12 Overt Familial Ethnic Socialization: 1, 2, 6, 7, and 9 Shakha Ethnic Socialization: 19, 20, 21, 22, and 23 Ethnic Pride Socialization: 13, 14, 15, 16, 17, and 18 Scale was modified from the child items to ask the same items to parents.

57
Appendix J
Parent – Acculturation Index (Ward & Kennedy, 1994)
Please rate between 1 and 5 (1=mostly ethnic culture, 3=both, 5=mostly American culture) how similar your behaviors are to your ethnic culture or American culture.
1. Are your food habits similar to those of people from your ethnic culture or American culture?
2. Are your religious beliefs similar to those of people from your ethnic culture or American culture?
3. Are your recreational activities similar to those of people from your ethnic culture or American culture?
4. Are your family life customs similar to those of people from your ethnic culture or American culture?
5. Are your values similar to those of people from your ethnic culture or American culture?
6. Are your cultural activities similar to those of people from your ethnic culture or American culture?
7. Are your language habits similar to those of people from your ethnic culture or American culture?
8. Are your social customs similar to those of people from your ethnic culture or American culture?

58
Appendix K
Parent – Organization Motivation
Please rate between 1 and 5 (1=not at all, 5=very much) how much you agree with the following items.
1. I attend shakha because it provides a place for my child to learn my native language.
2. I attend shakha because it provides a place for my child to interact with similar kids.
3. I attend shakha because it provides a place for my child to learn about my ethnic culture.
4. I attend shakha because I enjoy spending time with people there. 5. I attend shakha because it is satisfying. 6. I attend shakha because I learn new things. 7. I attend shakha because my friends go. 8. I attend shakha because I want my kids to learn new things. 9. I attend shakha because I feel obligated to go. 10. I attend shakha because I enjoy spending time with my child. 11. I attend shakha because it gives me a chance to interact with other parents of my
ethnic or cultural group. 12. I attend shakha because I think it is something parents should do. 13. I attend shakha because I think it is important to maintain my culture in America.
59
Appendix L
Parent – English Proficiency
Please rate between 1 and 5 (1 = not at all, 5 = very well) how well you know English.
1. How well do you speak English? 2. How well do you understand English? 3. How well do you write in English? 4. How well do you read in English?

60
Appendix M
Parent – Organization Open-Ended 1. Why do you take your kids to shakha? 2. In general, do your kids enjoy going to shakha? 3. Sometimes do you have to convince your kids to go to shakha?
If so, what do you tell them? 4. How do you get them to go to shakha?

61
Appendix N
Parent - Demographics and General Information Age of child: Gender of child: M F Child’s place of birth (Country):
If not born in the US, at what age did the child come to the US? If not born in the US, how many years has the child been living in the US? Mother’s place of birth (Country):
If not born in the US, at what age did the mother come to the US? If not born in the US, how many years has the mother been living in the US?
Father’s place of birth (Country):
If not born in the US, at what age did the father come to the US? If not born in the US, how many years has the father been living in the US?
In terms of ethnic group, I consider myself to be __________________________ How long has your family been part of HSS? Do you have a responsibility in shakha? Y N
If so, what is it? ________________________________

62
SHIVANI DESAI Curriculum Vitae
EDUCATION Wake Forest University, Winston-Salem, NC M.A. in Psychology 2011-2013 GPA 3.54 University of North Carolina at Chapel Hill, Chapel Hill, NC B.S. in Psychology 2007-2011 Major GPA 3.79 Overall GPA 3.63 AWARDS AND ACHIEVEMENTS Dean’s List 2007-2011 Graduated Cum Laude 2011 RESEARCH EXPERIEINCE Graduate Master’s Thesis – Dr. Deborah Best, Wake Forest University
- Explored the relationship between participation in an ethnic cultural organization and ethnic identity development.
Child Memory Lab – Dr. Peter Ornstein, UNC-Chapel Hill - Coded and transcribed various child memory tasks as part of the Durham Study.
PROFESSIONAL PRESENTATIONS Desai, S., & Best, D. L. (2013, February). Congruence of beliefs of immigrant
parents and children. Presentation at 42nd annual meeting of the Society for Cross-Cultural Research, Mobile, AL.
Desai, S., & Best, D. L. (2012, May). Congruence of beliefs of immigrant parents and children. Presentation to the Wake Forest Psychology Department, Wake-Forest University, Winston-Salem, NC.
TEACHING EXPERIENCE Wake Forest University, Winston-Salem, NC Lab Instructor for “Research Methods and Statistics II” 2011-2013 Independently instructed a lab section of 12-16 students a semester, collaborated with
lecture professor on exam development, met with students upon request, and graded all lab work and exams.

63
UNC- Chapel Hill, Chapel Hill, NC Recitation Leader for Introductory Psychology Course 2011 Independently lead recitation sections, plan activities to engage students in the course
material, meet regularly with lecture professor to discuss teaching style and methodology