effects of geocoding quality on predictive crime hotspot mapping paul zandbergen department of...
TRANSCRIPT
Effects of Geocoding Quality on Predictive Crime Hotspot Mapping
Paul ZandbergenDepartment of GeographyUniversity of New Mexico
Timothy HartDepartment of Criminal JusticeUniversity of Nevada, Las Vegas

Predictive Hotspot MappingTime Period 1 Time Period 2
Time periods can be years, seasons, months, weeks, shifts, etc.
?

NIJ Funded Project
• Project #: 2010-696J-00
• People: Timothy Hart, UNLV• Co-PI Paul Zandbergen, UNM• Other 2 graduate students
• Start date: February 2010• End date: January 2012

Research Questions
How reliable is predictive hotspot mapping?
• Which factors influence this reliability?• Which hotspot techniques are most reliable?• How sensitive are the results to data quality?

Factors Influencing Hotspot Robustness
• Type of crime• Time period• Urban morphology• Geocoding quality• Type of hotspot technique• Hotspot parameters

Measures of Hotspot Robustness
• Predictive Accuracy Index (PAI)– Ratio of hit rate to the area percentage– Measures predictive accuracy of hot spot– Higher values are better
• Recapture Rate Index (RRI)– Ratio of hot spot crime densities for periods 2 and 1– Standardized for change in total number of crimes– Higher values are better
• Source: Chainey et al. (2008), Levine (2008), and Van Patten et al. (2009)

Example Calculation – Assaults in Las Vegas
1,366 crimes in 2007overlay 1 km grid
1,035 km2 total area
653 crimes in 2007 within hotspot of 68 km2
1,531 crimes in 2008, of which 580 within hotspot
based on 2007 data
Predictive Accuracy Index = (580/1,531) / (68/1,035) = 5.77
Recapture Rate Index = (580/663) * (1,366/1,531) = 0.78
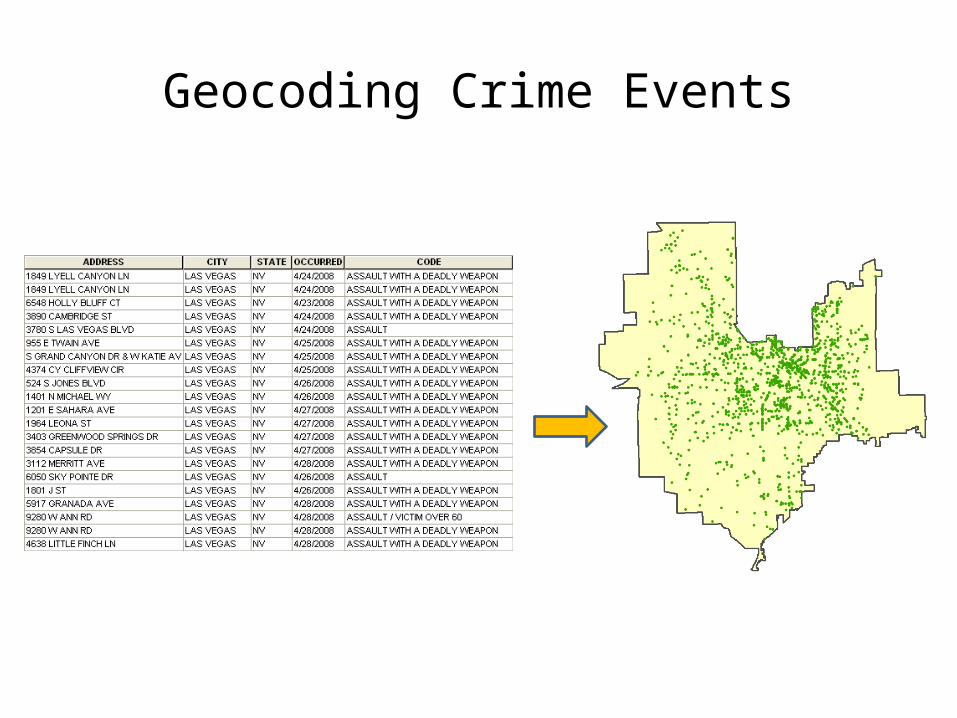
Geocoding Crime Events

Street Geocoding
701
700
799
798
End Offset (%)
Side Offset
747
1. Find the zone (ZIP, City, etc.)2. Match the street ( by Name, Type, Dir, etc.)3. Match the segment with the proper range4. Linear interpolation along segment5. Apply offsets
Main St

Geocoding Quality Issues
1. Match rate– % of events that geocoded reliably
2. Positional accuracy– Distance from the “true location”
3. Repeatability– Variability from different geocoding methods

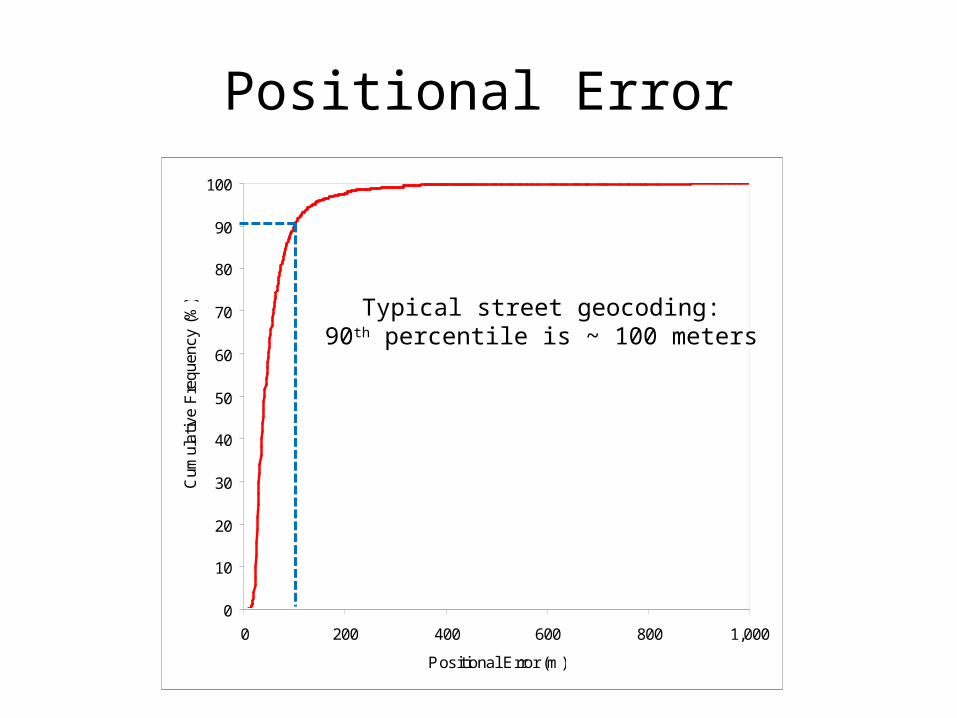
Positional Error

Positional Error
0
10
20
30
40
50
60
70
80
90
100
0 200 400 600 800 1,000
Positional Error (m)
Cum
ulat
ive
Fre
quen
cy (
%) Typical street geocoding:
90th percentile is ~ 100 meters

Research Design• Crime types:
– Assault, Auto theft, Burglary, Drugs, Homicide, Robbery
• Jurisdictions– Albuquerque, NM– Arlington, TX– Charlotte, NC– Las Vegas, NV– Seattle, WA– Tampa, FL
• Geocoding methods– Local street centerlines– TIGER 2009– ESRI StreetMap– 2 commercial services
• Use 2007 data to predict 2008

Hotspot Methods
Type Method Parameters
Aggregate Grid-based thematic Grid cell size, threshold
Aggregate Local Moran’s I Areal units
Point Kernel density Kernel type, bandwidth, threshold
Point Nearest neighbor hierarchical clustering Distance type, minimum events per cluster, ellipse vs. convex hull
Point Spatial and Temporal Analysis of Crime Search radius, minimum events per cluster, scan type

General Approach
Aggregation
Point Pattern Analysis
OR OR

Grid-based Thematic
10 class quintile classification highest class
2 km grid

Local Moran’s I Clusters
statistically significant high-
high cluster
2 km grid census tracts

Kernel Density

Nearest Neighbor Hierarchical Clustering

Spatial and Temporal Analysis of Crime

Las Vegas Dataset
Crime Type Count 2007 Count 2008
Assault 1,733 1,811
Auto Burglary 10,985 10,098
Auto Theft 16,444 11,486
Burglary 18,064 17,522
Homicide 124 133
Robbery 5,300 4,684
Drugs (calls for service) 10,953 10,954
Source: City of Las Vegas Police Department

Comparison of Robustness
Predictive Accuracy Index
Recapture Rate Index
Grid-based thematic 5.01 0.90
Local Moran’s I 4.80 0.92
Kernel density 7.19 0.87
Nearest neighbor hierarchical clustering 3.90 0.92
Spatial and Temporal Analysis of Crime 4.04 0.95
Using auto thefts in 2007 to predict auto thefts in 2008

Geocoding Match Rates (%)
Crime Type Local Street Centerlines ESRI StreetMap
Assault 80.0 73.4
Auto Burglary 82.9 76.8
Auto Theft 89.2 85.5
Burglary 90.0 85.7
Homicide 79.8 75.8
Robbery 79.9 66.5
Drugs (calls for service) 63.3 53.3

Geocoding Errors – Out-of-Date Street Network
Las Vegas burglaries 2007

Geocoding Errors – Positional Errors
Street Geocoded
Building/parcel Geocoded
Las Vegas burglaries 2007

Geocoding Errors – Spelling Issues
Las Vegas auto thefts 2007
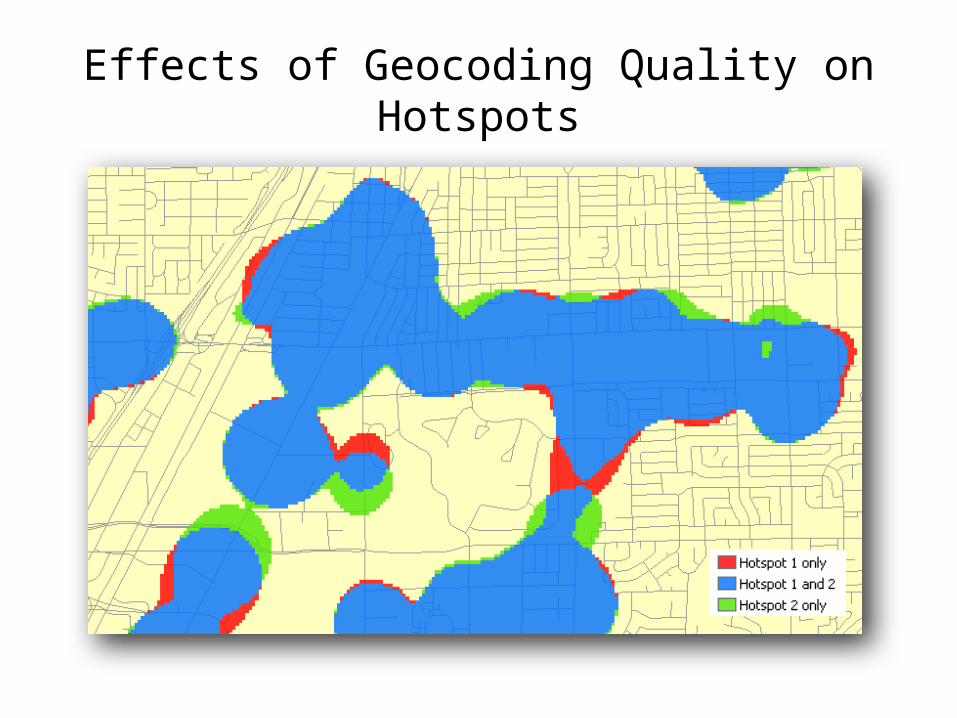
Effects of Geocoding Quality on Hotspots
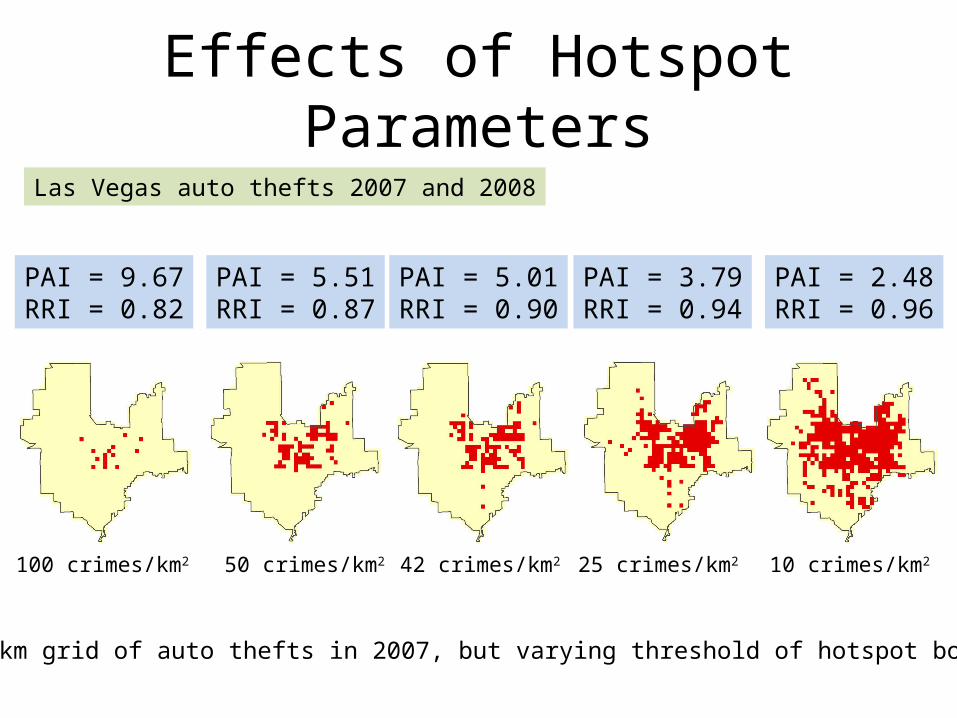
Effects of Hotspot Parameters
PAI = 2.48RRI = 0.96
PAI = 3.79RRI = 0.94
PAI = 5.01RRI = 0.90
PAI = 5.51RRI = 0.87
PAI = 9.67RRI = 0.82
Same 1 km grid of auto thefts in 2007, but varying threshold of hotspot boundary
100 crimes/km2 50 crimes/km2 42 crimes/km2 25 crimes/km2 10 crimes/km2
Las Vegas auto thefts 2007 and 2008

Effects of Hotspot Parameters

Conclusions
• Geocoding quality varies strongly by type of crime
• Effects geocoding quality can be substantial for local areas
• Differences between hotspot techniques can be substantial
• Effects of hotspot parameters on robustness is very strong

Next steps
• Additional geocoders
• Expand for all study areas, all crime types
• Consistent comparison of hotspot methods
• Guidelines for geocoding
