efficiency analysis of airports administered by infraero ... · only the state of acre was...
TRANSCRIPT

Applied Mathematical Sciences, Vol. 11, 2017, no. 25, 1221 - 1238
HIKARI Ltd, www.m-hikari.com
https://doi.org/10.12988/ams.2017.73107
Efficiency Analysis of Airports Administered by
Infraero from 2003 to 2013
Marcelo Driemeyer Wilbert
Campus Universitário Darcy Ribeiro, Faculdade de Economia Administração e
Contabilidade – FACE, 1º. Andar – Sala B1 23/4 – CEP: 70910-900 – Brazil
Brasília – DF
André Luiz Marques Serrano
Campus Universitário Darcy Ribeiro, Faculdade de Economia Administração e
Contabilidade – FACE, 1º. Andar – Sala B1 23/4 – CEP: 70910-900 – Brazil
Brasília – DF
Mikael Rocha Flores
Campus Universitário Darcy Ribeiro, Faculdade de Economia Administração e
Contabilidade – FACE, 1º. Andar – Sala B1 23/4 – CEP: 70910-900 – Brazil
Brasília – DF
Raissa Damasceno
Campus Universitário Darcy Ribeiro, Faculdade de Economia Administração e
Contabilidade – FACE, 1º. Andar – Sala B1 23/4 – CEP: 70910-900 – Brazil
Brasília – DF
Vithor Rosa Franco
Campus Universitário Darcy Ribeiro, Faculdade de Economia Administração e
Contabilidade – FACE, 1º. Andar – Sala B1 23/4 – CEP: 70910-900 – Brazil
Brasília – DF
Copyright © 2017 Marcelo Driemeyer Wilbert et al. This article is distributed under the Creative
Commons Attribution License, which permits unrestricted use, distribution, and reproduction in
any medium, provided the original work is properly cited.

1222 Marcelo Driemeyer Wilbert et al.
Abstract
The airline industry has earned over the years an important role in the process of
globalization and economic development at national and global level. Since public
resources are scarce and the industry demand is growing, the use of a tool that
analyzes the efficiency of public airports gives visibility to structural problems
and enables the mapping of strategies that seek to properly allocate the inputs
front of the terminal needs. The objective of this study is to measure and evaluate
the operational and financial efficiency of 63 public airports, administered by the
Brazilian Airport Infrastructure Company, through the Data Envelopment
Analysis Tool (DEA). In addition, to provide an overview of the sector over time,
data 2003-2013 are studied by using descriptive statistics. The results showed in
the operational analysis that only 12.7% of respondent terminals were efficient in
2010 and 11.1% in 2013. In the financial analysis were effective 9.5% of airports
in 2010 and 14.3% in 2013. The results also revealed the need for attention to the
sector in seeking to resolve bottlenecks and improve efficiency through
modernization, adequate investment in infrastructure and balance between income
and expenditure.
Keywords: Efficiency, Airports, Public Expenditure, Infrastructure, Data
envelopment analysis
1. Introduction
The globalization process has brought to the airline industry an
unprecedented importance in world economic history. It became responsible for
the international insertion of a country in the commercial, tourist and cultural flow
(Bettini & Oliveira, 2009). Because it is an elastic activity relative to income, as
economic growth increases, demand for air traffic increases to levels above
economic activity and aggregates growth itself, as a multiplying factor.
In Brazil, The Civil Aviation Secretariat (Secretaria de Aviação Civil -
SAC) and the National Civil Aviation Agency (Agência Nacional de Aviação
Civil - ANAC) are regulators of the sector. The Brazilian Airport Infrastructure
Company (INFRAERO) is responsible for managing public airports, which is the
target of this study. According to ANAC (2014), between 2004 and 2013, the
annual average growth in domestic passenger air transport demand 13.1% per
year, which represented more than 3.7 times the average growth of the Brazilian
Gross Domestic Product (3.5% per year), and more than 13 times the population
growth (1% per year). In the same period, the number of flights performed grew
83.1% in the domestic market and 68% in the international market. According to
ANAC (2014), it is necessary for Brazilian airports to correct their inefficiencies
in order to meet the demand growth and the needs for improve quality in the
services provided.
In addition, investments can make it possible to improve the efficiency of
airport terminals and can cooperate for positive public accounts results.

Efficiency analysis of airports administered by Infraero… 1223
Productivity gains and better use of assets lead to the airport administration
system with self-sufficiency, with revenues at an adequate level, financing its
current operations and the expansion of its operational and financial capacity,
without injecting public resources. According to the authors above, given the
growth projected for the sector, investments will be required by 2030 to increase
the current capacity of airports by 2.4 times, or from 130 million to 310 million
passengers per year, equivalent to nine airports of Guarulhos a city situated in São
Paulo. According to surveys conducted by IPEA (2011), from 2003 to 2010
Infraero made only 44% of the investment projected for its airports in this period.
Therefore, the objective of this article is to measure and evaluate the
efficiency of the airports managed by Infraero from operational and financial data
using the Data Envelopment Analysis (DEA) tool, determining efficient airports
and critical situation. It is expected that this article will give visibility to the need
to improve operations in terminals, to properly allocate investments and obtain
economic-financial solvency. Avoiding that airports with results with surpluses
suffer to supply the results of other deficit airports.
This article is organized as follows: The first section presented the
introduction to the topic, with information about the sector and the problem to be
studied; Section 2 presents the state of the art, including analysis of the recent
panorama of the Brazilian airport industry and exhibitions on public airport
concessions and on the efficiency of public spending; In section 3, the
methodology used in the production of descriptive statistics and in the
measurement of the data by means of the Data Envelopment Analysis method; In
Section 4, the results obtained through the chosen methodology are presented and
explored, finally in section 5, the final considerations are presented, which have
final clarifications and research indications to be made to continue the project
developed here.
2. Theoretical Reference
According to IPEA (2010), the growth in demand in the Brazilian airline
industry in recent years has not been accompanied by long-term planning,
consolidated public policies, correct regulation of the competitive market and
improvement in deficiencies in airport infrastructure. Adding the problems with
quality of service provided to the end user. Faced with this reality, the challenges
for maximizing efficiency, productivity and social benefits for society, along with
minimizing costs, are clear.
The discussion of efficiency in public management was carried out using
the Data Envelopment Analysis method, by several authors, such as Peña (2008)
and Silva et al. (2014). Penan (2008), in an applied study evaluating the efficiency
of Public Administration, observes that it is possible to define the inefficient units
and the necessary changes in the inputs and/or products in order to make them
efficient. Table 1 provides a brief summary of the research covered in this
theoretical framework, highlighting the following points: geographical scope,
objective, data, method and main conclusions.

1224 Marcelo Driemeyer Wilbert et al.
Table 1 - Summary of Literature Review
Article Objective Method Main Conclusions
Silva et al.
(2014)
Analyze the efficiency
of total investment
expenditures.
Data Envelopment
Analysis
Only the State of Acre was efficient, in the
two models used, with no other efficient in
the CCR model. In the BCC model, there
are five States, including Acre, efficient:
Espírito Santo, Piauí, Ceará and Maranhão.
Ribeiro
(2008)
Evaluate the efficiency
of public spending in
Brazil.
Composite index to
measure the
performance of
public services,
confronted by data-
wrapping analysis
and truncated
regression.
Costa Rica, Uruguay, and Chile obtained
the best results for the performance of
services and for the efficiency of public
spending. In the specific case of Brazil, the
result was around the average in the
evaluation of the public services and below
the average in the efficiency of the
expenses.
Pacheco,
Fernandes
e Santos
(2006)
To study the impacts of
the changes in the
management of Infraero
on the performance of
the airports
administered by it from
1998 to 2001.
Data Envelopment
Analysis
In financial terms efficiency improved from
77% to 80%, from 1998 to 2001; In the
operational aspect there was deterioration in
the performance of the movement of
passengers and cargo.
Pathomsiri
et al.
(2008)
To evaluate the
productivity of 56
airports in the United
States of America from
2000 to 2003
Data Envelopment
Analysis
He highlighted the importance of
examining undesirable outputs in
determining the relative productivity of
airports.
Sarkis
(2000)
Evaluate operational
efficiency.
Data Envelopment
Analysis
In the CCR model, there is an upward trend
for 1990-1992, then a fall in 1993,
accompanied by a recovery in 1994. In the
BCC, average efficiency figures showed a
continuous increase over each year, except
for In 1993 and resumed in 1994.
Bergiante,
Mello e
Santo Jr.
(2011)
Determine if the
investments forecasted
at Brazilian airports for
the 2014 World Cup
and the 2016 Olympic
Games are adequate to
the demand.
Data Envelopment
Analysis
Large dispersion between investments,
supply, demand and efficiency in the
analyzed airports.
Almeida e
Mariano
(2007)
Evaluate operational
efficiency.
Data Envelopment
Analysis There was only one airport 100% efficient.
3. Methodology
This is a qualitative and at the same time a quantitative research, the period
analyzed was four years, from 2010 to 2013. In this way, will be carried out the
evaluation of the efficiency of 63 public airports, which have not yet been
granted. This analysis will be done using the Data Envelopment Analysis - DEA
method. In addition, to provide an overview of the industry over time, data from

Efficiency analysis of airports administered by Infraero… 1225
2003 to 2013 are used descriptive statistics. Infraero organizes the operational
data. Based on information provided by the airlines and available in the
Operational Statistical Yearbooks at Infraero, referring to the airports
administered by the company. The data analyzed here can present the degree of
reliability impaired after Resolution nº 8/ANAC/2007 in which it revokes the
Administrative Rule of the Aeronautics Command nº602/GC5/2000 that
established, in its article 7, the obligation to send data by the airlines to the
airports, these being passed on to Infraero. Given this, it is possible that, from
2007 there are incomplete data and not demonstrating the totality of the actual
movements.
The main operational data used in this work are: passenger handling,
domestic and international; air cargo handling, domestic and international; and
postal, domestic and international mail handling, as can be seen in Table 2.
Table 2 - List of operational variables used
Name Description Unit of measure
Passenger Handling,
Domestic and international.
Boarding and disembarkation (origin and
destination), on domestic and international
flights, combined passengers and military
passengers are excluded.
In thousands
Air cargo handling,
Domestic and international.
Circulation of air cargo in domestic and
international flights, referring exclusively,
according to Infraero, the hold cargo.
In 1000 tons
Mail order handling - post office,
domestic and international. Circulation of postcards (Post Office). In 1000 tons
Source: Own elaboration based on Infraero (2003 to 2013).
The analysis comprises data from 63 airports managed by Infraero
between 2003 and 2013, excluding all movements in the airports of
Viracopos/Campinas-SP, Guarulhos-SP and Brasília-DF. This action was taken
after finding that the data provided by Infraero in 2013 no longer presented the
information of those airports due to the concession to the private sector, and the
use of its data in years prior to 2013 would compromise any historical series,
causing a misinterpretation about the evolution of the air sector. That is, the
analyses made in this work do not cover all the airports with regular aviation
present in Brazil. The financial data used in this article, produced and made
available by ANAC, refer to the 63 (sixty-three) airports administered by Infraero
in the years 2010 to 2013 and are derived from the Airports Operational
Performance Reports for the years 2010 to 2012, and the Infraero Airports
Financial Report for 2013, which changed its name this year due to concessions in
2012. As the 2013 report no longer contained data from Viracopos/Campinas-SP
airports, Guarulhos -SP and Brasília-DF, the information for these airports was
excluded from previous years, 2010 to 2012, for the same reasons presented for
the operational data in the previous item.
The main financial variables analyzed in this research are: total cost,
income from unregulated activities and revenue from regulated activities, as

1226 Marcelo Driemeyer Wilbert et al.
shown in Table 4. The total costs include administrative, financial, operational,
depreciation and remuneration of the Union's assets, since art.38 of the Brazilian
Code of Aeronautics (BRASIL, 1986). Which establishes that airports constitute
universals, assimilated to federal public goods; according with this, assets related
to airport infrastructure are owned by the Union and their remuneration of 6% per
annum calculated on the difference between the net acquisition value and the
accumulated depreciation of the asset represents the cost of the capital invested.
Revenues from non-regulated activities are those derived from activities
that do not have tariff regulation and therefore generate alternative revenues. Such
as those derived from the operation of the commercial activity (restaurants, bars,
bookstores, for example), financial gains and other unregulated services.
Revenues from regulated activities are derived from the tariffs charged for the
provision of passenger boarding, landing and aircraft servicing, and air cargo
storage and cargo handling at each airport.
Table 3 - List of financial variables used
Name Description Unit of measure
Total cost
They cover the administrative, financial, operational,
depreciation and remuneration of Union assets. In thousands
Revenue from
unregulated
activities
They come from activities that do not have tariff
regulation, such as those arising from the exploitation of
commercial activity, financial gains, among others.
In thousands
Revenue from
regulated activities
Fees charged for the provision of passenger boarding,
landing and aircraft maintenance services, and air cargo
storage and capitation, at each airport.
In thousands
Source: Prepared by the authors based on ANAC (2013).
The variables values of the years 2010 to 2012 were updated by the IGP-
DI (IPEA) and brought to the price level of the data series of 2013. This price
index was chosen because it is a weighted average of IPA (60%), IPC (30%) and
INCC (10%), being a macroeconomic indicator that represents the evolution of
the price level of agricultural and industrial raw materials, intermediate products
and final goods and services.
For better compression of this tool to be used in this research, it is
necessary to clarify the concepts of effectiveness, efficiency and productivity.
Efficacy is related to the result obtained, without considering the resources and
efforts that were employed. That is, the production unit reaching its production
goal. Efficiency is a relative concept, it is concerned with the resources being used
and what could have been done with the same inputs. Productivity is the quotient
between what was produced and what was needed to produce, arising from
decision-making that maximizes resource utilization. From this, the producing
unit is called the Decision Making Unit - DMU.
The efficiency of the DMUs, considering Data Envelopment Analysis, is
defined by the inputs used and the outputs that are generated. A non-efficient unit
can become efficient in two ways: reducing resources, keeping products constant

Efficiency analysis of airports administered by Infraero… 1227
(input-oriented), in the minimum required inputs to have the same output. Or
increasing products, keeping inputs constant (output-oriented), or what dealing
with the same resources could have produced.
The tool has basically two methods of analysis, the Constant Returns to
Scale (CRS) model and the Variable Returns to Scale (VRS) model. The constant
scale returns (CRS) model, initially presented by Charnes et al. (1978), works
with a nonparametric linear surface, that is, any variation in the inputs produces
equal variation in the outputs. The model determines the efficiency by optimizing
the division between the weighted sum of the outputs and the weighting sum of
the inputs. In homage to the authors, the model of constant returns of scale is also
known by the acronym CCR.
On the other hand, the model of variable returns of scale (RSV) presented
by Banker et al. (1984), in which any variation in the inputs does not produce
equal variation in the outputs. It replaces proportionality between inputs and
outputs by convexity, that is, the efficient boundary is a concavity, unlike the
previous model. Also in homage to the authors, the model of variable returns of
scale is also known by BCC. In the present paper we have chosen to use the BCC
model. Since it considers variable returns and will be able to better explain the
efficiency of a population that contains large and small airports, either
operationally or financially.
In the BCC model, the efficiency of the DMU is represented by the
following equations, in which Effo is the efficiency of the DMUo, however it is
given by the inverse of Effo and represented by the variable ho (ho = 1/Effo), ho
being indicative of how much all products should be multiplied, keeping resources
constant, aiming for DMUo to reach the efficient border. The variables vi and uj
are the weights of the inputs i (i=1, ..., r) and outputs j (j=1, ..., s); xik and yjk are
the inputs i and outputs j of the DMU k, (k=1, ..., n); xio and yio are the inputs and
outputs of the DMU, respectively. Equation (01) indicates orientation to inputs
and (02) orientation to outputs:
(01) Minimize ho , subject to
ℎ𝑜𝑥𝑖𝑜 − ∑ 𝑥𝑖𝑘𝜆𝑘 ≥ 0, ∀𝑖𝑛𝑘=1 ; −𝑦𝑗𝑜 + ∑ 𝑦𝑗𝑘𝜆𝑘 ≥ 0, ∀𝑗𝑛
𝑘=1 ; ∑ 𝜆𝑘 = 1𝑛𝑘=1
𝜆𝑘 ≥ 0, ∀𝑘
(02) Maximize ho, subject to
𝑥𝑖𝑜 − ∑ 𝑥𝑖𝑘𝜆𝑘 ≥𝑛𝑘=1 0, ∀𝑖; −ℎ𝑜𝑦𝑗𝑜 + ∑ 𝑦𝑗𝑘𝜆𝑘 ≥ 0, ∀𝑗𝑛
𝑘=1 ; ∑ 𝜆𝑛𝑘=1 = 1
𝜆𝑘 ≥ 0, ∀𝑘
Transformed into a dual linear programming (PPL) problem, in which 𝑣∗
and 𝑢∗ are conditioned dual variables ∑ 𝜆𝑘 = 1𝑛𝐾=1 , we have:
(03) Inputs-oriented: Maximize
𝐸𝑓𝑓𝑜 = ∑ 𝑢𝑗𝑦𝑗𝑜𝑠𝑗=1 + 𝑢∗, Subject to

1228 Marcelo Driemeyer Wilbert et al.
∑ 𝑣𝑖𝑥𝑖𝑜𝑟𝑖=1 = 1; − ∑ 𝑣𝑖𝑥𝑖𝑘
𝑟𝑖=1 + ∑ 𝑢𝑗𝑦𝑗𝑘
𝑠𝑗=1 + 𝑢∗ ≤ 0, ∀𝑘; 𝑣𝑖 , 𝑢𝑗 ≥ 0, 𝑢∗ ∈ ℜ
(04) Output-oriented: Minimize
𝐸𝑓𝑓𝑜 = ∑ 𝑣𝑖𝑥𝑖𝑜𝑟𝑖=1 + 𝑣∗, Subject to
∑ 𝑢𝑗𝑦𝑗𝑜𝑠𝑗=1 = 1; − ∑ 𝑣𝑗𝑥𝑖𝑘
𝑟𝑖=1 + ∑ 𝑢𝑗𝑦𝑗𝑘
𝑠𝑗=1 + 𝑣∗ ≤ 0, ∀𝑘; 𝑣𝑖, 𝑢𝑗 ≥ 0, 𝑢∗ ∈ ℜ
The BCC model, as mentioned before, was used in this work, in which it is
intended to use the minimum resources given a fixed level of products. The
orientation was chosen after the variables of airport revenues, passenger
movements, cargo and mail boxes, domestic and international, had inherent
characteristics and variations not related to the air sector, but to market and
geographic conditions, such as inflation, levels Income, exchange, locality, among
others. The same thinking was developed for the choice of input orientation in the
work of Castro and Loureiro (2013), which measured the efficiency of the 66
Brazilian airports operated by Infraero with data from the years 2010 and 2011.
It was used the SIAD software, which means Integrated Decision Support
System, version 3.0, developed and made available by researchers from the
Federal Fluminense University - UFF (Mello et al., 2005). The software measures
efficiency through Data Envelopment Analysis, using linear programming. The
data analyzed in the program refer to the years 2010 and 2013 and are segregated
into operational and financial. For the operational analysis, the total costs and as
outputs were the sum of the domestic and international passenger movement
(output1) and the sum of the movement of air cargo and postal mail, domestic and
international (output2). For the financial analysis, the total costs were used as
input, and as outputs the revenues of unregulated activities (output1) and revenues
from regulated activities (output2).
Four efficiency analyzes were carried out, two for operational efficiency,
for the years 2010 and 2013, and two for the financial year, of the same years.
After that, and considering that in all the analyzes the same set of 63 airports were
used and always the same variables, it was possible to identify which airports
reached the efficient border. That is, the maximum value of the index, in 2010 and
later in 2013 In addition, it was also possible to compare the results obtained for
the year 2010 to 2013, obtaining the variations of the indices of each of the
terminals and identifying who maintained it, improved or worsened efficiency. It
is worth mentioning that such analyzes allow visibility to bottlenecks and help in
making decisions that will improve the airport infrastructure and the quality of
services provided to its users.
4. Data Analysis
Graph 1 shows the number of passengers flown annually on board and
disembark (origin and destination), on domestic and international flights, together
with passengers in connection with and excluding those on military flights.

Efficiency analysis of airports administered by Infraero… 1229
Graph 1 – Annual passenger movements (2003 - 2013)
Source: Prepared by the authors based on data from Infraero (2003 to 2013).
According to the previous graph, it was verified that, between 2003 and
2013, there was a 160.3% growth in total movement, with a 163% evolution in
domestic movement and 118% in international movement, with participation in
the total of 5.8% in 2003 and 4.8% in 2013. The standard deviation in the
international circulation is higher than in the domestic one. Taking as a base the
year 2013, it is possible to perceive that 70.4% of the international movement and
38% of the national movement are concentrated in four airports of the Southeast
region.
Graph 2 shows the movement of air cargo in domestic and international
flights, referring exclusively, according to Infraero, the cargo of hold.
Graph 2 - Annual Air Cargo Movement
Source: Prepared by the authors based on data from Infraero (2003 to 2013).
Between 2003 and 2013, there was a growth of 16.8% in total turnover,
with a 12% increase in domestic and 31.5% in international traffic, with a share of
24.5% in 2003 and 27, 6% in 2013. In general, Graph 02 shows a constant
movement, with a standard deviation, in the international air cargo transport,
presenting values more pronounced than in domestic transport. Taking as a
parameter the year 2013, it is possible to notice that the Galeão-RJ Airport
represents 44.1% of the international traffic and the Airport of Manaus-AM
26.5% of the national, considering only the set of airports studied.
The movements of postal and mail, domestic and international, from 2003
to 2013, in which there was a 19.8% reduction in total turnover, with a drop of
20.3% in domestic movements and 6,7% in the international market, with a share
of 3.9% in 2003 and 4.6% in 2013. There is a positive movement in 2006 and 2007, driven by a seasonal increase in postal mail at the airport of Salvador/BA, with

1230 Marcelo Driemeyer Wilbert et al.
growth in total participation from 2005 to 2006, from 10.9% to 26%, Manaus/AM
airport, with an increase in total participation from 2006 to 2007, from 4.8% to
23%, 1% in domestic aviation and from 12.5% to 86.8% in international, without
significant relocation of other airports to them.
Graph 3 shows the sum of the annual movements of airfreight and postal
mail, respectively, in domestic and international, in order to better demonstrate the
information regarding the circulation of material elements between the years 2003
and 2013.
Graph 3 - Annual Air Cargo + Bad Mail
Source: Prepared by the authors based on data from Infraero (2003 to 2013).
In the years 2003 to 2013, there was a 9.5% increase in total turnover, with
a 4.3% increase in domestic and 30% in international traffic, with a share of
20.4% in 2003 and 24.3% % in 2013. When compared to the number of passenger
movements, it can be seen that freight traffic and postal mail have grown at a
much lower level. Based on the financial data of the 63 airports managed by
Infraero, it can be seen that from 2010 to 2013, total costs increased by 31.1%,
regulated revenues grew by 36.3% and unregulated revenues by 41.3%. In the
four years analyzed, the average value of total costs was R$ 3 billion, of regulated
revenues of R$ 1.4 billion, with a share of total revenue of 57.4% in 2013, and for
unregulated revenues was 1 billion, with a share of total revenue in 2013 of
42.6%.
In all the years analyzed in this study, the standard deviation was high, that
is, there are airports that, due to their size and high traffic, have a greater influence
on total costs and revenues compared to smaller airports that have low activity.
The discrepancy is evidenced by the fact that, in 2013, only 20% of the airports
analyzed accounted for approximately 70% of total costs and 80% of total
revenues.
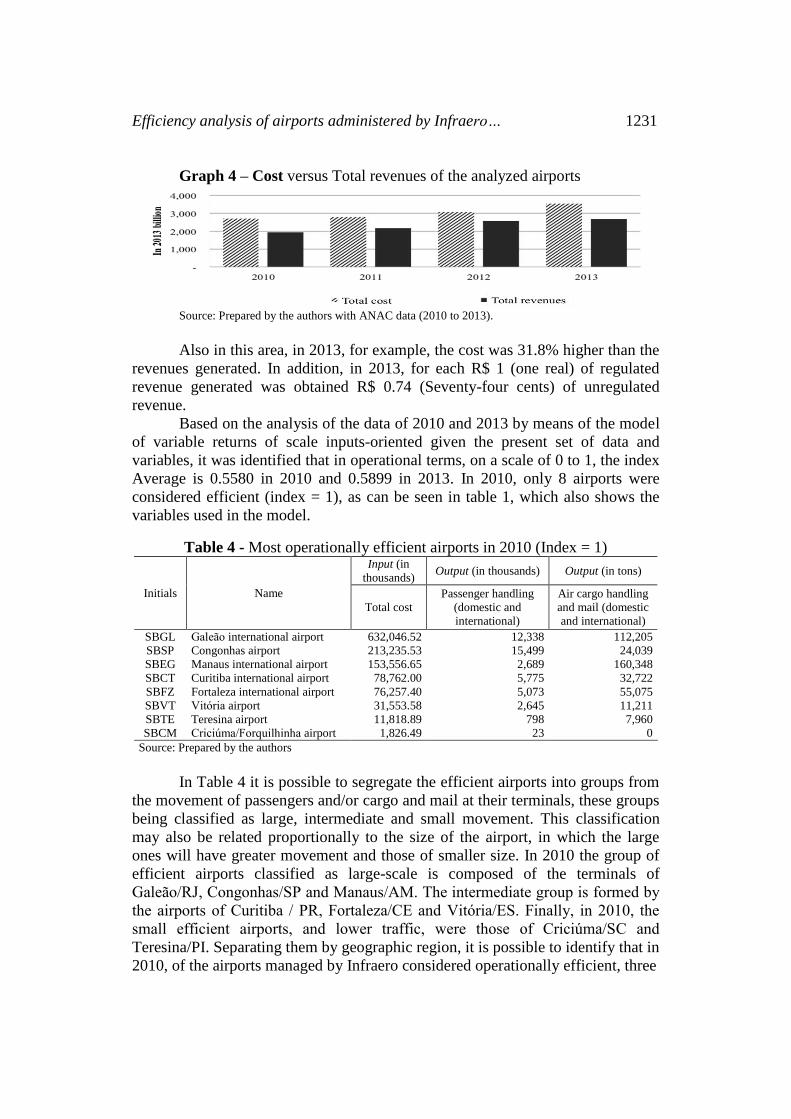
It can be seen, according to Graph 4, that total costs in all years exceed the
total revenues that airports generate. Evidencing an imbalance between revenue
and expenditure and requiring, on the part of the Union, capital contributions and
incremental investments to sustain the continuity of operation of these airports.
The airport that had the best situation, with financial balance, revenues equal to or
greater than the costs, and remained thus, in the four years, was the airport of
Curitiba-PR. The airport that presented the worst situation for the four years
studied, with the cost around 26 times higher than the revenue in 2013, was that of
Uruguaiana-RS.
Efficiency analysis of airports administered by Infraero… 1231
Graph 4 – Cost versus Total revenues of the analyzed airports
Source: Prepared by the authors with ANAC data (2010 to 2013).
Also in this area, in 2013, for example, the cost was 31.8% higher than the
revenues generated. In addition, in 2013, for each R$ 1 (one real) of regulated
revenue generated was obtained R$ 0.74 (Seventy-four cents) of unregulated
revenue.
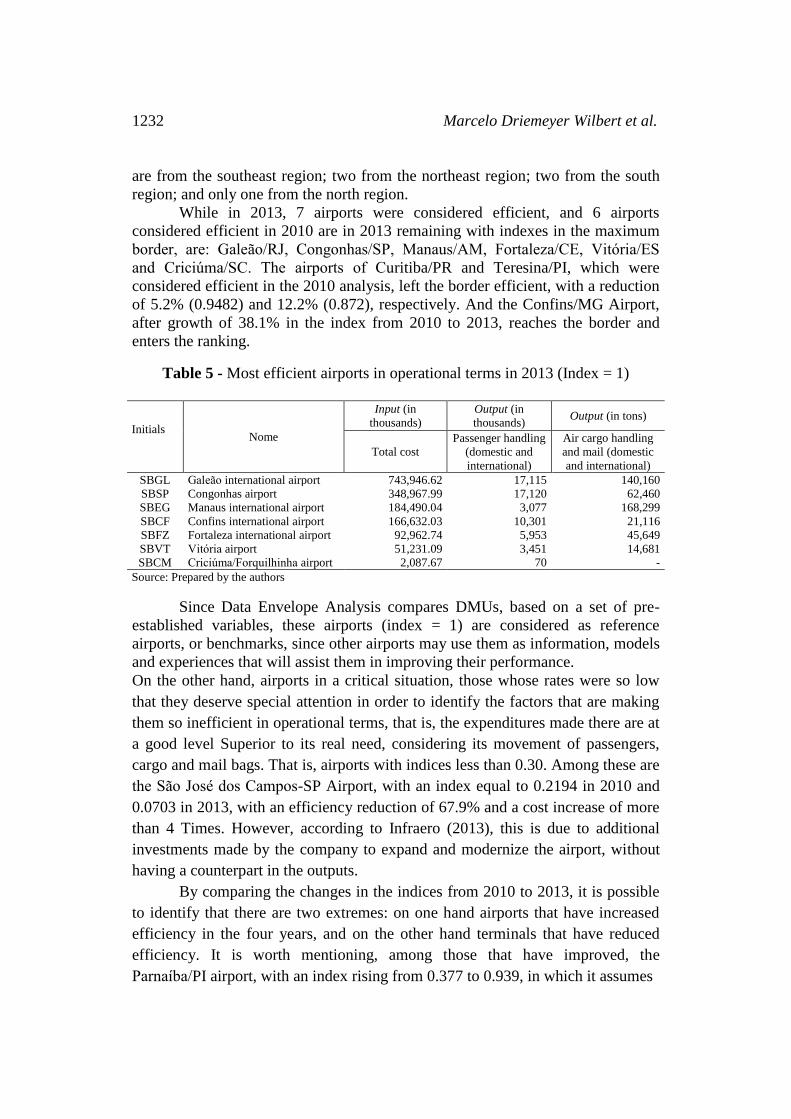
Based on the analysis of the data of 2010 and 2013 by means of the model
of variable returns of scale inputs-oriented given the present set of data and
variables, it was identified that in operational terms, on a scale of 0 to 1, the index
Average is 0.5580 in 2010 and 0.5899 in 2013. In 2010, only 8 airports were
considered efficient (index = 1), as can be seen in table 1, which also shows the
variables used in the model.
Table 4 - Most operationally efficient airports in 2010 (Index = 1)
Initials
Name
Input (in
thousands) Output (in thousands) Output (in tons)
Total cost
Passenger handling
(domestic and
international)
Air cargo handling
and mail (domestic
and international)
SBGL Galeão international airport 632,046.52 12,338 112,205
SBSP Congonhas airport 213,235.53 15,499 24,039
SBEG Manaus international airport 153,556.65 2,689 160,348
SBCT Curitiba international airport 78,762.00 5,775 32,722
SBFZ Fortaleza international airport 76,257.40 5,073 55,075
SBVT Vitória airport 31,553.58 2,645 11,211
SBTE Teresina airport 11,818.89 798 7,960
SBCM Criciúma/Forquilhinha airport 1,826.49 23 0
Source: Prepared by the authors
In Table 4 it is possible to segregate the efficient airports into groups from
the movement of passengers and/or cargo and mail at their terminals, these groups
being classified as large, intermediate and small movement. This classification
may also be related proportionally to the size of the airport, in which the large
ones will have greater movement and those of smaller size. In 2010 the group of
efficient airports classified as large-scale is composed of the terminals of
Galeão/RJ, Congonhas/SP and Manaus/AM. The intermediate group is formed by
the airports of Curitiba / PR, Fortaleza/CE and Vitória/ES. Finally, in 2010, the
small efficient airports, and lower traffic, were those of Criciúma/SC and
Teresina/PI. Separating them by geographic region, it is possible to identify that in
2010, of the airports managed by Infraero considered operationally efficient, three
1232 Marcelo Driemeyer Wilbert et al.
are from the southeast region; two from the northeast region; two from the south
region; and only one from the north region.
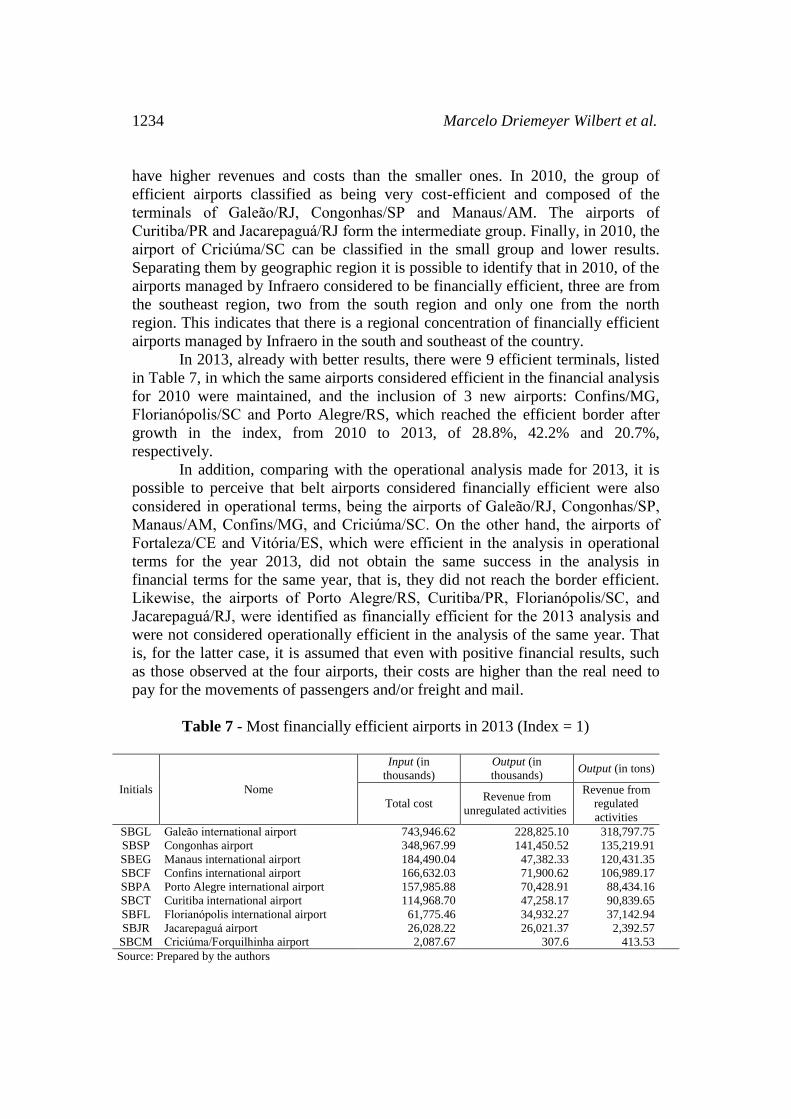
While in 2013, 7 airports were considered efficient, and 6 airports
considered efficient in 2010 are in 2013 remaining with indexes in the maximum
border, are: Galeão/RJ, Congonhas/SP, Manaus/AM, Fortaleza/CE, Vitória/ES
and Criciúma/SC. The airports of Curitiba/PR and Teresina/PI, which were
considered efficient in the 2010 analysis, left the border efficient, with a reduction
of 5.2% (0.9482) and 12.2% (0.872), respectively. And the Confins/MG Airport,
after growth of 38.1% in the index from 2010 to 2013, reaches the border and
enters the ranking.
Table 5 - Most efficient airports in operational terms in 2013 (Index = 1)
Initials Nome
Input (in
thousands)
Output (in
thousands) Output (in tons)
Total cost
Passenger handling
(domestic and
international)
Air cargo handling
and mail (domestic
and international)
SBGL Galeão international airport 743,946.62 17,115 140,160
SBSP Congonhas airport 348,967.99 17,120 62,460
SBEG Manaus international airport 184,490.04 3,077 168,299
SBCF Confins international airport 166,632.03 10,301 21,116
SBFZ Fortaleza international airport 92,962.74 5,953 45,649
SBVT Vitória airport 51,231.09 3,451 14,681
SBCM Criciúma/Forquilhinha airport 2,087.67 70 -
Source: Prepared by the authors
Since Data Envelope Analysis compares DMUs, based on a set of pre-
established variables, these airports (index = 1) are considered as reference
airports, or benchmarks, since other airports may use them as information, models
and experiences that will assist them in improving their performance.
On the other hand, airports in a critical situation, those whose rates were so low
that they deserve special attention in order to identify the factors that are making
them so inefficient in operational terms, that is, the expenditures made there are at
a good level Superior to its real need, considering its movement of passengers,
cargo and mail bags. That is, airports with indices less than 0.30. Among these are
the São José dos Campos-SP Airport, with an index equal to 0.2194 in 2010 and
0.0703 in 2013, with an efficiency reduction of 67.9% and a cost increase of more
than 4 Times. However, according to Infraero (2013), this is due to additional
investments made by the company to expand and modernize the airport, without
having a counterpart in the outputs.
By comparing the changes in the indices from 2010 to 2013, it is possible
to identify that there are two extremes: on one hand airports that have increased
efficiency in the four years, and on the other hand terminals that have reduced
efficiency. It is worth mentioning, among those that have improved, the
Parnaíba/PI airport, with an index rising from 0.377 to 0.939, in which it assumes

Efficiency analysis of airports administered by Infraero… 1233
that the growth of the airport efficiency indicator is associated with the reduction
that there was, from 2010 to 2013, 45% in its costs and 74.5% in its cargo
handling. In the same line, we highlight the Júlio Cesar/PA airport, now with a
worsening of the 40.4%, generated by an inverse situation to that reported above,
with increased costs and the movement of air cargo. Based on this, and that there
were no relevant impacts on the movement of passengers in both cases, it can be
concluded that the costs with the movement of cargo are more representative than
the costs with the circulation of passengers.
Based on the analysis of the data of 2010 and 2013 by the model of
variable returns of scale, oriented to inputs, given the present set of data and
variables, it was identified that in financial terms, in a scale of 0 to 1, the average
index is of 0.5127 in 2010 and 0.5824 in 2013. Here the analysis is restricted to
monetary items, in which it is intended to minimize costs given the same level of
revenue generation.
In 2010, only 6 airports were considered efficient (index = 1), as observed
in Table 6, all of which were also operationally efficient in the analysis made for
2010, except for the Jacarepaguá/RJ airport, which was considered a reference
terminal due to its high generation of unregulated revenues. Of its total revenue,
in 2013, 91.6% represented non-operating revenue inserted within the final
activity of an airport, a fact that explains that it was not considered operationally
efficient. On the other hand, the airports of Fortaleza/CE, Vitória/ES and
Teresina/PI, which were efficient in the analysis in operational terms for the year
2010, did not obtain the same success in the analysis in financial terms of the
same year, that is, they did not reach the efficient frontier.
Table 6 - Most financially efficient airports in 2010 (Index = 1)
Initials Nome
Input (in
thousands) Output (in thousands) Output (in tons)
Total cost Revenue from
unregulated activities
Revenue from
regulated activities
SBGL Galeão international airport 632,046.52 178,678 209,844
SBSP Congonhas airport 213,235.53 109,423 134,762
SBEG Manaus international airport 153,556.65 27,698 113,142
SBCT Curitiba international airport 78,762.00 35,035 73,660
SBJR Jacarepaguá airport 16,600.23 20,433 487
SBCM Criciúma/Forquilhinha airport 1,826.49 182 117
Source: Prepared by the authors
In an approach similar to the one made for the operational analyzes, it is
possible to segregate efficient airports into groups based on the magnitude of costs
and revenues at their terminals. As can be seen in Table 6, which are classified as
large, intermediate and small results production. It can also relate the
classification in proportion to the size of the airport, in which the larger ones will
1234 Marcelo Driemeyer Wilbert et al.
have higher revenues and costs than the smaller ones. In 2010, the group of
efficient airports classified as being very cost-efficient and composed of the
terminals of Galeão/RJ, Congonhas/SP and Manaus/AM. The airports of
Curitiba/PR and Jacarepaguá/RJ form the intermediate group. Finally, in 2010, the
airport of Criciúma/SC can be classified in the small group and lower results.
Separating them by geographic region it is possible to identify that in 2010, of the
airports managed by Infraero considered to be financially efficient, three are from
the southeast region, two from the south region and only one from the north
region. This indicates that there is a regional concentration of financially efficient
airports managed by Infraero in the south and southeast of the country.
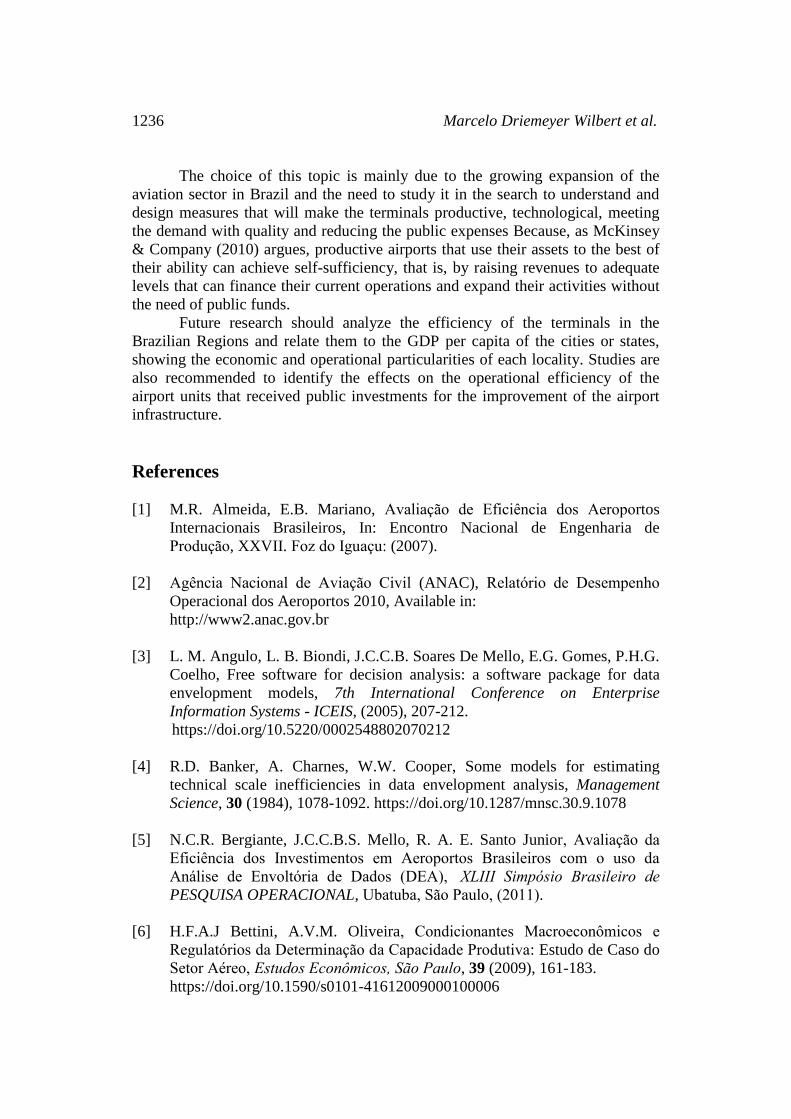
In 2013, already with better results, there were 9 efficient terminals, listed
in Table 7, in which the same airports considered efficient in the financial analysis
for 2010 were maintained, and the inclusion of 3 new airports: Confins/MG,
Florianópolis/SC and Porto Alegre/RS, which reached the efficient border after
growth in the index, from 2010 to 2013, of 28.8%, 42.2% and 20.7%,
respectively.
In addition, comparing with the operational analysis made for 2013, it is
possible to perceive that belt airports considered financially efficient were also
considered in operational terms, being the airports of Galeão/RJ, Congonhas/SP,
Manaus/AM, Confins/MG, and Criciúma/SC. On the other hand, the airports of
Fortaleza/CE and Vitória/ES, which were efficient in the analysis in operational
terms for the year 2013, did not obtain the same success in the analysis in
financial terms for the same year, that is, they did not reach the border efficient.
Likewise, the airports of Porto Alegre/RS, Curitiba/PR, Florianópolis/SC, and
Jacarepaguá/RJ, were identified as financially efficient for the 2013 analysis and
were not considered operationally efficient in the analysis of the same year. That
is, for the latter case, it is assumed that even with positive financial results, such
as those observed at the four airports, their costs are higher than the real need to
pay for the movements of passengers and/or freight and mail.
Table 7 - Most financially efficient airports in 2013 (Index = 1)
Initials Nome
Input (in
thousands)
Output (in
thousands) Output (in tons)
Total cost Revenue from
unregulated activities
Revenue from
regulated
activities
SBGL Galeão international airport 743,946.62 228,825.10 318,797.75
SBSP Congonhas airport 348,967.99 141,450.52 135,219.91
SBEG Manaus international airport 184,490.04 47,382.33 120,431.35
SBCF Confins international airport 166,632.03 71,900.62 106,989.17
SBPA Porto Alegre international airport 157,985.88 70,428.91 88,434.16
SBCT Curitiba international airport 114,968.70 47,258.17 90,839.65
SBFL Florianópolis international airport 61,775.46 34,932.27 37,142.94
SBJR Jacarepaguá airport 26,028.22 26,021.37 2,392.57
SBCM Criciúma/Forquilhinha airport 2,087.67 307.6 413.53
Source: Prepared by the authors

Efficiency analysis of airports administered by Infraero… 1235
Performing the same segregation by groups made for 2010, for 2013, the
group of efficient airports classified as high capacity for generating results is
composed of the terminals of Galeão/RJ, Congonhas/SP, Manaus/AM, and
including Confins/MG and Porto Alegre/RS. The intermediate group is formed by
the airports of Curitiba/PR and Florianópolis/SC. Finally, in 2013, in the small
magnitude group of results generation are the airports of Jacarepaguá/RJ and
Criciúma/SC. Separating them by geographic region, it is possible to identify that
in 2013, among the airports managed by Infraero considered to be financially
efficient, four are from the southeast region, four from the south, and one from the
north. Which again indicates, as happened in 2010, financially efficient airports
are in the south and southeast of the country.
5. Discussion
The main objective of this work was to measure and evaluate airport
efficiency through the study of 63 airports of Infraero and to highlight the
operational and financial bottlenecks, serving as input for the reduction of public
expenses and for the improvement of the quality of the services rendered. Noting
the results found for the four analyzes carried out in financial and operational
terms for 2010 and 2013, no airport managed by Infraero was considered efficient
in the Midwest region.
It is worth mentioning that in June 2015, the Federal Government has
decided to grant the terminals of Fortaleza/CE, Salvador/BA, Florianópolis/SC,
and in order to improve the infrastructure of the airline industry and the quality of
services provided to users of Porto Alegre/RS, currently administered by Infraero.
It is interesting to observe that mong the four analyzed, three of them were
considered efficient in the results obtained in this work. The Fortaleza/CE airport
reached the operationally efficient frontier in 2010 and 2013 and the airports of
Florianópolis/SC and Porto Alegre/RS were financially efficient for the year
2013. In the same line are the Galeão/RJ, efficient in the four analyzes. And
Confins/MG, efficient in the two analyzes of 2013. Which were already granted to
the private sector in 2014. This situation presupposes that the choice of the
airports is not random, being focused on the airports that most attract the private
sector, are able to capture greater investments in airport assets and that cover a
greater number of users with the benefits that will be generated.
In the data analysis, descriptive statistics and Data Envelopment Analysis
(DEA) were used, applied to the variables of passenger, cargo and mail handling,
domestic and international. Of total costs generated and revenues obtained, both
operational and non-operational. The results obtained in the analysis of 2010 and
2013 show that only 14.29% of the terminals were considered efficient,
considering the best scenario, which occurred in 2013 in financial terms with 9
airports at the efficiency frontier. This demonstrates the need for a reassessment
of the management of these airports and of the decision-making processes, aiming
to change the current reality, either through concessions to private initiative or
through effective investments and management qualification.
1236 Marcelo Driemeyer Wilbert et al.
The choice of this topic is mainly due to the growing expansion of the
aviation sector in Brazil and the need to study it in the search to understand and
design measures that will make the terminals productive, technological, meeting
the demand with quality and reducing the public expenses Because, as McKinsey
& Company (2010) argues, productive airports that use their assets to the best of
their ability can achieve self-sufficiency, that is, by raising revenues to adequate
levels that can finance their current operations and expand their activities without
the need of public funds.
Future research should analyze the efficiency of the terminals in the
Brazilian Regions and relate them to the GDP per capita of the cities or states,
showing the economic and operational particularities of each locality. Studies are
also recommended to identify the effects on the operational efficiency of the
airport units that received public investments for the improvement of the airport
infrastructure.
References
[1] M.R. Almeida, E.B. Mariano, Avaliação de Eficiência dos Aeroportos
Internacionais Brasileiros, In: Encontro Nacional de Engenharia de
Produção, XXVII. Foz do Iguaçu: (2007).
[2] Agência Nacional de Aviação Civil (ANAC), Relatório de Desempenho
Operacional dos Aeroportos 2010, Available in:
http://www2.anac.gov.br
[3] L. M. Angulo, L. B. Biondi, J.C.C.B. Soares De Mello, E.G. Gomes, P.H.G.
Coelho, Free software for decision analysis: a software package for data
envelopment models, 7th International Conference on Enterprise
Information Systems - ICEIS, (2005), 207-212.
https://doi.org/10.5220/0002548802070212
[4] R.D. Banker, A. Charnes, W.W. Cooper, Some models for estimating
technical scale inefficiencies in data envelopment analysis, Management
Science, 30 (1984), 1078-1092. https://doi.org/10.1287/mnsc.30.9.1078
[5] N.C.R. Bergiante, J.C.C.B.S. Mello, R. A. E. Santo Junior, Avaliação da
Eficiência dos Investimentos em Aeroportos Brasileiros com o uso da
Análise de Envoltória de Dados (DEA), XLIII Simpósio Brasileiro de
PESQUISA OPERACIONAL, Ubatuba, São Paulo, (2011).
[6] H.F.A.J Bettini, A.V.M. Oliveira, Condicionantes Macroeconômicos e
Regulatórios da Determinação da Capacidade Produtiva: Estudo de Caso do
Setor Aéreo, Estudos Econômicos, São Paulo, 39 (2009), 161-183.
https://doi.org/10.1590/s0101-41612009000100006

Efficiency analysis of airports administered by Infraero… 1237
[7] Lei nº 7.565, de 19 de dezembro de 1986, Dispõe Sobre O Código Brasileiro
de Aeronáutica, Brasilia, Available in:
http://www.planalto.gov.br/ccivil_03/leis/l7565.htm
[8] Portaria nº 602/GC-5 do Comando de Aeronáutica, de 22 de setembro de
2000, Estabelece Os Procedimentos Para A Aplicação e Para A Cobrança
das Tarifas Aeroportuárias de Embarque, Doméstica e Internacional, Pelas
Empresas de Transporte Aéreo, Brasilia, Available in:
http://www2.anac.gov.br
[9] Resolução ANAC nº 008, de 13 de março de 2007, Dispõe Sobre O
Recolhimento da Tarifa de Embarque e A Remuneração Decorrente Desse
Recolhimento, Quando Efetivado Por Empresas de Transporte Aéreo e
Agências de Viagens Credenciadas, Available in:
http://www2.anac.gov.br
[10] C. R. Castro, P. R. A. Loureiro, Mensuração da eficiência técnica
aeroportuária brasileira: Uma análise utilizando Data Envelopment Analysis
(DEA), 2013. 45 f. Monografia (Graduação) - Curso de Ciências
Econômicas, Universidade de Brasília – UnB, Brasília, 2013.
[11] A. Charnes, W. W. Cooper, E. Rhodes, Measuring the efficiency of
decision-making units, European Journal of Operational Research, 2
(1978), 429-444. https://doi.org/10.1016/0377-2217(78)90138-8
[12] Empresa De Planejamento E Logística S.A. (EPL), Programa de
Investimentos em Logística: Aeroportos, 2014, Disponível em:
http://www.logisticabrasil.gov.br/aeroportos1
[13] INFRAERO, Estatísticas operacionais dos aeroportos administrados pela
Infraero (2003 a 2013), Available in:
http://www.Infraero.gov.br/index.php/br
[14] Instituto Brasileiro De Econômia (IBRE), Fundação Getulio Vargas
(fgv). IGP. Available in:
http://portalibre.fgv.br/main.jsp?lumChannelId=402880811D8E34B9011D9
2B6B6420E96
[15] Instituto De Pesquisa Econômica Aplicada (IPEA), Panorama e Perspectivas
para o Transporte Aéreo no Brasil e no Mundo, 2010.
[16] Mckinsey & Company, Inc. do Brasil Consultoria Ltda. Estudo do Setor de
Transporte Aéreo do Brasil: Relatório consolidado, Rio de Janeiro, 2010.
1238 Marcelo Driemeyer Wilbert et al.
[17] Ministério Do Planejamento, Orçamento E Gestão. PAC – Aeroportos,
2015. Available in: http://www.pac.gov.br
[18] P. Modesto, Notas Para Um Debate Sobre O Princípio Da
Eficiência, Revista Interesse Público, Ano 2, n º 7, julho/setembro de 2000,
São Paulo: Ed. Notadez, 2000, páginas 65-75. Available in:
http://www.planalto.gov.br/ccivil_03/revista/Rev_18/Artigos/art_paulomo.htm
[19] R. R. Pacheco, E. Fernandes, M. P. S. Santos, Management style and airport
performance in Brazil, Journal of Air Transport Management, 12 (2006),
324-330. https://doi.org/10.1016/j.jairtraman.2006.07.010
[20] Somchai Pathomsiri, Ali Haghani, Martin Dresner, Robert J. Windled,
Impact of undesirable outputs on the productivity of US
airports. Transportation Research Part E: Logistics and Transportation
Review, 44 (2008), 235-259. https://doi.org/10.1016/j.tre.2007.07.002
[21] C. R. Penã, Um Modelo de Avaliação da Eficiência da Administração
Pública através do Método Análise Envoltória de Dados (DEA), RAC –
Revista de Administração Contemporânea, 12 (2008), 83-106.
https://doi.org/10.1590/s1415-65552008000100005
[22] J. Sarkis, An analysis of the operational efficiency of major airports in the
United States. Journal of Operations Management, 18 (2000), 335-351.
https://doi.org/10.1016/s0272-6963(99)00032-7
[23] Secretaria De Aviação Civil (SAC), Concessões de Aeroportos, 2013,
Available in:
http://www.aviacaocivil.gov.br/assuntos/concessoes-de-aeroportos
[24] M. Maurício Corrêa da Silva, Atelmo Ferreira de Oliveira, Joana Darc
Medeiros Martins, José Dionísio Gomes da Silva, Análise Envoltória de
Dados na avaliação da eficiência das Despesas de Investimentos dos
Estados e do Distrito Federal, Revista Universo Contábil, 10 (2014), 114-
133.
https://doi.org/10.4270/ruc.2014322
[25] J. E. Stiglitz, Economics of the Public Sector, Nova Iorque: W.W. Norton &
Company, INC. (2000), 823.
Received: April 6, 2017; Published: April 29, 2017