electric bike 2000 project - meetupfiles.meetup.com/1468133/electric_bikes_2000_report.… · ·...
TRANSCRIPT

TP 13732E
ELECTRIC BIKE 2000 PROJECT
Prepared forTransportation Development Centre
Safety and SecurityTransport Canada
ByCentre for Electric Vehicle Experimentation in Quebec
(CEVEQ)
April 2001

TP 13732E
ELECTRIC BIKE 2000 PROJECT
ByVéronique Lamy
Centre for Electric Vehicle Experimentation in Quebec(CEVEQ)
April 2001
ii
The views and opinions expressed in this report are those of the contractor and do notnecessarily reflect those of the Transportation Development Centre.
MAIN PROJECT TEAM MEMBERS
Véronique Lamy Senior Editor CEVEQ
Pierre Lavallée Support Group CEVEQ
Claude Guérette Support Group Transportation DevelopmentCentre, Transport Canada
René Desaulniers Support Group SAAQ
Fernand St-Georges Analyst
Ce rapport est disponible également en français : Projet Vélos Électriques 2000,TP 13732F.

TransportCanada
TransportsCanada PUBLICATION DATA FORM
1. Transport Canada Publication No.
TP 13732E
2. Project No.
9889
3. Recipient’s Catalogue No.
4. Title and Subtitle 5. Publication Date
April 2001
6. Performing Organization Document No.
7. Author(s)
Véronique Lamy
8. Transport Canada File No.
ZCD2450-D-730
9. Performing Organization Name and Address 10. PWGSC File No.
MTB-0-00512
11. PWGSC or Transport Canada Contract No.
T8200-000506/001/MTB
12. Sponsoring Agency Name and Address 13. Type of Publication and Period Covered
Final
14. Project Officer
Claude Guérette
15. Supplementary Notes (Funding programs, titles of related publications, etc.)
Co-funded by the Program of Energy Research and Development (PERD)
16. Abstract
17. Key Words
Electric bicycles, electrically assisted bicycle,lectrically propelled bicycle, CEVEQ
18. Distribution Statement
Limited number of copies available from theTransportation Development CentreE-mail: [email protected]
19. Security Classification (of this publication)
Unclassified
20. Security Classification (of this page)
Unclassified
21. Declassification(date)
—
22. No. ofPages
xvi, 46,apps
23. Price
Shipping/Handling
CDT/TDC 79-005Rev. 96 iii
Electric Bike 2000 Project
Centre for Electric Vehicle Experimentation in Quebec (CEVEQ)128 rue de la GareSaint-Jérôme (Quebec)J7Z 2C2
Transportation Development Centre (TDC)800 René Lévesque Blvd. WestSuite 600Montreal, QuebecH3B 1X9
This report outlines the results and consequent recommendations of an electric bicycle (e-bike) evaluation projectheld in four Canadian cities − Montreal, Quebec City, St. Jerome, and Toronto − from June 12 to October 7, 2000.The project’s main objective was to determine the safety of e-bikes in order to help the authorities decide onappropriate regulations.
To achieve this objective, the Centre for Electric Vehicle Experimentation in Quebec (CEVEQ), creator of theproject, solicited the support of various partners and bicycle manufacturers. Two categories of e-bikes –electrically assisted bicycles and electrically propelled bicycles – were used and 55 e-bikes in all were madeavailable to 369 volunteers for testing.
In Quebec, participants were asked to ride the bicycles to work for two weeks and were also allowed to use themfor recreation. At the end of this period, they had to complete a detailed questionnaire and submit their comments.In Ontario, users had opportunities to try out the e-bikes on rides of one hour or more and then completed ashorter questionnaire.
The project also had some secondary objectives, including: promoting e-bikes and assessing the level of interestin their use for urban transportation; identifying appropriate sectors for use of e-bikes; stimulating people’s interestin using the bicycles to commute to work; and supporting greater use of non-polluting and less energy-consumingmodes of transportation.

TransportsCanada
TransportCanada FORMULE DE DONNÉES POUR PUBLICATION
1. No de la publication de Transports Canada
TP 13732E
2. No de l’étude
9889
3. No de catalogue du destinataire
4. Titre et sous-titre 5. Date de la publication
Avril 2001
6. No de document de l’organisme exécutant
7. Auteur(s)
Véronique Lamy
8. No de dossier - Transports Canada
ZCD2450-D-730
9. Nom et adresse de l’organisme exécutant 10. No de dossier - TPSGC
MTB-0-00512
11. No de contrat – TPSGC ou Transports Canada
T8200-000506/001/MTB
12. Nom et adresse de l’organisme parrain 13. Genre de publication et période visée
Final
14. Agent de projet
Claude Guérette
15. Remarques additionnelles (programmes de financement, titres de publications connexes, etc.)
Projet cofinancé par le Programme de recherche et développement énergétiques (PRDE)
16. Résumé
17. Mots clés
Vélos électriques, assistance électrique,propulsion électrique, CEVEQ
18. Diffusion
Le Centre de développement des transports disposed’un nombre limité d’exemplaires.Courriel : [email protected]
19. Classification de sécurité (de cette publication)
Non classifiée
20. Classification de sécurité (de cette page)
Non classifiée
21. Déclassification(date)
—
22. Nombre de pages
xvi, 46,ann.
23. Prix
Port etmanutention
CDT/TDC 79-005Rev. 96 iv
Electric Bike 2000 Project
Centre d’expérimentation des véhicules électriques du Québec (CEVEQ)128, rue de la GareSaint-Jérôme (Québec)J7Z 2C2
Centre de développement des transports (CDT)800, boul. René-Lévesque OuestBureau 600Montréal (Québec)H3B 1X9
Ce rapport présente les résultats et les recommandations émanant d’un projet d’évaluation de vélos électriques(vélos É) tenu dans quatre villes canadiennes, soit Montréal, Québec, Saint-Jérôme et Toronto, du 12 juin au7 octobre 2000. Le principal objectif de ce projet consistait à déterminer l’impact des vélos É sur la sécurité desusagers, afin d’aider les autorités responsables à statuer sur une réglementation appropriée.
Pour ce faire, le Centre d’expérimentation des véhicules électriques du Québec (CEVEQ), initiateur du projet, asollicité l’appui de divers partenaires et manufacturiers de vélos. Au total, 55 vélos É de deux catégories, soit lesvélos à assistance électrique et les vélos à propulsion électrique, ont été mis à la disposition de 369 volontairespour en faire l’essai.
Au Québec, les participants étaient invités à utiliser le vélo pendant deux semaines pour se rendre au travail, enplus d’avoir la possibilité de l’utiliser pour les loisirs. À la fin de cette période, ils devaient remplir un questionnairedétaillé et formuler leurs commentaires. Du côté de l’Ontario, les utilisateurs avaient l’occasion de faire l’essaid’un vélo É pour une ballade d’une heure ou plus, et par la suite ils remplissaient un questionnaire moins élaboré.
Le projet comportait également un certain nombre d’objectifs secondaires, dont : la promotion et l’évaluation del’intérêt du vélo É comme moyen de transport urbain; l’identification des secteurs d’utilisation; la stimulation del’intérêt des gens à utiliser le vélo pour se rendre au travail; l’appui à l’émergence de moyens de transport moinsénergivores et non polluants.
v
ACKNOWLEDGEMENTS
The Electric Bike 2000 Project was made possible through each participatingorganization’s contributions of financial support and/or services, staff and other formsof support.
The Centre for Electric Vehicle Experimentation in Quebec (CEVEQ) would like tospecially thank all of the suppliers who kindly loaned a large number of electric bicyclesfor the project, as well as participating organizations for their excellent co-operation.
CEVEQ wishes to thank all of the cyclists who rode e-bikes for this project and carriedout their duties with great enthusiasm and conviction.
CEVEQ would especially like to thank Transport Canada’s Transportation DevelopmentCentre and the Société de l’Assurance Automobile du Québec for making this projectpossible and the Moving the Economy organization for co-ordinating the project inToronto.
Lastly, CEVEQ thanks the Interdepartmental Electric Vehicle Group (GIVE) of France forits co-operation with the French partners.


vii
PARTICIPATING ORGANIZATIONS AND REPRESENTATIVES
Transportation Development Centre Claude Guérette(Transport Canada)
Agence de l’Éfficacité Énergétique Douglas Labelle
Société de l’Assurance Automobile du Québec René Desaulniers
Quebec Department of the Environment Jean-Claude Raymond
Quebec Department of Transport Marcel Ayoub andStéphane Campeau
Hydro Quebec, Laurentians Laurent Martineau andNicole Audy
Agence Métropolitaine de Transport (AMT) Luc Couillard
City of Quebec Claude Larose andYvon Jobin
City of Montreal Pierre Le Breux andMario Bérubé
Moving the Economy (City of Toronto) Sue Zielinsk andLi-lien Gibbons
City of St. Jerome Louis Parent
Association Québécoise du Transport et des Routes Marie-Josée Huot
City of Lachine (GRAME) Jean-François Lefebvre
In Toronto, the Electric Bike 2000 Project was supported by the following partners:• Toronto Atmospheric Fund• City of Toronto• Human Resources Development Canada• Transportation Options• Independent Bicycle Dealers Association• McBride Cycle Power Sports• Wheel Excitement

viii
OFFICIAL SUPPLIERS OF ELECTRIC BICYCLES
Procycle Ephrem Busque
EPS Jean-Yves Dubé
EV Global Motors James Goraieband Mark Lafontaine
Zapworld Gary Star
Th!nk Mobility (Ford) Ben Sullivan
AeroVironment Michael Greenish
Renault Sport Olivier Jauffret
Cycleurope (Peugeot) Jean-Louis Jean
Honda Peter Berry and Don Zaharia
Yamaha Motor James Fukada

ix
EXECUTIVE SUMMARY
The Electric Bike 2000 Project is part of an initiative to promote the use of electricbicycles (e-bikes) and to document their performance to assist the federal andQuebec governments as they prepare to regulate the use of this new mode oftransportation.
A pioneer in evaluating e-bikes, the Centre for Electric Vehicle Experimentation inQuebec (CEVEQ), together with the Tremblant Resort Association, organized e-biketests at the world-renowned tourism site in the summers of 1997 and 1998. In 1999,aware that this transportation method has relevance for cities because it reduces trafficand greenhouse gases, CEVEQ suggested to the City of Montreal and other partnersthat they participate in an e-bike evaluation project. For four months, 120 cyclistsassessed the first e-bike built in Quebec – the Elektron, manufactured by GroupeProcycle in Saint-Georges-de-Beauce. The final evaluation report attracted the interestof Transport Canada and the Société de l’Assurance Automobile du Québec (SAAQ).
With strong support from major partners, the Electric Bike 2000 Project quickly expandedworldwide, attracting some of the world’s most prestigious manufacturers in Quebec,Canada, the United States, Japan, and Europe (Honda, Ford, Yamaha, Peugeot,Renault, ZAP, EV Global Motors, Groupe Procycle, etc.). Products new to the market(Ford’s TH!NK Bike Fun) were tested by the general public for the first time. The prospectof legislation in Canada generated considerable interest in the evaluation. CEVEQsucceeded in expanding the testing to include four Canadian regions and close to400 cyclists. The evaluation was held from June 12 to October 7, 2000. Each participanthad to complete a detailed questionnaire.
A communication strategy was also implemented to raise awareness of the project andto provide the public and governments with general information on e-bikes and theiradvantages in urban environments. The resulting heavy press coverage helped toincrease public awareness of e-bikes. Various government authorities and participatingorganizations were also brought into the project and reaped various benefits,depending on their interests and participation.
Regulatory issues
When the project was launched in June 2000, e-bikes were subject to the requirementsof the Motor Vehicle Safety Act because they were motorized. In particular, theybelonged to a subclass of limited-speed motorcycles under the Motor Vehicle SafetyRegulations. Amendments to have electrically assisted bicycles (EABs) removed fromthe Motor Vehicle Safety Regulations were submitted to Transport Canada forconsultation in November 1999. A new version of the regulations was expected inDecember 2000 and adoption of the new regulations regarding e-bikes is scheduled forspring 2001.
x
Thousands of kilometres ridden on electric bicycles
During the project, 369 people travelled a total of 25,205 km on the e-bikes. Of thisnumber, 211 Quebec cyclists chalked up 24,343 km, an average of 115 km per user.In Ontario, the project had to deal with the refusal of the Ministry of Transportation ofOntario (MTO) to allow e-bikes on public thoroughfares. The project was modified andthe e-bikes were ridden in parks and on bicycle paths within the exclusive jurisdictionof the City of Toronto. A total of 158 users accumulated 862 km on rides of one hour ormore.
Feeling of safety
Eighty-three percent of respondents felt as safe on an e-bike as on a conventional bike.Ninety-five percent of those who rode electrically propelled bicycles (EPBs) and96 percent of those who rode electrically assisted bicycles (EABs) felt they had fullcontrol of their bicycles when the motor was running. Reducing the weight of the e-bikeand improving the braking system on certain models were the main elements thatwould contribute to an increased feeling of safety.
Electrically assisted bicycles and electrically propelled bicycles
The findings demonstrated that the two e-bike systems – electrically propelled andelectrically assisted – were equally safe. Therefore, the new regulations should notinclude restrictions on the motor’s operating apparatus. In addition, users also notedthat e-bikes encourage users to obey the Highway Safety Code more strictly (forexample, they are more likely to stop at mandatory stops) because the bikes’ motorpower makes standing starts easier.
E-bike performance
In general, respondents were highly satisfied with the user-friendliness, braking andreliability of the e-bikes, whether they were EPBs or EABs. However, they clearly dislikedthe weight of the bikes and wanted more power assistance in some circumstances,such as on steep hills.
The survey findings also clearly indicated the cyclists’ dissatisfaction with the electricmotor’s power-assist limit being set at 24 km/h, which was below their usual speed ona conventional bicycle. Above that speed, they had to exert much more effort than ona conventional bicycle, because of the e-bike’s weight. Users said that an increase inthe power-assist speed to 30 km/h would provide more latitude without compromisingsafety.

xi
Interest in e-bikes as a mode of urban transportation
According to 79 percent of the cyclists surveyed, exercise was the main reason thatwould encourage them to use an e-bike to commute to work. Reduced pollution(51 percent) and low cost (41 percent) were other significant reasons. Participants alsosaw an advantage in being able to deal more easily with adverse travel conditions.
Sixty-four percent of all participants said they would use an e-bike to travel to work;65 percent of those who usually travel to work by car said they would opt for the e-bike;and 71 percent of conventional bicycle enthusiasts expressed interest in using e-bikes toget to work. Obviously, many people find this new technology very attractive.
Conclusion
E-bikes are a great success when judged by the level of user interest and the media’se-bike infatuation. Participants’ comments indicated their potential to become popularand, for some, to replace the automobile as a mode of transportation to work,particularly from May to October. Overall, respondents thought that the federalgovernment (Transport Canada) and the Quebec government (SAAQ) should legislateand permit the use of electric bicycles.
The project results also identified the expectations of potential clients, namely:• An e-bike that can reach 30 km/h in power-assist mode;• A high-performance, ergonomic product that is, most importantly, lighter, and that
can assist the user on steep hills and provide good acceleration;• Useful accessories providing greater safety in urban environments;• Anti-theft devices and workplace facilities to help ensure bicycle security in all
circumstances.

xiii
TABLE OF CONTENTS
1. INTRODUCTION .................................................................................................................. 11.1 Objectives.............................................................................................................. 1
2. BACKGROUND ................................................................................................................... 32.1 General .................................................................................................................. 32.2 Electric bicycles .................................................................................................... 32.3 Types of electric bicycles..................................................................................... 4
2.3.1 Electrically assisted bicycles (EABs)........................................................ 42.3.2 Electrically propelled bicycles (EPBs)..................................................... 4
2.4 Regulations applicable to e-bikes...................................................................... 52.5 Canadian situation............................................................................................... 62.6 CEVEQ’s mission and objectives ........................................................................ 62.7 1999 Electric Bicycle Evaluation Project ........................................................... 62.8 Special study framework ..................................................................................... 7
3. METHODOLOGY................................................................................................................. 93.1 Project method ..................................................................................................... 93.2 Project implementation ....................................................................................... 9
3.2.1 CEVEQ: Project designer and manager ............................................... 93.2.2 Partners..................................................................................................... 103.2.3 Suppliers ................................................................................................... 113.2.4 Implementation ...................................................................................... 12
3.3 Selecting the target clientele ........................................................................... 133.4 Data gathering ................................................................................................... 14
3.4.1 Overall method....................................................................................... 143.4.2 Questionnaire .......................................................................................... 153.4.3 Cyclists’ comments................................................................................. 153.4.4 Special characteristics of the Ontario tests ........................................ 16
3.5 Approvals............................................................................................................. 163.5.1 Transport Canada approval ................................................................. 163.5.2 Authorization from the Société de l’Assurance Automobile
du Québec.............................................................................................. 173.5.3 Special problems in the Ontario evaluation....................................... 17
3.6 Communication strategy .................................................................................. 173.6.1 Promotional tools .................................................................................... 173.6.2 Press conferences................................................................................... 18
4. LIST OF TESTED BICYCLES AND SPECIAL CHARACTERISTICS ....................................... 19
5. EVALUATION RESULTS ...................................................................................................... 235.1 General ................................................................................................................ 23
5.1.1 Distance travelled by cyclists................................................................ 235.1.2 Cyclist profile ........................................................................................... 24
xiv
5.2 E-bike safety ........................................................................................................ 255.2.1 General .................................................................................................... 255.2.2 Comparison of EPB and EAB handling capabilities ........................... 255.2.3 Impact of speed on e-bike safety........................................................ 285.2.4 Impact of ergonomics on e-bike safety .............................................. 295.2.5 Protective helmets.................................................................................. 305.2.6 Minimum age .......................................................................................... 315.2.7 E-bikes versus conventional bicycles on bicycle paths .................... 315.2.8 Highlights .................................................................................................. 32
5.3 E-bike performance............................................................................................ 335.3.1 Overall performance.............................................................................. 335.3.2 Motor power............................................................................................ 345.3.3 Maximum e-bike speed ......................................................................... 355.3.4 Highlights .................................................................................................. 36
5.4 E-bikes as a mode of urban transportation .................................................... 365.4.1 Cyclists’ current modes of transportation ........................................... 375.4.2 Reasons for commuting to work on e-bikes........................................ 375.4.3 E-bikes advantages................................................................................ 385.4.4 Influence of external factors ................................................................. 385.4.5 E-bike parking.......................................................................................... 395.4.6 Use of bicycle paths ............................................................................... 395.4.7 Highlights .................................................................................................. 39
5.5 Project impact..................................................................................................... 405.5.1 Impact on the public and cyclists........................................................ 405.5.2 Impact on government authorities ...................................................... 405.5.3 Impact on participating organizations................................................ 40
6. CONCLUSIONS................................................................................................................. 436.1 E-bike safety ........................................................................................................ 436.2 E-bike performance............................................................................................ 436.3 E-bikes as a mode of urban transportation .................................................... 436.4 Future of e-bikes.................................................................................................. 44
7. RECOMMENDATIONS ...................................................................................................... 457.1 Cyclists’ needs..................................................................................................... 457.2 Government regulations.................................................................................... 45
Appendix A Summary of Qualitative Analysis of Cyclists’ CommentsAppendix B List of Newspaper Articles and Radio/Television Coverage
xv
LIST OF PHOTOS
Photo 1 Presentation to the media of several models of electric bicyclesat a press conference on June 12, 2000 ........................................................... 2
Photo 2 Electrically assisted bicycle (EAB)....................................................................... 5Photo 3 Electrically propelled bicycle (EPB).................................................................... 5Photo 4 A group of e-bike users being trained at the Agence de l’Efficacité
Énergétique ......................................................................................................... 13Photo 5 Two e-bikes on display during taping of the “Technofolies”
television show .................................................................................................... 18
LIST OF TABLES
Table 1 Summary of Study Parameters.......................................................................... 14Table 2 Official E-bike Suppliers ...................................................................................... 19Table 3 Characteristics of Electric Bicycles on the Market......................................... 20Table 4 Distribution of E-bikes by Identification Number and Partner
Organization........................................................................................................ 22Table 5 Distances Travelled and Number of Cyclists................................................... 23Table 6 Percentage Breakdown of Cyclists with Reasons for Feelings of
Insecurity .............................................................................................................. 26Table 7 Evaluation of E-bike Versus Conventional Bicycle Safety
– Ontario Cyclists................................................................................................. 27Table 8 Preferred Maximum Power Assist Speed – Ontario Cyclists .......................... 28Table 9 Percentage Breakdown of Satisfied Cyclists by Motor Power Output........ 34
LIST OF FIGURES
Figure 1 Breakdown of Cyclists by Age Group.............................................................. 24Figure 2 Satisfaction with E-bike Handling Capability .................................................. 26Figure 3 Perceptions of Maximum Power Assist............................................................. 29Figure 4 Feelings of Safety at Higher Power Assist Speeds........................................... 29Figure 5 Perceptions of Greater Safety by Motor Start-Up Method ........................... 30Figure 6 Suggested Minimum Age for Riding E-bikes ................................................... 31Figure 7 Perceptions of Electric and Conventional Bicycle Speeds
on Bicycle Paths ................................................................................................. 32Figure 8 Preferred Maximum Power Assist Speed ......................................................... 36


1
1. INTRODUCTION
This report summarizes the results of an electric bicycle evaluation project conductedby the Centre for Electric Vehicle Experimentation in Quebec (CEVEQ) in co-operationwith partners and bicycle manufacturers. The project targeted a specific type of cyclistand involved tests in four Canadian cities (Montreal, Quebec City, Toronto and St.Jerome) in the summer of 2000.
1.1 Objectives
The primary objective of this study, initiated at the request of Transport Canada, theproject’s principal funding partner, was to determine the impact of e-bikes on thesafety of users in order to help responsible authorities decide on appropriateregulations.
Other project objectives included the following:• Promote e-bikes and assess interest in them as a mode of urban transportation;• Identify appropriate sectors for e-bike use;• Stimulate people’s interest in commuting to work on e-bikes and making less use
of cars;• Promote greater use of less polluting and energy-consuming modes of
transportation.
The project enabled CEVEQ and its partners not only to ascertain cyclists’ perceptionsof safety when riding e-bikes but also to identify from their comments what they thoughtabout the advantages, disadvantages and marketing potential of e-bikes. Morespecifically, answers were sought to the following questions: Should the e-bike beconsidered a motorbike or a conventional bicycle? Should the electrically propelledbicycle be classified in the same category as the electrically assisted bicycle? Shouldthe motor’s power assist disengage at 24 km/h, 30 km/h or 32 km/h? How much poweroutput should the motor have?
Fifty-five e-bikes were tested in an urban setting largely because of the significantvoluntary commitment of ten participating manufacturers, who kindly agreed to lendtheir products.
This report provides an overview of the role of e-bikes throughout the world and of theinternational regulations currently in force. It also covers the evaluated products as wellas the methodology adopted by CEVEQ to ensure that the 55 e-bikes were used bycyclists in a co-ordinated fashion.
Based on the data collected with respect to the tested products, an analysis of theresponses was carried out to identify cyclists’ perceptions of e-bikes and feelings ofsafety. The report ends with conclusions and recommendations.

2
Photo 1
Presentation to the media of several models ofelectric bicycles at a press conference on June 12,2000
3
2. BACKGROUND
2.1 General
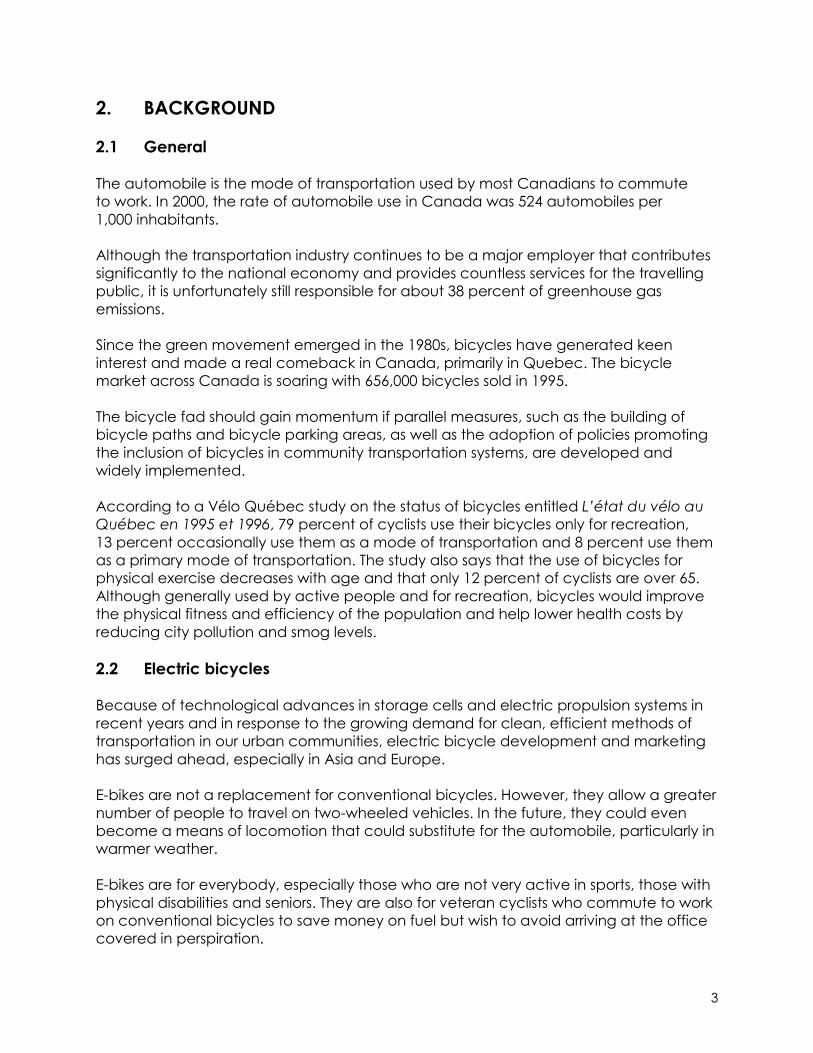
The automobile is the mode of transportation used by most Canadians to commuteto work. In 2000, the rate of automobile use in Canada was 524 automobiles per1,000 inhabitants.
Although the transportation industry continues to be a major employer that contributessignificantly to the national economy and provides countless services for the travellingpublic, it is unfortunately still responsible for about 38 percent of greenhouse gasemissions.
Since the green movement emerged in the 1980s, bicycles have generated keeninterest and made a real comeback in Canada, primarily in Quebec. The bicyclemarket across Canada is soaring with 656,000 bicycles sold in 1995.
The bicycle fad should gain momentum if parallel measures, such as the building ofbicycle paths and bicycle parking areas, as well as the adoption of policies promotingthe inclusion of bicycles in community transportation systems, are developed andwidely implemented.
According to a Vélo Québec study on the status of bicycles entitled L’état du vélo auQuébec en 1995 et 1996, 79 percent of cyclists use their bicycles only for recreation,13 percent occasionally use them as a mode of transportation and 8 percent use themas a primary mode of transportation. The study also says that the use of bicycles forphysical exercise decreases with age and that only 12 percent of cyclists are over 65.Although generally used by active people and for recreation, bicycles would improvethe physical fitness and efficiency of the population and help lower health costs byreducing city pollution and smog levels.
2.2 Electric bicycles
Because of technological advances in storage cells and electric propulsion systems inrecent years and in response to the growing demand for clean, efficient methods oftransportation in our urban communities, electric bicycle development and marketinghas surged ahead, especially in Asia and Europe.
E-bikes are not a replacement for conventional bicycles. However, they allow a greaternumber of people to travel on two-wheeled vehicles. In the future, they could evenbecome a means of locomotion that could substitute for the automobile, particularly inwarmer weather.
E-bikes are for everybody, especially those who are not very active in sports, those withphysical disabilities and seniors. They are also for veteran cyclists who commute to workon conventional bicycles to save money on fuel but wish to avoid arriving at the officecovered in perspiration.

4
Growth in e-bike use has skyrocketed since the electrically assisted bicycle (EAB) wasintroduced in 1997 by the Japanese firm Yamaha. This version of the e-bike has a smallmotor mounted on the back wheel to double the power generated by the cyclist. In1998, the company scored a major commercial success by selling 500,000 unitsworldwide, making Japan the e-bike market leader.
The European market is growing as well, with more than 100,000 units sold in 1999.However, there are no clear, standardized regulations for all European EconomicCommunity countries.
2.3 Types of electric bicycles
Today there are many types of e-bikes, which can be classified into two main groups:electrically assisted bicycles (EABs) and electrically propelled bicycles (EPBs).
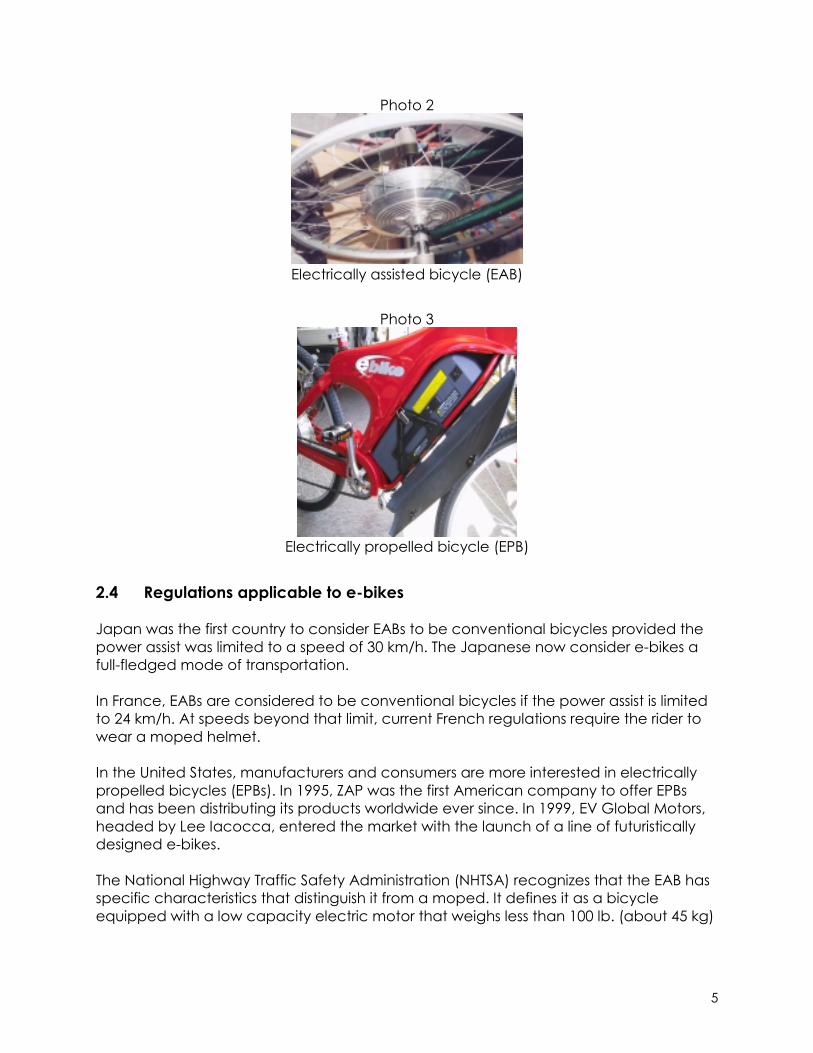
2.3.1 Electrically assisted bicycles (EABs)
An EAB works like a conventional bicycle with an electric motor added to assist thepedalling action. It is simple to use: press the start switch and the electric motor assistsyou when you apply pressure on the pedals. The motor increases the amount of powertransmitted to the wheel. A special characteristic of the EAB is that it only runs whenpedalled.
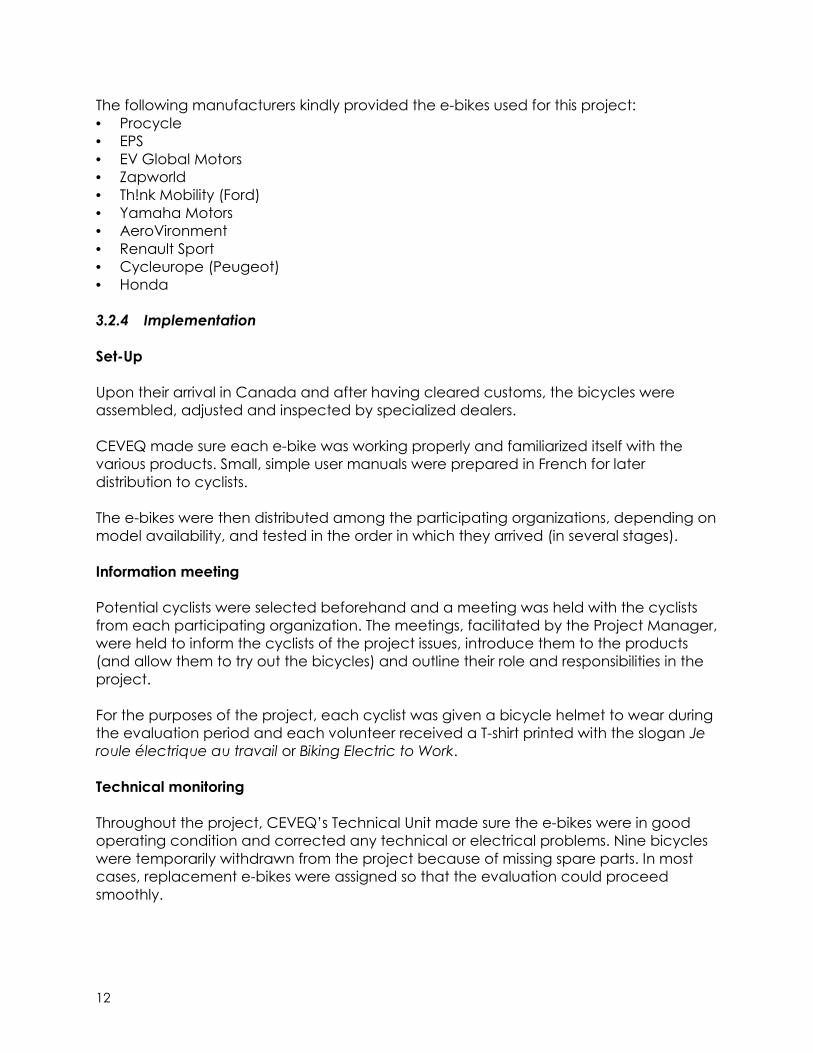
2.3.2 Electrically propelled bicycles (EPBs)
When the electric motor is not providing assistance, the EPB also works like aconventional bicycle. When the cyclist turns the function switch to “on” and pressesthe hand accelerator, the cyclist is propelled effortlessly by the electric motor withouthaving to pedal. The propulsion of this type of e-bike is similar to that of a moped.
EABs and EPBs are divided into several categories depending on the maximum poweroutput ratio (1:1, 1:2, 1:3), the power output rating (average 250 W) and the speed limitat which the power assist cuts out.
5
Photo 2
Electrically assisted bicycle (EAB)
Photo 3
Electrically propelled bicycle (EPB)
2.4 Regulations applicable to e-bikes
Japan was the first country to consider EABs to be conventional bicycles provided thepower assist was limited to a speed of 30 km/h. The Japanese now consider e-bikes afull-fledged mode of transportation.
In France, EABs are considered to be conventional bicycles if the power assist is limitedto 24 km/h. At speeds beyond that limit, current French regulations require the rider towear a moped helmet.
In the United States, manufacturers and consumers are more interested in electricallypropelled bicycles (EPBs). In 1995, ZAP was the first American company to offer EPBsand has been distributing its products worldwide ever since. In 1999, EV Global Motors,headed by Lee Iacocca, entered the market with the launch of a line of futuristicallydesigned e-bikes.
The National Highway Traffic Safety Administration (NHTSA) recognizes that the EAB hasspecific characteristics that distinguish it from a moped. It defines it as a bicycleequipped with a low capacity electric motor that weighs less than 100 lb. (about 45 kg)

6
and is capable of reaching a maximum speed of 20 mph (about 30 km/h) withassistance from the motor.
2.5 Canadian situation
Canadians are still unfamiliar with electric bicycles because of the newness of theproduct and lack of regulations in Canada to allow or encourage their marketingand use.
In Canada, the importing of and interprovincial trade in e-bikes is prohibited by theMotor Vehicle Safety Act. Under this Act, each province or territory may allow e-bikesto be sold and used in its jurisdiction. Groupe Procycle was thus able to obtain specialauthorization to sell the Elektron model (100-W motor and power assist up to 24 km/h) inQuebec only. Transport Canada is currently studying amendments to the Motor VehicleSafety Regulations that would permit the marketing and use of EABs and EPBs uponagreement among the provinces. To promote the marketing of these bicycles, it iscrucial that the future regulations governing e-bikes correspond to the needs of theproduct’s potential customers.
2.6 CEVEQ’s mission and objectives
The Centre for Electric Vehicle Experimentation in Quebec (CEVEQ) is a private, non-profit company founded in 1996. Its mission is to promote the use of electric vehicles orhybrid electric vehicles from the perspective of the environmental, economic andenergy-saving benefits they may generate.
CEVEQ’s overall objectives include the following:• Manage EV evaluation and demonstration projects;• Participate in industrial development projects;• Test EVs or components in actual-use climate conditions;• Promote efficient and non-polluting modes of transportation;• Develop expertise in EV maintenance;• Help develop technical training with specialized organizations.
2.7 1999 Electric Bicycle Evaluation Project
In the summer of 1999, CEVEQ conducted an EAB demonstration and evaluationproject in the Montreal area. The project’s main objective was to assess the relevanceof electric bicycles in urban environments and whether they were in a position tooccasionally replace cars for commuting to work.
With the co-operation of financial partners and cyclists (Agence de l’EfficacitéÉnergétique; Transport Quebec; Hydro Quebec; City of Montreal; Groupe deRecherche Appliquée en Macroécologie (GRAME); Transports 2000 Québec; andCitizens on Cycles), 16 identical EABs were assigned to the cyclists. A total of 120 peopleparticipated in the evaluation and filled out a comprehensive questionnaire at the endof the test period.

7
When the test results were analysed, it was found that the tested bicycles could meetthe needs of a clientele of moderately physically active working people travelling adistance of less than 20 km, but were not suited to the needs of a clientele of regularcyclists because their speed limit was restricted to 24 km/h. The cyclists particularly likedthe reduced physical effort required in more strenuous situations. Overall, they foundthe bicycles’ strong points to be user-friendliness, reliability and riding pleasure, andelements in need of improvement to be weight, speed and range. Most cyclists felt safeon these e-bikes.
CEVEQ was able to use this study to identify consumer needs and potential marketniches for electric bicycles. It also provided Transport Canada with relevant informationfor drafting new regulations for power-assisted bicycles.
2.8 Study framework
To permit the possible marketing and use of electric bicycles in Canada, TransportCanada published a proposed amendment to Canada’s Motor Vehicle Safety Actin the Canada Gazette, Part I, in November 1999. Under this proposed amendment,electric bicycles would be excluded from the limited-speed motorcycle category,provided they met the following principal criteria:• Maximum speed of 24 km/h;• Maximum power of 500 W;• Maximum pedal-to-power assistance ratio of 1:1;• Pedal-activated motor (Pedal Assist (PAS)).
Many manufacturers and consumers commented that this proposed amendment wastoo restrictive and would not allow the marketing of EPB-type electric bicycles, whileothers thought the maximum permitted speed was too low, among other things.
The Electric Bike 2000 Project was therefore developed partly in response to theobservations and comments that were made. To expand the scope of the projectbeyond a regional or Quebec frame of reference, it was agreed to carry out theevaluation project in four Canadian cities, including one in Ontario.


9
3. METHODOLOGY
3.1 Project method
This study was planned and developed to achieve the objectives described in section1.1 while keeping in mind the specific interests of the various partners. The expertiseacquired in the 1999 Electric Bicycle Evaluation Project was used to set up the studyand ensure that a representative sample of bicycle models and users, as well as validtest periods were considered.
The following were key elements of the method used to define the content of theproject:• Define the scope of the project with the partners;• Request and receive co-operation from technical and financial partners to
participate in the project;• Determine the number and types of e-bikes required to assess the merits of various
characteristics that have an impact on safety, such as the following: two or three-wheel bicycles, motors with outputs ranging from 200 to 500 W, EABs versus EPBs,power-assist ratios from 1:1 to 1:3 and maximum speeds ranging from 25 to 35 km/h;
• Obtain bicycles from manufacturers on either a loan or lease basis;• Solicit the participation of employers whose employees would use the bicycles;• Prepare questionnaires and logbooks to be used for information gathering;• Make necessary logistical arrangements to set up the project and manage it on a
daily basis;• Prepare a report to update the final content of the project.
3.2 Project implementation
The Electric Bike 2000 Project was made possible through each participatingorganization’s contributions of financial support and/or services, staff and other formsof support.
3.2.1 CEVEQ: Project designer and manager
CEVEQ was the creator and manager of the project. Its mandate for this study includedthe following:• Define a project in co-operation with the planning partners and e-bike suppliers;• Look for e-bike suppliers that are developing innovative, interesting technologies
and are favourable to the idea of participating in tests;• Determine the impact of e-bikes on the safety of potential e-bike users in actual
cycling situations;• Manage the operating budget;• Target potential users in various categories of people in the labour force;• Manage cyclist training and supervision;• Co-ordinate media relations;• Develop and propose promotional tools;

10
• Design questionnaires and logbooks;• Produce an evaluation report based on the data gathered from questionnaires
filled out by participants.
3.2.2 Partners
Planning and financial partners
The main planning and financial partners of this study were the TransportationDevelopment Centre of Transport Canada, the Agence de l’Efficacité Énergétique andthe Société de l’Assurance Automobile du Québec (SAAQ).
As the federal government institution responsible for transportation, Transport Canadawas interested in obtaining information on the various types of electric bicycles as wellas their characteristics, advantages and disadvantages in order to focus its associatedpolicies, programs and regulations more effectively. For Transport Canada, this projectwas an excellent opportunity to promote e-bikes, evaluate interest in them as a cleanmode of urban transportation, identify the most promising areas for their use and, mostimportantly, to ask cyclists for their perceptions concerning the safety aspects of thesebicycles.
The SAAQ’s interest in the project consisted of determining the impact and issuesinvolved in possibly implementing e-bike legislation in the province of Quebec. Fromthe SAAQ’s standpoint, the project’s objective was to gather information on electricbicycle use on roads and bike paths that the organization would use as a guide inestablishing standards for the use of these bicycles.
Quebec’s Agence de l’Efficacité Énergétique supported the project as part of theEnergy Efficiency Partnership Program. Also to be highlighted are the contributions ofthe Moving the Economy (MTE) organization and the City of Toronto, which conductedthe evaluation in Toronto.
In co-operation with CEVEQ, MTE carried out the following activities:• Co-ordination of the project in Toronto;• Evaluation, by means of a questionnaire, of a minimum of five electric bicycles
made available to the public;• Promotion and awareness campaigns for the media and the general public;• Organization of a press conference in Toronto;• Co-ordination of a working group to study possible legislation on e-bike use
in Toronto and throughout the province of Ontario.
The following is a list of all of the financial partners involved in the project:• Agence de l’Efficacité Énergétique• Agence Métropolitaine de Transport• Hydro Quebec• Quebec Department of the Environment• Quebec Department of Transport• Société de l’Assurance Automobile du Québec

11
• Transport Canada• City of Montreal• City of Quebec• City of St. Jerome• City of Toronto
Organizations participating in the evaluation
Following the 1999 Electric Bicycle Evaluation Project, which was conducted in theMontreal area in the summer of 1999, CEVEQ contacted the participating organizations– the City of Montreal, Transport Quebec and the City of Lachine (GRAME) – andobtained their enthusiastic agreement to become involved in this new project.
So that the evaluation could be carried out in various regions of Quebec and the rest ofCanada, Quebec City, St. Jerome and Toronto were invited to participate in theproject and they promptly accepted.
In keeping with the project’s objectives, financial partners such as Transport Canada,the SAAQ, the Quebec Department of the Environment and Quebec’s Agence del’Efficacité Énergétique also expressed interest in being directly involved in theevaluation.
The following organizations participated in the evaluation project:• Agence de l’Efficacité Énergétique• Association Québécoise du Transport et des Routes• Hydro Quebec• Quebec Department of the Environment• Quebec Department of Transport• Société de l’Assurance Automobile du Québec• Transport Canada• City of Lachine (Groupe de Recherche Appliquée en Macroécologie (GRAME))• City of Montreal• City of Quebec• City of St. Jerome• City of Toronto
3.2.3 Suppliers
It was important to select and procure certain types of e-bikes in order to obtainevaluation results that were valid and representative of all products that might beconsidered by potential users. A number of manufacturers were contacted based onthe types of bicycles sought for the project.
12
The following manufacturers kindly provided the e-bikes used for this project:• Procycle• EPS• EV Global Motors• Zapworld• Th!nk Mobility (Ford)• Yamaha Motors• AeroVironment• Renault Sport• Cycleurope (Peugeot)• Honda
3.2.4 Implementation
Set-Up
Upon their arrival in Canada and after having cleared customs, the bicycles wereassembled, adjusted and inspected by specialized dealers.
CEVEQ made sure each e-bike was working properly and familiarized itself with thevarious products. Small, simple user manuals were prepared in French for laterdistribution to cyclists.
The e-bikes were then distributed among the participating organizations, depending onmodel availability, and tested in the order in which they arrived (in several stages).
Information meeting
Potential cyclists were selected beforehand and a meeting was held with the cyclistsfrom each participating organization. The meetings, facilitated by the Project Manager,were held to inform the cyclists of the project issues, introduce them to the products(and allow them to try out the bicycles) and outline their role and responsibilities in theproject.
For the purposes of the project, each cyclist was given a bicycle helmet to wear duringthe evaluation period and each volunteer received a T-shirt printed with the slogan Jeroule électrique au travail or Biking Electric to Work.
Technical monitoring
Throughout the project, CEVEQ’s Technical Unit made sure the e-bikes were in goodoperating condition and corrected any technical or electrical problems. Nine bicycleswere temporarily withdrawn from the project because of missing spare parts. In mostcases, replacement e-bikes were assigned so that the evaluation could proceedsmoothly.

13
Supervision
Each participating organization assigned a resource person to supervise its group ofcyclists and act as a liaison person with CEVEQ, which co-ordinated and oversaw theproject.
Photo 4
A group of e-bike users being trained at the Agence de l’Efficacité Énergétique
3.3 Selecting the target clientele
The cyclist selection criteria were based on distance from home to work (between 5and 20 km), physical condition (low or moderate level of fitness), age and sex so that arepresentative sample could be obtained. Special priority was given to people whousually commuted to work by car.
The 1999 Electric Bicycle Evaluation Project results had shown that, in the case ofMontreal area residents in the labour force, while age was not a significant criterion foracquiring an e-bike, physical condition was a major criterion. For this study, in selectingpeople in the labour force between the ages of 25 and 60, it was important to giveinitial priority to moderately fit people who were active in sports and likely to fit theprofile of potential buyers.
14
A mini-questionnaire was sent to the resource people of the organizations that hadexpressed interest in participating in the Electric Bike 2000 Project. Cyclists had topromise to follow certain instructions: ride the e-bikes to work every day for a two-weekperiod; record the number of kilometres travelled each day and average speedmaintained; and fill out the logbook and detailed questionnaire at the end of the testperiod.
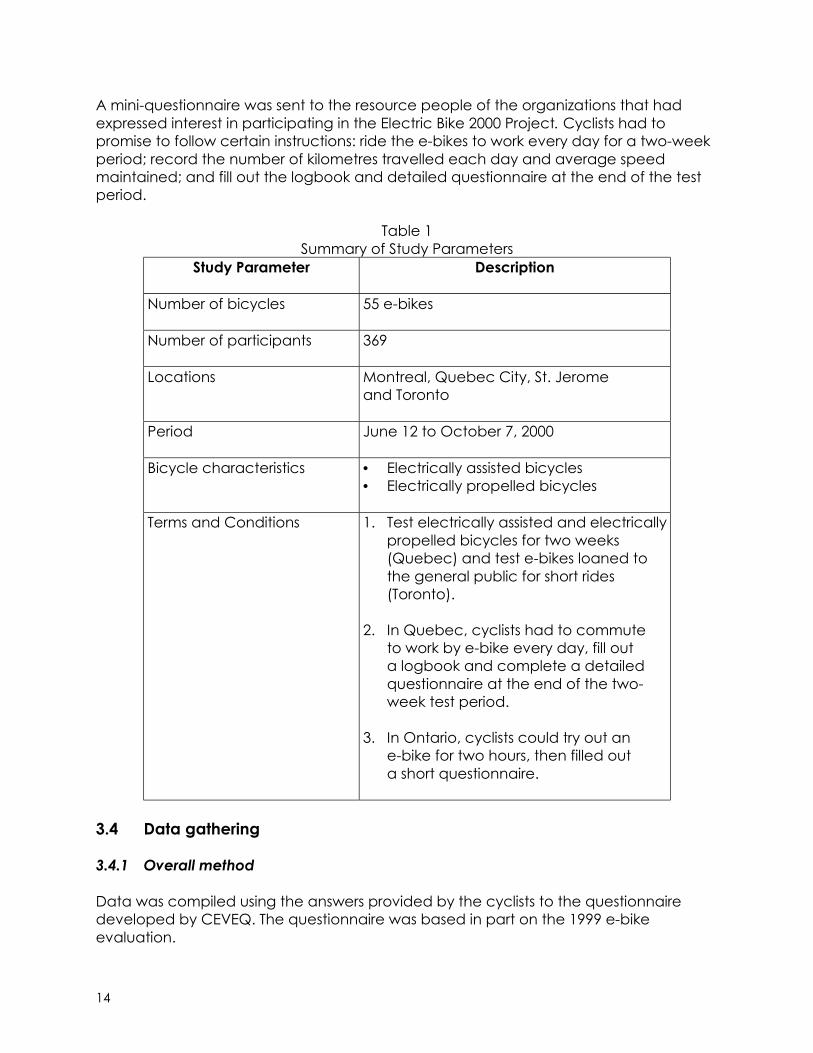
Table 1Summary of Study Parameters
Study Parameter Description
Number of bicycles 55 e-bikes
Number of participants 369
Locations Montreal, Quebec City, St. Jeromeand Toronto
Period June 12 to October 7, 2000
Bicycle characteristics • Electrically assisted bicycles• Electrically propelled bicycles
Terms and Conditions 1. Test electrically assisted and electricallypropelled bicycles for two weeks(Quebec) and test e-bikes loaned tothe general public for short rides(Toronto).
2. In Quebec, cyclists had to commuteto work by e-bike every day, fill outa logbook and complete a detailedquestionnaire at the end of the two-week test period.
3. In Ontario, cyclists could try out ane-bike for two hours, then filled outa short questionnaire.
3.4 Data gathering
3.4.1 Overall method
Data was compiled using the answers provided by the cyclists to the questionnairedeveloped by CEVEQ. The questionnaire was based in part on the 1999 e-bikeevaluation.

15
3.4.2 Questionnaire
The questionnaire sent to the Quebec cyclists consisted of 126 questions and anadditional page reserved for comments. The questions were grouped into nine sectionscovering the following topics: Overall User Profile (9 questions); E-Bike Use (20 questions);E-Bike Comfort, Design and Economy (15 questions); E-Bike Performance (7 questions);E-Bike Technical Follow-Up (5 questions); E-Bike Personal Safety (38 questions); E-BikeAnti-theft Measures (9 questions); Overall Evaluation (6 questions); and Purchasing(17 questions).
The data obtained from some of the questions were not analysed for this reportbecause their subject matter did not pertain to the study’s main objectives. However,this data was gathered for informational purposes and for possible future use.
The questionnaire was structured according to the profile of the volunteers anddesigned to take into account the elements required to achieve the project’s mainobjective. It was intended to provide respondents with a maximum number of choiceswhile controlling the way in which the questions could be answered. Replies wereaccurate and objective because the questionnaire was carefully controlled, except forthe comments section.
This approach was adopted to ensure consistency in the cyclists’ answers as well as tofacilitate data entry and use. Cyclists were asked to answer Yes/No questions andmultiple-choice questions. They were then free to give specific comments at the end ofthe questionnaire.
A database was developed based on the Yes/No and multiple-choice questions. Thedata from the questionnaires were then entered into a relational database. MS Officesoftware was used to integrate all of the data in order to reproduce the questionnaireprofile. All analysis results were prepared using a query generator and tables producedby a spreadsheet program.
The results entered in the database were obtained from the information provided bycyclists following their e-bike testing. Among the operations carried out was acomparison of the data for electrically propelled bicycles and data for electricallyassisted bicycles. This comparison made it possible to assess the various impacts,including the impact on safety, which was a primary objective of this study.
These results were also expressed as ratios (percentages) to indicate the relationshipbetween a specific group of cyclists and the entire pool of evaluators. In some cases,cyclists chose not to answer questions, which explains why the accumulated totals ofvarious percentages do not always add up to 100 percent.
3.4.3 Cyclists’ comments
As mentioned in section 3.4.2, the questionnaire included space for entering additionalcomments or observations in addition to the objective multiple-choice questions.

16
These comments were grouped by topic according to a table outlining ten differentsubject areas to which the questionnaire questions related. They were also groupedaccording to whether they applied to EABs or EPBs.
Appendix A presents a qualitative analysis of these groupings. The analysis sought todetermine whether some of these comments confirmed or qualified the data obtainedthrough the questionnaire questions or provided additional information. It also tried toestablish the significance of these comments, depending on the subject area, inrelation to the complete set of data, or whether they were only isolated remarks madeby just a few cyclists. It is important to note that not all cyclists provided comments.
A meeting was held on November 23, 2000 to validate some of the analysis elementsand results. This meeting involved a very small group of cyclists who had tested severaltypes of e-bikes. This report refers to them where relevant.
3.4.4 Special characteristics of the Ontario tests
Table 1 shows that a total of 369 people answered the questionnaire. Of this number,211 were Quebec residents and 158 were Ontario residents.
Because the e-bikes were tested under different conditions in Quebec and Ontario,care had to be taken in the final comparison of results.
It must be noted that adjustments had to be made to the Ontario project. Thequestionnaire filled out by Ontario cyclists was much shorter because of the morelimited scope of the tests. It consisted of 31 questions and included space forcomments. The questions covered the following topics: Overall Profile (8 questions);E-Bike Use (4 questions); E-Bike Performance (4 questions); Personal Safety (8 questions);Overall Evaluation (4 questions); and Purchasing (3 questions).
The 158 Ontario cyclists rode the e-bikes for one to two hours on bicycle paths beforefilling out the questionnaires. In Quebec, the 211 cyclists kept the e-bikes for two weeksand used them on weekdays on public thoroughfares to commute to work and onweekends for personal or recreational use.
Obviously, the two sets of results could not be compared directly. To ensure accuracyand avoid distorting the results, attention was focused primarily on the Quebec testdata. If necessary, a separate analysis of the Ontario tests may be conducted toconfirm the Quebec results.
3.5 Approvals
3.5.1 Transport Canada approval
Once an agreement had been reached with the American, European and Japanesemanufacturers, CEVEQ submitted a request to bring e-bikes into Canada temporarilyfor demonstration and test purposes in accordance with the Motor Vehicle Safety Act.
17
Transport Canada’s approval was essential in order to bring the e-bikes into Canadatemporarily and, of course, carry out the project.
3.5.2 Authorization from the Société de l’Assurance Automobile du Québec (SAAQ)
The SAAQ allowed the e-bikes to be used in Quebec under certain conditions in thecontext of a pilot project. It classified the project’s e-bikes as conventional bicyclessubject to all of the requirements, obligations and privileges of the Highway SafetyCode and the Automobile Insurance Act.
3.5.3 Special problems in the Ontario evaluation
When the evaluation project was developed for the fourth participating Canadiancity – Toronto – authorization to ride e-bikes on public thoroughfares could not beobtained from the Ontario Ministry of Transport (OMT). Despite the efforts of CEVEQ andits partners, the OMT refused, citing the Highway Traffic Act which, in the currentwording of one its Regulations, places electric bicycles in the Motorcycle category andthus requires users to take a recognized motorcycle driver training course to obtain apermit. The project had to be modified and the e-bikes were ridden in areas undermunicipal jurisdiction, such as parks and bicycle paths. Two bicycle rental stores madethe e-bikes available to the public for test periods varying from one to several hours.
3.6 Communication strategy
The two main objectives of the project were to promote the bicycle as a mode ofurban transportation with the potential to replace the automobile, and to raise publicand government awareness. A communication strategy was implemented, whichhelped significantly to promote this project across Canada.
3.6.1 Promotional tools
Bicycle identification
For identification purposes, the bicycle seats were fitted with licence plates sporting theproject colours along with an individual number to simplify co-ordinating activities.
Information brochure
A colour brochure printed on glossy stock – 4,000 copies of the French version and 1,000of the English version – was distributed at all activities throughout the summer. Theslogan Biking Electric to Work underlined the environmental impact and generatedinterest.
T-shirts
Four hundred and fifty colour T-shirts with the project logo were produced: 350 with theFrench slogan Je roule électrique au travail and 100 with the English slogan Biking

18
Electric to Work for Toronto participants. The logos of the partners were printed on thebacks of the T-shirts.
A T-shirt was given to each cyclist as well as to organizers, media representatives, andothers.
Posters
One hundred large-format colour posters printed on glossy paper were produced inFrench and each participating organization received a copy. Thirty additional postersin English were printed.
A 24" x 36" poster on stiff-backed paper was also produced for use at special eventsand press conferences.
3.6.2 Press conferences
Four press conferences were held in the participating cities on the following dates:• Quebec City, June 13, 2000;• St. Jerome, June 22, 2000;• Montreal, July 11, 2000;• Toronto, August 17, 2000.
Photo 5
Two e-bikes on display during filming of the television show “Technofolies”
19
4. LIST OF TESTED BICYCLES AND SPECIAL CHARACTERISTICS
For the purposes of the Electric Bike 2000 Project evaluation program, it was vitallyimportant to test a large sample of products. It was a priority to obtain a sufficientnumber of EABs and EPBs from Canadian, American, European and Japanesemanufacturers so that the two technologies could be tested by a large number ofpeople.
CEVEQ also tried to obtain e-bikes with power output ratios greater than 1:1 to studywhether the extra power supplied by the motor would place cyclists at risk when theratio was higher than human power output (power output ratios of 2:1 and 3:1).
Given that motor power output would be a key parameter in future regulations,products equipped with motors whose power outputs ranged between 200 and 750 Wwere requested.
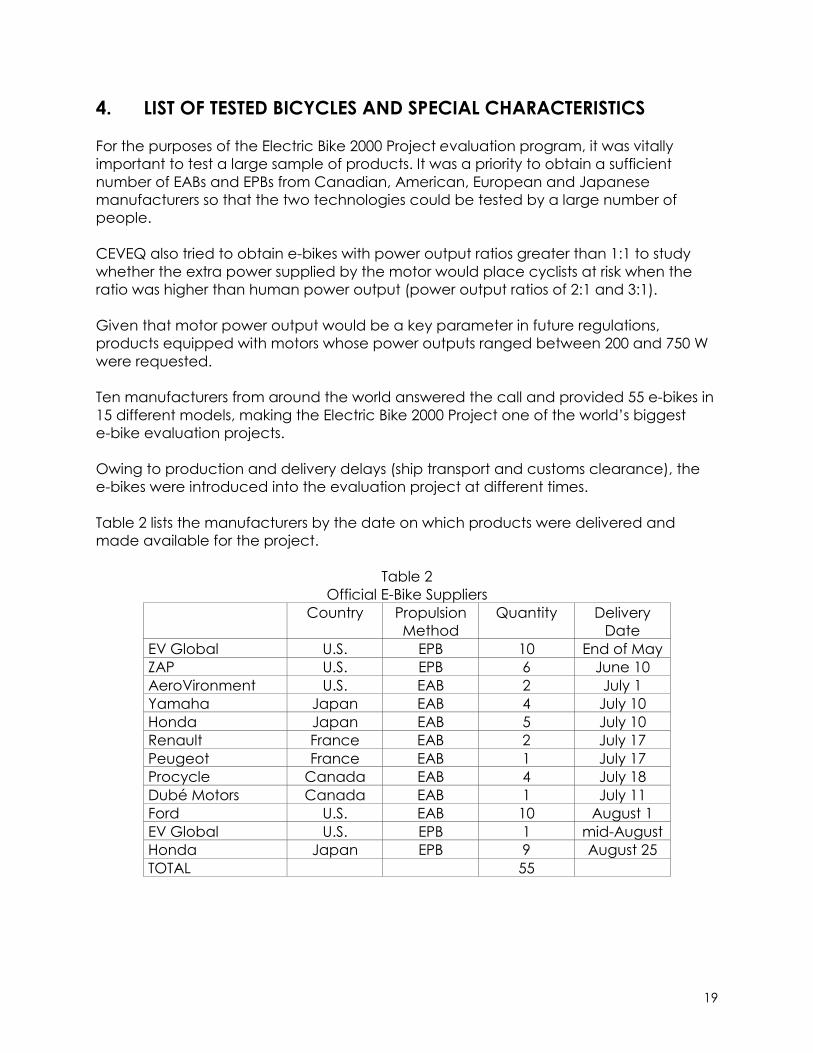
Ten manufacturers from around the world answered the call and provided 55 e-bikes in15 different models, making the Electric Bike 2000 Project one of the world’s biggeste-bike evaluation projects.
Owing to production and delivery delays (ship transport and customs clearance), thee-bikes were introduced into the evaluation project at different times.
Table 2 lists the manufacturers by the date on which products were delivered andmade available for the project.
Table 2Official E-Bike Suppliers
Country PropulsionMethod
Quantity DeliveryDate
EV Global U.S. EPB 10 End of MayZAP U.S. EPB 6 June 10AeroVironment U.S. EAB 2 July 1Yamaha Japan EAB 4 July 10Honda Japan EAB 5 July 10Renault France EAB 2 July 17Peugeot France EAB 1 July 17Procycle Canada EAB 4 July 18Dubé Motors Canada EAB 1 July 11Ford U.S. EAB 10 August 1EV Global U.S. EPB 1 mid-AugustHonda Japan EPB 9 August 25TOTAL 55

Table 3Characteristics of Electric Bicycles on the Market
Characteristics
Company Brand Countryof origin Motor Power
OutputRatio
SpeedLimit
(km/h)
PropulsionMethod
Battery Range(km)
Numberof
Speeds
Time toRecharge
(hours)
Weight(kg)
Numberof
BicyclesProvided
AeroVironment Charger U.S. 375 W ½:1 1:1
2:1 3:1
32 EAB Pb 24V 32 7 4 29 2
EPS Amigo Canada 400 W ½:1
1:1
2:1
32 Bi-modal Ni-Cd24V
30 21 3 24 1
EV GlobalMotors
E-Bike (24V)
E-Bike (36V)
U.S.
U.S.
400 W
400 W
24
32
EPB
EPB
Pb 24V
Pb 24V
32
32
7
7
4
4
32 10
1
Honda Racoon Compo
Grand Racoon
Japan
Japan
200 W
220 W
1:1
1:1
18
24
EAB
EAB
Ni-Cd24V
Ni-Cd24V
20
30
3
3
2
3
22
25
5
9
Peugeot Velectron France 200 W 1:1 24 EAB Ni-Cd24V
35 4 3½ 28 1
Charger Amigo E-Bike Racoon Compo Velectron

Table 3 (cont.)Characteristics of Electric Bicycles on the Market
Characteristics
Company Brand Countryof Origin Motor Power
OutputRatio
SpeedLimit
(km/h)
PropulsionMethod
Battery Range(km)
Numberof
Speeds
Time toRecharge
(hours)
Weight(kg)
Numberof
BicyclesProvided
Procycle Elektron II Canada 250 W 1:1
2:1
3:1
24 EAB Ni-Cd24V
50 3 4 24 4
Renault Equation France 250 W 1:1 24 EAB withaccelerator
Ni-Cd24V
35 4 4 33 2
Th!nk Mobility Th!nk Bike Fun
Th!nk Traveller
U.S.
U.S.
400 W
250 W
1:1
1:1
32
29
EAB withaccelerator
Pb 24V 40
30
7
4
2-4
1-4
33
24
5
5
Yamaha PAS XPC26 Japan 235 W 1:1 24 EAB Ni-MH24V
50 4 3½ 28 4
ZAP Bianchi
Diamondback
Smith & Wesson
U.S.
U.S.
U.S.
400 W
200 W
400 W
29
21.5
29
EPB
EPB
EPB
Pb 12V
Pb 12V
Pb 12V
13
25
20
7
21
21
3
10
3
24
24
24
2
2
2
Elektron Equation Th!nk Traveller PAS XP Diamondback
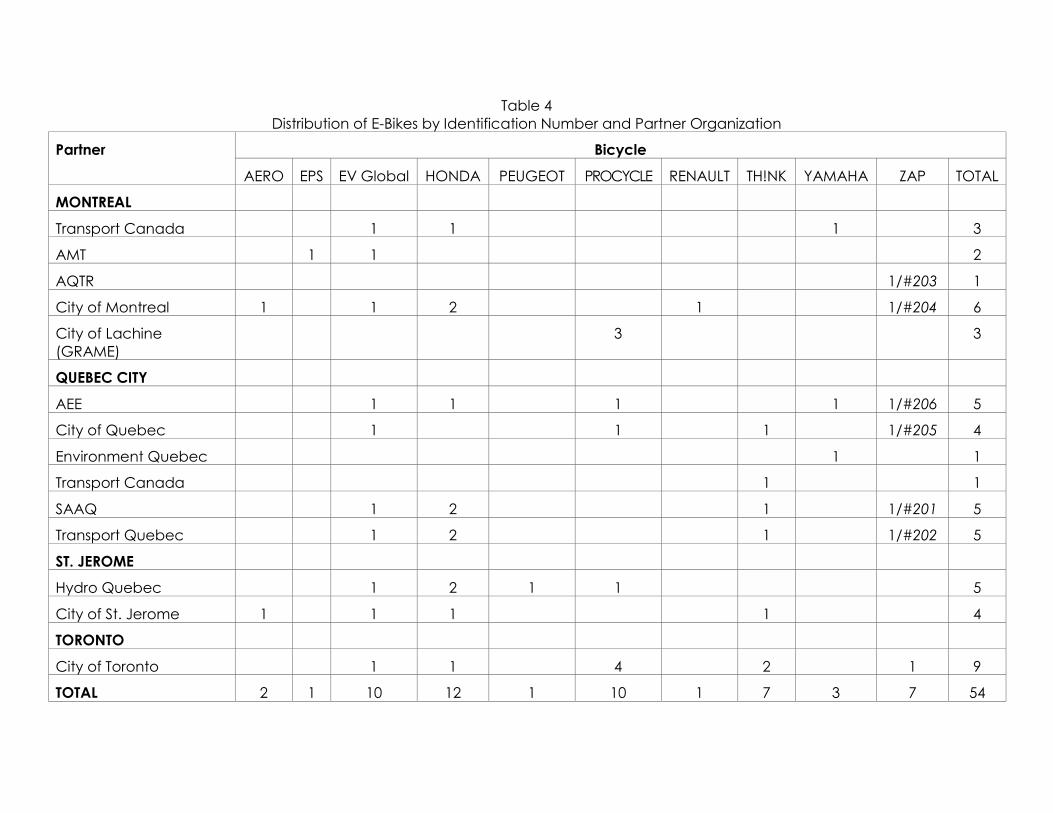
Table 4Distribution of E-Bikes by Identification Number and Partner Organization
BicyclePartner
AERO EPS EV Global HONDA PEUGEOT PROCYCLE RENAULT TH!NK YAMAHA ZAP TOTAL
MONTREAL
Transport Canada 1 1 1 3
AMT 1 1 2
AQTR 1/#203 1
City of Montreal 1 1 2 1 1/#204 6
City of Lachine(GRAME)
3 3
QUEBEC CITY
AEE 1 1 1 1 1/#206 5
City of Quebec 1 1 1 1/#205 4
Environment Quebec 1 1
Transport Canada 1 1
SAAQ 1 2 1 1/#201 5
Transport Quebec 1 2 1 1/#202 5
ST. JEROME
Hydro Quebec 1 2 1 1 5
City of St. Jerome 1 1 1 1 4
TORONTO
City of Toronto 1 1 4 2 1 9
TOTAL 2 1 10 12 1 10 1 7 3 7 54

23
5. EVALUATION RESULTS
5.1 General
5.1.1 Distance travelled by cyclists
As indicated in Table 5, 369 people travelled a total of 25,205 km on e-bikes in fourmonths. In the three Quebec cities – Montreal, St. Jerome and Quebec City –211 people travelled a total of 24,343 km to commute to work, an average of 115 kmper cyclist during the two weeks of evaluation. In Ontario, 158 people travelled 862 km,an average of 5.4 km per cyclist.
Most of the volunteers normally used cars for their transportation purposes. Of the totalnumber of participants, 49 percent had never used a bicycle to commute to work,18 percent cycled to work a few times per month, 15 percent commuted to work bybike one to four times per week and 16 percent cycled to work every day.
Table 5 shows the breakdown of the cyclists who participated in the evaluation andcompleted questionnaires, and the number of kilometres they travelled.
Table 5Distances Travelled and Number of Cyclists
Province EPBs EABs TotalQUEBECNumber of cyclists 106 105 211Number of km travelled 12,823 11,520 24,343ONTARIONumber of cyclists 31 127 158Number of km travelled 150 712 862Total number of cyclists 137 232 369Total number of kmtravelled
12,973 12,232 25,205
Although there were more electrically assisted bicycles than electrically propelledbicycles available for the project, the number of returned questionnaires was identicalin both cases because the EPBs began to be used in the project starting in June,whereas the delivery of the EABs was delayed and some brands, such as Honda, wereintroduced into the project fairly late.
It is interesting to note that a similar number of kilometres was travelled in both cases,which allowed more relevant and consistent comparisons to be made between thecharacteristics of EABs and EPBs.
Because e-bikes could only be ridden on bicycle paths and in parks in Ontario, theresulting insufficient data gathered in Ontario could not be compared with the Quebec
24
data. Although the number of Ontario cyclists was fairly similar to that of Quebec, theanalysed results could not be viewed in the same way. For example, the 158 Ontariocyclists who answered the questionnaire only travelled 3 percent – a statisticallyinsignificant 862 km – of the total number of kilometres and only rode the e-bikes forvery short periods. Some Ontario e-bike users said they were unable to properly judgeelements of the answers they were asked to provide.
5.1.2 Cyclist profile
While Table 5 provides a summary of the distances travelled and number of cyclists inthe provinces of Quebec and Ontario, the following section provides an analysis ofQuebec cyclists.
Quebec cyclists
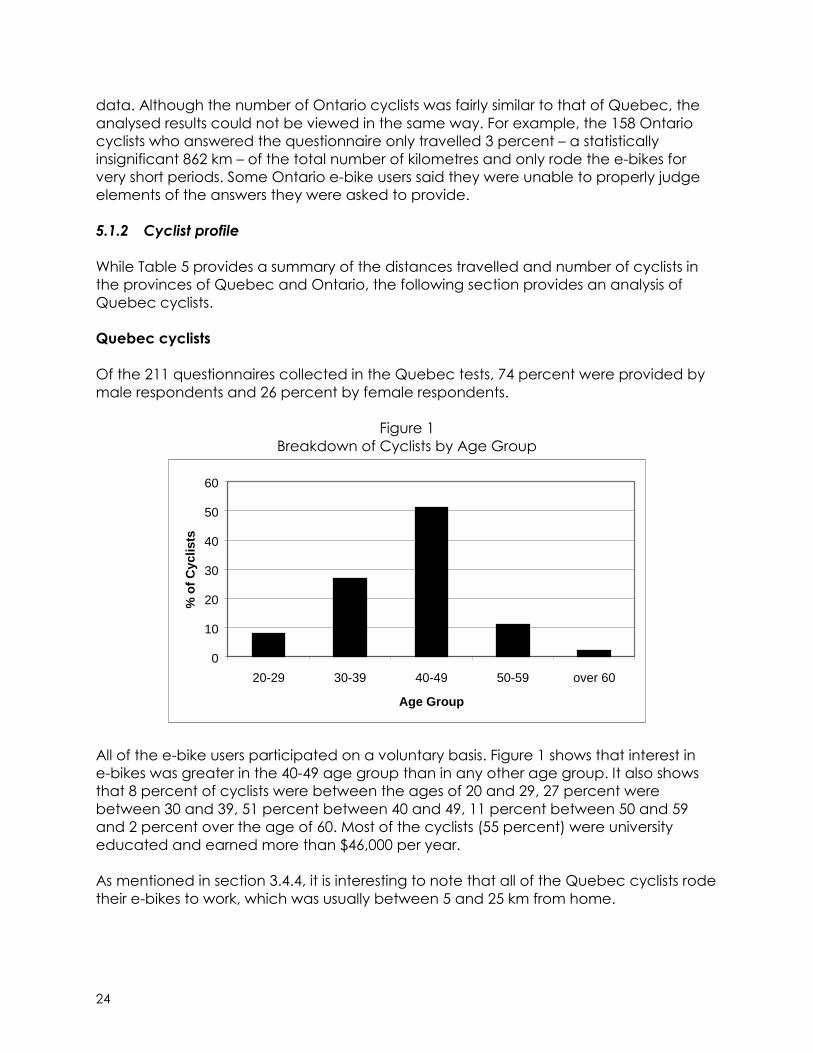
Of the 211 questionnaires collected in the Quebec tests, 74 percent were provided bymale respondents and 26 percent by female respondents.
Figure 1Breakdown of Cyclists by Age Group
0
10
20
30
40
50
60
20-29 30-39 40-49 50-59 over 60
Age Group
% o
f C
yclis
ts
All of the e-bike users participated on a voluntary basis. Figure 1 shows that interest ine-bikes was greater in the 40-49 age group than in any other age group. It also showsthat 8 percent of cyclists were between the ages of 20 and 29, 27 percent werebetween 30 and 39, 51 percent between 40 and 49, 11 percent between 50 and 59and 2 percent over the age of 60. Most of the cyclists (55 percent) were universityeducated and earned more than $46,000 per year.
As mentioned in section 3.4.4, it is interesting to note that all of the Quebec cyclists rodetheir e-bikes to work, which was usually between 5 and 25 km from home.
25
Ontario cyclists
Overall, the Ontario cyclists were fairly well-educated (56 percent had universityeducation); most were over 40 years old (63 percent); and 46 percent earned morethan $46,000 per year. They considered physical exercise important (94 percent) andfelt they had a moderate level of fitness (80 percent).
5.2 E-bike safety
5.2.1 General
One of the evaluation’s objectives was to assess the feelings of safety of e-bike users. Todate, e-bikes do not have a specific classification in federal regulations. Throughout thisstudy, it was interesting to determine whether the cyclists felt as safe riding on e-bikes ason conventional bicycles, whether they felt in full control on e-bikes and whether thepower assist of the motors enhanced their feeling of safety.
Assuming that the cyclist’s feeling of safety is related to the speed of the bicycle andgiven that the two types of e-bikes accelerate in different ways, it was worthdetermining whether the EPB, which is activated by a lever, should be classified in thesame category as the EAB, which only propels itself when pedalled.
Sections 5.2.2 to 5.2.7 provide a comparison of these two types of e-bikes to determinewhether they have a different impact on cyclists’ feelings of safety. The safety aspect isdiscussed under the following headings:• E-bike control/handling capability• Effect of maximum power assist speed• Ergonomic features• Feelings of safety related to wearing a protective helmet• Minimum age for riding an e-bike• Safety of e-bikes on bicycle paths
5.2.2 Comparison of EPB and EAB handling capabilities
Quebec cyclists
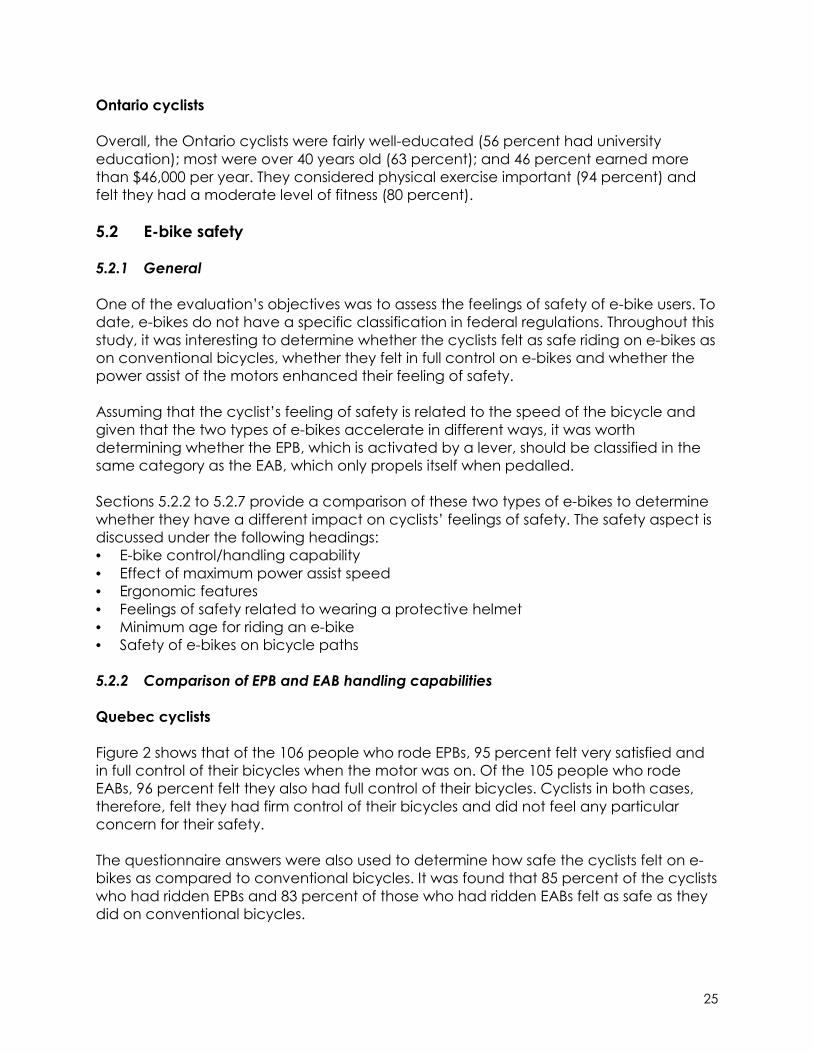
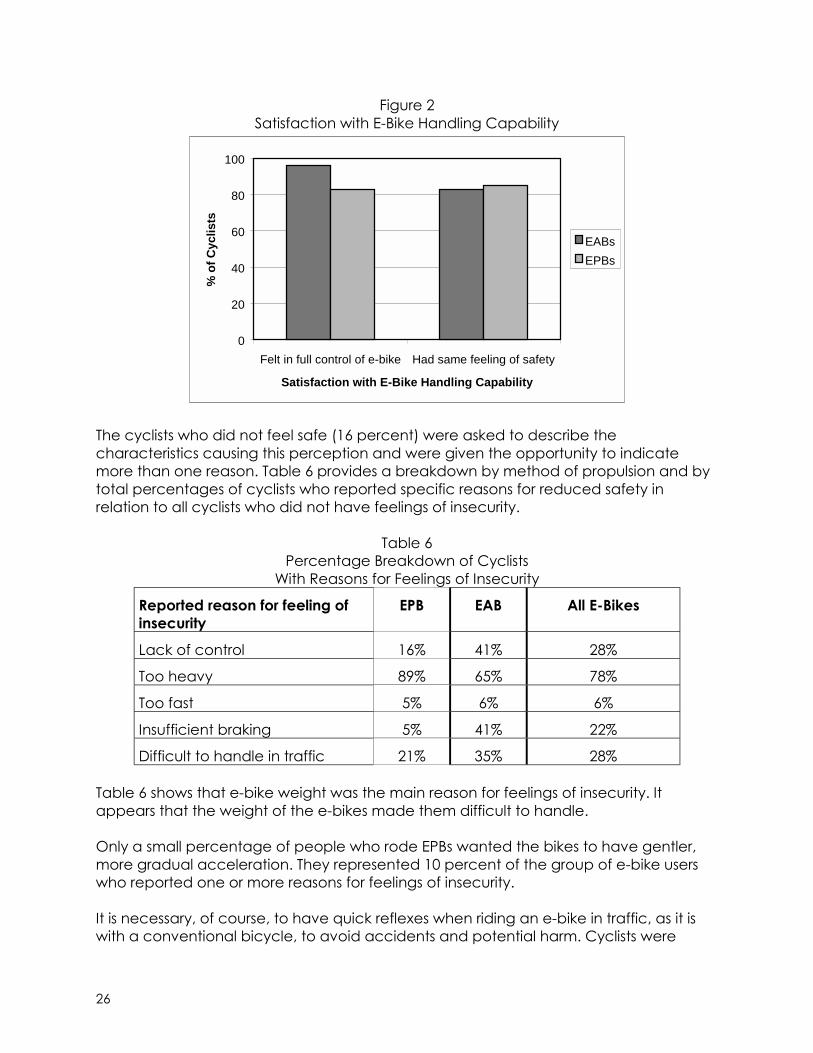
Figure 2 shows that of the 106 people who rode EPBs, 95 percent felt very satisfied andin full control of their bicycles when the motor was on. Of the 105 people who rodeEABs, 96 percent felt they also had full control of their bicycles. Cyclists in both cases,therefore, felt they had firm control of their bicycles and did not feel any particularconcern for their safety.
The questionnaire answers were also used to determine how safe the cyclists felt on e-bikes as compared to conventional bicycles. It was found that 85 percent of the cyclistswho had ridden EPBs and 83 percent of those who had ridden EABs felt as safe as theydid on conventional bicycles.
26
Figure 2Satisfaction with E-Bike Handling Capability
0
20
40
60
80
100
Felt in full control of e-bike Had same feeling of safety
Satisfaction with E-Bike Handling Capability
% o
f C
yclis
ts
EABs
EPBs
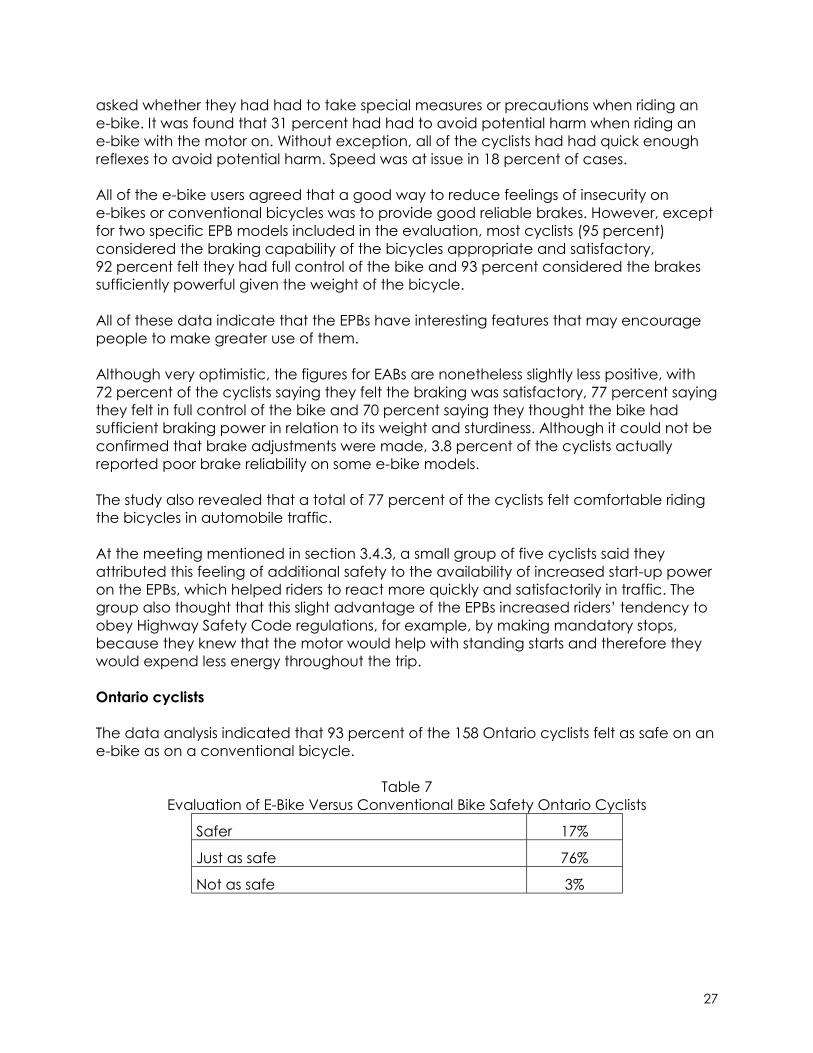
The cyclists who did not feel safe (16 percent) were asked to describe thecharacteristics causing this perception and were given the opportunity to indicatemore than one reason. Table 6 provides a breakdown by method of propulsion and bytotal percentages of cyclists who reported specific reasons for reduced safety inrelation to all cyclists who did not have feelings of insecurity.
Table 6Percentage Breakdown of Cyclists
With Reasons for Feelings of Insecurity
Reported reason for feeling ofinsecurity
EPB EAB All E-Bikes
Lack of control 16% 41% 28%
Too heavy 89% 65% 78%
Too fast 5% 6% 6%
Insufficient braking 5% 41% 22%
Difficult to handle in traffic 21% 35% 28%
Table 6 shows that e-bike weight was the main reason for feelings of insecurity. Itappears that the weight of the e-bikes made them difficult to handle.
Only a small percentage of people who rode EPBs wanted the bikes to have gentler,more gradual acceleration. They represented 10 percent of the group of e-bike userswho reported one or more reasons for feelings of insecurity.
It is necessary, of course, to have quick reflexes when riding an e-bike in traffic, as it iswith a conventional bicycle, to avoid accidents and potential harm. Cyclists were
27
asked whether they had had to take special measures or precautions when riding ane-bike. It was found that 31 percent had had to avoid potential harm when riding ane-bike with the motor on. Without exception, all of the cyclists had had quick enoughreflexes to avoid potential harm. Speed was at issue in 18 percent of cases.
All of the e-bike users agreed that a good way to reduce feelings of insecurity one-bikes or conventional bicycles was to provide good reliable brakes. However, exceptfor two specific EPB models included in the evaluation, most cyclists (95 percent)considered the braking capability of the bicycles appropriate and satisfactory,92 percent felt they had full control of the bike and 93 percent considered the brakessufficiently powerful given the weight of the bicycle.
All of these data indicate that the EPBs have interesting features that may encouragepeople to make greater use of them.
Although very optimistic, the figures for EABs are nonetheless slightly less positive, with72 percent of the cyclists saying they felt the braking was satisfactory, 77 percent sayingthey felt in full control of the bike and 70 percent saying they thought the bike hadsufficient braking power in relation to its weight and sturdiness. Although it could not beconfirmed that brake adjustments were made, 3.8 percent of the cyclists actuallyreported poor brake reliability on some e-bike models.
The study also revealed that a total of 77 percent of the cyclists felt comfortable ridingthe bicycles in automobile traffic.
At the meeting mentioned in section 3.4.3, a small group of five cyclists said theyattributed this feeling of additional safety to the availability of increased start-up poweron the EPBs, which helped riders to react more quickly and satisfactorily in traffic. Thegroup also thought that this slight advantage of the EPBs increased riders’ tendency toobey Highway Safety Code regulations, for example, by making mandatory stops,because they knew that the motor would help with standing starts and therefore theywould expend less energy throughout the trip.
Ontario cyclists
The data analysis indicated that 93 percent of the 158 Ontario cyclists felt as safe on ane-bike as on a conventional bicycle.
Table 7Evaluation of E-Bike Versus Conventional Bike Safety Ontario Cyclists
Safer 17%
Just as safe 76%
Not as safe 3%

28
The very small number of cyclists (5) who did not feel safe gave the following reasons:• Lack of control;• Bike too heavy;• Bike too fast;• Insufficient braking.
Each reason was cited by only one or two cyclists.
In addition, a high percentage of cyclists (88 percent) specified that speed was not afactor in feelings of insecurity. Most of them wanted the motor power assist to enablethem to achieve a speed above 25 km/h, as shown in Table 8.
Table 8Preferred Maximum Power Assist Speed Ontario Cyclists
15 km/h 9%
20 km/h 22%
25 km/h 25%
30 km/h 33%
5.2.3 Impact of speed on e-bike safety
Since motorized vehicles are generally associated with “a faster mode of travel,” itshould be emphasized that, although e-bikes are propelled by two complementarypower sources – human power and electric power – these power sources are notconsidered a way to break speed records, but rather a way to stabilize the e-bike andhelp the cyclist reach a steady average speed. Cyclists feel the power assist of themotor when they cannot pedal efficiently, particularly during start-ups, on hills and inwindy or adverse weather conditions.
Cyclists’ answers indicated that instead of exhausting their own physical resources andquickly tiring, they felt “assisted” and were able to climb hills easily at a speed of 20km/h. Cyclists were therefore able to maintain an average speed without inordinateeffort over the entire distance.
Figure 4 shows that most (more than 70 percent) of the cyclists felt they were no longerassisted by the motor at speeds higher than 23 km/h, the reason being that most of thetested e-bikes did not achieve maximum speeds above 24 km/h. Some of thesebicycles – both EABs and EPBs – had power assist up to 30 km/h.

29
Figure 3Perceptions of Maximum Power Assist Speed
0
10
20
30
40
14 17 20 23 26 29
Speed (km/h)
% o
f C
yclis
ts
EABs
EPBs
On the basis of these observations, a correlation was established between themaximum speed to be adopted and the cyclists’ feelings of safety on electric bicycles.
Figure 4Feeling of Safety at Higher Power Assist Speeds
0
20
40
60
80
Just as safe Safer Not as safe
Feeling of Safety
% o
f C
yclis
ts
EABs
EPBs
Most of the cyclists felt that e-bikes, whether assisted or self-propelled, were as safe andsometimes even safer than conventional bicycles. Only some 4 percent of the cyclistsfelt that increasing the speed would result in feelings of insecurity.
5.2.4 Impact of ergonomics on e-bike safety
Figure 5 shows that the cyclists thought it was safer to activate the motor using a leverattached to the handlebar. This view was shared by EAB users (37 percent approved).

30
The relevance of this suggestion is interesting because a large majority of the cyclistswere not able to try both types of e-bike start-up methods.
Figure 5Feelings of Greater Safety by Motor Start-Up Method
0
10
20
30
40
50
Pedals Lever on handlebar
Motor start-up method
% o
f C
yclis
ts
EABs
EPBs
Many comments indicated that the cyclists’ feelings of safety on an e-bike were oftenrelated to the design of the bicycle itself, particularly the motor control levers.
Although the EPBs seemed safer because of their start-up method, the following fourcomments about this type of bicycle suggest that improvements are necessary:• “I have to let go of the lever to signal.”• “The motor lever on the handlebar is too hard to operate.”• “The lever for starting the motor is in a bad spot.”• “The motor control lever is in a bad spot; it should be placed on the right handlebar
because the cyclist has to use the left hand to signal.”
5.2.5 Protective helmets
Although current regulations state that cyclists are advised to wear protective helmets,they are still optional for riders of conventional bicycles. This study sought to determinevolunteers’ perceptions about wearing helmets when riding e-bikes. First, it should beexplained that 78 percent of the cyclists wore helmets during the tests, even thoughCEVEQ formally advised everyone to wear a helmet! Of the total number of cyclists,62 percent suggested that helmets be made mandatory for cyclists on e-bikes.
The data also revealed that 11 percent of the cyclists wanted to take special training inthe use of e-bikes. This comment was difficult to assess because it was unclear whetherthey wanted to take a training course on how to operate an e-bike or simply be givenmore technical information on e-bikes.

31
5.2.6 Minimum age
Most of the cyclists (70 percent) felt that the required minimum age for riding an e-bike,either an EPB or EAB, should be at least 14 years. Figure 6 also shows that a largepercentage (37 percent) felt that the minimum age could even be set at 12 years.
Figure 6Suggested Minimum Age for Riding E-Bikes
0
10
20
30
40
10 12 14 16 18
Age
% o
f C
yclis
ts
EABs
EPBs
5.2.7 E-bikes versus conventional bicycles on bicycle paths
Cyclists who had opportunities to ride on bicycle paths, either to commute to work orfor recreation, provided assessments of the handling capabilities of e-bikes, comparedwith those of conventional bicycles, on bicycle paths. In answer to the question “Doe-bikes belong on bicycle paths?”, 94 percent of respondents said yes and 3 percentsaid no. In all, 2 percent of cyclists felt that e-bikes were not suited because of theirpotential speed. After these answers were studied more closely, it was found that mostof this 2 percent segment had ridden e-bikes with power assists that disengaged at24 km/h. The notion of speed in this case remains questionable.
As shown in Figure 7, between 55 and 70 percent of volunteers felt that their travellingspeed on a bicycle path was similar to or lower than that of ordinary cyclists(conventional bicycles), while 30 percent of EAB riders and 22 percent of EPB ridersthought their speed was higher.
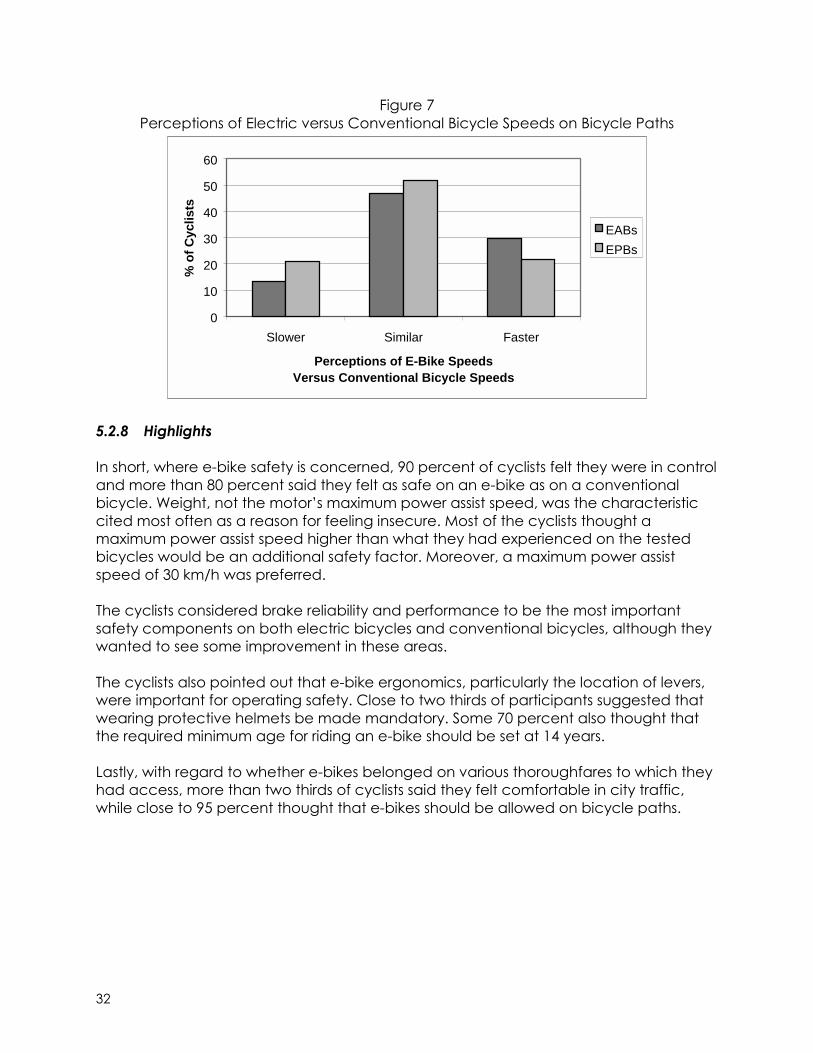
32
Figure 7Perceptions of Electric versus Conventional Bicycle Speeds on Bicycle Paths
0
10
20
30
40
50
60
Slower Similar Faster
Perceptions of E-Bike SpeedsVersus Conventional Bicycle Speeds
% o
f C
yclis
ts
EABs
EPBs
5.2.8 Highlights
In short, where e-bike safety is concerned, 90 percent of cyclists felt they were in controland more than 80 percent said they felt as safe on an e-bike as on a conventionalbicycle. Weight, not the motor’s maximum power assist speed, was the characteristiccited most often as a reason for feeling insecure. Most of the cyclists thought amaximum power assist speed higher than what they had experienced on the testedbicycles would be an additional safety factor. Moreover, a maximum power assistspeed of 30 km/h was preferred.
The cyclists considered brake reliability and performance to be the most importantsafety components on both electric bicycles and conventional bicycles, although theywanted to see some improvement in these areas.
The cyclists also pointed out that e-bike ergonomics, particularly the location of levers,were important for operating safety. Close to two thirds of participants suggested thatwearing protective helmets be made mandatory. Some 70 percent also thought thatthe required minimum age for riding an e-bike should be set at 14 years.
Lastly, with regard to whether e-bikes belonged on various thoroughfares to which theyhad access, more than two thirds of cyclists said they felt comfortable in city traffic,while close to 95 percent thought that e-bikes should be allowed on bicycle paths.
33
5.3 E-bike performance
5.3.1 Overall performance
Quebec cyclists
Participants were asked to evaluate the overall performance of the e-bikes and usetheir judgement to assign ratings from excellent to mediocre. To meet the objectives ofthis study, the performance of the EPBs was compared with that of EABs and nosignificant differences were found.
The following percentages in descending order represent the “excellent” or “good”ratings given by all of the cyclists:• User-friendliness 90%• Braking 88%• Reliability 82%• Acceleration 74%• Recharging time 68%• Range 48%• Speed 46%• Weight 21%
This information confirmed the overall findings, namely, that weight was the least likedaspect. Speed was rated “excellent” by 15 percent of the participants and “good” by30 percent. The other participants gave speed an “average” or “mediocre” rating.
Ontario cyclists
The results listed above can be compared with those of the Ontario cyclists who wereasked the same questions:• User-friendliness 86%• Braking 77%• Reliability 66%• Acceleration 70%• Range 37%• Speed 46%• Weight 57%
Overall, there were many similarities between the perceptions of Quebec and Ontariocyclists. The major difference lay in their perceptions of e-bike weight, which theOntario cyclists rated as “excellent” or “good”. The difference may be explained by thefact that the Quebec participants were allowed to keep their e-bikes for two weeksand were able to handle them much more (e.g., carry them up stairs, place them onbicycle racks, etc.). Battery recharging time was not mentioned because the cyclistscould not test this characteristic.

34
5.3.2 Motor power
This study clearly established that cyclists felt the e-bikes were not fast enough.However, they liked the speed of acceleration, which made it easier for them to getback up to speed in difficult circumstances.
It is important to note that the key attraction of e-bikes was their ability to start up asquickly as possible and climb hills without difficulty. The collected data made it possibleto compare the motor power of the two categories of e-bikes and assess usersatisfaction rates.
Table 9 compares e-bikes equipped with motors with nominal power outputs between100 and 250 W and those with motors with nominal power outputs between 250 and400 W. The results show that motor power was not a determining factor in evaluatingthe power assist for hills and start-ups.
Table 9Percentage Breakdown of Satisfied Cyclists by Motor Power Output
Motors with power output of250 W or less
EABs(83 cyclists)
EPBs(28 cyclists)
Steep hills 24% 11%Start-ups 80% 57%Low or average hills 60% 68%Motors with power output ofmore than 250 W
EABs(18 cyclists)
EPBs(77 cyclists)
Steep hills 17% 21%Start-ups 44% 75%Low or average hills 50% 62%
According to the Table 9 data, EAB riders had a higher satisfaction rate with lesspowerful bicycles. Although it is difficult to quickly draw conclusions, this surprising factmay be attributable to bicycle quality rather than motor power. It should also be notedhere that the final numerical ratio between the chain-wheel and the gear ratio used atstart-up has a direct impact on the bicycle’s accelerating capacity because of thetorque value applied to the rear wheel. This value directly affects the bicycle’scapacity to start up quickly or climb steep hills easily.
In any case, these specific characteristics related to motor power certainly make itpossible to dissociate motor power from e-bike performance. There may be otherfactors to take into account, such as motor location and gear-changingcharacteristics, before looking at motor power.
For the purposes of this project, the cyclists were also asked whether the motor shoulddisengage according to the gear levels. In all, 44 percent of cyclists said yes and36 percent said no. The other cyclists did not answer the question.

35
It was therefore very difficult to make firm observations about motor power for thefollowing reasons: the EPBs were generally more powerful than the EABs; most cyclistsdid not test both types of e-bikes; and there was apparent confusion in the minds ofsome respondents between power and acceleration, and between speed and gearratios or levels.
The cyclists were also not very satisfied with the performance of either type of e-bike onsteep hills, regardless of motor power. It was, in fact, on steep hills that they made thegreatest demands on the motor, which sometimes had difficulty providing enoughassistance. In such cases, cyclists had to compensate by pedalling harder. However,on low or average hills, cyclists found the EPBs to be the most satisfactory vehicles.
5.3.3 Maximum e-bike speed
It was found during the study that, depending on the cyclists’ opinions of the e-bikesand their experience with conventional bicycles, there was considerable similarity in thespeeds obtained with the bike in conventional mode and electric mode. According tothe data collected on both EABs and EPBs, cyclists obtained average maximum speedsof about 30 km/h with or without power assist.
Once it is taken into account that the cyclists did not rely on the power assist of thee-bike motors to obtain higher speeds, it follows that the speed of e-bikes should atleast be equal to the average speed of conventional bicycles. This was one of thereasons the vast majority of cyclists said they preferred that the motor assist them up to30 km/h, as indicated in Figure 8.
The questionnaire gave cyclists a choice of several maximum assisted speeds. Theselection of 30 km/h as the maximum speed was based on various considerations,including the preferences of some government authorities, perceptions of communitystakeholders of what constitutes a reasonable, practical maximum speed, andpractices in Europe where speeds above this level are not permitted.
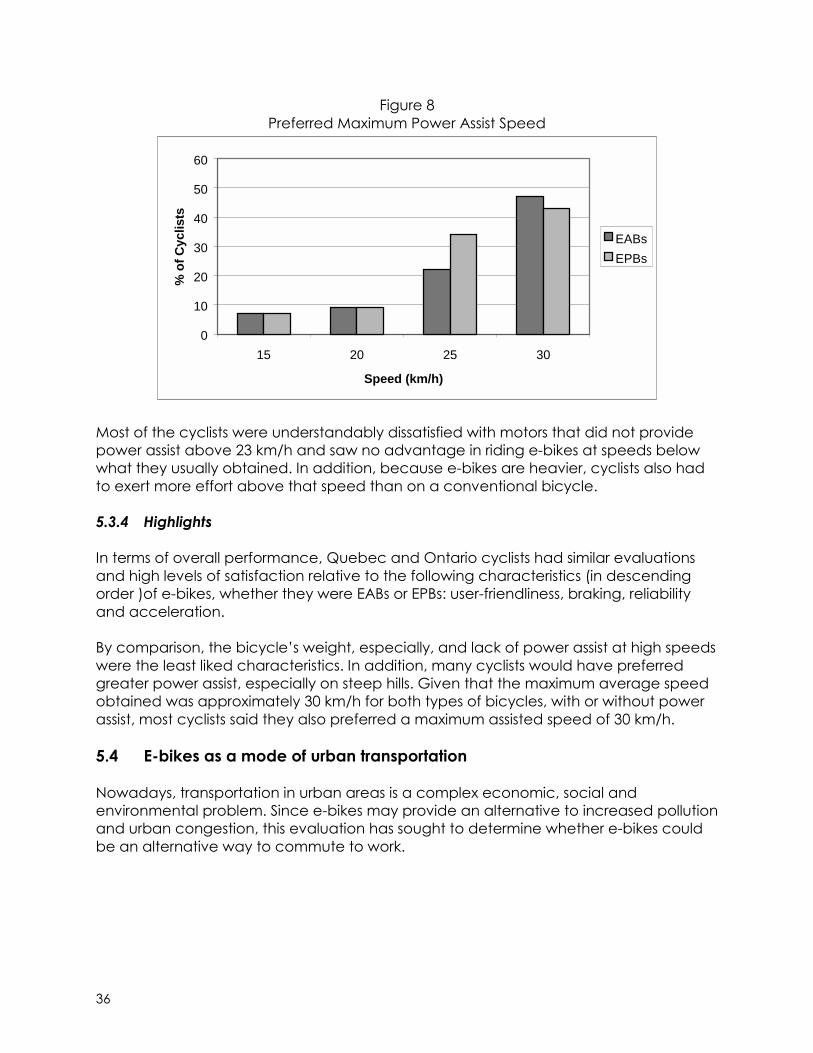
36
Figure 8Preferred Maximum Power Assist Speed
0
10
20
30
40
50
60
15 20 25 30
Speed (km/h)
% o
f C
yclis
ts
EABs
EPBs
Most of the cyclists were understandably dissatisfied with motors that did not providepower assist above 23 km/h and saw no advantage in riding e-bikes at speeds belowwhat they usually obtained. In addition, because e-bikes are heavier, cyclists also hadto exert more effort above that speed than on a conventional bicycle.
5.3.4 Highlights
In terms of overall performance, Quebec and Ontario cyclists had similar evaluationsand high levels of satisfaction relative to the following characteristics (in descendingorder )of e-bikes, whether they were EABs or EPBs: user-friendliness, braking, reliabilityand acceleration.
By comparison, the bicycle’s weight, especially, and lack of power assist at high speedswere the least liked characteristics. In addition, many cyclists would have preferredgreater power assist, especially on steep hills. Given that the maximum average speedobtained was approximately 30 km/h for both types of bicycles, with or without powerassist, most cyclists said they also preferred a maximum assisted speed of 30 km/h.
5.4 E-bikes as a mode of urban transportation
Nowadays, transportation in urban areas is a complex economic, social andenvironmental problem. Since e-bikes may provide an alternative to increased pollutionand urban congestion, this evaluation has sought to determine whether e-bikes couldbe an alternative way to commute to work.

37
5.4.1 Cyclists’ current modes of transportation
Quebec cyclists
The following is a breakdown of the usual modes of transportation used by the211 Quebec participants to commute to work:• 44% by car• 25% by bicycle• 20% by bus• 7% by subway• 4% on foot
Ontario cyclists
The following is a breakdown of modes of transportation currently used by Torontoparticipants to commute to work:• 27% by car• 25% by bicycle• 18% by public transit• 14% on foot
5.4.2 Reasons for commuting to work on e-bikes
Quebec cyclists
When asked what would encourage them to ride an e-bike to their place of work,79 percent of cyclists said that physical exercise was the main reason. For 51 percent,environmental concerns and reducing pollution were an incentive, while for 41 percent,the low cost of e-bike use was a major reason.
Close to two thirds of the participants (64 percent) were prepared to use e-bikes tocommute to work. Of those who usually travelled by car, the percentage climbed to65 percent, while for bicycle users, the rate was 71 percent. Many people are clearlyattracted by the new technology.
Cyclists felt that e-bikes were well suited for commuting to work. Forty-four percentexpressed this opinion, as opposed to 9 percent who thought e-bikes should only beused for recreational purposes.
E-bikes cost between US$1,000 and US$3,000, which may seem expensive at first, butwhen the cost of electricity for recharging the battery (i.e., just a few pennies), and thelower expenditures incurred with this mode of transportation (less money spent onparking, gas, maintenance and purchasing or leasing a second vehicle, for example)are taken into account, it can be advantageous to buy an e-bike.
38
Ontario cyclists
As previously mentioned, volunteers in this part of the evaluation did not have sufficienttime to form strong opinions on e-bikes. However, they were forthcoming in theiropinions about the possible uses for e-bikes. When asked to give their straightforward,unreserved assessments, they said that e-bikes could be used instead of cars forcommuting to work, occasional travel and recreation.
Other results were similar to the Quebec findings: 37 percent of respondents believedthat e-bikes were suitable for commuting to work, while 23 percent said they were onlysuitable for recreation owing to the limited range of the battery (30 km on average).
Moreover, 68 percent of the participants who filled out the questionnaire wereinterested in using e-bikes to commute to work for environmental reasons, greaterspeed in traffic and the benefits of cycling (physical exercise in the fresh air) withouthaving to worry about hills and adverse weather conditions (heat and wind).
However, they found it difficult to believe that the city would allow unrestricted use ofe-bikes. A similar percentage as in Quebec – 34 percent – did not believe that the citywould give cycling commuters priority by adopting supportive measures.
In reply to the question “In your situation, do you think that the e-bike can replace thecar for: (1) commuting to work; (2) occasional travel; (3) recreation?”, the respondents,who were allowed to check off several answers, provided 251 data items. According tothe data, more than half of the cyclists (83 out of 158) would commute to work on ane-bike instead of by car. This percentage shows that e-bikes are perceived as a modeof transportation for both commuting to work and recreation.
5.4.3 E-bike advantages
When asked about the advantages of e-bikes, respondents said that they made iteasier to climb hills (59 percent), ride into the wind (58 percent) and travel in the openair (51 percent). Their liking for the e-bikes’ hill-climbing ability was quite understandablegiven that 84 percent of cyclists could not avoid hills when commuting to work.Regardless of whether they had ridden EABs (42 percent) or EPBs (45 percent),88 percent of respondents said the e-bike made their rides easier.
Similarly, 79 percent of volunteers said the e-bikes enabled them to expend less effortand sweat while riding, and 59 percent said this mode of transportation was now asignificant option for them.
5.4.4 Influence of external factors
With regard to external factors influencing the use of e-bikes, 79 percent of cyclists saidthey were very influenced by the weather. Fear of adverse weather conditions, such asrain (71 percent), was the major drawback, with appropriate apparel following farbehind (35 percent).

39
5.4.5 E-bike parking
Further to the topic of commuting to work by e-bike, the study confirmed that74 percent of cyclists were able to find safe parking for their e-bikes at work. The cyclistsbelieved (64 percent) that their employers would make arrangements to provide themwith safe parking, if necessary. This was a significant finding because 56 percent ofrespondents felt that there were not enough parking spots for conventional bicycles. Inaddition, 89 percent said that during the test phase, they had places that wereconsidered suitable for parking their e-bike.
Theft was a concern for many of the cyclists, who rightly thought these bicycles wouldbe very attractive to thieves. Anti-theft devices need to be improved in most cases toprevent thefts of bicycles and batteries. Some bicycles were difficult to lock in theparking spots provided.
Companies could therefore provide safe parking places for their fitness-mindedemployees, which would naturally promote the use of e-bikes.
5.4.6 Use of bicycle paths
The e-bike users said they rode mostly on bicycle paths for recreational purposes(65 percent) because they did not think (34 percent) that the city in which they livedgave priority to cycling commuters.
However, of those who used e-bikes to commute to work, 49 percent preferred to ridethem on bicycle paths. Furthermore, 9 percent did not think that motorists wereaccommodating toward them.
An e-bike weighs between 27 and 35 kg, which makes it difficult to carry or set inmotion from a stationary position. In their comments, many cyclists expresseddisappointment about not being able transport most e-bikes on the bicycle racksof their cars, because of their weight and shape.
5.4.7 Highlights
Nearly two thirds of respondents said that the primary reasons they were prepared touse e-bikes as a mode of transportation for commuting to work were exercise andenvironmental concerns. They also mentioned the ability to deal more easily withphysically demanding situations as a key advantage.
Most respondents also said they were able to park their e-bikes in a safe place whenthey got to work. However, possible theft of their bicycle was a concern for many.Almost two thirds of the cyclists rode the e-bikes on bicycle paths.

40
5.5 Project impact
The project was given outstanding press coverage. Although it is difficult to provide theexact content of the coverage, many newspaper articles, television and radiointerviews, and special televised features were produced after each press conference.See Appendix B for a list of newspaper articles and radio/television coverageparticulars.
Overall, the Electric Bike 2000 Project generated considerable interest and excitement.
5.5.1 Impact on the public and cyclists
The public was unaware of this new type of bicycle because it has not been marketedin Canada.
The project significantly enhanced the visibility of e-bikes and helped raise publicawareness of the importance of developing non-polluting modes of transportation. Theproject promptly received extensive media coverage; CEVEQ was inundated withinterested visitors; and telephone calls were received from many potential e-bike users.
The cyclists were also keenly interested in the experiment in which they participatedand in the e-bikes themselves. Very few withdrew from the project after their initialinvolvement. They were also conscientious and thorough in filling out their evaluationquestionnaires.
5.5.2 Impact on government authorities
It should be remembered that this project was developed jointly with TransportCanada, Transport Quebec and the Société de l’Assurance Automobile du Québec,and that the results were intended to be a relevant source of information for draftinggovernment regulations.
Various government departments and agencies provided encouragement for thisenvironmental initiative by providing funding and involving their employees.
This evaluation gave the Ontario Ministry of Transportation, through the Moving theEconomy (MTE) organization in Toronto, an opportunity to observe the tests and assessthe relevance of amending its policy and regulations relative to e-bikes.
5.5.3 Impact on participating organizations
Participating firms were very pleased with this innovative project and encouraged theiremployees to commute to work on e-bikes. They also helped set up internalmechanisms to co-ordinate the bicycle testing.
Aside from its environmental character, participatory nature and overall scope, theproject enhanced the corporate images of the participating organizations.

41
E-bike manufacturers benefited from the media coverage and through theirparticipation obtained useful information on cyclists’ perceptions of their variousproducts as well as improvements they wished to see incorporated in the bicycles.

43
6. CONCLUSIONS
That the Electric Bike 2000 Project was a tremendous success can be seen in the level ofinterest it generated in cyclists and participating organizations. Moreover, the sustainedmedia attention received throughout the evaluation project was an indication of theenthusiasm felt for this new mode of transportation.
Because the e-bikes were tested in actual-use situations by people of all ages in variouscities, the study and its findings are widely applicable.
6.1 E-bike safety
The study showed that cyclists did not view the e-bikes as a safety risk, whether theywere assisted (EABs) or propelled (EPBs) by a motor. The test findings also showed thatboth types of e-bikes were considered equally safe. It was suggested that no restrictionson motor start-up methods should be included in the new regulations.
6.2 E-bike performance
The survey findings clearly indicated a feeling of dissatisfaction among cyclists whotested e-bikes with a limited speed of 24 km/h, which was lower than the usual speedthey obtained on conventional bicycles. Above this speed, the cyclists had to exertmuch more effort than on conventional bicycles to compensate for the weight of thebicycles. Top priority should therefore be given to reducing the weight of the bicycles.Based on cyclists’ observations, an increase in the power assist speed to 30 km/h wouldprovide greater latitude without compromising safety.
With respect to the variations in motor power of the e-bikes, it was noted in some casesthat motors with low power output made more work for the cyclists who had tocompensate by pedalling harder. The ideal e-bike for cyclists would be one on whichthey could pedal at the same pace up hills and along flat stretches. The motor shouldbe able to compensate for the additional energy required to pedal up hills.
6.3 E-bikes as a mode of urban transportation
The study found that most of the cyclists were prepared to use e-bikes for commuting towork primarily because they provided good physical exercise within an ecologicalframework while providing power assistance in difficult parts of their journey.
The findings also revealed that improvements should be made in urban communities tomake them more accommodating for e-bike users and thus enhance conditions fore-bike use in general.
Because e-bikes have good acceleration and can easily weave through traffic, cyclistscan quickly react and avert situations that may compromise their safety. The testsdemonstrated that e-bikes could become very popular and replace automobiles asa way to commute to work, particularly in warm weather.

44
6.4 Future of e-bikes
E-bikes admittedly have little appeal for competitive cyclists or mountain bikeenthusiasts. However, they are a feasible mode of transportation for commuting to workor travelling short distances.
During these tests, many people were attracted to the e-bikes, which rekindled theirinterest to travel by different means than a car. Some of them had given up onconventional bicycles because it was difficult to climb the steep hills on their route.Others were hesitant about riding bicycles because of weather conditions.
The evaluation results and the excitement generated by this new vehicle suggest thata segment of the population would leave the car at home and commute to work bye-bike, at least in fine weather.
Seniors and people with respiratory conditions, cardiovascular problems or musculardisabilities can rediscover the pleasures of cycling without having to expend a lot ofphysical effort.
It appears that a new market niche will open up for e-bikes without compromising thetraditional bicycle market. As with conventional bicycles, the more varied the choice ofe-bikes, the greater the number of consumers who will find a product that meets theirneeds.

45
7. RECOMMENDATIONS
7.1 Cyclists’ needs
Further to analysing the answers obtained from participating cyclists in the e-bikeevaluation and the conclusions drawn, the study outlined the following needs ofpotential customers that must be met to promote the use of e-bikes:• Maximum electric power assist speed up to 30 km/h;• A high-performance, ergonomic product capable of assisting cyclists on steep hills
and providing good acceleration;• A lighter product;• A product equipped with accessories that promote greater safety in urban
environments (rearview mirror, lights, saddlebags and effective brakes);• Improved anti-theft devices to prevent the theft of bicycles or batteries;• Safe parking places provided by employers for fitness-minded employees.
7.2 Government regulations
For the purposes of government safety regulations, the study raised the following points:• It was found that motors with the highest power outputs did not provide the e-bikes
with the greatest amount of power assist. The regulations currently proposed byTransport Canada do not cover this aspect. However, it would be worthwhile toenact regulations on acceleration speeds rather than motor power so as not torestrict research and development in the e-bike industry;
• Because the test results demonstrated that both types of e-bikes (EABs and EPBs)were equally safe, it is recommended that no restrictions on the type of power assistprovided by the motor be included in the new regulations.

A-1
APPENDIX A
SUMMARY OF QUALITATIVE ANALYSIS OF CYCLISTS’ COMMENTS
Introduction
The approach used in the methodology, as described in section 3 of the report, gaverespondents very little leeway in their answers, except for a space reserved for personalcomments. These comments provided additional elements for the responses to thequestionnaire and reflect the perceptions of a certain number of cyclists, keeping inmind that not all respondents provided opinions and that respondents were free toprovide details according to their interest in the subject.
More specifically, the analysis was designed to identify a certain number of elementsthat would group respondents’ comments having similar subject matter and put themin a more consistent form. This was done to extract potentially useful information thathad not been provided in the answers to the questions.
Comments were classified according to the following categories: acceleration,minimum driving age, range, control, brakes, interest in this mode of transportation,weight, power, safety and speed. A short qualitative analysis of these comments wascarried out.
Overall perceptions
There were 211 participants in these tests. On average, each participant commentedon two of the ten characteristics described above and, altogether, there were441 comments. However, interest in this mode of transportation, weight, speed, rangeand safety – in descending order – were the e-bike elements that generated moreinterest on the part of the respondents (all categories of electric bicycles combined).
Surprisingly, volunteers were less interested in elements such as acceleration, minimumdriving age and motor power. Because of this low level of interest, these elements arenot dealt with in the following paragraphs.
Interest in e-bikes as a mode of transportation
It was found that 87 percent of test participants expressed in their comments an interestin e-bikes as a mode of transportation. These comments represent 37 percent of thetotal number provided.

A-2
Among the overall observations, some interesting comments made about both types ofe-bikes include the following:• With an e-bike, I am much less short of breath and exert less effort in windy
conditions and on hills;• E-bikes give older people and those with heart conditions and other problems the
chance to exercise and get back into cycling again;• E-bikes are not very advisable for long trips in power-assist mode because of their
limited range; they are better for short trips;• E-bikes are too expensive in comparison with conventional bicycles;• E-bikes can reduce pollution and congestion in urban centres;• E-bikes make it easier to stop and start frequently in city traffic;• Greater provision should be made for e-bikes in city traffic (lack of bicycle paths,
pavement in poor repair and lack of services).
Many other comments were made about a broad range of accessories andequipment, most importantly the following:• Need for a very reliable anti-theft system;• E-bike frame is not suitable for conventional bicycle racks;• Need for headlight, mirrors, horn, saddlebags and mudguards.
Speed
Nearly 34 percent of cyclists commented on this characteristic, which accounted fornearly 15 percent of all comments received. It was found that many cyclists seemed toconfuse the concept of travelling speed with front and rear wheel gear ratios andlevels.
Cyclists generally complained that their e-bikes performed poorly in terms of speedsachieved with power assistance from the motor. It was more difficult to reach ormaintain normal cruising speed than with conventional bicycles.
Many cyclists also complained about an insufficient number of gear ratios, which didnot help them reach the desired or appropriate cruising speed.
Weight
About 32 percent of cyclists commented on this aspect of the e-bikes, whichaccounted for about 14 percent of all comments made.
Regardless of the type of e-bike, EAB or EPB, cyclists preferred a lighter bike. Thefollowing are the comments most frequently made about this characteristic:• The gains achieved on hills are lost on the flat stretches;• It is difficult to lift the bike onto the sidewalk, place it on the roof of a car or position it
on a bike rack;• There is too much weight in relation to its maximum speed;• The bicycle’s weight should be distributed better;• The weight noticeably increases acceleration when you go down hills.

A-3
Range
Some 25 percent of cyclists commented on the e-bikes’ range, which accounted forabout 10 percent of the total number of comments. The range in power-assist modewas generally rated as insufficient.
The following are some typical comments:• Hills reduce the range of the bicycles significantly;• The limited range of the battery causes stress because the charge runs out quickly;• Two chargers are needed: one at work and one at home;• The range is too limited to use the e-bike for recreation.
Safety
About 18 percent of participants commented on the safety of the e-bikes, whichaccounted for nearly 7 percent of all comments. E-bike safety was not an elementidentified by cyclists as a factor that would limit the use of this new mode oftransportation. None of the cyclists said that this type of bicycle was potentiallydangerous or unsafe for their physical well-being because of the power-assist feature.
Contrary to expectations, feelings of insecurity were associated more specifically withthe bicycles’ technical components, for example:• A pedal touches the ground (crankset too close to the ground);• The battery is unstable during travel;• The location of the accelerator lever can be mistaken for that of the brake lever;• The positioning of the motor is a cause for concern (possible burns) or start-up
problems (rider must turn to start it);• There is a risk of falling if going up on a sidewalk diagonally;• The motor slides on the wheel when it rains.
The following comments indicate that the e-bikes are a fairly safe mode oftransportation:• The power assist is not a factor in reduced safety;• The e-bike is safer than a conventional bicycle.
Overall findings
The comments provided by participants are reflected in the report’s conclusions. Theyshow that the cyclists were very pleased for the most part with this mode oftransportation and in favour of its further development. They would like to see changesmade to e-bikes, as with conventional bicycles, to make them more suitable for alltypes of users.
There was also nothing to indicate that this mode of transportation posed a risk for users,especially since it was viewed as a wise choice for seniors and people with disabilities,and because volunteers chose not to say anything in their answers to suggest thatelectric bicycles were in any way unsafe. This is significant in light of the study’s specificobjective to determine whether electric bicycles are potentially dangerous.


B-1
APPENDIX B
LIST OF NEWSPAPER ARTICLES AND RADIO/TELEVISION COVERAGE
The following is an incomplete list of newspaper articles and electronic mediacoverage following CEVEQ’s implementation of the study’s communication strategy.
Newspapers
Le Soleil “Ça roule, ces vélos électriques,” June 14, 2000Le Journal de Québec “Vélos électriques,” June 14, 2000Le Devoir “Vélos branchés,” July 1, 2000Le Nord “Des vélos électriques à Saint-Jérôme,” July 5, 2000Le Devoir “À quand des rues réservées au vélo à Montréal?”
July 12, 2000La Presse “Le vélo électrique pour vaincre la pollution,”
July 12, 2000The Montreal Gazette “Electric Bikes, A Threat to Sweat,” July 12, 2000Le Messager Lachine Dorval “Je roule électrique au travail,” July 16, 2000Le Soleil “Vélos électriques à l’essai,” July 26, 2000Today “City to Study Electric Bikes as Solution to Traffic
Pollution Woes,” August 17, 2000The Globe and Mail “From Sweat to Svelte: Electric Bikes Promise Pep
Without Perspiration,” August 18, 2000The Toronto Star “Electric Bikes to Get Trial Run”, August 18, 2000National Post “Pilot Project Promises to Empower Cyclists,”
August 18, 2000Accès Laurentides “400 cyclistes propulsés à l’électricité,”
September 29, 2000
Radio coverage
Radio-Canada July 11 &12, 2000CKAC July 13, 2000CIME FM July 17, 2000CKOI July 19, 2000Radio Ville-Marie July 15, 2000
Television coverage
TQS; Radio Canada; TVA; RDI; LCN; “Technofolies” show on Canal Z; Télé Québec;and various Toronto television stations.