electricity mandates p - ning · these so-called renewable portfolio ... states with rps mandates...
TRANSCRIPT
EnEr
gy
Poli
cy
&
envi
ron
mEn
t rE
Port
No.
10 F
ebru
ary
2012
Robert BryceSenior Fellow, Manhattan Institute
THE HIGH COST OF RENEWABLE-
ELECTRICITY MANDATES
Publ
ishe
d by
Man
hatt
an In
stitu
te
PC EC E N T E R F O R E N E R G Y P O L I C Y A N D T H E E N V I R O N M E N T
A T T H E M A N H A T T A N I N S T I T U T E
E
thE


The High Cost of Renewable-Electricity Mandates
ExEcutivE Summary
Motivated by a desire to reduce carbon emissions, and in the absence of federal action to do so, 29 states (and the District of Columbia and Puerto Rico) have required utility companies to deliver specified minimum amounts of elec-tricity from “renewable” sources, including wind and solar power. California recently adopted the most stringent of these so-called renewable portfolio standards (RPS), requiring 33 percent of its electricity to be renewable by 2020.
Proponents of the RPS plans say that the mandated restrictions will reduce harmful emissions and spur job growth, by stimulating investment in green technologies.
But this patchwork of state rules—which now affects the electricity bills of about two-thirds of the U.S. population as well as countless businesses and industrial users—has sprung up in recent years without the benefit of the states fully calculating their costs.
There is growing evidence that the costs may be too high—that the price tag for purchasing renewable energy, and for building new transmission lines to deliver it, may not only outweigh any environmental benefits but may also be detrimental to the economy, costing jobs rather than adding them.
The mandates amount to a “back-end way to put a price on carbon,” says one former federal regulator. Put another way, the higher cost of electricity is essentially a de facto carbon-reduction tax, one that is putting a strain on a struggling economy and is falling most heavily, in the way that regressive taxes do, on the least well-off among residential users.
To be sure, the mandates aren’t the only reason that electricity costs are rising—increased regulation of coal-fired power plants is also a major factor—and it is difficult to isolate the cost of the renewable mandates without rigorous cost-benefit analysis by the states.
That said, our analysis of available data has revealed a pattern of starkly higher rates in most states with RPS man-dates compared with those without mandates. The gap is particularly striking in coal-dependent states—seven such states with RPS mandates saw their rates soar by an average of 54.2 percent between 2001 and 2010, more than twice the average increase experienced by seven other coal-dependent states without mandates.
Our study highlights another pattern as well, of a disconnect between the optimistic estimates by government poli-cymakers of the impact that the mandates will have on rates and the harsh reality of the soaring rates that typically result. In some states, the implementation of mandate levels is proceeding so rapidly that residential and commercial users are being locked into exorbitant rates for many years to come. The experiences of Oregon, California, and On-tario (which is subject to a similar mandate plan) serve as case studies of how rates have spiraled.
A backlash may result that could even imperil the effort to protect the environment. Some of the renewable-energy projects being built in California are so expensive that “people are going to get rate shock,” according to Joe Como, acting director of the Division of Ratepayer Advocates, an independent consumer advocacy arm of the California Public Utility Commission. “In the long run,” he said recently, the approval of overpriced renewable energy will harm “the states’ efforts to achieve greenhouse gas reductions.”
Given that the RPS mandates have not received enough study and that they appear to be posing risks to a fragile economy, the prudent course of action is to put the state programs on hold. Existing mandates should be suspended and new ones blocked pending a thorough cost-benefit analysis to determine responsible levels of renewable elec-tricity. In the meantime, where practical, natural gas, the cleanest conventional fuel as well as the least expensive, could fill any gaps in energy supply.

Ener
gy P
olic
y an
d th
e En
viro
nmen
t Re
port
10
February 2012
The High Cost of Renewable-Electricity Mandates
about thE author
ROBERT BRYCE is a senior fellow at the Manhattan Institute’s Center for Energy Policy and the Environment. He has
been writing about energy for two decades and his articles have appeared in numerous publications ranging from
The Wall Street Journal to The New York Times and the Atlantic Monthly to the Washington Post. Bryce’s first book,
Pipe Dreams: Greed, Ego, and the Death of Enron, was named one of the best nonfiction books of 2002 by Publish-
ers Weekly. In 2008, he published Gusher of Lies: The Dangerous Delusions of “Energy Independence”. A review of
Gusher of Lies in The New York Times called Bryce “something of a visionary and perhaps even a revolutionary.” His
fourth book, Power Hungry: The Myths of “Green” Energy and the Real Fuels of the Future, was published in April
2010 by PublicAffairs. The Wall Street Journal called Power Hungry “precisely the kind of journalism we need to hold
truth to power.” The Washington Times said Bryce’s “magnificently unfashionable, superlatively researched new book
dares to fly in the face of all current conventional wisdom and cant.” Bryce appears regularly on major media outlets
including CNN, FOX News, PBS, NPR, and the BBC. He received his B.F.A. from the University of Texas at Austin in 1986.

Ener
gy P
olic
y an
d th
e En
viro
nmen
t Re
port
10
February 2012
The High Cost of Renewable-Electricity Mandates
Introduction
Key Findings: Comparing Electricity Prices in RPS and Non-RPS States
Table 1. States with the Least Expensive—and Most Expensive—Electricity
Comparing Rates in Coal-Dependent States
Table 2. Residential Rate Summary: Top 7 Coal-Dependent
Non-RPS States
Table 3. Generation Summary: Top 7 Coal-Dependent Non-RPS States
Table 4. Residential Rate Summary Comparison: Top 7 Coal-Dependent Non-RPS
& RPS States
Table 5. Residential Rate Summary: Top 7 Coal-Dependent RPS States
Table 6. Generation Summary: Top 7 Coal-Dependent RPS States
In Washington, a Battle of the Estimates
In the States, Rising Rates and Raised Alarms
Figure 1. RPS Policies by State, December 2011
Figure 2. United States—Wind Resource Map
Cost Comparison: Conventional Sources versus Renewables
Table 7. Representative Cost and Performance of Power Generation
Technologies (2025)
Table 8. Regional Variation of Levelized Costs of New Generation Resources, 2016
Renewable Energy’s Additional Costs
Other Factors Pushing Electric Costs Up
Rising Electricity Prices and Their Impact on the Economy
Conclusion
Endnotes
CONTeNTS1
3
4
5
6
10
12
13
14
15
16

Ener
gy P
olic
y an
d th
e En
viro
nmen
t Re
port
10
February 2012

The High Cost of Renewable-Electricity Mandates
1
INTrOduCTION
Over the past few years, 29 states, as well as the District of Columbia and Puerto Rico, have adopted mandates requiring the use of renewable electricity.1 These mandates, known as renewable portfolio standards
(RPS), require electricity providers to supply a specified minimum amount of power to their customers from sources that qualify as “renewable,” a category that includes wind, solar, biomass, and geothermal.
Acting in the absence of a national renewable-energy plan, state policymakers have cited a desire to reduce carbon dioxide emissions and the need to create jobs as prime justifications for the RPS rules.2
In April 2011, in signing into law a bill that raised California’s RPS minimum to 33 percent by 2020, from 20 percent, Governor Edmund G. Brown said that the measure would stimulate investment in green technologies, create tens of thousands of jobs, improve air quality, promote energy independence, and reduce greenhouse gas emissions.3
The federal Environmental Protection Agency (EPA) is similarly bullish on the state programs. The RPS rules are designed “to stimulate market and technology development,” the agency says, “so that, ultimately,
thE high coSt of rEnwEablE-
ElEctricity mandatESrobert Bryce
Ener
gy P
olic
y an
d th
e En
viro
nmen
t Re
port
10
February 2012
2
affairs consultant, wrote in a 2009 report for the Oak Ridge National Laboratory.7
Several federal estimates of rate increases on a national level have painted a very rosy picture. A 2009 report issued by the Energy Information Administration (EIA), for example, concluded that if a national RPS were adopted, it would not “affect average electricity prices until after 2020” and that the “peak effect” on prices would be less than 3 percent.8
But just a year later, a report by the Center for Data Analysis at the Heritage Foundation came to a far different conclusion. The Heritage study estimated that by 2035, a national RPS mandate would raise residential electricity rates by 36 percent above the baseline price and industrial rates by 60 percent above the baseline price.9
Our analysis of the various RPS mandates at the state level shows that predictions of much higher prices are proving to be the reality. We have found a pattern of starkly higher rates in most states with RPS mandates compared with those without mandates. The gap is particularly striking in coal-dependent states—a group of seven such states with RPS mandates saw their rates soar by an average of 54.2 percent between 2001 and 2010, more than twice the average increase experienced by seven other coal-dependent states without mandates.
The timing of widespread implementation of RPS mandates couldn’t be worse. The higher costs of renewable energy can’t help but have a dampening effect on the revival of the U.S. economy. Because utility rate increases have a disproportionate impact on the pocketbooks of residential users, with the heaviest burden falling on the least well-off, the higher costs imposed by the mandates are being felt the most in the ranks of the unemployed and among the record number of some 46 million Americans receiving food stamps.
The implementation of the mandates is proceeding so rapidly under the pressure of looming deadlines that some homeowners and businesses are being locked into exorbitant rates for years—even decades—to come, our analysis shows.
renewable energy will be economically competitive with conventional forms of electric power. States create RPS programs because of the energy, environmental, and economic benefits of renewable energy.”4
Although supporters of renewable energy claim that the RPS mandates will bring benefits, their contribution to the economy is problematic because they also impose costs that must be incorporated into the utility bills paid by homeowners, commercial businesses, and industrial users. And those costs are or will be substantial. Electricity generated from renewable sources generally costs more—often much more—than that produced by conventional fuels such as coal and natural gas. In addition, large-scale renewable-energy projects often require the construction of many miles of high-voltage transmission lines. The cost of those lines must also be incorporated into the bills paid by consumers.
These extra costs amount to a “back-end way to put a price on carbon,” says Suedeen Kelly, a former member of the Federal Energy Regulatory Commission.5 Indeed, with Congress unwilling to approve national carbon dioxide restrictions or renewable-energy quotas, the RPS mandates have become a sprawling state system of de facto carbon-reduction taxes.
Despite the increasing stringency of the RPS rules and their growing geographic reach—the mandates now affect about two-thirds of the U.S. population—the sheer magnitude of those “taxes” is not known, and the ability of the economy to bear them is not certain because few, if any, states have fully calculated the costs that the mandates will impose.
California, for example, did not analyze the potential cost of increasing its mandate to 33 percent. When asked why, the lieutenant governor, Gavin Newsom, said that the state was not overly concerned with the cost, calling the 33 percent requirement “a stretch goal.”6
California is far from alone. “Most of these mandates are adopted without any analysis of the impact of increasing electricity bills, at least in the short run, on various types of residential customers, particularly low income customers,” Barbara R. Alexander, a consumer
The High Cost of Renewable-Electricity Mandates
3
Beyond the costs to the economy, the effort to protect the environment is ironically also at risk.
Some renewable-energy projects being built in California are so expensive that “people are going to get rate shock,” Joe Como, acting director of the Division of Ratepayer Advocates, an independent consumer advocacy arm of the California Public Utility Commission, told the San Jose Mercury-News in November 2011. “In the long run,” he said, the approval of overpriced renewable energy will harm “the states’ efforts to achieve greenhouse gas reductions.”10
Given that the cost of RPS mandates has not received enough study and that the available evidence to date suggests that the mandates are posing large risks to a fragile economy, we propose that the RPS programs be put on hold. We recommend these three steps:
• No new mandates should be adopted without a thorough cost-benefit analysis to determine prudent levels of renewable electricity.
• Natural gas, which emits about half as much carbon dioxide during combustion as coal, should be used where practicable to fill the gaps in energy supply.
• Where necessary, suspend or eliminate renewable-energy mandates to ensure that electricity is affordable.
Key FINdINgS: COmparINg eleCTrICITy prICeS IN rpS aNd NON-rpS STaTeS
Although the push for more renewable energy is contributing to the rising cost of electricity, it’s certainly not the only
factor—new environmental regulations and overall expansion of the electricity transmission system are also to blame. Without rigorous cost-benefit analysis by the states, it’s difficult to isolate the cost of the renewable mandates from these other factors. Indeed, other variables—including the relatively low price of natural gas, which is undercutting the cost of coal-fired generation as well as wind-generated
electricity in some regions—make “apples-to-apples” comparisons difficult.
That said, we have compared the costs of electricity in RPS and non-RPS states, using price information from the EIA. Our analysis has revealed a pattern of mostly higher costs in states with RPS mandates:
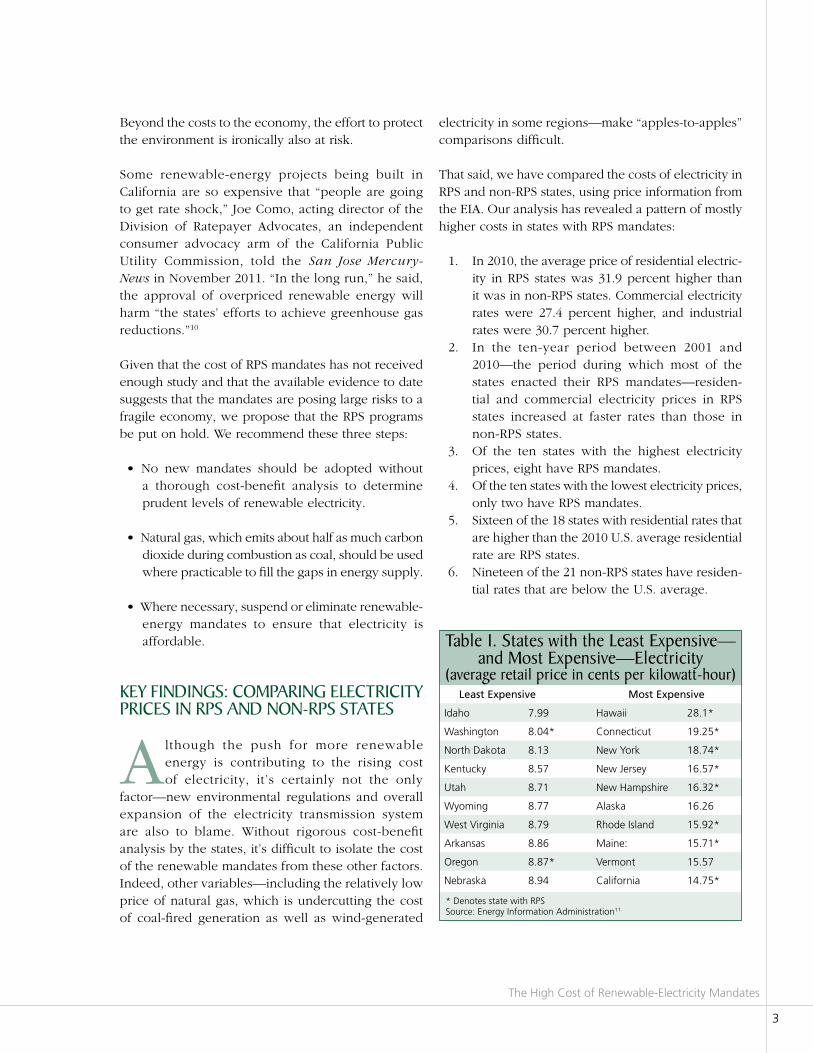
1. In 2010, the average price of residential electric-ity in RPS states was 31.9 percent higher than it was in non-RPS states. Commercial electricity rates were 27.4 percent higher, and industrial rates were 30.7 percent higher.
2. In the ten-year period between 2001 and 2010—the period during which most of the states enacted their RPS mandates—residen-tial and commercial electricity prices in RPS states increased at faster rates than those in non-RPS states.
3. Of the ten states with the highest electricity prices, eight have RPS mandates.
4. Of the ten states with the lowest electricity prices, only two have RPS mandates.
5. Sixteen of the 18 states with residential rates that are higher than the 2010 U.S. average residential rate are RPS states.
6. Nineteen of the 21 non-RPS states have residen-tial rates that are below the U.S. average.
Least Expensive Most Expensive
Idaho 7.99 Hawaii 28.1*
Washington 8.04* Connecticut 19.25*
North Dakota 8.13 New York 18.74*
Kentucky 8.57 New Jersey 16.57*
Utah 8.71 New Hampshire 16.32*
Wyoming 8.77 Alaska 16.26
West Virginia 8.79 Rhode Island 15.92*
Arkansas 8.86 Maine: 15.71*
Oregon 8.87* Vermont 15.57
Nebraska 8.94 California 14.75*
Table 1. States with the least expensive—and most expensive—electricity
(average retail price in cents per kilowatt-hour)
* Denotes state with RPSSource: Energy Information Administration11
Ener
gy P
olic
y an
d th
e En
viro
nmen
t Re
port
10
February 2012
4
Source: Manhattan Institute analysis of data from the Energy Information Administration
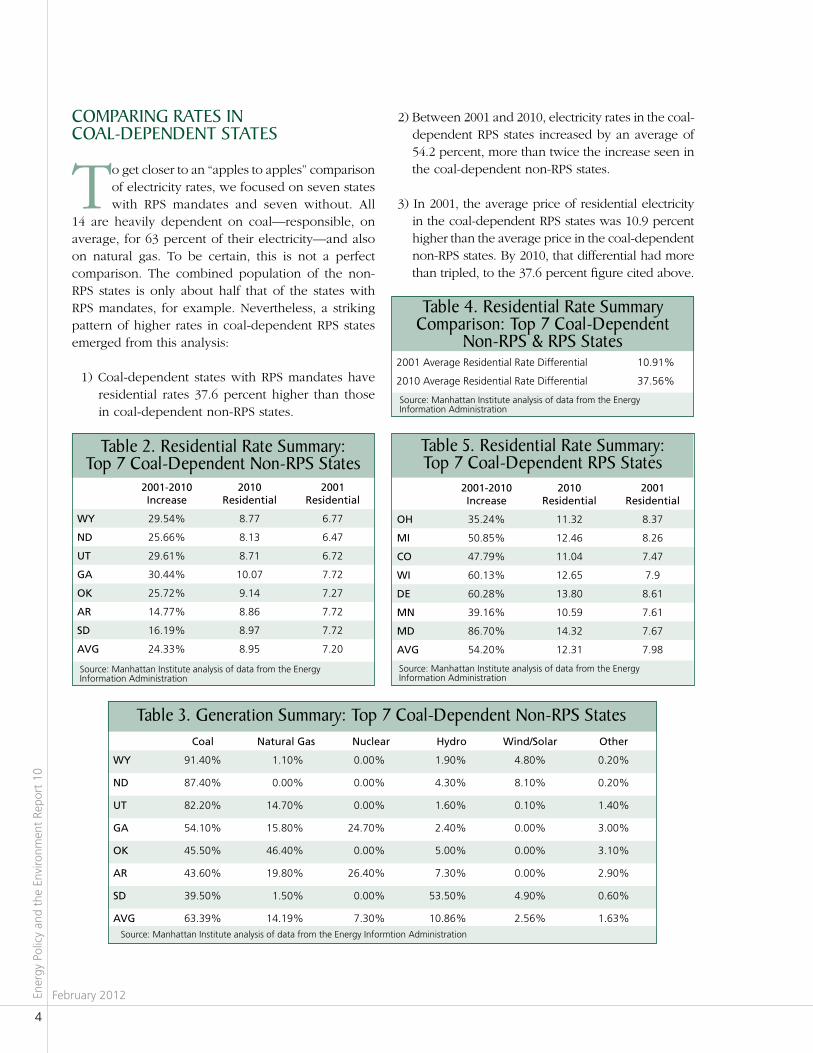
COmparINg raTeS IN COal-depeNdeNT STaTeS
To get closer to an “apples to apples” comparison of electricity rates, we focused on seven states with RPS mandates and seven without. All
14 are heavily dependent on coal—responsible, on average, for 63 percent of their electricity—and also on natural gas. To be certain, this is not a perfect comparison. The combined population of the non-RPS states is only about half that of the states with RPS mandates, for example. Nevertheless, a striking pattern of higher rates in coal-dependent RPS states emerged from this analysis:
1) Coal-dependent states with RPS mandates have residential rates 37.6 percent higher than those in coal-dependent non-RPS states.
2) Between 2001 and 2010, electricity rates in the coal-dependent RPS states increased by an average of 54.2 percent, more than twice the increase seen in the coal-dependent non-RPS states.
3) In 2001, the average price of residential electricity in the coal-dependent RPS states was 10.9 percent higher than the average price in the coal-dependent non-RPS states. By 2010, that differential had more than tripled, to the 37.6 percent figure cited above.
2001-2010 Increase
2010 Residential
2001 Residential
WY 29.54% 8.77 6.77
ND 25.66% 8.13 6.47
UT 29.61% 8.71 6.72
GA 30.44% 10.07 7.72
OK 25.72% 9.14 7.27
AR 14.77% 8.86 7.72
SD 16.19% 8.97 7.72
AVG 24.33% 8.95 7.20
Table 2. residential rate Summary: Top 7 Coal-dependent Non-rpS States
Source: Manhattan Institute analysis of data from the Energy Information Administration
2001-2010 Increase
2010 Residential
2001 Residential
OH 35.24% 11.32 8.37
MI 50.85% 12.46 8.26
CO 47.79% 11.04 7.47
WI 60.13% 12.65 7.9
DE 60.28% 13.80 8.61
MN 39.16% 10.59 7.61
MD 86.70% 14.32 7.67
AVG 54.20% 12.31 7.98
Table 5. residential rate Summary: Top 7 Coal-dependent rpS States
Source: Manhattan Institute analysis of data from the Energy Informtion Administration
Coal Natural Gas Nuclear Hydro Wind/Solar Other
WY 91.40% 1.10% 0.00% 1.90% 4.80% 0.20%
ND 87.40% 0.00% 0.00% 4.30% 8.10% 0.20%
UT 82.20% 14.70% 0.00% 1.60% 0.10% 1.40%
GA 54.10% 15.80% 24.70% 2.40% 0.00% 3.00%
OK 45.50% 46.40% 0.00% 5.00% 0.00% 3.10%
AR 43.60% 19.80% 26.40% 7.30% 0.00% 2.90%
SD 39.50% 1.50% 0.00% 53.50% 4.90% 0.60%
AVG 63.39% 14.19% 7.30% 10.86% 2.56% 1.63%
Table 3. generation Summary: Top 7 Coal-dependent Non-rpS States
Source: Manhattan Institute analysis of data from the Energy Information Administration
2001 Average Residential Rate Differential 10.91%
2010 Average Residential Rate Differential 37.56%
Table 4. residential rate Summary Comparison: Top 7 Coal-dependent
Non-rpS & rpS States

The High Cost of Renewable-Electricity Mandates
5
Coal Natural Gas Nuclear Hydro Wind/Solar Other
OH 83.70% 3.40% 11.00% 0.00% 0.01% 1.89%
MI 66.70% 7.90% 21.50% 1.30% 0.30% 2.30%
CO 62.70% 27.40% 0.00% 4.10% 5.80% 0.00%
WI 62.50% 9.10% 20.70% 2.60% 1.70% 3.40%
DE 58.10% 28.90% 0.00% 0.00% 0.00% 13.00%
MN 57.20% 4.80% 23.50% 1.30% 9.40% 3.80%
MD 55.30% 4.10% 33.00% 4.40% 0.00% 2.60%
AVG 63.74% 12.23% 15.67% 1.96% 2.46% 3.86%
Put another way, in 2001, the average price of residential electricity in the coal-dependent non-RPS states was 7.20 cents per kilowatt-hour. That same year, that amount of electricity in an RPS state cost 7.98 cents. By 2010, the cost of a kilowatt-hour of electricity in the non-RPS states had increased to 8.95 cents but in the RPS states had soared to 12.31 cents.
IN WaShINgTON, a BaTTle OF The eSTImaTeS
On the national level, the debate about the cost of renewable-energy mandates has been marked by optimistic predictions of minor
increases from the government and estimates of much higher costs from a number of outside analysts.
For instance, a 2008 report by the federal government’s National Renewable Energy Laboratory said that if the U.S. were to achieve the goal of having 20 percent of its electricity produced by wind in 2030, the total cost would be “less than 0.06 cents (6 one-hundredths of 1 cent) per kilowatt-hour of total generation by 2030, or roughly 50 cents per month per household.” While the report says that the 20 percent wind scenario could “increase total capital costs by nearly $197 billion,” those expenses would largely be offset by some $155 billion in decreased fuel costs.12
In 2009, the EIA examined the likely effect of a national RPS and predicted that the “peak effect” on average electricity process would be less than 3 percent.13
That conclusion was challenged by the Center for Data Analysis at the Heritage Foundation. In its 2010 report, Heritage not only predicted soaring increases from a national RPS—residential rates up by 36 percent and industrial rates up by 60 percent—but it also said that the mandate would cost the country more than 1 million jobs and the average family of four about $2,400 per year. In addition, it said that annual GDP would be cut by an average of $218 billion through 2035.14
“After all, if electricity created by wind and other renewables were cost competitive, consumers would use more of it without a federal law to force consumption,” Heritage said in the report, by way of explaining its assessment of much higher costs. “Recent experience with the mandate for renewable fuels like corn ethanol also suggests significant cost increases as well as technical shortcomings. While proponents argue that wind is free, harnessing it into useful electricity certainly is not.”
In July 2011, Bentek Energy, a Colorado-based energy analytics firm, released a study of wind energy that utilized actual emissions data from electric-generation plants located in four regions: the Electric Reliability Council of Texas, Bonneville Power Administration, California Independent System Operator, and the Midwest Independent System Operator. Those four system operators serve about 110 million customers, or about one-third of the U.S. population. The study looked at the effect that wind energy was having on carbon dioxide emissions and concluded that wind energy is
Source: Manhattan Institute analysis of data from the Energy Information Administration
Table 6. generation Summary: Top 7 Coal-dependent rpS States
Ener
gy P
olic
y an
d th
e En
viro
nmen
t Re
port
10
February 2012
6
not “a cost-effective solution for reducing carbon dioxide if carbon is valued at less than $33 per ton.”15
In October 2011, the EIA revisited the question of renewable energy with a report that looked at the impact of a national “clean energy standard.” During his State of the Union speech in 2011, President Barack Obama set a goal that would have 80 percent of U.S. electricity coming from clean energy sources by 2035.16 (The president reiterated his support for a clean energy standard during his 2012 State of the Union speech.)17
The EIA projected that through 2015, increases in electricity prices under a national clean energy standard would be “negligible” because of existing generation capacity.18 It also found that the likely effect on growth was, at worst, a decrease of less than 1 percent. By 2025, electricity prices would increase by 16 percent because of the clean energy policy. And by 2035, the EIA projects, the average price would exceed what it calls the “reference case average” by 29 percent.19
But the average numbers do not tell the entire story. The EIA analysis found that by 2035, the clean energy standard would result in hikes of at least 40 percent in seven regions, with the impact likely to be biggest on the areas that are dependent on coal. By 2035, when compared with the reference case, electricity prices would rise by 42 percent in Texas, 46 percent in Oklahoma, 47 percent in Tennessee and Kentucky, 48 percent in Colorado, 50 percent in eastern Pennsylvania and New Jersey, 51 percent on Long Island, and by 61 percent in southern Illinois and eastern Missouri.20
The EIA tested the impact of a clean energy standard against a range of scenarios, including a low- and high-cost coal case, a low- and high-cost renewable-energy case, a low- and high-cost natural gas case, and a low- and high-cost nuclear case. That methodology yielded a telling conclusion in the EIA’s report: a clean energy standard “leads to higher electricity prices in all of the sensitivity cases.”21
In October 2011, the Manhattan Institute published a paper that concluded that the proposed effort to obtain
20 percent of domestic electricity from wind energy would “impose a tax on U.S. electricity consumers of $45 to $54 for each ton of carbon dioxide that was removed.” It also predicted “an increase of as much as 48 percent over the current price of residential electricity in coal-dependent regions of the country.”22
Estimates of high costs are not unique to the United States. Several European studies have also found high costs in the push toward renewables. In June 2011, the Renewable Energy Foundation, a British nonprofit group, estimated that the subsidies needed to meet Britain’s renewable-energy goals would total about $155 billion by 2030.23 Similarly, the Committee on Climate Change, which advises the British government on cli-mate matters, issued a report in May 2011, which esti-mated that meeting the country’s renewable goals would require an expenditure of some $10 billion per year.24 At that rate, the cost of meeting Britain’s renewable mandates would be about $160 per Briton, per year.25
Late last year, the consulting firm KPMG estimated that meeting Britain’s carbon dioxide reduction goals would require spending over $300 billion, with at least $170 billion of that sum going to wind projects. All that money would have to be spent by 2020.26 Put another way, for each of the next nine years, the U.K. would have to spend about $19 billion on new wind projects, or about $300 per year, per British citizen. KPMG also found that using natural gas–fired generation along with new nuclear plants would save the U.K. about $53 billion when compared with a plan that relied more heavily on renewables.27
IN The STaTeS, rISINg raTeS aNd raISed alarmS
Although President Obama and a number of members of Congress still favor a national renewable-energy mandate, the states remain
in the forefront of renewable policymaking and have become the battleground over rising rates.
In 1983, Iowa became the first state to mandate the use of renewable energy, by requiring its investor-owned utilities to contract for a combined total of 105
The High Cost of Renewable-Electricity Mandates
7
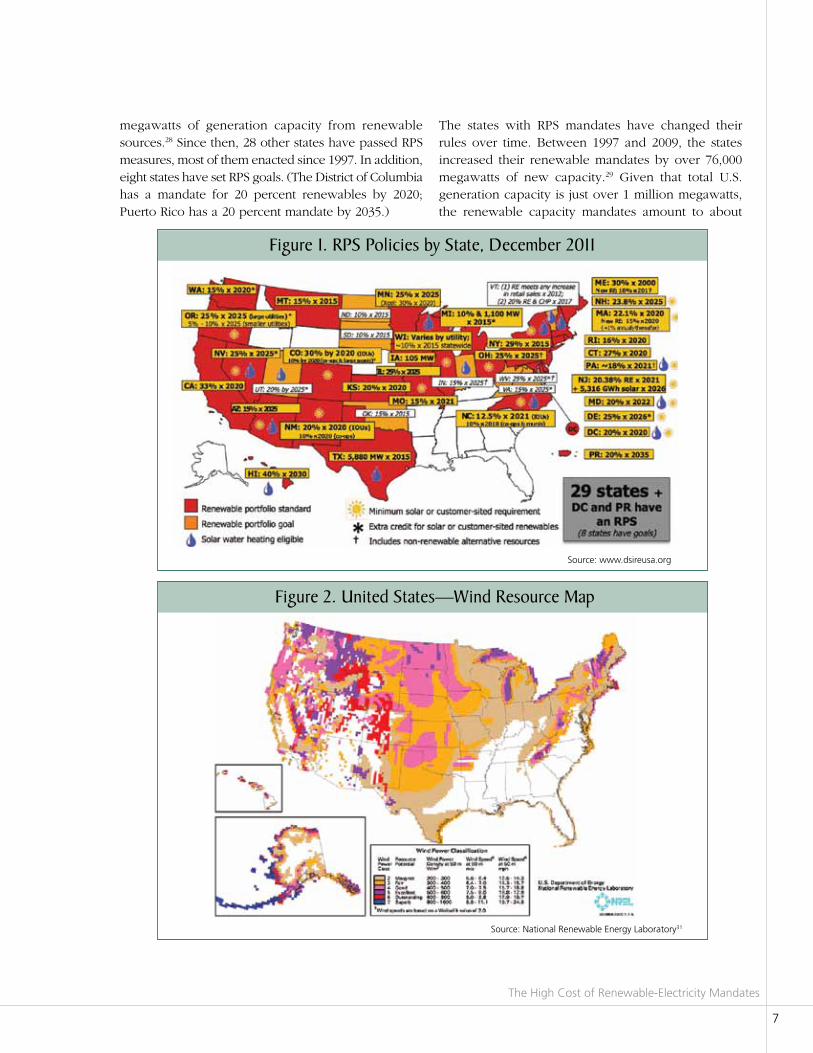
Figure 2. united States—Wind resource map
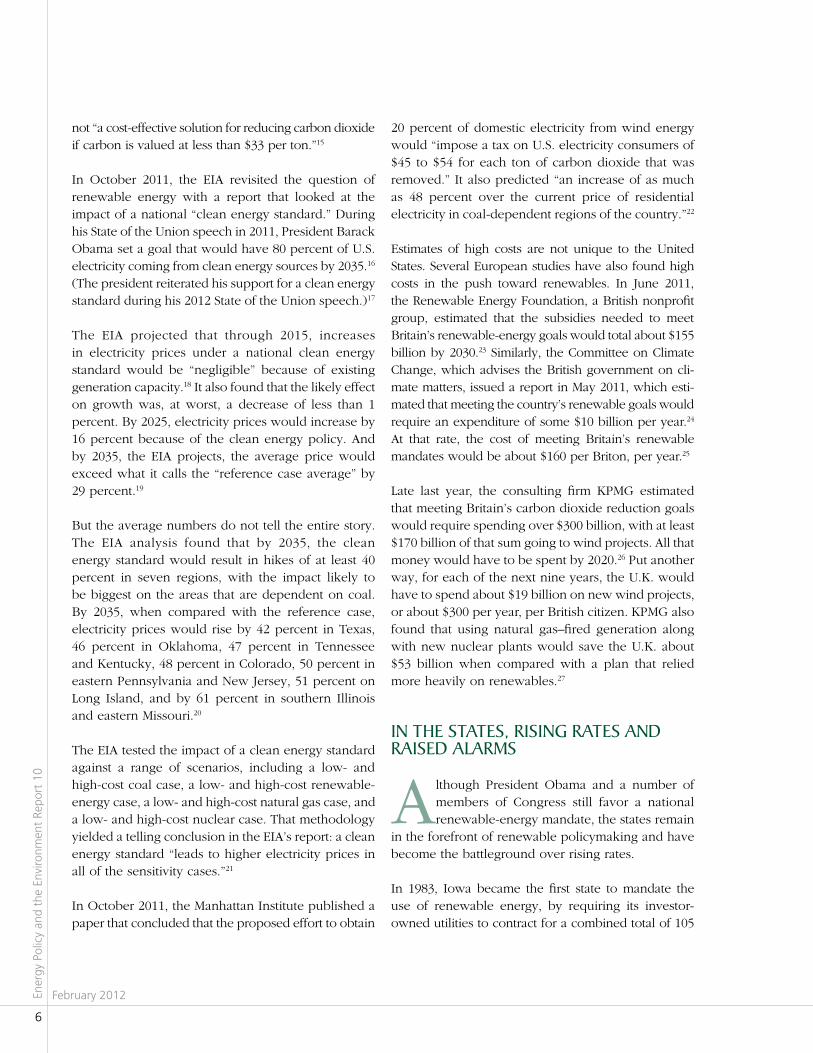
Figure 1. rpS policies by State, december 2011
megawatts of generation capacity from renewable sources.28 Since then, 28 other states have passed RPS measures, most of them enacted since 1997. In addition, eight states have set RPS goals. (The District of Columbia has a mandate for 20 percent renewables by 2020; Puerto Rico has a 20 percent mandate by 2035.)
The states with RPS mandates have changed their rules over time. Between 1997 and 2009, the states increased their renewable mandates by over 76,000 megawatts of new capacity.29 Given that total U.S. generation capacity is just over 1 million megawatts, the renewable capacity mandates amount to about
Source: National Renewable Energy Laboratory31
Source: www.dsireusa.org

Ener
gy P
olic
y an
d th
e En
viro
nmen
t Re
port
10
February 2012
8
7.6 percent of all capacity.30 States in the southeastern U.S. are notable for their continued refusal to adopt renewable-energy mandates or goals, a reflection, perhaps, of the lack of good wind-energy resources in the region.
In 2009, the U.S. House of Representatives passed the American Clean Energy and Security Act, a measure also known as the Waxman-Markey cap-and-trade bill, which was aimed at limiting carbon dioxide emissions and spurring the development of renewable energy. The measure failed to pass in the Senate. And Congress is unlikely to pass any legislation in the foreseeable future that imposes federal carbon dioxide restrictions or renewable-energy quotas.
As a result, the states, as well as a few cities, are the key drivers for renewable-energy policy in the United States. In November 2011, governors from 23 states sent a letter to leaders of Congress imploring them to pass a multiyear extension of the wind-energy production tax credit of $0.022 per kilowatt-hour produced. Not doing so, said the governors, would “result in a significant loss of high-paying jobs in a growing sector of the economy.”32 At the time this report was published, Congress had not extended the production tax credit.
The states have provided their own subsidies and favorable tax policies to encourage renewable-energy projects. For instance, Texas has extended over $700 million in property-tax breaks to wind projects, and Oregon has provided several hundred million dollars in tax credits to businesses that invest in renewable-energy projects. Meanwhile, New Jersey has become a haven for solar energy. The state now has nearly a quarter of all the solar installations in the U.S., thanks to an aggressive mandate. By 2026, the state plans to have 5,000 megawatts of solar capacity.33 For comparison, in 2010, total U.S. solar capacity was 941 megawatts.34
How have the states fared with the mandates? We have examined the real-world experiences of Oregon and California as well as Canada’s Ontario province, which has been following a similar mandate plan. In all three cases, rising costs are raising alarms.
ONTarIO
Ontario, Canada’s most populous province, is phasing out over 7,500 megawatts of coal-fired capacity over the next three years while dramatically increasing the use of renewable energy.35 The shift is mandated by the province’s Green Energy Act, which requires the installation of 25,000 megawatts of renewable-energy capacity by 2025.36
By all accounts, the program is resulting in significant price increases despite a prediction by the provincial government as recently as 2009 that the renewable mandate “would lead to modest hikes in household electricity bills of about 1% annually.”37
Just a year later, in November 2010, the government sharply revised that view, saying that “over the next five years, residential electricity prices are expected to rise by 46 percent, after which price increases are expected to moderate as Ontario will have largely completed the transition to a cleaner, more reliable system.”38 Under the province’s renewable program, some producers of solar-generated electricity are being paid as much as 80 cents (Canadian) for every kilowatt-hour of energy, an astonishing 700 to 1,500 percent more than the average price in Ontario for residential and commercial electricity.39
In October 2011, Glenn Fox, a professor of natural-resource economics at the University of Guelph, and Parker Gallant, a retired banker, put forward an estimate that was even starker. Their report, which was published in the peer-reviewed Bulletin of Science & Society, estimated additional costs by 2018 of over $2,300 a year for the average ratepayer, “well over a doubling” in rates. “Put another way,” the study said, “Ontario’s ratepayers will be paying in excess of 40¢ per kWh, placing them on a par with Denmark, which suffers the highest cost of electricity in the developed world.”40
In December 2011, Ontario auditor General Jim McCarter issued a report critical of the province’s rush to deploy renewables. “There has been a lack of analysis that you’d normally find when you’re investing billions of dollars,” McCarter said.41 In a news release,

The High Cost of Renewable-Electricity Mandates
9
he called for “an objective cost-benefit assessment of the progress made to date to provide government decision-makers with the information they need to strike an appropriate balance between the promotion of green energy and the price of electricity.”42
OregON
In 2007, the Oregon legislature passed a bill that requires large utilities in the state to obtain 25 percent of their electricity from non-hydro renewable projects by 2025.43
Nearly two-thirds of the electricity generated in Oregon comes from hydroelectric facilities.44 The state’s vast hydropower capacity has kept costs low; with residential electric rates of about 8.9 cents per kilowatt-hour, Oregon has the ninth-lowest electricity prices in the U.S.
But the renewable mandate is forcing utilities to increase their prices. Last year, Pacific Power, which supplies electricity to 555,000 customers in Oregon, hiked its rates by 14.5 percent.45 The biggest reason for the cost increase: a new transmission line needed to connect the state’s customers with two wind projects in Wyoming. The result of the rate hike: the average residential customer who relies on electricity from Pacific Power is now paying about $9.38 more per month, or about $112.56 per year.46
The other big utility in Oregon, Portland General Electric, which has more than 800,000 customers in the Portland/Salem metropolitan area, hiked rates by 4.2 percent in 2011.47 It appears that the Biglow Canyon wind project, which cost $1 billion, was the driving force behind that increase.48
Portland General has a slate of renewable projects in the queue that are likely to lead to further increases. Among them: a 210-mile transmission line that will carry wind-generated electricity into the utility’s service area. That project, known as Cascade Crossing, is expected to cost between $800 million and $1 billion.49 In late 2010, The Oregonian reported that Portland General has “outlined a slate of capital projects for Oregon regulators that includes new wind resources,
transmission and gas plants that could cost $2.5 billion during the next four years—a sum that is almost double the utility’s rate base today.”50
In March 2011, the Beacon Hill Institute and Cascade Policy Institute issued a report analyzing the effect that Oregon’s RPS mandate would have on electricity prices. Their conclusion: rates are likely to increase by 23.9 percent by 2025. In addition, the report estimates that the overall cost to the Oregon economy from 2015 to 2025 will be $6.8 billion.51
CalIFOrNIa
With its new mandate to have 33 percent of its electricity from renewable sources by 2020, California has the most ambitious RPS program in the United States. In all likelihood, it is also the most expensive, with costs that even state regulators acknowledge will be enormous.
In a June 2009 report, the California Public Utilities Commission (CPUC) concluded that the 33 percent goal was “highly ambitious, given the magnitude of the infrastructure build-out required.”52 It estimated the cost of the build-out “at approximately $115 billion between now and 2020, in an uncertain financial environment.”53
That $115 billion amounts to some $3,100 for every Californian.54 And those costs are coming at a time when California faces enormous budget pressures and persistently high unemployment. For fiscal year 2012, California has a projected budget shortfall of $23 billion, or about 27 percent of its general fund budget. And the state will likely face an additional shortfall of $10.3 billion in fiscal year 2013.55 In December 2011, California’s unemployment rate stood at 11.1 percent, the second-highest rate in the U.S., behind only Nevada.56
What’s more, California’s electricity rates are already high—the tenth-highest in the U.S., with an average retail price of $0.1475 per kilowatt-hour.57
In January 2011, three months before Governor Brown signed the new mandate into law, the Los Angeles

Ener
gy P
olic
y an
d th
e En
viro
nmen
t Re
port
10
February 2012
10
Times reported that the L.A. Department of Water and Power was warning city officials against pursuing a 33 percent mandate and to opt instead for a more modest goal. The department, America’s largest municipally owned utility, warned the city that the 33 percent mandate, “when combined with other long-term expenses at the DWP, could result in electricity rate hikes of 5 to 8 percent in each of the next five years.”58
The high cost of renewable-energy projects in California has led to a number of objections from the Division of Ratepayer Advocates, the CPUC’s independent consumer advocacy arm. In February 2011, the consumer advocate group issued a report called “Green Rush,” which found that 59 percent of the renewable-energy contracts that had been approved by the CPUC were allowing generators to sell their electricity at an average price of $104 per megawatt-hour, a level that is far higher than market value.59 (The EIA estimates the average cost of natural gas–fired electricity from a combined-cycle generation facility at about $66 per megawatt-hour.)60 Thus, policymakers are forcing state residents to buy renewable electricity that costs at least 50 percent more than if that same energy came from natural gas.
The Division of Ratepayer Advocates also found that “of the 184 renewable-energy contracts presented to the CPUC for approval since 2002, only two have been rejected.” One result: the state has been forced to pay over $6 billion to three utilities in order to cover the cost of renewable energy that exceeds the cost of comparable conventional generation. The
ratepayer agency says that the $6 billion is “over seven times CPUC-specified amounts. When these renewable contracts start delivering energy, costs will impact ratepayers.”
In November, the agency was again objecting to the high costs. It issued a press release that “expressed its disappointment” with the state’s approval of the Abengoa solar project in the Mojave Desert. Joe Como, the acting director, said that by approving the Abengoa project and another solar project known as North Star, the CPUC was “signaling to the market that California will accept overpriced renewable energy, and that it is willing to lock customers into higher rates for decades to come…. We should be getting twice the amount of renewable energy for the price of this contract.”61
COST COmparISON: CONveNTIONal SOurCeS verSuS reNeWaBleS
Although the cost of renewable energy may someday be competitive with conventional sources of power, that generally isn’t the case
today and likely won’t be for years to come.
In June 2011, the Electric Power Research Institute (EPRI), an independent science and research organization, released a report on technology innovation in electricity generation. The report examined fossil- and nuclear-based technologies, as well as four renewable technologies.62 EPRI found that burning natural gas was, by far, the cheapest way to generate electricity,
Source: Electric Power Research Institute
Table 7. representative Cost and performance of power generation Technologies (2025)
All Costs in Constant Dec. 2010 $ Nominal Plant Capacity, MW
Total Plant Cost, $/kW
LCOE, $/MWh
Coal: PC with Carbon Capture 600 3,200 - 4,100 87 - 105
Natural Gas: NGCC 550 1,060 - 1,150 47 - 74
Nuclear 1400 3,800 - 4,250 74 - 85
Wind: On-shore 100 1,960 - 2,600 73 - 134
Wind: Off-shore 200 2,850 - 3,650 122 - 147
Solar: Concentrating Solar Thermal (CST) 100-250 3,000 - 4,800 116 - 173
Solar: Photovoltaic (PV) 10 2,900 - 3,950 210 - 396
The High Cost of Renewable-Electricity Mandates
11
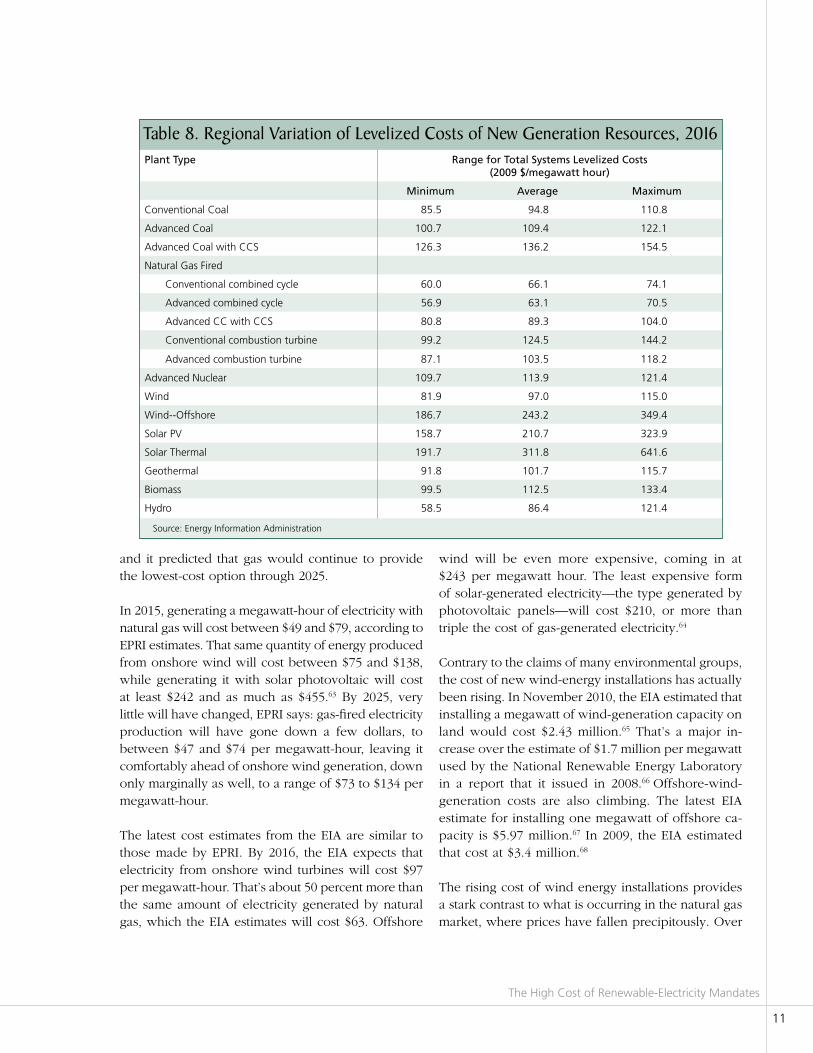
and it predicted that gas would continue to provide the lowest-cost option through 2025.
In 2015, generating a megawatt-hour of electricity with natural gas will cost between $49 and $79, according to EPRI estimates. That same quantity of energy produced from onshore wind will cost between $75 and $138, while generating it with solar photovoltaic will cost at least $242 and as much as $455.63 By 2025, very little will have changed, EPRI says: gas-fired electricity production will have gone down a few dollars, to between $47 and $74 per megawatt-hour, leaving it comfortably ahead of onshore wind generation, down only marginally as well, to a range of $73 to $134 per megawatt-hour.
The latest cost estimates from the EIA are similar to those made by EPRI. By 2016, the EIA expects that electricity from onshore wind turbines will cost $97 per megawatt-hour. That’s about 50 percent more than the same amount of electricity generated by natural gas, which the EIA estimates will cost $63. Offshore
wind will be even more expensive, coming in at $243 per megawatt hour. The least expensive form of solar-generated electricity—the type generated by photovoltaic panels—will cost $210, or more than triple the cost of gas-generated electricity.64
Contrary to the claims of many environmental groups, the cost of new wind-energy installations has actually been rising. In November 2010, the EIA estimated that installing a megawatt of wind-generation capacity on land would cost $2.43 million.65 That’s a major in-crease over the estimate of $1.7 million per megawatt used by the National Renewable Energy Laboratory in a report that it issued in 2008.66 Offshore-wind-generation costs are also climbing. The latest EIA estimate for installing one megawatt of offshore ca-pacity is $5.97 million.67 In 2009, the EIA estimated that cost at $3.4 million.68
The rising cost of wind energy installations provides a stark contrast to what is occurring in the natural gas market, where prices have fallen precipitously. Over
Source: Energy Information Administration
Table 8. regional variation of levelized Costs of New generation resources, 2016 Plant Type Range for Total Systems Levelized Costs
(2009 $/megawatt hour)
Minimum Average Maximum
Conventional Coal 85.5 94.8 110.8
Advanced Coal 100.7 109.4 122.1
Advanced Coal with CCS 126.3 136.2 154.5
Natural Gas Fired
Conventional combined cycle 60.0 66.1 74.1
Advanced combined cycle 56.9 63.1 70.5
Advanced CC with CCS 80.8 89.3 104.0
Conventional combustion turbine 99.2 124.5 144.2
Advanced combustion turbine 87.1 103.5 118.2
Advanced Nuclear 109.7 113.9 121.4
Wind 81.9 97.0 115.0
Wind--Offshore 186.7 243.2 349.4
Solar PV 158.7 210.7 323.9
Solar Thermal 191.7 311.8 641.6
Geothermal 91.8 101.7 115.7
Biomass 99.5 112.5 133.4
Hydro 58.5 86.4 121.4
Ener
gy P
olic
y an
d th
e En
viro
nmen
t Re
port
10
February 2012
12
the six-year period from 2003 to 2008, (the period just before the beginning of the shale revolution), domestic natural gas prices averaged about $7 per thousand cubic feet.69 In mid-February 2012, the spot price for natural gas was about $2.50.70 If we assume the price reduction is $4 per thousand cubic feet, the savings for consumers is at least $263 million per day.71
That low-cost gas is directly competing with renewable sources in general and wind energy in particular. In early 2011, Dallas-based energy investor T. Boone Pickens said that it was difficult to obtain financing for a wind project “unless you have $6 gas.”72 In February 2012, Pickens again cited the $6 price floor for natural gas as being essential to the economics of wind-energy projects.73
Cheap natural gas is also displacing coal, a fuel that has long been among the cheapest options for electricity production. In December 2011, Exxon Mobil Corp. predicted that natural gas will overtake coal as the primary fuel in the domestic electricity market by 2025.74 Furthermore, the surfeit of low-cost gas is helping reduce electricity costs. A January 2012 report by Standard & Poor’s Financial Services LLC found that in some regions of the country, wholesale electricity prices had declined by more than 50 percent since 2008 due to cheap supplies of gas.75
reNeWaBle eNergy’S addITIONal COSTS
While the costs related to renewable-energy mandates will ultimately be paid by consumers, there are other costs that will
not be found on electricity bills. Billions of dollars in federal grants, loan guarantees, and tax credits have been disproportionately lavished on renewable-energy projects. Those subsidies are invisible to ratepayers but are nonetheless a cost that affects the broader economy.When measured on the amount of energy actually produced, it’s apparent that the renewable industry is getting subsidies that are far in excess of those given to the hydrocarbon sector. For instance, the federal production tax credit of $0.022 for each kilowatt-hour of electricity produced by wind amounts to a subsidy
of $6.44 per million BTUs of energy produced. For comparison, the current price of natural gas is less than $3 per million BTUs. Put another way, the subsidy provided to wind-energy producers is more than twice the market price of natural gas.
In 2010, the EIA estimated total “subsidies and support” for renewable-energy programs at $14.6 billion. Of that amount, the biofuels sector collected the largest sum, $6.6 billion. The wind industry collected $4.98 billion.76 Of that $4.98 billion, $4.8 billion was awarded under section 1603 of the American Recovery and Reinvestment Act (also known as the federal stimulus bill). In all, between 2009 and late 2011, $9.8 billion in cash grants was disbursed under the stimulus bill, and the vast majority of that money—$7.6 billion—was received by the wind-energy sector.77
Furthermore, an analysis of the 4,256 projects that won grants from the Treasury Department under section 1603 shows that $3.25 billion in grants went to just eight companies, all of which are board members of the American Wind Energy Association (AWEA).78 Two foreign companies, the Spanish utility Iberdrola and the German energy giant E.On, were among the biggest beneficiaries of the section 1603 grants: Iberdrola, which has a market capitalization of $39 billion, collected $1 billion in grants; E.On, with a market capitalization of $49 billion, collected $542.5 million.
The federal government has also provided loan guarantees for renewable projects. And while the failure of solar-panel-maker Solyndra—which had a $529 million loan guarantee from the federal government—is the most prominent example, numerous other companies have also garnered guarantees. One company, New Jersey–based NRG Energy, along with its partners, has secured some $5.2 billion in federal loan guarantees to build solar-energy projects.79 The production tax credit for renewable-energy generation has also imposed costs on taxpayers. In 2007, the EIA estimated that subsidy was costing $418 million per year.80
Perhaps the most controversial example of how renewable subsidies are being captured by big business is the $1.9 billion, 845-megawatt Shepherds Flat wind

The High Cost of Renewable-Electricity Mandates
13
project in Oregon, which is getting the bulk of its funding from federal taxpayers. And that largesse will provide a windfall for General Electric and its partners on the deal, including Google, Sumitomo, and Caithness Energy. Not only is the Department of Energy giving GE and its partners a $1.06 billion loan guarantee, but as soon as GE’s 338 turbines start turning at Shepherds Flat, the Department of the Treasury will send the project developers a cash grant of $490 million.81
The deal was so lucrative for the project developers that in 2010, some of President Obama’s top advisors, including energy policy czar Carol Browner and economic advisor Larry Summers, wrote a memo saying that the project’s backers had “little skin in the game” while the government would be providing “a significant subsidy (65+ percent).” The memo went on to say that the project backers would provide equity equal to only about 11 percent of the project’s cost, even though they would receive an “estimated return on equity of 30 percent.” That’s a huge return for the utility sector, which has an average return on equity of about 7 percent.82
The memo also pointed out that the carbon dioxide reductions associated with the project “would have to be valued at nearly $130 per ton CO
2 for the climate
benefits to equal the subsidies.” That per-ton cost, the memo said, is “more than six times the primary estimate used by the government in evaluating rules.”83
Apart from the federal subsidies, renewable projects have received tax breaks from numerous states. Advocates of renewable energy often cite Texas as a model for state policies toward renewables in general and wind energy in particular. But a 2010 report by the Texas comptroller found that local jurisdictions in the state are forgoing $712.3 million in property-tax revenue because of exemptions given to wind-energy developers.84 In one case, a company operating a large wind facility near Roscoe, Texas, was given exemptions worth $37.2 million over a 13-year period.85 The tax revenue forgone by the local jurisdictions must be made up by other taxpayers. The property-tax-exemption program was so good for the wind developers and local jurisdictions that the Texas legislature effectively ended the program in 2009.86
Oregon residents are also paying for the renewable mandates in lost tax revenue. Using Oregon’s Business Energy Tax Credit, some of America’s biggest companies have avoided paying tens of millions of dollars in state income taxes. In 2009, The Oregonian reported that three companies—Walmart, Costco, and U.S. Bank—“shelled out a combined $67 million to avoid paying $97 million in Oregon income taxes.” In 2008, Walmart paid $22.6 million for the right to claim some $33.6 million in energy tax credits. The cash was forwarded to several renewable projects, including a pair of wind farms. In return, Walmart pocketed the $11 million in tax savings. But as Oregonian reporter Harry Esteve pointed out: “The loser in the transaction is Oregon’s general fund—which pays for public schools, prisons and health care programs—because the state is out the full $33.6 million in tax revenues.”
In 2007, the tax credit was costing Oregon taxpayers about $10 million.87 But with numerous corporations tapping the program, the costs quickly soared, which forced Oregon legislators to place a cap of $300 million on the credit for the 2009–11 period. In 2011, with the state’s budget in tatters, the legislature effectively ended the program by capping it at $3 million.88
OTher FaCTOrS puShINg eleCTrIC COSTS up
Electric rates are driven by numerous factors. Among the most important factors currently at play: increasingly stringent federal environmental
rules that are forcing numerous coal-fired power plants to be retired. For decades, coal-fired generation has been the cheapest form of electricity production. But coal’s share of the market is shrinking. In July 2011, the EIA reported that coal’s share of the domestic electricity market had declined to 46 percent, its lowest level in over 30 years.89
Electricity providers are replacing much of their coal-fired generation with natural gas units because the EPA is pushing regulations like the Cross-State Air Pollution Rule and the Maximum Achievable Control Technology requirement. In addition, federal authorities are
Ener
gy P
olic
y an
d th
e En
viro
nmen
t Re
port
10
February 2012
14
promulgating new rules on mercury emissions, coal ash, urban air quality, and cooling water.90 The EPA has estimated that the new pollution-control equipment will cost utilities $10.6 billion by 2016.91
Taken together, all the regulations could result in 80,000 megawatts of coal-fired capacity, or about 7 percent of all generating capacity in the U.S., to be shuttered.92 In May 2011, a study by NERA Economic Consulting, which was commissioned by several coal-dependent utilities, estimated that if the federal rules are implemented as scheduled, “average U.S. retail electricity prices in 2016 would increase by about 12 percent.”93
While the rules would barely affect ratepayers in California, where coal provides just 1 percent of the state’s electricity, NERA predicts that consumers in coal-dependent states like Kentucky and Tennessee could see their electricity bills increase by over 23 percent within five years.94 And consumers in southern Michigan, where unemployment rates are among the highest in the nation, could see their electricity costs increase by 20 percent.
In addition to the new regulations, many utilities are installing “smart” meters to their distribution networks, and those new meters are also contributing to higher bills. For instance, residential consumers in the Houston area are getting smart meters for which they will be paying an additional $3 per month for the next 12 years.95
Expansion of the electricity transmission system is also contributing to higher costs. According to the Edison Electric Institute (EEI), a trade group that represents shareholder-owned electric companies, member companies spent over $55 billion on transmission projects between 2001 and 2009. Another $61 billion will likely be spent on transmission projects from 2010 through 2021.96 A majority of that money is being spent to accommodate renewables. EEI says that about $39.5 billion in new transmission investment is being made on “projects addressing the integration of renewable resources, and where needed, to accommodate the expected off-peak production.” The cost of the new transmission lines for renewable-energy projects will be about $126 for each American.97
The cost of lines needed to accommodate renewables will be borne by consumers. The cost in Texas, which has more wind-generation capacity (10,135 megawatts) than any other state,98 will be $6.79 billion for wind-energy projects, or about $270 for each Texan. The new transmission capacity will result in charges of $4 to $5 per month per electric customer.99
rISINg eleCTrICITy prICeS aNd TheIr ImpaCT ON The eCONOmy
Residential electricity rates are soaring, and they are doing so at the worst possible time. Between 2006 and 2010, the rates increased at a pace
faster than inflation. The result: annual electricity costs for the average homeowner are up by about $300 over that time period.100
The recent surge in rates reverses a decades-long trend. In 1960, the inflation-adjusted cost of residential electricity was $0.14 per kilowatt-hour. By 2005, the average cost of a kilowatt-hour delivered to residential customers had fallen to $0.09.101 But by October 2011, the average cost had surged, to just over $0.12.102 The U.S. electricity sector, one of the biggest industries in the world, posted sales of $369 billion in 2010.103
These rising costs are adding a strain to the U.S. economy at the same time that the country is struggling with persistently high unemployment and record levels of food-stamp usage, up 71 percent since 2007. While there are many reasons for the persistence of unemployment and the soaring food-stamp rolls, it’s clear that higher-cost electricity hurts the overall economy as it slows growth and acts as a regressive tax on the poor and the working class. Between the beginning of the recession and June 2011, real median incomes in the U.S. declined by 9.8 percent.104 That decline means that higher electricity costs are taking a larger percentage of disposable income from low- and middle-income workers.105
Although some regulations governing the electricity-generation sector can be justified on health-related grounds—with the quest for cleaner air as a frequently
The High Cost of Renewable-Electricity Mandates
15
cited goal—the push for renewable energy is largely elective. And that should be a concern, given the regressive nature of higher electricity prices. In her 2009 report for the Oak Ridge National Laboratory about the impact of RPS mandates on low-income consumers, Barbara R. Alexander noted:
The impact of poverty on a household’s ability to afford essential utility services is significant. Low-income households have an energy burden (percentage of income that must be spent to keep the heat and lights on) that has increased from 10% to over 25% for those households in the lowest quintile by income over the past decade, reflecting increased prices and essentially flat income for this group. This contrasts with the energy burden of moderate-income households, which is 4% of income on average. Anywhere from 20 to 30% of households in many utility service territories are “low income.” The ability of current low income bill payment assistance programs—whether funded through taxes or utility rates—to meet these needs and assure access to affordable electricity service is well documented to be insufficient and likely to be even more so due to the recent economic recession and the downward trend in employment.106
The deleterious effect that higher energy prices are having on the poor is well documented. In early 2009, the Wall Street Journal reported “a record number of U.S. households are seeking state assistance to pay their heating bills even as fuel prices have eased recently.” The paper said that low-income energy-assistance programs in a dozen states had seen applications jump by at least 25 percent. In Texas alone, 150,000 households sought assistance, triple the number recorded a year earlier. Similar increases were seen in Florida. The paper reported that the number of applicants for energy-cost assistance in California more than doubled. “Other states with big jumps included Tennessee at 60%, Arkansas at 50%, Arizona at 35%, Alaska at 34%, New Mexico and Oregon at 26% and Alabama, Massachusetts and New Hampshire at 25%.”107
The upward surge in families needing assistance with their energy bills continues. In November 2011, the National Energy Assistance Directors’ Association (NEADA) reported that 8.9 million low-income families received assistance for energy bills in fiscal year 2011 and “approximately 10 million households are expected to apply for assistance in FY 2012.”108 The group reported that 52 percent of the people surveyed said that “energy bills were more difficult to pay than in the previous year.” In December, the group issued another report, which found that the number of military families receiving assistance for their energy bills had increased by 156 percent since 2008.109
The continuing need for energy-related financial assistance is occurring at the same time that the federal government is cutting funding for the Low Income Home Energy Assistance Program (LIHEAP). In fiscal year 2011, total funding for LIHEAP was about $4.5 billion. By late December 2011, the projected amount available for fiscal year 2012 was about $2.6 billion.110
CONCluSION
While many factors are contributing to rising electricity prices, the evidence shows that renewable-energy mandates are a key
contributor to the upward price pressure. Given the fragility of the U.S. economy as well as the large number of Americans who are living in poverty or are unemployed or underemployed, policymakers at the state and federal level should:
1. Do a thorough financial assessment of the impact that renewable-energy mandates have had and will have on electricity prices.
2. Perform cost-benefit analyses on renewable-energy mandates and, in doing so, provide an estimate of their per-ton cost of carbon-dioxide reduction.
3. Where necessary, suspend or eliminate renewable-energy mandates to ensure that electricity is affordable.

Ener
gy P
olic
y an
d th
e En
viro
nmen
t Re
port
10
February 2012
16
EndnotES
1. DSIRE database, http://www.dsireusa.org/summarymaps/index.cfm?ee=1&RE=1.
2. See, e.g., Bill Ritter, Jr., “Advancing Colorado’s New Energy Economy,” Denver Post, March 11, 2010, http://www.denverpost.com/opinion/ci_14650410.
3. Gov. Edmund G. Brown, Jr., “Governor Brown Signs Legislation to Boost Renewable Energy,” April 12, 2011, http://gov.ca.gov/news.php?id=16974.
4. EPA data, http://www.epa.gov/chp/state-policy/renewable_fs.html.
5. Speech by Suedeen Kelly at Tufts University energy conference, Boston, April 16, 2011. Quotation transcribed by the author.
6. Interview with Newsom by the author, Aspen, Colo., June 30, 2011.
7. Barbara R. Alexander and Energy Economics, Inc., “Renewable Energy Mandates: An Analysis of Promises Made and Implications for Low Income Customers,” Oak Ridge National Laboratory, June 2009,
liheap.ncat.org/dereg/renewables%20and%20low%20income.doc, 4.
8. EIA data, http://www.eia.gov/oiaf/servicerpt/acesa/execsummary.html.
9. David Kreutzer, Karen Campbell, William Beach, Ben Lieberman, and Nicolas Loris, “A Renewable Electricity Standard: What It Will Really Cost Americans,” Heritage Foundation, May 5, 2010,
http://www.heritage.org/research/reports/2010/05/a-renewable-electricity-standard-what-it-will-really-cost-americans.
10. Garance Burke and Jason Dearen, “Analyst: Bills Rising due to Overpriced Renewables,” Associated Press, November 12, 2011, http://www.mercurynews.com/breaking-news/ci_19323227.
11. EIA data, http://www.eia.gov/electricity/sales_revenue_price/pdf/table5_a.pdf.
12. Department of Energy, National Renewable Energy Laboratory, “20% Wind Energy by 2030: Increasing Wind Energy’s Contribution to U.S. Electricity Supply,” July 2008, http://www.nrel.gov/docs/fy08osti/41869.pdf, 19.
13. EIA data, http://www.eia.gov/oiaf/servicerpt/acesa/execsummary.html.
14. Kreutzer et al., “A Renewable Electricity Standard.”
15. Bentek Energy, “The Wind Power Paradox,” July 2011, http://www.bentekenergy.com/WindPowerParadox.aspx.
16. Timothy Gardner, “Obama Sets 2035 Clean Electricity Target,” Reuters, January 25, 2011, http://www.reuters.com/article/2011/01/26/us-obama-speech-energy-idUSTRE70O50V20110126.
17. President’s State of the Union Address, January 25, 2012, http://www.nytimes.com/interactive/2012/01/24/us/politics/state-of-the-union-2012-video-transcript.html.
18. EIA, “Analysis of Impacts of a Clean Energy Standard,” October 2011, 1, http://www.eia.gov/analysis/requests/ces_hall/pdf/ces_hall.pdf
19. Ibid., 6.
20. Ibid., 7.
The High Cost of Renewable-Electricity Mandates
17
21. Ibid., 12.
22. Robert Bryce, “The High Cost of Wind Energy as a Carbon-Dioxide Reduction Method,” October 2011, http://www.manhattan-institute.org/html/ib_11.htm.
23. Renewable Energy Foundation, “The Probable Cost of UK Renewable Electricity Subsidies, 2002–2030,” June 20, 2011, http://www.ref.org.uk/publications/238-the-probable-cost-of-uk-renewable-electricity-subsidies-2002-2030.
24. Ibid. Note that this estimate is derived from the Committee on Climate Change’s estimate that the needed renewable mandates would increase electricity costs by 1.1 to 2.2 pence per kilowatt-hour, a figure that the Renewable Energy Foundation uses to derive an estimate of “approximately £6.5 billion,” or just over $10 billion.
25. Britain’s population is 62 million.
26. KPMG, “UK Energy Policy ‘Must Be Affordable’ in Austere Times,” July 20, 2011, http://www.kpmg.com/UK/en/IssuesAndInsights/ArticlesPublications/NewsReleases/Pages/UK-energy-policy-must-be-affordable.aspx. Full KPMG report, “Rethinking the Unaffordable: Understanding the True Cost of Green Transition,” 2011, http://www.kpmg.com/UK/en/IssuesAndInsights/ArticlesPublications/Documents/PDF/Market%20Sector/Power_and_Utilities/rethinking-the-unaffordable.pdf.
27. Piers Grimley Evans, “UK Offshore Wind Not ‘Affordable’ Finds KPMG,” November 7, 2011, http://www.powerengineeringint.com/articles/2011/11/uk-offshore-wind-not-affordable-finds-kmpg.html.
28. Center for Climate and Energy Solutions, http://www.c2es.org/node/6324.
29. EPA data, http://www.epa.gov/chp/state-policy/renewable_fs.html.
30. EIA data, http://205.254.135.7/electricity/monthly/pdf/execsum.pdf.
31. Map from National Renewable Energy Laboratory, http://www.google.com/imgres?imgurl=http://windeis.anl.gov/guide/maps/images/wherewind800.gif&imgrefurl=http://windeis.anl.gov/guide/maps/map2.html&h=600&w=800&sz=88&tbnid=7EgacX_86p1iWM:&tbnh=90&tbnw=120&prev=/search%3Fq%3Dus%2Bwind%2Benergy%2Bmap%26tbm%3Disch%26tbo%3Du&zoom=1&q=us+wind+energy+map&docid=pCmzKULsemcuiM&hl=en&sa=X&ei=bzALT9HEE6PisQLTz_SRCg&sqi=2&ved=0CGIQ9QEwBQ&dur=426.
32. Governor’s Wind Energy Coalition letter, November 15, 2011, http://governorswindenergycoalition.org/wp-content/uploads/2011/03/GWC-PTC-Letter-Final2-11-15-11.pdf.
33. New Jersey Solar FAQs, http://www.renewablepowerinc.com/nj_faq.html.
34. EIA data, http://205.254.135.7/electricity/annual/pdf/tablees1.pdf.
35. Office of the Auditor General of Ontario, 2011 annual report, Section 3.03, “Electricity Sector—Renewable Energy Initiatives,” http://www.auditor.on.ca/en/reports_en/en11/303en11.pdf, 88.
36. “A Green Energy Act for Ontario,” 2009, http://www.greenenergyact.ca/Storage/23/1460_GEAA_ExecSum_2009_v2print.pdf.
37. Office of the Auditor General of Ontario, news release, December 5, 2011, http://www.auditor.on.ca/en/news_en/11_newsreleases/2011news_3.03.pdf.
38. Ontario.ca, “McGuinty Government Introduces New Measures to Help Ontario Families and Reduce Debt,” November 18, 2010, http://news.ontario.ca/mof/en/2010/11/ontario-introduces-electricity-cost-relief.html.

Ener
gy P
olic
y an
d th
e En
viro
nmen
t Re
port
10
February 2012
18
39. Keith Leslie, “Electricity Prices to Rise Again as OPG Seeks 6.2 Per Cent Hike,” The Canadian Press, February 22, 2011, http://www.thestar.com/news/ontario/article/943008--electricity-prices-to-rise-again-as-opg-seeks-6-2-per-cent-hike.
40. Glenn Fox and Parker Gallant, “Ontario’s Power Trip: The $4,000 Electricity Bill,” Financial Post, October 4, 2011, http://opinion.financialpost.com/2011/10/04/ontarios-power-trip-the-4000-electricity-bill.
41. Claire Sibonney, “Ontario Watchdog Warns on Green Energy Costs,” Reuters, December 5, 2011, http://news.yahoo.com/ontario-watchdog-warns-green-energy-costs-192959840.html.
42. Ibid.
43. Beacon Hill Institute and Cascade Policy Institute, “Economic Impact of Oregon’s Renewable Portfolio Standard, March 2011, http://cascadepolicy.org/pdf/2011-3-9-RPSreport.pdf, 2. Note that only “small hydroelectric” facilities are eligible to qualify under the state’s renewable mandates.
44. EIA data, http://www.eia.gov/state/state-energy-profiles-analysis.cfm?sid=OR.
45. Pacific Power data, http://www.pacificpower.net/about/cf/qf.html.
46. Ted Sickinger, “Rates Set to Jump for Pacific Power, PGE Customers in January,” The Oregonian, December 17, 2010, http://www.oregonlive.com/business/index.ssf/2010/12/rates_set_to_jump_for_pacific.html.
47. Portland General Electric data, http://investors.portlandgeneral.com/common/mobile/iphone/releasedetail.cfm?ReleaseID=620477&CompanyID=POR&mobileid=.
48. Portland General Electric investor presentation, December 8–9, 2011, 15, http://files.shareholder.com/downloads/POR/1603699276x0x524715/05e20cff-5c08-475d-acd1-97584c8c8899/Goldman%20Sachs%20Presentation%2012-8-2011.pdf.
49. Ibid., 10.
50. Sickinger, “Rates Set to Jump for Pacific Power.”
51. Beacon Hill Institute and Cascade Policy Institute, “Economic Impact of Oregon’s Renewable Portfolio Standard,” 3.
52. California Public Utilities Commission, “33% Renewables Portfolio Standards: Implementation Analysis Preliminary Results,” June 2009, 4.
53. Ibid.
54. California’s population is approximately 36.9 million.
55. Elizabeth McNicoll, Phil Oliff, and Nicholas Johnson, “States Continue to Feel Recessions’ Impact,” Center on Budget and Policy Priorities, http://www.cbpp.org/cms/?fa=view&id=711.
56. Bureau of Labor Statistics data, http://www.bls.gov/web/laus/laumstrk.htm.
57. EIA data, http://www.eia.gov/electricity/sales_revenue_price/pdf/table5_a.pdf.
58. Los Angeles Times, “Villaraigosa Celebrates Los Angeles DWP Milestone: 20% of Power from Renewable Sources,” January 13, 2011, http://latimesblogs.latimes.com/lanow/2011/01/los-angeles-dwp-marks-20-percent-of-power-from-renewable-sources.html.

The High Cost of Renewable-Electricity Mandates
19
59. Division of Ratepayer Advocates, “Green Rush: Investor-Owned Utilities’ Compliance with the Renewables Portfolio Standard,” February 2011, http://www.dra.ca.gov/NR/rdonlyres/0CB0B986-E93B-462A-BA62-804EDAE43B82/0/RPSReportPublic_FINAL_2011_Feb_14_v2.pdf, 8.
60. EIA data, http://205.254.135.24/oiaf/aeo/electricity_generation.html.
61. Division of Ratepayer Advocates, “DRA Troubled by Continued CPUC Approval of Overpriced Renewable Projects,” November 10, 2011, http://www.dra.ca.gov/DRA/News/News+Releases/111110_abengoa.htm.
62. Electric Power Research Institute, “Program on Technology Innovation: Integrated Generation Technology Options,” June 2011, http://my.epri.com/portal/server.pt?Abstract_id=000000000001022782, 1–11, 12.
63. Ibid., 1–12.
64. EIA data, http://205.254.135.24/oiaf/aeo/electricity_generation.html.
65. EIA data, http://www.eia.gov/oiaf/beck_plantcosts/pdf/updatedplantcosts.pdf, 7, 2–10.
66. Department of Energy, “20% Wind Energy by 2030,” 147.
67. EIA data, http://www.eia.gov/oiaf/beck_plantcosts/pdf/updatedplantcosts.pdf, 7.
68. NREL, “Cost and Performance Assumptions for Modeling Electricity Generation Technologies,” November 2010, http://www.nrel.gov/docs/fy11osti/48595.pdf, 96. See also the AEO 2011, with updated capital cost estimates:
http://www.eia.gov/oiaf/beck_plantcosts/index.html. It shows that in one year, overnight costs for onshore wind increased by 21 percent while offshore wind increased by 50 percent.
69. EIA data, http://www.eia.gov/dnav/ng/hist/rngwhhdA.htm
70. Bloomberg data, http://www.bloomberg.com/energy/
71. Domestic natural gas consumption is about 24 trillion cubic feet per year. See EIA data, http://www.eia.gov/dnav/ng/hist/n9140us2A.htm.
72. MSNBC, “Morning Joe,” January 26, 2011, http://www.msnbc.msn.com/id/3036789/vp/41271645#41271645
73. Rod Walton, “T. Boone Pickens tells Tulsa Rotary Club energy plan will succeed,” Tulsa World, February 1, 2012, http://www.tulsaworld.com/site/printerfriendlystory.aspx?articleid=20120201_49_
E1CUTLIN986616&PrintComments=1
74. Reuters, “Exxon sees gas replacing coal as top US power generator – WSJ,” December 8, 2011, http://af.reuters.com/article/energyOilNews/idAFL3E7N82P820111208
75. Julie Johnsson and Mark Chediak, “Electricity Declines 50 % as Shale Spurs Natural Gas Glut: Energy,” Bloomberg, January 17, 2012,
http://www.bloomberg.com/news/2012-01-17/electricity-declines-50-in-u-s-as-shale-brings-natural-gas-glut-energy.html
76. EIA, “Direct Federal Financial Interventions and Subsidies in Energy in Fiscal Year 2010,” http://www.eia.gov/analysis/requests/subsidy/pdf/subsidy.pdf, xiii.
77. Treasury Department data, http://www.treasury.gov/initiatives/recovery/Pages/1603.aspx.
Ener
gy P
olic
y an
d th
e En
viro
nmen
t Re
port
10
February 2012
20
78. Analysis done by author of Treasury Department data. The eight companies and the amount of their 1603 grants are: Iberdrola: $1.07 billion NextEra: $618 million TerraGen: $467.9 million Invenergy: $229.5 million Edison Mission: $161.8 million NRG: $84.2 million Pattern: $80.3 million E.On: $542.5 million See also Robert Bryce, “Why the Wind Industry Is Full of Hot Air and Costing You Big Bucks,” FoxNews.com, December
20, 2011, http://www.foxnews.com/opinion/2011/12/20/fossil-fuel-industry-big-business-cashing-in-big-on-renewable-subsidies/print#ixzz1j4sk44eD. Note that the Fox story says that the nine wind companies collected $3.37 billion. That figure is incorrect. For AWEA’s board membership, see: http://www.awea.org/learnabout/aboutawea/bod.cfm.
79. Eric Lipton and Clifford Krauss, “A Gold Rush of Subsidies in Clean Energy Search,” New York Times, November 11, 2011, http://www.nytimes.com/2011/11/12/business/energy-environment/a-cornucopia-of-help-for-renewable-energy.html?pagewanted=all.
80. EIA data, http://www.eia.gov/analysis/requests/subsidy/pdf/subsidy.pdf, xiv.
81. Russell Gold, “Wind, Sun Power Still Face Hurdles,” Wall Street Journal, March 31, 2011, http://online.wsj.com/article/SB10001424052748703883504576186961618483344.html.
82. Yahoo! finance data, http://biz.yahoo.com/p/sum_qpmd.html.
83. The entire memo can be seen at: http://media.oregonlive.com/politics_impact/other/Summers_renewable_energy_memo%5B1%5D.pdf.
84. Susan Combs, Texas Comptroller of Public Accounts, “Texas Economic Development Act Report 2010,” December 2010, http://www.texasahead.org/tax_programs/chapter313/TEDA2010-96-1359.pdf, 5.
85. Ibid., 88.
86. Morgan Smith, Axel Gerdau, and Ryan Murphy, “Wind Farm Money Fuels Spending in West Texas Schools,” Texas Tribune, November 11, 2011, http://www.texastribune.org/library/multimedia/wind-farm-money-spending-schools.
87. Harry Esteve, “Walmart, Others Make Money on Oregon’s Energy Tax Credits,” The Oregonian, December 29, 2009, http://www.oregonlive.com/politics/index.ssf/2009/12/walmart_others_make_money_on_o.html.
88. Ted Sickinger, “Oregon’s Largest Solar Project Marks End of Business Tax Credit Era,” The Oregonian, August 17, 2011, http://www.oregonlive.com/business/index.ssf/2011/08/oregons_largest_solar_project.html.
89. EIA data, http://www.eia.gov/todayinenergy/detail.cfm?id=2391.
90. Neela Banerjee, “EPA Set to Impose Tough Mercury Limit at Power Plants,” Los Angeles Times, December 15, 2011, http://www.latimes.com/news/nationworld/nation/la-na-epa-mercury-20111216,0,4551991.story.
91. Juliet Eilperin and Steven Mufson, “EPA Finalizes Tough New Rules on Emissions by Power Plants,” Washington Post, December 16, 2010, http://www.washingtonpost.com/national/health-science/epa-finalizes-tough-new-rules-on-emissions-by-power-plants/2011/12/16/gIQAc2WTzO_story.html.

The High Cost of Renewable-Electricity Mandates
21
92. Matthew L. Wald, “New Rules and Old Plants May Strain Summer Energy Supplies,” New York Times, August 11, 2011, http://www.nytimes.com/2011/08/12/business/energy-environment/new-rules-and-old-plants-may-strain-summer-energy-supplies.html?pagewanted=all.
93. NERA report, http://www.eenews.net/assets/2011/06/08/document_gw_04.pdf.
94. EIA data, http://www.eia.gov/electricity/state/california and http://www.eia.gov/electricity/state/california/xls/sept05ca.xls.
95. Loren Steffy, “The Hidden Cost of Smart Meters,” Houston Chronicle, November 18, 2011, http://www.chron.com/business/steffy/article/The-hidden-cost-of-smart-meters-2277478.php.
96. Edison Electric Institute, “Transmission Projects: At a Glance,” March 2011, http://www.eei.org/ourissues/ElectricityTransmission/Documents/Trans_Project_lowres.pdf, iii.
97. According to the Census Bureau, the current population of the U.S. is about 312 million.
98. American Wind Energy Association data, http://www.awea.org/learnabout/industry_stats/index.cfm.
99. Kate Galbraith, “Cost of Texas Wind Transmission Lines Nears $7 Billion,” Texas Tribune, August 24, 2011, http://www.texastribune.org/texas-energy/energy/cost-texas-wind-transmission-lines-nears-7-billion.
100. Dennis Cauchon, “Household Electricity Bills Skyrocket,” USA Today, December 13, 2011, http://www.usatoday.com/money/industries/energy/story/2011-12-13/electric-bills/51840042/1?csp=ip.
101. EIA data, http://www.eia.gov/totalenergy/data/annual/pdf/sec8_39.pdf.
102. EIA data, http://www.eia.gov/electricity/monthly/update. Actual total is $0.1212.
103. EIA data, http://www.eia.gov/electricity/annual/pdf/tablees1.pdf.
104. Ron Scherer, “A Long, Steep Drop for Americans’ Standard of Living,” Christian Science Monitor, October 19, 2011, http://www.csmonitor.com/layout/set/print/content/view/print/415564.
105. Between 2000 and 2009, inflation-adjusted weekly wages fell, according to the Economic Policy Institute; see Ray Sanchez, “Will Middle Class America Ever See a Real Raise Again?,” ABC News, August 6, 2010,
http://abcnews.go.com/Business/strangling-middle-class-america/story?id=11325933#.TwcenZhkjGs.
106. Alexander and Energy Economics, “Renewable Energy Mandates,” 4.
107. Rebecca Smith, “Households Seeking Energy Assistance Soar,” Wall Street Journal, January 12, 2009.
108. National Energy Assistance Directors’ Association, “National Energy Assistance Survey,” November 2011, http://www.neada.org/news/NEA_Survey_Nov11.pdf.
109. NEADA data, http://www.neada.org/communications/press/Press%20Resease%20-%20NEADA%2012-8-11.pdf.
110. LIHEAP Clearinghouse data, http://liheap.ncat.org/Funding/funding.htm.


fEllowS
The Manhattan Institute’s Center for Energy Policy and the Environment (CEPE) advances ideas
about the practical application of free-market economic principles to today’s energy issues. CEPE
challenges conventional wisdom about energy supplies, production, and consumption, and
examines the intersection of energy, the environment, and economic and national security.
www.manhattan-institute.org/cepe
The Manhattan Institute is a 501(C)(3) nonprofit organization. Contributions are tax-deductible to
the fullest extent of the law. EIN #13-2912529
Robert BrycePeter W. Huber
James Manzi