elite competition and the iron law of oligarchy: a tale of ... · elite have a special power to...
TRANSCRIPT

Elite Competition and the Iron Law of Oligarchy:A Tale of 14 Islands∗
Christian Dippel† Jean Paul Carvalho‡
September 9, 2015
Preliminary - Comments Very Welcome
Abstract
We develop a model of oligarchy subject to elite competition. Even when all mem-bers of the elite share an economic interest in labor repression, competition for controlof the state can drive a wedge between the incentives of old and new elites. Thus‘the iron law of oligarchy’–that all elite members share an overriding interest in re-pressive institutions–can be bent in various ways. New elites may oppose repressivelabor policies in order to maintain legitimacy among the citizenry, which in turn givesthem power to coordinate popular revolt. They can leverage this power to extractrents from the old elite or initiate a democratic transition on their own terms. Theold elite can forestall these moves by co-opting the new elite or inviting the inter-vention of an external power (e.g. colonial authority, domestic military). We test themodel’s implications using detailed historical data on the “plantocracies” of 14 BritishCaribbean sugar islands in the 19th century, where the abolition of slavery intensifiedelite turnover and competition.
∗A previous version of this paper was circulated as “Autocracy as a Safety Valve for Democracy’s Elites.” We thank Melissa Dell,Stan Engerman, Fred Finan, Price Fishback, Morgan Kousser, Gary Libecap, Suresh Naidu, Adam Przeworski, Ken Shotts, GuidoTabellini, Francesco Trebbi, Dan Trefler, Stephane Wolton, and Alex Whalley for valuable discussions and comments on that previousversion. Financial support from UCLA’s Burkle Center, Center for Economic History and Price Center are gratefully acknowledged.†University of California, Los Angeles, and NBER.‡University of California, Irvine.

“If we want things to stay as they are, they will have to change.”
— Giuseppe di Lampedusa, The Leopard
“In few places does the dead hand of the past lie as heavily on the present as in the
Caribbean.”
— Wallace (1977)
1 Introduction
A rich political economy literature has studied the expansion of democracy: how elite-dominated
oligarchic societies may become more broad-based, either in the form of autocracies that tran-
sition into democracy or in the form of narrow-based democracies becoming more broad-based
(Lipset (1959), Bourguignon and Verdier (2000), Acemoglu and Robinson (2000), Acemoglu and
Robinson (2001), Lizzeri and Persico (2004), Bruckner and Ciccone (2011), Besley, Persson, and
Reynal-Querol (2012)). Society is commonly conceptualized as consisting of an elite and a non-
elite citizenry,1 and democratic expansion or contraction is determined by exogenous fluctuations
in the power of the two groups. In an influential line of research, Acemoglu and Robinson (2000),
Acemoglu and Robinson (2001), Acemoglu and Robinson (2006b) argue that democratic expansion
has historically happened when the non-elite citizenry is temporarily empowered, and demands
to lock in this temporary power in the form of permanent institutional changes.
In the formal literature on democratic transitions, the elite and non-elite are typically conceptu-
alized as two monolithic blocs, one representing the few and one the many (Meltzer and Richard
(1981)).2 This provides a powerful workhorse model, but does not account for changes in elite
composition, nor the role of elite competition in repression and revolution. We develop a model
of elite competition and institutional formation, building on Acemoglu and Robinson (2008) and
the seminal papers before it. As in this literature, the population is partitioned into an elite and
citizenry who interact to determine political and economic institutions. Our departure point is the
assumption of a unified elite. In our model, the elite changes over time and is itself partitioned
1This distinction can be along ethnic or religious lines (Huti vs Tutsi in Rwanda, Indian vs Fijian in Fiji, Sinhalese vsTamils in Sri Lanka, Shia vs Sunni in Iraq), but can also be along racial lines as in the post bellum U.S. South.
2In the Meltzer and Richard (1981) framework, political competition is the threat of having a non-elite median voterset policies. The more unequal a society is, the further apart are the elite’s and non-elite’s policy bliss points.
1

each period into two factions, an old and new elite. The contest over political and economic in-
stitutions is played out primarily through competition between these elite factions. The old and
new elites are distinguished in an important way. The old elite has control over the distribution of
rents associated with control of the state (e.g. status, monopoly privileges). Members of the new
elite have a special power to coordinate popular revolt, by virtue of their proximity to the people.
The new elite retains this coordinating power as long as it is deemed legitimate by the citizenry. It
can use its capacity to coordinate revolt to extract rents associated with control of the state (e.g.
status, monopoly privileges) from the old elite. Under certain conditions, the old elite is willing
and able to buy the new elite’s support for repressive labor policies. If, for example, most rents
come from an agricultural export sector, then new elites can be co-opted by giving them a stake
in that sector. In this co-optive equilibrium, when old and new elite agree on policy, we have the
Iron Law of Oligarchy, which was proposed by Michels (1911)3 and which Acemoglu and Robin-
son (2006a) summarize as follows: “The reason for persistence is therefore not persistence of the
elites, but the persistence of incentives of whoever is in power to distort the system for their own
benefit.”
According to the Iron Law, an oligarchic society should maintain repressive labor policies re-
gardless of the elites’ identity, unless disturbed by popular revolt. In our model the situation is
more complex, and captures some important realities of elite survival. In particular, the elite’s
identity matters because the new elites have a different relationship with the citizens. The Iron
Law is not a law but merely the special case when the new elite’s economic incentives are both
aligned with the old elite and trump other offsetting considerations. Often, political considera-
tions drive a wedge between the incentives of the old and new elite and bend the iron law of
oligarchy. Partial co-option occurs when the new elite opposes repressive labor policies but stops
short of calling for revolt. When the new elite’s legitimacy with the citizenry is tenuous, revolu-
tion may yet occur without their involvement. For example, the 2011 Egyptian revolution would
not have been easy to forestall by co-opting the Muslim Brotherhood, because it did not have
legitimacy among most young Egyptian revolutionaries. In other cases, no form of co-option is
attainable. When the new elite is too powerful, it is prohibitively costly to co-opt. The old elite
3Michels said: “Even when the discontent of the masses culminates in a successful attempt to deprive the bour-geoisie of power, this is effected only in appearance; always and necessarily there springs from the masses a neworganized minority which raises itself to the rank of a governing class.”
2

distributes none of the rents to the new elite. In response, the new elite calls for revolution in an
attempt to wrest total control of state rents in a democratic transition that ousts the old elite. With
sufficient coercive capacity however, the old elite may instead quell the revolution and perpetuate
the oligarchic system. Otherwise, the old elite has a last resort, which is historically important in
our context of the Caribbean. Namely, they can cede power to an external entity (e.g. a foreign
power, the domestic military), which intervenes to suppress any attempts at popular revolt.
Levels of co-option can change over time and may have a particular life cycle. A path that is
historically important is one in which the old elite initially co-opts the new elite. As it is gradually
forced to cede too much of state rents to the new elite in order to appease the citizenry, the old elite
eventually reverts to repression. For example, Thailand’s May 2014 military coup has been char-
acterized as “the culmination of months of maneuvering by the Bangkok establishment to sideline
the populist movement that has won every national election since 2001.” The establishment was
“seeking to suspend democracy, at least in the short term, as it struggled to unseat a ruling party
it has been unable to defeat at the polls” (Fuller (2014)). In Greece, politicians of the incumbent
Conservative Party initially allowed tried to co-opt the left-leaning Center Union Party, but when
it became clear the left would carry the next elections, the conservatives invited a military coup,
leading to the 1967 coup d’etat (Kassimeris (2006)). In Sri Lanka, independence from the British in
1948 unleashed new political forces, including a left wing Buddhist nationalist movement. As the
old Christian elite of the country faced extinction from power, several members of it orchestrated
an ultimately abortive coup in January 1962.
We test the implications of our model in very rich and granular micro-data on elites in 14
British Caribbean plantation colonies in the 19th century. There is a deep appeal in studying the
Caribbean as a set of case studies for the dynamics of elite survival. One aspect of this appeal is
that each of the 14 colonies was so small that we can can get a very complete picture of elites, both
economic and political, and the dynamics of their changing identity and coherence. Another is
that these islands experienced truly tumultuous exogenous shocks in that time. In 1833, London
imposed the abolition of slavery, turning about 90% of the Caribbean’s population into free citi-
zens overnight, and giving rise to a new elite representing the freedmen that gradually obtained
the land needed to qualify for voting rights. In 1854, a second shock, more subtle but equally
far-reaching, hit when London imposed the Caribbean Encumbered Estate Act (EEA), a change in
3

bankruptcy law that dramatically increased turnover in plantation ownership, and very suddenly
gave the planter elite a much more creole and colored identity. This altered the balance for new
elites between co-option and preservation of legitimacy among the citizenry. Importantly, the EEA
allows us to isolate the role of identity and elite competition in institutional persistence, because it
occurred at a time when the economic circumstances of the plantation system – the terms of trade
and sugar’s importance in the agricultural mix – where very stable. The ultimate response of elites
was far-reaching and radical. Eleven of the 14 islands had begun the 19th-century with strong lo-
cally elected parliaments, which were the main vehicle of elite power. All eleven parliaments
survived the two decades between the abolition of slavery and the EEA, but two decades later, ten
of the eleven had voluntarily abolished themselves. Through the lens of our model, we argue that
the EEA caused an influx of new elites that was too rapid for old elites to co-opt them. Instead
they chose to invite the Crown to run the government with unconstrained executive power in a
system called Crown Rule.
By cross-country standards, the islands were very similar in their histories and economic struc-
tures. We take advantage of this low unit heterogeneity and begin the empirical section of the
paper with a set of cross-island panel regressions. Using newly assembled data of all elected
politicians in all 14 colonies from 1836 up to each assembly’s abolition, we show that our pre-
ferred proxy measure for the entry of new elites has robust predictive power for the timing of
Assemblies’ abolition. Furthermore, the introduction of the EEA, and its interaction with cross-
sectional proxies for its likely impact on elite churning, predict both the entry of new elites and
the timing of Assemblies’ abolition. We use these country-panel observations as a springboard
into much more granular micro-evidence on the changing identity of and relations between the
families that formed the political and economic elite of the Caribbean islands:
1. Using a collection of 76 plantation surveys of the 14 colonies at different times between 1815–
1891, laboriously assembled from 48 separate sources, we show that turnover in plantation
ownership increased dramatically after the 1854 passing of the EEA.
2. Combining the plantation data with the politician data, the paper further shows that (a)
planters continued to completely dominate the assemblies in the early years after abolition,
(b) that this dominance slowly declined thereafter, and (c) that the biggest change after 1854
4

was not a decline in the planters’ representation in the assemblies, but in their identity, as
long-established planter families disappeared.
3. Using a complete history of Jamaica’s parliament from 1640–1836, the only instance where
consistent data exists on assembly membership before 1836, we show that particularly the
most established planter disappeared from Jamaican politics after 1854.
4. We provide a detailed comparison between politics in Jamaica and Barbados. These were
economically the two most important islands. In addition, Barbados was the island where
turnover in plantation ownership was lowest, and the only island that never abolished its
parliament. We show that in both islands the voting network early on consisted of a single
network, which largely voted in favor of planter issues. In Barbados this remained true
after. In Jamaica by contrast, a second voting bloc emerged, which represented non-planter
interests. In other words, the voting network in Jamaica became partisan, or characterized
by ‘homophily’
5. For only Jamaica, we also know the race and profession of all parliamentarians. We show
that many of the colored new members of Jamaica’s assembly – and all those colored mem-
bers that were planters – voted consistently in the planter bloc against smallholder interest;
i.e. it was economics and not race that determined voting behavior. Lastly, while the size
of the planter faction declined only marginally after 1854, its voting coherence as a political
bloc declined very markedly.
This paper speaks to a well-established literature on the consolidation and stability of demo-
cratic regimes (Haggard and Kaufman (1997), Przeworski, Alvarez, Cheibub, and Limongi (2000),
Boix (2003), Acemoglu and Robinson (2006b), Haggard and Kaufman (2012)). In that literature,
political competition often leads to a strengthening of democracy (Acemoglu and Robinson (2001),
Bruckner and Ciccone (2011), Besley et al. (2012)). By contrast, this paper shows that political com-
petition may lead elites to abolish democracy altogether and initiate a regime switch to autocracy if
the cost of a non-elite democratic government is high relative to that of an autocratic regime. This
paper also speaks to a broader literature on the nexus between endogenous institutional change,
elite persistence, and economic growth (North and Weingast (1989)).
5

The paper is structured as follows. Section 2 introduces and analyzes a model of oligarchy
under elite competition. Section 3 provides a detailed historical account of the abolition of slavery,
its consequences, the EEA and the introduction of Crown Rule in the Caribbean islands, relating
all these historical developments to our model. The empirical analysis is set out in sections 4 and
5. Section 6 concludes.
2 Model
Society consists of a set of individuals I , indexed by i.4 Interactions occur over an infinite horizon.
Time is discrete and denoted by t = 0, 1, 2 . . . Each period society is partitioned into an elite and
citizenry (or workforce). The elite is a fine set of individuals, whereas the citizenry is a continuum.
During period t = 0, all that occurs is that some individuals, composing the initial elite E0, are
each endowed with one unit of land. The initial citizenry, C0 ≡ I − E0, is endowed with no
land. Individual i’s initial landholding is denoted by `0i ∈ {0, 1}, so that E0 = {i : `0i = 1}. The
quantity of land is finite and fixed at M units for all time. Hence the number of elite places is a
finite number |Et| = M for all t. While the number of elite places is fixed, the identity of the elite
changes over time. We assume the set of citizens Ct is a continuum with mass L which is also
fixed for all t.5
From period 1 onwards, interactions occur. Society begins each one of these periods in one
two states denoted by zt, indicating the political institutions prevailing at the time, namely non-
democracy (zt = 0) or democracy (zt = 1). The initial state is set to be non-democracy, z1 = 0.
Thenceforth the state is determined endogenously.6
Let us specify the timing of events within a given period t ≥ 1, in each state.
Non-democracy, zt = 0:
• An individual’s land holdings at the beginning of the period are the same as his holdings
at the end of the previous period, that is `t−1i . The elite, i.e. the set of landowners, at the
4We can also think of each i ∈ I as a dynasty of players.5A continuum of citizens means that the size of the citizenry is unaffected by outflows to the elite.6As is common in the literature, voting institutions are not explicitly modeled. Democracy means that all citizens
directly vote on a policy, as would be the case in a direct democracy. Limited democracy in which only elites vote onpolicy is referred to as non-democracy.
6

beginning of period t is thus Et−1 = {i : `t−1i = 1}. The set of workers/citizens is Ct−1 =
I − Et−1.
• Because of exogenous wealth-shocks, m ≤ |Et−1| members of the elite offer their land for
sale. Each i ∈ Ct−1 can choose to bid for land on offer.7 The market clears and the registry of
landowners is updated. The elite member selling land leaves the population (e.g. migrates
to London).
The partition of the population is updated into an elite Et and citizenry Ct. The elite itself
can be partitioned into an ‘old elite’ Ot ≡ Et−1 ∩Et and a ‘new elite’ N t ≡ Ct−1 ∩Et, whose
land is newly acquired (and who are not part of the citizenry at time Ct).
In this draft, we are abstracting away from an aspect which we will add to the model, which
is “social identity.” In the present set-up, new elites become old elites over two periods, and
there is no legacy of having once been a non-elite. We will introduce this legacy in the form
of social identity, which will means new elites become established more slowly, and will lose
their legitimacy with the citizens more slowly. In the present set-up, newcomers join elite
society very rapidly, and legitimacy is mechanically lost after one period. This makes the
‘iron law of oligarchy’ more likely to emerge.
• Rents from control of the state, simply ‘rents’ henceforth, are disbursed among the elite Et.
These rents are independent of income from land and labor. In particular, each period a pot
of size R (dollars) is divided among the old and new elite in the following manner.
The old elite Ot offers a contract to the new elite N t. Acting in a unified manner, the new
elite chooses whether or not to accept the contract. If it rejects, then the new elite gets none
of the rents; the old elite keeps R, which is evenly divided among its members.
If the new elite accepts the contract, then it receives a payoff of RN ≤ R which is contingent
upon its subsequent actions during the period as follows.
• Economic institutions are set in the following manner. They come in two forms, a labor
repressive institution τ t = 0 and a competitive labor market τ t = 1. The old and new
elite simultaneously and independently announce support for one of these institutions. The
7This means that an individual can own at most one unit of land.
7
policy announced by group G ∈ {O,N} is denoted by atG ∈ {0, 1}. When both groups
support the same policy, atO = atN , that policy is implemented. Otherwise, the old elite’s
announced policy is implemented with probability p and the new elite’s announced policy
is implemented with probability 1 − p. Thus, p is one (exogenous) measure of the power of
the old elite.
• The new elite decides whether to call for revolt, γt = 1, or not, γt = 0.
If the new elite supports competitive labor markets, atN = 1, then it has legitimacy among the
citizenry, which means that it can play a role in coordinating revolt. Suppose the new elite
is legitimate. Then the citizenry is attentive to whether the new elite calls for revolt and a
successful revolt occurs with probability f(γt), where f(1) > f(0). That is, a call for revolt
by the new elite increases the likelihood of successful revolt.
If the new elite supports labor repressive institutions, atN = 0, then it is illegitimate from the
perspective of the citizenry. The probability of successful revolt is f(0), regardless of γt, i.e.
whether the new elite calls for revolt or not.8
Suppose a successful revolt occurs. If the new elite is legitimate and had called for revolt, it
captures all the rents R for the period, which is evenly divided among its members. The old
elite and citizenry get nothing. If the new elite is illegitimate or had not called for revolt, then
all the rents R for the period go to the citizenry, being evenly divided among its members.
After any successful revolt, a transition to democracy occurs, such that zt+1 = 1.
If revolt does not occur or is not successful, the new elite receives state rents of RN (atN , γt),
which is evenly divided among its members and depends on whether the new elite sup-
ports labor repressive institutions and calls for revolt. Recall that this contingent payment is
chosen by the old elite. In addition, there is no transition to democracy, zt+1 = 0.
• Wages w(τ t)
are paid to the citizenry and profits k(τ t)
to the elite depending on the eco-
nomic institutions in place.
8To illustrate, consider the case of Egypt at the time of the 2011 revolution. The military was the old elite, and theMuslim Brotherhood the new elite. The citizenry were represented largely by the young revolutionaries who were inthe vanguard of the Tahrir square protests. The Muslim Brotherhood joined the initial protests in January 2011, callingfor revolution. This led to the ouster of President Mubarak. The Muslim Brotherhood did not, however, support furtherprotests. They became political insiders, contested political power and eventually lost legitimacy. The revolutionaryyouth were sidelined as the military consolidated power.
8
As in Acemoglu and Robinson (2008), each citizen i ∈ Ct inelastically supplies one unit
of labor. Each member of the elite i ∈ Et employs citizens and uses their unit of land to
produce a unique private good. The production function is linear with constant marginal
productivity A.
In a competitive labor market τ t = 1, each citizen receives his marginal product of labor,
w(1) = A
and each member of the elite makes a profit of
k(1) = 0.
Under a labor repressive institution τ t = 0, each citizen receives less than his marginal
product of labor. Let λ < 1 be the fraction of national income going to citizens. Then wages
are:
w(0) = λA
and profits to each elite member are
k(0) = (1− λ)A L
M.
The old elite maximizes the discounted sum of its profits plus state rents, as does the new
elite. The discount factor is δ < 1.
Democracy, zt = 1:
Under democracy zt = 1, the only difference is that all individuals i ∈ I vote for their preferred
economic institution, τ t, revolt cannot occur and state rents R are divided evenly among all mem-
bers of the elite (old and new), Et. We assume for convenience that democracy is an absorbing
state: if zT = 1 then zt = 1 for all t > T .
9

2.1 Some immediate results
• The optimal contract R∗N (atN , γt) sets:
R∗N (0, 0) > R∗N (1, 0), R∗N (0, 1) > R∗N (1, 1) = 0. (1)
• The new elite will never call for revolt when illegitimate.
• Competitive labor markets prevail under democracy by the median voter theorem.
2.2 Conjectured Equilibria
◦ Unified Elite. The new elite chooses (atN , γt) = (0, 0) in each period. Labor repressive insti-
tutions are implemented with probability one. Revolt occurs with probability f(0). When a
revolt occurs, the new elites – because they lost legitimacy by letting themselves be co-opted
– share none of the spoils if it succeeds.
◦ Partially Co-opted New Elite. The new elite chooses (atN , γt) = (1, 0) in each period. Labor
repressive institutions are implemented with probability p. Revolt occurs with probability
f(0). This is the ‘Aung San Suu Kyi equilibrium’ or ‘Dalai Lama’ equilibrium, where new
elites engage in a sort of civil disobedience that is unlikely to affect policy but maintains their
legitimacy.
◦ Elite Conflict. The new elite chooses (atN , γt) = (1, 1) in each period. Labor repressive in-
stitutions are implemented with probability p. but the new elite is demanding change and
calling for a revolt, which therefore occurs with higher probability f(1).
A unified elite equilibrium can be supported when the size of state rents R (which the old elite
can use to buy off the new elite) is large relative to the size of the new elite m (which could be
made time-dependent and subject to a temporary shock).
2.3 Crown Rule
Crown rule can be interpreted as the intervention of a foreign power (alternatively the domestic
military) upon invitation by the old elite. To study the move to crown rule in the Caribbean,
10

suppose that in state 0, non-democracy, the old elite can choose between offering a contract to the
new elite as above or sharing the rentsRwith a foreign power in return for protection. The foreign
power chooses the society’s economic institutions for the period τ t and lowers the likelihood of
successful revolt to f < f(0). The foreign power has an outside option worth RF < R per period.
Hence if the old elite takes this option, the foreign power receives rents of RF for the period and
the old elite receives R−RF , which is evenly divided among its members.
If the old elite cannot effectively buy off the new elite, i.e. it must give up a large fraction of
R to ensure the new elite does not oppose labor repression and does not call for revolt, then it
may benefit from contracting with the foreign power. It is costly to buy off the new elite when the
new elite is effective at coordinating revolt (f(1)− f(0) is high) and profits from land under labor
repression k1 are low. Under these conditions, the old elite may benefit from external interven-
tion. In addition, the new elite will share the old elite’s interest in external intervention when the
baseline probability of revolt f(0) is high, i.e. when the citizenry can effectively mount a revolt on
its own. If such a revolt occurs the new elite will receive none of the gains from ousting the old
elite. Hence positive shocks to f(0) can lead to the old and new elites jointly ceding power to a
foreign entity. When f(0) is low, however, the new elite will oppose such moves by the old elite,
because there is little chance of revolution going ahead without its participation.
3 The Post Slavery Caribbean Plantation Colonies
Before Abolition: Table 1 shows the 14 islands we study. They were founded in three waves.
The oldest — Antigua, Barbados, Jamaica, Montserrat, Nevis, St. Kitts, and the Virgin Islands —
were founded in the 1600s by small-scale British planters, much like those in the Chesapeake Bay.
The second wave — Dominica, Tobago, St. Vincent, and Grenada — were annexed from France
at the end of the Seven Years War in 1765, and were resettled by sugar planters from the other
Caribbean islands The last three colonies — Trinidad, St. Lucia, and Guyana — were ceded to
Britain between 1797 and 1803. Sugar was introduced into the Caribbean in the late 17th century,
and with it wealthy great planters came to dominate while white commoners left for the American
colonies, their place taken by an ever-expanding population of imported slaves, (Taylor (2002,
ch. 11)). By 1800, the great planters were the “wealthiest men in all of English America” (Galloway
11
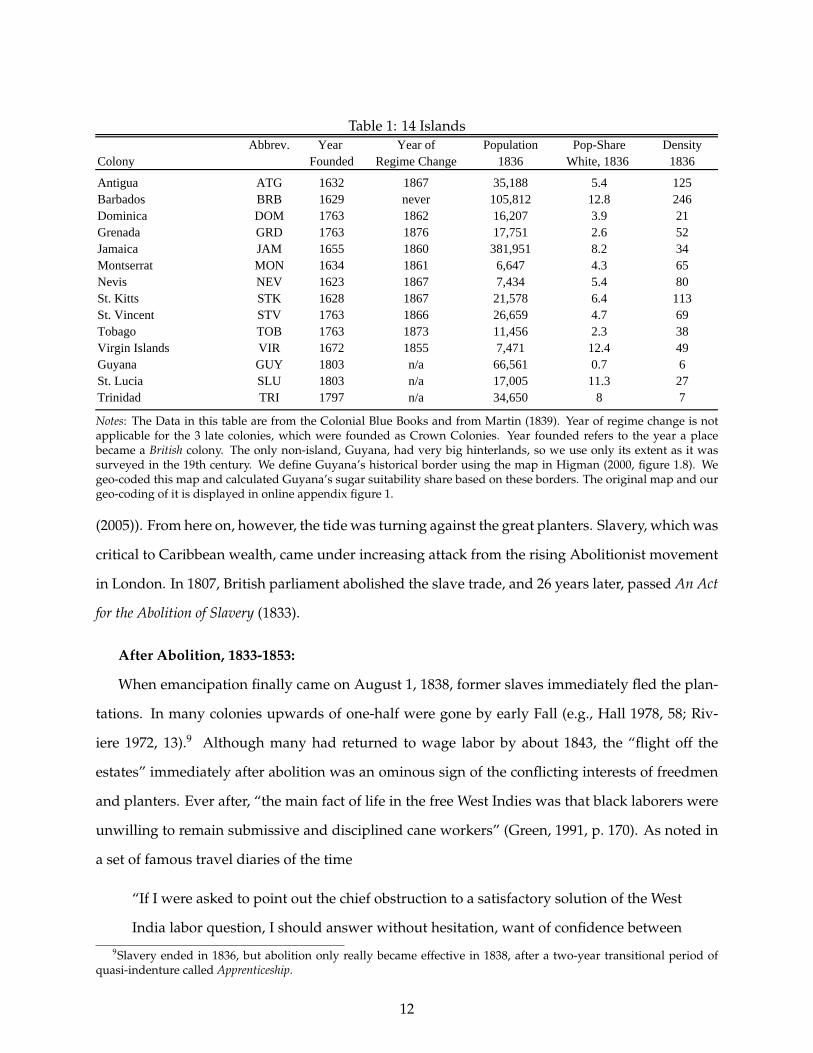
Table 1: 14 Islands& Abbrev. & Year & Year of & Population & Pop-Share & Density &
Colony & & Founded & Regime Change & 1836 & White, 1836 & 1836 &
Antigua & ATG & 1632 & 1867 & 35,188 & 5.4 & 125 &Barbados & BRB & 1629 & never & 105,812 & 12.8 & 246 &Dominica & DOM & 1763 & 1862 & 16,207 & 3.9 & 21 &Grenada & GRD & 1763 & 1876 & 17,751 & 2.6 & 52 &Jamaica & JAM & 1655 & 1860 & 381,951 & 8.2 & 34 &Montserrat & MON & 1634 & 1861 & 6,647 & 4.3 & 65 &Nevis & NEV & 1623 & 1867 & 7,434 & 5.4 & 80 &St. Kitts & STK & 1628 & 1867 & 21,578 & 6.4 & 113 &St. Vincent & STV & 1763 & 1866 & 26,659 & 4.7 & 69 &Tobago & TOB & 1763 & 1873 & 11,456 & 2.3 & 38 &Virgin Islands & VIR & 1672 & 1855 & 7,471 & 12.4 & 49 &Guyana & GUY & 1803 & n/a & 66,561 & 0.7 & 6 &St. Lucia & SLU & 1803 & n/a & 17,005 & 11.3 & 27 &Trinidad & TRI & 1797 & n/a & 34,650 & 8 & 7 &
Notes: The Data in this table are from the Colonial Blue Books and from Martin (1839). Year of regime change is notapplicable for the 3 late colonies, which were founded as Crown Colonies. Year founded refers to the year a placebecame a British colony. The only non-island, Guyana, had very big hinterlands, so we use only its extent as it wassurveyed in the 19th century. We define Guyana’s historical border using the map in Higman (2000, figure 1.8). Wegeo-coded this map and calculated Guyana’s sugar suitability share based on these borders. The original map and ourgeo-coding of it is displayed in online appendix figure 1.
(2005)). From here on, however, the tide was turning against the great planters. Slavery, which was
critical to Caribbean wealth, came under increasing attack from the rising Abolitionist movement
in London. In 1807, British parliament abolished the slave trade, and 26 years later, passed An Act
for the Abolition of Slavery (1833).
After Abolition, 1833-1853:
When emancipation finally came on August 1, 1838, former slaves immediately fled the plan-
tations. In many colonies upwards of one-half were gone by early Fall (e.g., Hall 1978, 58; Riv-
iere 1972, 13).9 Although many had returned to wage labor by about 1843, the “flight off the
estates” immediately after abolition was an ominous sign of the conflicting interests of freedmen
and planters. Ever after, “the main fact of life in the free West Indies was that black laborers were
unwilling to remain submissive and disciplined cane workers” (Green, 1991, p. 170). As noted in
a set of famous travel diaries of the time
“If I were asked to point out the chief obstruction to a satisfactory solution of the West
India labor question, I should answer without hesitation, want of confidence between9Slavery ended in 1836, but abolition only really became effective in 1838, after a two-year transitional period of
quasi-indenture called Apprenticeship.
12
employer and employed. The planters cling unwittingly to the shreds of the system of
coercion in which they were once taught to believe.” (Sewell, 1861, p.158)
The planters’ fortunes hinged primarily on their ability to use the state’s legislative, judicial
and executive arms to secure a steady supply of labor at a low cost. However, operating under
the watchful eye of London Abolitionists, Caribbean planters could no longer take the law into
their own hands. Lowes (1994, ch. 5) writes that “because of pressures from the Colonial Office, a
comfortable translation of pre-emancipation legal distinctions into distinctions of skin color was
not possible.” Instead of using the whip to raise workers’ effort or lower wages, they had to rely
on legal coercion. Craton (1997, p. 392) argues that “there were organized efforts to evict peasants
from the land throughout the Caribbean,” and McLewin (1987, p. 189) argues that “assemblies
brought into law an umbrella of coercive acts with the purpose of creating a landless peasantry.”10
Planters could make it difficult for freed slaves to obtain legal title to un-alienated public Crown
land or abandoned plantations.11 They could also make it difficult to retain land by imposing high
so-called quit rents, “parochial land taxes that pressed hard on small proprietors” (p. 184 McLewin,
1987). Laws against vagrancy, trespassing and squatting made labor immobile across parishes and
made it more difficult for plantation workers to strike out on their own.12 Prominent in the early
years after Abolition was the figure of the “planter-judge:”
“Among the new laws that worried [the Colonial administration] was the Vagrancy
Act, which deviated from the provisions recommended by the British orders in council
issued 7 September 1838, being generally ’more severe.’ Particularly troubling was
a provision giving summary jurisdiction to local magistrates, who, being planters in
most cases, could be expected to harbor biases against allegedly ’vagrant’ laborers.”
(Holt, 1991, p.185)
Most such legislation “gave summary jurisdiction in land tenure and trespass cases to any two
magistrates, one of whom even could be the complainant.” In other words, two planter-judges10For example, “crown land was priced to encourage labor for wages and was chiefly in remote locations and of poor
quality” (Bolland (1981)) and “parochial land taxes pressed hard on small proprietors” (McLewin (1987, p. 184)).11“Crown land was priced to encourage labor for wages and was chiefly in remote locations and of poor quality.”
(Bolland (1981))12In models of coercive labor markets, coercion of workers (using the whip) relaxes workers’ incentive compatibility
constraint. By contrast, reducing their outside option relaxes workers’ participation constraint (Acemoglu and Wolitzky(2011), Naidu and Yuchtman (2013), Dippel, Greif, and Trefler (2015)). The evidence collected in Dippel et al. (2015)shows that the latter form of coercion was by far the more important one in the post-slavery Caribbean.
13

together could persecute any worker or squatter. While keeping land out of freedmen’s hands
was essential to maintain a willing workforce, there was also a political calculus to it, which is our
primary focus here. To limit the franchise and, with this, political competition.
Elites’ political power found its expression in large part in their control of the local legisla-
tures, the Assemblies, which the Caribbean’s original smallhold settlers had pushed for in order to
control taxes and spending (Taylor (2002, p. 246)). These assemblies were powerful institutions
that “seriously curtailed the powers of the governors in the colonies” (Morrell and Parker, 1969,
p. 435), and
“in addition to their legislative functions, they had extensive executive powers. Colo-
nial Acts assigned all important administrative tasks to special boards, or commis-
sions, upon which members of the assembly enjoyed either exclusive or majority con-
trol” (Green (1991, p. 68)).
Not only could they veto the budget including the governors’ salary, local elites were not afraid of
using the assemblies to publicly ostracize Crown administrators that over-stepped their bound-
aries:
“When Henry Barkly, the newly appointed Governor of Jamaica, dispatched a spe-
cial message to the Assembly suggesting the postponement of a legislative action, he
was publicly ignored and privately reproached. Had he not been new to the office
and popular with assemblymen, he would have been declared in breach of privilege,
and the Assembly would have suspended its business until Barkly had submitted an
appropriate apology.” (Green, 1991, p. 70)
The main conflict of interest between the planters and freedmen was on the issue of taxation
and public-good provision. Freedmen’s primary concerns were land redistribution and public-
good provision. Planters were naturally averse to land redistribution and were also disinterested
in the expansion of education and health services, which they provided themselves as club goods
rather than as public goods (Sewell (1861, p. 39), Dookhan (1977), Brizan (1984, p. 163)). Holt
(1991, p.196) summarizes this view:
“Planters generally opposed all measures to expand education. Very likely the idea of
spending money primarily for the benefit of the black majority did not appeal to most
14

planters. Most of the white estate managers had no family or children, at least none
they chose to recognize officially. The wealthier resident planters sent their children to
a few select private academies on the island and to England.”
Whom did the assemblies represent? Before abolition, assemblies were everywhere the main
representation of planter interest. There is little doubt that the franchise remained concentrated
and parliamentary seats dominated by planters in the early years after abolition as well:
“Even after post-emancipation franchise reform had been enacted, the number of qual-
ified electors in the colonies was small. A few merchants, lawyers, and medical prac-
titioners secured seats in the Jamaica Assembly before 1840, but planters dominated
colonial government in the thirties and forties. Barbados merchants petitioned that
they were totally unrepresented in their Assembly. In 1837, twenty-two of twenty-five
Antigua Assembly were planters.” (Green, 1991, pp.73)
London was clearly aware that the assemblies were not likely to represent the interests of the
people that had just been freed from slavery.13 However, while it had imposed abolition on its
colonies, it was not prepared to impose a constitutional changes on them. So although colonial
governors would have been instructed to look after the freedmen’s interests to the extent possible,
the reality for a governor was that
“to join with local white society meant a pleasant tour of duty, to fight them meant po-
litical conflict and social ostracism. Inevitably, the governor passed smoothly into the
union, political and social, of government and vested interests.” (Lewis, 2004, p. 104)
Craig-James (2000, p. 252) recounts a confrontation between Tobago’s governor and Tobago’s leg-
islative council: The legislators stopped the governor’s planned progressive land tax reform by
tieing it to a salary cut to the governor.
This planter dominance was, however, built on shaky foundations. Before abolition it had
been, throughout the Caribbean, “distinctly the exception for a member of the legislature to be
returned by more than 10 votes” (Wrong (1923, p. 69)). Despite this narrow franchise, the property
holdings required to vote were actually quite low, having typically staying at their original 10-acre
13Henry Taylor, the colonial office’s supervisor of West Indian affairs, declared the assemblies to be “eminently dis-qualified for the great task of educating and improving a people newly born to freedom” (Wrong (1923)).
15
threshold from the Caribbean’s smallhold days (Wrong (1923)).14 Because the price of 10 acres of
land was certainly within the purview of what a smallholder could save up over a number of
years, the planter’s voter base could this overwhelmed relatively quickly. However, freedmen
seemed to generally not be particularly concerned with obtaining the amount of land required
for voting rights. While there were some true feats of coordination in purchasing land – Lewis
(2004, p.302) recounts an episode were sixty-three freedmen jointly purchased Northbrook Estate
in Guyana in 1839 – these appear to have been isolated , and coordination seems to generally not
have been aimed at crossing the 10 acre threshold needed to obtain the franchise. Craig-James
(2000, p.89) and Hall (1959) use data for the distribution of smallholds to show, for Tobago and
Jamaica respectively, a clear preponderance of 5–10 acre smallholds, which were economically
viable but did not give the franchise. See also Craig-James (2000, p.120) on this.
The 1854 Encumbered Estate Act and Its Consequences: From its nadir in 1843, the Caribbean
plantation system went on to recover and stabilized for the next 40 years, with sugar still constitut-
ing more than 65% of exports in eleven of the fourteen islands in 1883. This recovery was driven
by several factors. First, planters re-exerted their control over local labor markets (Dippel et al.
(2015)).15 Second, in 1849 Britain repealed the Navigation Act, allowing Caribbean planters to sell
their sugar directly to North American merchants. Third, the world sugar price recovered in the
early 1850s and then remained stable until 1884 when German and French beet sugar subsidies
triggered another 40% decline in the world sugar price.16
While the plantation system recovered for a time, its profitability was a shadow of the past, as
profits got squeezed by lower prices and higher labor costs. Plantations continued largely to turn
operational profits, but could no longer cover the encumbrances that many British planter fami-
lies had attached to their estates during the 18th century. Encumbrances were regular monetary
commitments to the wider family in England that were to be paid from the plantations’ revenues.
14The franchise in the Caribbean, as elsewhere in the British colonies, was obtained primarily through land owner-ship. The franchise rules reported in the Blue Books show that there is very little variation in the 10-acre threshold acrosscolonies.
15Dippel et al. (2015) investigate the effects of the global decline in sugar-prices on labor markets in the 14 BritishCaribbean sugar colonies. They find a market-based negative effect of the price decline on wages, but also a positiveinstitutional effect because the erosion of the plantation system’s coercive power (online appendix figure 4) increasedwages.
16Online appendix figure 2 shows London sugar prices from 1838 – 1914. Online appendix figure 3 shows that thesewere entirely determined by market forces outside the Caribbean. Online appendix figure 4 shows that the dominanceof sugar as the Caribbean’s main export crop remained largely unbroken by 1883.
16
As obligations from encumbrances piled up, many plantations started their slide into bankruptcy.
Because the legal tangle of encumbrance obligations was prohibitively expensive to resolve, many
nominally bankrupt plantations continued operating while piling up debt with both the encum-
brancers and the merchants that advanced them credit (Beachey (1978, ch.1), Cust (1859, pp.9–
13)). This cumbersome bankruptcy law changed in 1854, when the Caribbean Encumbered Estate
Act (EEA) passed in British Parliament. The innovation of the EEA was threefold: First, it allowed
any of the plantations’ many potential encumbrancers and creditors to initiate bankruptcy pro-
ceedings; second, it established a clear legal hierarchy of creditor claims, and third, it instituted
a specialized court in London with offshoots in the colonies that ensured that these claims were
processed in a timely manner (Cust (1859, pp.5-7, 13-15), Sewell (1861, pp.82, 89)). The EEA led to
dramatic turnover in the ownership of sugar plantations throughout the Caribbean.
“The act played a key role in the snowballing process of turnover–so great a role, in
fact, that one merchant reported that all but eight estates changed hands between 1860
and 1897” (Lowes, 1994, p.21)
Who were the new planters? Most of the sold estates ending up in the hands of local merchants
and former estate managers, so-called attorneys (Lowes (1994), Craig-James (2000)). The EEA es-
tablished priority among claimants of the merchant’s lien, which gave the merchants that financed
the day-to-day plantation operation first call to take over the estates (Crossman and Baden-Powell
(1884), Cust (1859, pp.5-7, 13-15)). When these merchants were local they often took over the es-
tates they had hitherto financed ((Brizan, 1984, p.201)). When the merchants were in London, they
usually resold the estates to local interests (Lowes (1994, ch.1, pp.19-22)). As a result,
“a new petit bourgeois class emerged, consisting of merchants, successful estate own-
ers without the ancestry and traditions of the older landed class members of the pro-
fessions, and an expanding managerial sector. This class was far more heterogeneous
than the class it was gradually displacing in economic and political affairs. [] Gradu-
ally the appointments to high political office reflected the social arrival of these new
individuals. They tended to be politically conservative, but theirs was a less rigid con-
servatism than had prevailed for centuries in the Caribbean.” (Meditz, 1987, p.31)
“One group that increasingly won seats in the Assembly was the rising class of mer-
17

chants. These men were now becoming the owners of bankrupt estates. [...] Next were
the powerful attorneys who in addition to being attorneys of the majority of estates
themselves also owned estates themselves. [...] Far from replacing the plantocracy,
these new groups helped strengthen it, for they had invariably bought up bankrupt
estates and could most appropriately be called the new planting interest.” (Brizan,
1984, p.201)
Not only was the elite being churned, it changed its complexion, becoming much more creole,
i.e. composed of members born, raised and resident on the islands. It also became much more
colored, with many new planters whose parents or grandparents had been slaves (Lowes (1994),
Craig-James (2000, p.199-201), Lewis (2004, p.67)). A contemporary account lamented
“the English of those islands are melting away. That is a fact to which it is idle to try
to shut our eyes. Families who have been for generations on the soil are selling their
estates everywhere and are going off. Lands once under high cultivation are lapsing
into jungle . . . The white is relatively disappearing, the black is growing; this is the fact
with which we have to deal.” (Froude, 1888, ch.XVII)
There is no disputing the fact that the colored and black citizens had already been gaining
political and economic influence in the years 1835–1853. For example, Lewis (2004, p.67) states
that
“a brief generation after Emancipation both black and coloured men had obtained po-
sitions of prominence, not only as merchants and property owners but also in the pro-
fessions.”
However, it was the sudden creolization of the planters after 1854 that tipped the balance.
“During the late 1850s, in fact, the white, non-Jewish core of the Planter party would
decline to as few as seven members, thus becoming a minority within their own party.
Ironically, the Planter party’s thinning ranks would be filled out thereafter by Afro-
Jamaican and Jewish representatives. ” (Holt, 1991, p.223)
It was only when long-established planter families sold their estates and left the islands en masse,
that the monolithic nature of the planter elite eroded, and old elites could no longer co-opt new
18

planters fast enough to maintain the existing equilibrium. Brizan (1984, p.201–202) states that
“especially after 1850, the vacuum created by the exodus of White planters was now being filled
by the rich Coloreds.”
Relations between New Elites, Old Elites and Citizenry:
In the model, whether new elites can be co-opted depends on the alignment of their economic
interests with the old elites and on the need to maintain legitimacy with the citizenry on the other
hand. The general impression one gets of the Caribbean in the mid-19th century is that new elites
were co-opted to a large extent, at least before the EEA. Green (1991, p.296) writes about the entire
Caribbean at this time,
“Although whites continued to dominate society in most colonies, the rigid barriers
that had divided them from coloured people were eroded in the free period. In Do-
minica and Montserrat coloured men quickly assumed a dominant role in the legis-
lature. They were a powerful element in Jamaica. [...] Increasingly, men of colour
acquired plantation property. They held most clerkships, assumed an important place
in the professions, and by the end of our period they dominated the lower and mid-
ranking government positions in many colonies. In numbers they constituted the
largest segment of the European culture group.”
Lewis (2004, p.67) goes even further, concluding not only that “effective leadership [of the West In-
dies] passed increasingly to the coloured intermediate group” but also that “they were the carriers
of the ‘white bias’.”
However, accounts from different islands do straddle the spectrum between no co-option and
full co-option. In Dominica, Honychurch (1995, p.69-71) speaks of “two unofficial parties,” with
the “Mulatto ascendancy” firmly in opposition to the white attorneys, and “pressing for legislation
promoting the welfare of the newly liberated citizens of the island.” By contrast, in Tobago the
description of politics rings of a fully co-opted black and colored elite:
“The planter/merchant oligarchy was, over time, no longer almost exclusively white.
[...] The whites and coloreds in the dominant class had ties of kinship, friendship, inter-
ests and predicaments. The members of the dominant class including the most estab-
19
lished of the black planters, attended the governor’s balls, their wives and daughters
pillars of the Church of England” (Craig-James, 2000, p199-201)
In fact, Craig-James (2000, p.199-215) gives many examples of successful black and colored planters
in Tobago. Jamaica, with the largest and most diverse economy, fell in the middle, coloreds with
plantation interests siding with the planters and white merchants without plantation interests sid-
ing against planters.
“In describing these various elections I have noticed the colours of the candidates,
but I ought to add that in no instance has the contest appeared to be between colours
. . . Party contests are now between those who advocate the supremacy of the upper
classes and those who strive for their own advancement on the basis of popular repre-
sentation; [that is, between] those who desire the rule of the few or the upper classes,
and those who advocate the influence of the many or the lower classes.” (Charles M.
Metcalfe to Edward G. Stanley, 9 February 1842, in Holt, 1991, p.214)
Regime Change: The new planter elites faced several tensions between their economic in-
terests and social pressures they were exposed to: One problem the new planters faced was that
they took over estates that had often been abandoned and consequently squatted on. New owners
found the eviction of squatters from their newly acquired grounds to be highly acrimonious (Holt
(1991, p.115,122,267-269)). Another problem new elites faces was in voting for the sort of coercive
legislation described in the beginning.
The model suggest that co-option becomes very costly for old elites when there are too many
new elites that need to be co-opted. When co-option becomes too costly, three things can happen.
One is that a country enters a path of democratic transition where new elites are not co-opted,
vote in favor of the citizenry, and full democracy is implemented. This did not happen in the
Caribbean. A second possibility is costly repression. This is likely the case of the U.S. South.
However, in the Caribbean, repression was too costly. Whereas in the South a “black county” may
have been 50 % black all of the Caribbean plantation colonies were more than 90 % black. The
Caribbean thus lacked the white manpower for an equivalent of the Ku Klux Klan.
The third possibility is to cede power to an outside force that will chose policies that are some-
where between the old elites’ and the citizenry’s preferred choices. This is what happened in the
20

Caribbean.17 From 1854 to 1877, 10 of the 11 Caribbean parliaments simply abolished themselves.
Parliament would vote on a bill to abolish parliament and invite the Crown to write a new consti-
tution for the colony. In all cases, this new constitution followed the standard template of Crown
Colony rule: All functions of government were controlled by the colonial administration, with the
governor appointing the local legislature and judiciary. Locally elected parliament was replaced
with a legislature that consisted partly of colonial officials and partly of local appointees. His-
torians have argued that this voluntary dismantling of Caribbean parliaments was planter elites’
response to the political competition of freedmen: While they had traditionally “jealously guarded
[the assemblies] against interference by the colonial adminstration” Wrong (1923, p. 70)), Lowes
(1994, p. 35) argues that this tradition was overcome because
“in the end, the demand of an increasingly restive nonwhite middle class for a voice in
island affairs proved the greater fear and they voted themselves out of office,”
and Ashdown (1979, p. 34) concludes that
“the colonies gave up their elected assemblies voluntarily, for in most cases the white,
privileged classes preferred direct imperial government to the government of the col-
ored classes who were slowly obtaining greater representation in the legislative coun-
cils.”
Who Supported Regime Change? In the model, a new elite that in equilibrium maintains its
legitimacy will not support regime change, because it will share in the spoils of a successful revolt
when it occurs. With legitimate new elites, regime change will thus only be initiated by the old
elite. If, however, the new elite lets itself be co-opted, it will not share in the spoils of revolution,
and thus, if there is an exogenous increase in the likelihood of a successful revolt, the new elite
will then also support regime change. It appears that in many places, the new elite was co-opted
and did support regime change, because ““they felt just as threatened by mob violence as the
whites” (Green, 1991, p.296). (Green, 1991, p.296) and (Dookhan, 1977, p.202-205) both tie regime
change in several islands directly to the increasing threat from violent uprisings, with the latter17While the equilibrium path of the post bellum U.S. South may have been primarily one of repression, that of ceding
power to an outside source also occurred: The county government of Dallas County in Alabama asked the governorto dissolve it when a black majority was looming in 1880, and the county government was not reestablished until 1900(Kousser (1999)).
21

stating that “it was probably hoped that Crown Colony Government would preserve the existing
political status quo” (Dookhan, 1977, p.202-205).
Caribbean historians’ accounts rarely expand on the exact details of how regime change came
to pass. One notable exception is Honychurch (1995, p.69-71), whose account of Dominican pol-
itics tells a cloak and dagger story of regime change that was pushed through overnight and
against strong opposition from parts of the Assembly. This is interesting because Dominica ap-
pears to have been a place where the new elites were not co-opted into the plantocracy. Grenada
is another place where new elites appear not to have been co-opted to a large extent.18 Unfortu-
nately, (Brizan, 1984), who offers the most detailed historical account of Grenada’s politics, falls
very flat when it comes to the circumstances of regime change. However, the Minutes of Grenada’s
Assembly – See Online Appendix A.2 on the different islands’ Assembly Minutes – offer some in-
sight: On September 15th 1875, the day that An Act to Amend and Simplify the Legislature of the
Island of Grenada came to a vote, an amendment was introduced by a faction of the Assembly to
rename the bill into An Act to diminish the rights of the people in electing, from their own body, fit and
proper representatives, and to lay oppressive taxation on every side. The Assembly minutes make no
further comment on this proposed amendment, but it clearly shows that Grenada’s elites did not
uniformly support regime change.
Regime Change Evaluated: In the model, power is ceded to an outside force that will chose
policies that are somewhere between the old elites’ and the citizenry’s preferred choices. Is this
an accurate description of the Crown? Primary accounts contrasting the freedmen’s fortunes in
the initial Crown colonies of St. Lucia Trinidad and Guyana to those in the other 11, suggest that
policies in the Crown colonies were more favorable to the ex-slaves. Dookhan (1977, p. 70) writes
that “in Trinidad, the Crown disallowed attempts [by planters] to forbid immigrants from leaving
the estates” and that public goods provision was generally seen as superior, financed by more
progressive taxation. This is echoed in Rogers (1970, p. 96). Thus, the Crown indeed appears to
have chosen policies that were somewhat more beneficial to the freedmen. However, while Crown
Rule may have been more beneficial for the citizens in the three colonies that that always had it
from the beginning, the endogenous introduction of Crown rule, initiated and controlled by the
18Lowenthal contrasts St. Vincent which he thinks had “the most regressive plantocracy” of the Caribbean to Grenadawith its “progressive and energetic peasantry” (Richardson, 1997, Foreword).
22
elites, could be expected to yield results more favorable to elites. Indeed, McDonald (1991) argues
that after Crown Rule was introduced in Jamaica
“the subsequent two decades witnessed changes in economic conditions and govern-
mental policies that caused land consolidation and the consequent progressive demise
of small landholders”
and (Craton, 1988, p. 165) notes how
“throughout the 19th century, each major inquiry [by English Parliament] into the
British West Indies noted with amazement that nothing had been changed since the
last report”.
Alternative Reasons for Regime Change: The Crown was clearly dissatisfied with the way
local elites ran its colonies, and sought more control over them. Henry Taylor, the colonial office’s
supervisor of West Indian affairs, publicly chastised the assemblies for being “eminently disqual-
ified for the great task of educating and improving a people newly born to freedom” (Wrong
(1923)). However, the Crown was not willing to unilaterally impose Crown Rule, and in the end,
the Abolition of parliaments was everywhere locally initiated. In online appendix section Online
Appendix C, we provide extracts from the several colonies’ Assembly Minutes that describe in
detail how the constitutional changes came about. That evidence shows clearly that while the
Crown probably did put added pressure for direct rule on places where elites were more under
more threat, it simply seized upon the increasing demand by the elites for protection that existed
in those places.
Our focus is on old elites trying to co-opt new elites, and we think of the EEA as an exogenous
increase in the presence of new elites, which need to maintain legitimacy with the citizenry. While
we can document this sudden influx of new members to the elite, we also want to rule out that the
EEA simply caused an expansion of the franchise and thus an increase in the citizenry’s influence
more directly.19 We are not concerned about this because the EEA very clearly distributed land
from planters to planters, i.e. there was no expansion of smallholding emanating from the EEA
19This distinction between an exogenous increase in the citizenry’s power, as opposed to an exogenous increase inthe representation of new elites that need to maintain legitimacy with the citizenry, may seem subtle. We believe it isimportant because the power of the citizenry and the power of new elites may move independently of each other.
23
(Cust (1859), Crossman and Baden-Powell (1884)). Craig-James (2000, Table 4.10) shows that less
than 1% of EEA sales ended up in smallholders’ hands. To the extent that we see the franchise
increasing after the EEA in section 4, we think of this as an outcome of the changing nature of
the elite rather than the other way around. In particular, we think the expanding franchise was
due primarily to less coercion at the poll booth than it was to an actual expansion of smallholds
above 10 acres. An example of the coercion that may have relaxed after 1854 is poll taxes, which
according to Holt (1991, p.254-256, 258, 274) were often used to discourage people to register to
vote. As a result, Holt (1991, p.254) argues that in Jamaica, voter lists did not expand at all in
the 1840s despite the fact that there was a “spectacular growth in the extent of smallholding after
1838” (Higman (2001)).
4 Macro Evidence
Core to our analysis is political competition between old and new elites. We want to test whether
the entry of new elites perturbs the political equilibrium in the way our model predicts. Ideally,
we would like to be able to assign to each representative a label of belonging to either old or
new elites, and to measure directly the entry of new elites. Unfortunately, to measure entry, we
need to accurately measure the stock of established elite families, and this means we need a long
prior history. The Blue Books, our main data source, do not provide this because they only started
reporting on assemblies around the mid-1830s. Because we cannot measure the entry of new elites
anywhere else, we instead focus on electoral turnover, defined as the share of politicians who get
replaced from one electoral cycle to the next. Fortunately, for Jamaica only, these data exist in a
complete history of Jamaica’s parliament Roby (1831). Electoral turnover is an imperfect proxy for
the entry of new elites,20 but with the data in Roby (1831) we can at least verify that it is a proxy.
We construct as the stock of Jamaica’s elites a list of all families that were represented in Jamaica’s
Assembly from its inception in 1660 until 1800, and then verify in the 14 elections that happened
from 1800 to the introduction of Crown Rule in 1865 that there is a strong positive relationship
between turnover and entry. Column 3 in Table 2 shows that this is the case.
20On the one hand, some turnover within the elite is likely. On the other hand, an increase in political competitioncould take the form of a one-time permanent entry of competitors into politics, followed by limited subsequent electoralturnover.
24

We also relate electoral turnover to the franchise, i.e. the number of registered voters per capita.
The data on the franchise is not well for our main purpose of testing whether the entry of new
elites perturbs the political equilibrium in the way our model predicts. There are two reasons.
One, the franchise is a more direct proxy for the empowerment of the citizenry which is related
but not the same as the entry of new elites. Two, franchise data was only reported after 1854,
which means we cannot test what effect the introduction of the EEA in 1854 had and it generally
leaves us with time series that are too short to relate explain the timing of regime change at the
colony level. What is nice, however, is that the franchise data, like the electoral turnover data, can
be coded up at the sub-colony parish level, which increases the cross-sectional sample size to over
100, and gives us enough statistical power to test for a partial correlation between the franchise
and electoral turnover at the parish level.
There is a two-way relationship between the empowerment of new elites and the citizenry.
Increased entry by new elites – the focus of our model – will increase the franchise if new elites
relax coercion at the voting booth and registrar’s office. On the other hand, an exogenous increase
in citizen voters will lead to increased entry by new elites. A correlation between the two provides
may therefore be evidence of either channel. Testing for it is therefore a consistency check rather
than conclusive evidence for our story. In correlating franchise and electoral turnover at the parish
level, we can compare data within parishes over time or within a colony (and electoral cycle)
across parishes. The following regression nests both comparisons:
electoral turnoverip,el−cycle = γlog(reg. voters)ip,el−cycle + ϕip + φel−cycle + εipt, (2)
where φel−cycle are colony-specific electoral-cycle fixed effects and ϕip are fixed effects for parish
p in colony i. Colony-specific electoral-cycle fixed effects are more conservative than colony fixed
effects because they imply a comparison of parishes across a given colony only within the same
electoral cycle. Columns 1 and 2 in Table 2 show that electoral turnover and the franchise are sig-
nificantly positively correlated, whether we compare only within-parish over time in column 1 or
within-parish over time and across parishes within a colony in column 2. Electoral turnover takes
values between 0 and 1 so the estimates say that 10 percentage-points higher electoral turnover is
associated with a 1.5% to 3% higher number of voters.
25

Table 2: Entry of New Elites, Electoral Turnover, and the Franchise
Dependent: log(reg. voters/population) Number of political newcomersin one electoral cycle in Jamaica
(1) (2) (3)
Elect.Turnover 0.258*** 0.137** 28.770***(2.646) (2.164) (3.245)
Unit of observation parish-year parish-year Jamaican elections 1800-1865fixed effects: parish parish & el.cycle
Observations 1,363 1,363 14R2 0.891 0.948 0.467Note:Thistablesvalidateelectoralturnoverasameasureofpoliticalcompetition,usingtwoadditionaldata‐sources.Incolumns1‐2,electoralturnoverisrelatedtothefranchise(percapitaregisteredvoters)attheparishlevel,fromthe BlueBooks.10%‐pointshigherelectoralturnoverisassociatedwitha1.5%‐3%highernumberofvoters(Thefranchise‐datawasreportedonlyafter1854,socannotbeusedtoexplainregimechangesatthecolonylevel.)Column3usesRoby's(1831)historyofJamaicanparliamenttorelatethenumberofnamesthatappearedforthefirsttimeevertoelectoralturnoverinthatelectoralcycle.10%‐pointshigherelectoralturnoverisassociatedwiththeentranceof3newpoliticalfamilies.(Thismeasureofentranceintopoliticsrequiresdataonthefullpreviouspoliticalhistory,onlyavailableforJamaica.)Incolumns1‐2,s.e.aretwo‐wayclusteredattheparishandthecolony‐electoralcyclelevel.InColumn3,s.e.arenotclustered.
Notes: In columns 1 - 2, electoral turnover is related to the franchise (per capita registered voters) at the parish level,from the Blue Books. 10 %-points higher electoral turnover is associated with a 1.5% - 3% higher number of voters.Causality runs both ways, and this result is a consistency check rather than a test of our model. See discussion in text.Our ideal measure would be the entry of new elites. We have this for only Jamcaica from Roby (1831), which we codedup for this table. Column 3 tests whether electoral turnover is a good proxy for our ideal measure, the entry of new elites.In columns 1 - 2, s.e. are two-way clustered at the parish and the colony-electoral cycle level. In Column 3, s.e. are notclustered.
Having established that electoral turnover passes these basic tests as a proxy for the entry by
new elites, we now ask whether changes in electoral turnover explain the timing of regime change,
as our model suggests. Figure 1 plots the raw electoral turnover data leading up to constitutional
changes. Noteworthy variation exists both in the cross-section and in the time-series. In the cross-
section, consider the contrast between the Virgin Islands, the first switcher, and Barbados, the
only colony that never switched. In Barbados, turnover was below 40 percent in every one of
its elections. By contrast, in the Virgin Islands, turnover was above 40 percent in every one of
its elections. In the time-series, electoral turnover was generally trending up before the regime
switches. There are some instances, such as in Dominica and Grenada, where the regime switch
followed a rapid increase, and some, such as in Dominica and Grenada, where the increase was
more gradual.
Moving beyond the visual evidence in Figure 1, we turn to regressions to ask whether the
instance and timing of the regime changes can be explained by electoral turnover. XXX
Because there is considerable variation in electoral turnover both across colonies and within
colonies over time, we estimate the effect of electoral turnover on regime change both in a pooled
cross section specification and in panel specifications. Remarkably, the estimated effect is practi-
cally identical in both specifications. A 10 % increase in electoral turnover raises the probability
26

Figure 1: Constitutional Change and Electoral Turnover
that a parliament voted to abolish itself by 2 % in a given year. To address the possibility that
omitted factors that correlate with electoral turnover are driving the differential timing of regime
switches, we control directly for a number of potential confounding drivers of regime change. We
first control for the possibility that colonies learned from each others’ actions by including the
stock of colonies that had already abolished their parliaments. We then control for increased at-
tractiveness of the regime change after the colonial administration put down the Indian Mutiny
in 1857, which signalled a willingness to put down local peasant uprisings. Finally, we control
flexibly for linear trends and year fixed effects. The results are robust to all these specifications.
To test the hypothesis that regime changes were a defensive move by elites to try and protect
their status, we regress
Regime Switchit = βpolitical competitionit + φi + φt + εit, (3)
where the dependent Regime Switchit takes value 1 in the year when the switch occurs and value
27

Table 3: Regime-Change and Electoral TurnoverPanel A: Does Electoral Turnover Explain Regime Change?
(1) (2) (3) (4) (5)
Electoral Turnover 0.189*** 0.215*** 0.221*** 0.210*** 0.202***(3.397) (4.223) (3.940) (4.580) (4.316)
R 2 0.038 0.073 0.074 0.078 0.048Panel B: Does Electoral Turnover Explain Regime Change, with Colony Fixed Effects?
Electoral Turnover 0.277*** 0.229** 0.237** 0.241** 0.220**(3.234) (2.534) (2.784) (2.946) (2.519)
R 2 0.051 0.089 0.094 0.088 0.267Controls: year No.(Switched) D(post-1857) year-FENote:Thistablereportsonregressionsofregimechangesonelectoralturnoverinapanel.Thedataisorganizedasduration‐data,i.e.eachcolony'stime‐seriesisaseriesof0sendinginasingle1.Intuitively,theduration‐setupischosenbecauseregimechangesare"absorbing,"i.e.thereisnoswitchingbackfromautocracy.Mechanically,theduration‐setupisnecessary,becausetheregressor,electoralturnover,isnotdefinedaftertheregimechange.PanelAreportscoefficientsforOLSwithdifferentcontrols,PanelBalsoincludescolonyfixedeffects,whichwashoutanydifferencesinaverageelectoralturnoverinFigure1.Overall,10percentage‐pointhigherelectoralturnoverleadstoa2%(0.189*0.1)higherprobabilityofabolishingparliamentinagivenyear.N=337inallcolumns,alls.e.areclusteredatthelevelofacolony‐level.
Notes: This table reports on regressions of regime changes on electoral turnover in a panel. The data is organized asduration-data, i.e. each colony’s time-series is a series of 0s ending in a single 1. Intuitively, the duration-setup is chosenbecause regime changes are ”absorbing,” i.e. there is no turning back once an Assembly was abolished. Mechanically,the duration-setup is necessary, because the regressor, electoral turnover, is not defined after the regime change. PanelA reports coefficients for OLS with different controls, Panel B also includes colony fixed effects, which wash out anydifferences in average electoral turnover in Figure 1. Overall, 10 percentage-point higher electoral turnover leads to a2% (0.189*0.1) higher probability of abolishing parliament in a given year. N = 337 in all columns, all s.e. are clusteredat the level of a colony-level.
0 in all years before then.21 Political competition is measured by electoral turnover, φi are colony
fixed effects, and φt measures a time-trend in several different ways across specifications. Because
Figure 1 displayed both considerable cross-sectional and time-series variation in electoral compe-
tition, we separately report pooled cross-sectional results (without φi) in table 4, and fixed-effects
results in table 5.
Panel A of table 3 reports the results of the pooled cross-sectional specification. Column 1
suggests that 10 percentage-points higher electoral turnover at the previous election is associated
with about a 2 % (0.189*0.1) higher probability of abolishing elected parliament in a given year.
In columns 2 to 5, we address the possibility that these results are biased by time-variant forces
that drive the probability of regime change and correlate with political competition. In column 2,
we simply include a common linear trend. In column 3, we control for a peer effect, with regime
change in one colony triggering change in the neighboring colonies, by including the number
of already transitioned colonies. Another possibility is that over time, switching to Crown rule
became more attractive for other reasons. For example, the violent suppression of the Indian
Mutiny of 1857 demonstrated to local colonial elites that the colonial administration could be
21With duration data, the data ends in a single 1 for each colony that abolished its Assembly.
28

counted on to suppress local rebellions. (Burroughs (1999, p. 181)).22 In column 4, we therefore
control for a post-1857 indicator. Finally, in column 5, we include year fixed effects. The results
appear overall robust to the inclusion of all of these controls.
Panel B of table 3 replicates these results with fixed effects, i.e., using identifying only off
within-colony variation. The coefficient estimates are remarkably stable across the two panels.
All regressions in table 3 are clustered at the colony level. Ordinarily, when the number of
clusters is as low as 12, standard clustering can underestimate the true standard errors. A wild
bootstrap is the appropriate way to address this and wild-bootstrapped p-values can be consid-
erably larger than the standard ones (Cameron and Miller (2013)). However, in the duration data
setup here, which is naturally characterized by long series of 0s which end in a single 1, this turns
out not to be the case. The p-values corresponding to the colony-clustered standard errors in col-
umn 5 of tables 4 and 5 are, respectively, 0.001 and 0.029. The p-values for the wild bootstrap for
those same two regressions are both smaller; 0.000 and 0.016 respectively.23
Because we hypothesize a causal link from electoral turnover to the probability of regime
change, we also explore sources of exogenous variation underlying the panel-variation in elec-
toral turnover. The historical record suggests that the exogenous introduction of the Caribbean
Encumbered Estate Act (EEA), which facilitated the sale of bankrupt plantation land, strongly
increased political competition by increasing land transactions, and that it did so differentially de-
pending on local conditions that determined plantations’ profitability. Consistent with this, we
find that the introduction of the EEA raised both electoral turnover and the probability of regime
change, but that it did so significantly less where local conditions meant plantations were more
profitable. Pushing the identifying assumptions a bit further by assuming that the introduction
of the EEA, interacted with local conditions, influenced regime change only through its effect on
electoral turnover, we also present instrumental variable (IV) estimates of the effect of electoral
turnover on regime change. The IV estimates broadly confirm the baseline results, although they
are larger, suggesting that when electoral turnover exogenously increased by 10 %, the probability
22Since the Crown could impose abolition on the Caribbean colonies, it is reasonable to ask why it could not imposeCrown rule. The historical record suggests it was simply not important enough and that the demonstrated willingnessof Caribbean assemblies to bring the local political process to a halt made colonial administrators unwilling to forceCrown rule onto the Caribbean colonies (Wrong (1923)).
23A p-value of 0.000 means that there was not a single bootstrap-draw for which the “wild t-statistic” exceeded thestandard t-statistic reported in tables 4 and 5. (I used 1000 draws, but larger numbers of draws equally generated ap-value of 0.000.
29

that parliament voted to abolish itself was between 4 and 15 % larger in a given year.
To strengthen the claim of a causal link between electoral turnover and the probability of
regime change, we next explore the underlying causes of the panel-variation in electoral turnover,
that drives the results in table 3. This paper’s argument is that the increase in political competition
– measured by electoral turnover – was linked to freedmen being increasingly successful at getting
their votes registered, and, further, that the degree to which political competition increased was
determined by how easily freedmen could obtain the land needed to register their vote. Based
on this causal chain, the evidence indicates that the introduction of the Caribbean Encumbered
Estate Act (EEA) was an exogenous shock that increased political competition by increasing land
transactions (Lowes (1994)).
The historical record further suggests the differential impact of the EEA on different islands as
an underlying driver of the differential increase in electoral competition. Before the EEA was im-
plemented across the Caribbean in 1854, many estates were already bankrupt because of increased
labor costs imposed by abolition. However, until then, a bankrupt plantation’s debt was insep-
arable from its owner’s other assets. If an estate was worth 20,000 pounds but indebted to the
amount of 30,000, its owner still had to cover the remainder after the estate’s sale. Consequently,
many estate owners held on to their bankrupt estates, and, while there was pervasive squatting
by freedmen on abandoned plantations, this did not give the legal title required for registering
a vote. The EEA resolved this bottleneck by clearing estates’ owners of any remaining liabilities
after selling encumbered estates.24 However, this effect of the EEA varied by islands, its impact
depending largely on the profitability of estates. Where plantations remained profitable after abo-
lition, the EEA had little impact (Lowes (1994)). The key cross-sectional characteristic which de-
termined plantations’ profitability was the cost of labor, which in turn depended on freedmen’s
options outside of estate work. Where there was little land, there were limited outside options,
labor remained cheap and estates profitable (Dippel et al. (2015)).25 The importance of density is
well-illustrated by the case of Barbados. Barbados was the only one of the 12 Caribbean plantation
colonies that did not abolish its parliament, it had the lowest average electoral turnover of all the
24Essentially the same legal arrangement as in those U.S. states that have “non-recourse” bankruptcy laws today.25Dippel et al. (2015) study Caribbean labor markets. They provide a model of coercion in which plantation workers’
outside options and plantations’ profitability a jointly determined by underlying geographic factors, and they providedetailed historical accounts of the functioning of these labor markets and the Caribbean plantations.
30

Table 4: Exogenous Variation Underlying the Changes in Electoral Turnover and Political Regime(1) (2) (3) (4) (5) (6) (7) (8) (9) (10)
Panel A: The "Reduced Form": Did the EEA Cause Regime Change (but less where elites had more control)?
D(EEA) 0.098*** 0.062 0.080** 0.06 0.100** 0.108*** 0.063 0.086* 0.063 0.141***(5.256) (1.772) (2.647) (1.757) (2.305) (4.493) (1.379) (2.149) (1.602) (3.464)
D(EEA)*1836-density -0.039*** -0.055*** -0.061*** -0.043*** -0.045** -0.041** -0.061*** -0.069*** -0.046** -0.054*(-3.469) (-5.631) (-4.774) (-3.474) (-2.305) (-2.604) (-4.089) (-3.716) (-2.651) (-2.052)
R 2 0.052 0.068 0.077 0.061 0.242 0.059 0.076 0.090 0.069 0.254
Panel B: The "First Stage": Did the IEA Increase Electoral Turnover (but less where elites had more control)?
D(EEA) 0.057 0.033 0.055 0.046 0.148* 0.047 0.006 0.039 0.009 0.278***(1.326) (0.741) (1.351) (0.928) (1.862) (1.304) (0.128) (1.096) (0.227) (4.566)
D(EEA)*1836-density -0.104*** -0.116*** -0.107*** -0.105*** -0.110*** -0.024 -0.061* -0.044 -0.030 -0.056**(-6.988) (-4.957) (-4.535) (-7.549) (-5.840) (-1.142) (-2.129) (-1.417) (-1.323) (-2.692)
R 2 0.113 0.119 0.114 0.114 0.214 0.488 0.512 0.498 0.496 0.618Panel C: IV estimates
Electoral Turnover 0.376*** 0.491*** 0.570*** 0.409*** 0.408*** 2.303 1.521** 2.079 2.062 1.443**(5.222) (7.526) (6.090) (4.786) (3.612) (1.189) (2.440) (1.630) (1.321) (2.408)
Weak-Instr F-Test 11.74 6.664 4.392 11.06 12.02 1.304 4.533 2.009 1.750 7.248
Controls: yearNo.(Switch
ed)D(post-1857) year-FE year
No.(Switched)
D(post-1857) year-FE
Colony Fixed Effects Yes Yes Yes Yes Yes
Notes: This tables presents the results from the instrumental variable exercise, divided into a ”reduced form” regressionof regime change on the instruments (Panel A), the ”first stage” regression of turnover on the instruments (Panel B),and the IV regression of regime change on instrumented turnover (Panel C). Although the coefficient on ”D(EEA)” isreported as a matter of separate interest, only the interaction term ”D(EEA)*1836-density” is treated as an excludableinstrument in Panel C. The number of observations is 337 in all specifications. All s.e. are clustered at the colony level.
colonies, and it was more than twice as dense as any other Caribbean colony.
Motivated by this background, table 4 shows how the introduction of the EEA related to the
timing and instance of the regime changes, as well as to electoral turnover, and how this relation-
ship depended on density. Across columns, columns 1 – 5 are organized like table 3, incrementally
introducing the same controls, while columns 6 – 10 do the same but further add colony fixed ef-
fects as in Panel B of table 3. In table 4, Panel A reports the effect of D(EEA) (time–varying) and
“D(EEA) · 1836-density” (time-and-colony-varying) on the likelihood of regime change. Panel B
reports the effect of D(EEA) and “D(EEA) · 1836-density” on electoral turnover. If one is will-
ing to assume that D(EEA) and “D(EEA) · 1836-density” impacted regime change only through
their effect on electoral turnover, then one can instrument electoral turnover with D(EEA) and
“D(EEA) · 1836-density.” A somewhat weaker assumption, and the one on which we report here,
is that D(EEA), which is essentially a post-1854 break, may have correlated with other unobserv-
31

able factors influencing regime change, but that the interaction “D(EEA) · 1836-density” impacted
regime change only through electoral turnover. (This implies D(EEA) is treated as a control vari-
able and “D(EEA) · 1836-density” as the instrument.) Under this assumption, we also report IV
results in Panel C of table 4.
Panel A shows that the introduction of the EEA was indeed associated with a higher probabil-
ity of regime change, and especially so in islands that were less dense, i.e., where more land was
freed up by the EEA. The results for D(EEA) are weakest in columns 4 and 9, which allows for a
trend break after the Indian Mutiny. This is not surprising because columns 4 and 9 amount to
a “horserace” between a post-1854 and a post-1857 indicator. Overall, more credence should be
given to the interactions term “D(EEA) · 1836-density,” which remains significant to all specifica-
tions. Panel B shows that the introduction of the EEA was also associated with higher electoral
turnover, although these results are not very strong with colony fixed effects. The IV results in
panel C also broadly confirm the previous results, although the results with colony fixed effects
are again much weaker. While the IV results should be taken with a grain of salt because of the
relatively strong assumptions needed to interpret them literally, it is worth noting that the IV
results are about twice as large as those in table 3, suggesting that 10 percentage-points higher
electoral turnover increased the likelihood of abolishing parliament by between 4 and 20 % in a
given year. A plausible interpretation of these larger IV estimates is that the IV better isolates the
part of electoral turnover that truly represents political competition.
Overall, the results in all three panels of table 4 are consistent with the logic of the paper’s argu-
ment that increasing electoral turnover caused preemptive regime changes, and with the historical
record which suggests that the rate at which electoral turnover increased depended at least in part
on external factors like changing legal conditions and their interaction with islands’ geography.
5 Micro Evidence
We use the observations in section 4 as a springboard into our core empirics, which are based on
micro-evidence on the families that formed the political and economic elite:
1. Using a collection of 76 plantation surveys of the 14 colonies at different times between 1815–
1891, laboriously assembled from 48 separate sources, we show that turnover in plantation
32

ownership increased dramatically after the 1854 passing of the EEA.
2. Combining the plantation data with the politician data, the paper further shows that (a)
planters continued to completely dominate the assemblies in the early years after abolition,
(b) that this dominance slowly declined thereafter, and (c) that the biggest change after 1854
was not a decline in the planters’ representation in the assemblies, but in their identity, as
long-established planter families disappeared.
3. Using a complete history of Jamaica’s parliament from 1640–1836, the only instance where
consistent data exists on assembly membership before 1836, we show that particularly the
most established planter disappeared from Jamaican politics after 1854.
4. We provide a detailed comparison between politics in Jamaica and Barbados. These were
economically the two most important islands. In addition, Barbados was the island where
turnover in plantation ownership was lowest, and the only island that never abolished its
parliament. We show that in both islands the voting network early on consisted of a single
network, which largely voted in favor of planter issues. In Barbados this remained true
after. In Jamaica by contrast, a second voting bloc emerged, which represented non-planter
interests. In other words, the voting network in Jamaica became partisan, or characterized
by ‘homophily’
5. For only Jamaica, we also know the race and profession of all parliamentarians. We show
that many of the colored new members of Jamaica’s assembly – and all those colored mem-
bers that were planters – voted consistently in the planter bloc against smallholder interest;
i.e. it was economics and not race that determined voting behavior. Lastly, while the size
of the planter faction declined only marginally after 1854, its voting coherence as a political
bloc declined very markedly.
6 Discussion & Conclusion
References
Acemoglu, D. and J. Robinson (2000). Why did the West Extend the Franchise? Democracy, In-equality, and Growth in Historical Perspective. Quarterly Journal of Economics 115(4), 1167–1199.
33

Acemoglu, D. and J. Robinson (2001). A Theory of Political Transitions. The American EconomicReview 91(4), 938–963.
Acemoglu, D. and J. Robinson (2006a). De facto Political Power and Institutional Persistence.American Economic Review Papers and Proceedings 96(2), 325–330.
Acemoglu, D. and J. Robinson (2006b). Economic Origins of Dictatorship and Democracy. CambridgeUniversity Press.
Acemoglu, D. and J. Robinson (2008). Persistence of Power, Elites, and Institutions. AmericanEconomic Review 98(1), 267–293.
Acemoglu, D. and A. Wolitzky (2011). The Economics of Labor Coercion. Econometrica 79(2),555–600.
Ashdown, P. (1979). Caribbean History in Maps. Addison-Wesley Longman Ltd.
Beachey, R. (1978). The British West Indies Sugar Industry in the Late 19th Century. Greenwood Press.
Besley, T. and A. Case (1995). Does Electoral Accountability Affect Economic Policy Choices?Evidence from Gubernatorial Term Limits. The Quarterly Journal of Economics 110(3), 769–798.
Besley, T., T. Persson, and M. Reynal-Querol (2012). Political Instability and Institutional Reform:Theory and Evidence. London School of Economics (unpublished).
Bobonis, G. and P. Morrow (2014). Labor Coercion and the Accumulation of Human Capital.Conditionally accepted, Journal of Development Economics.
Boix, C. (2003). Democracy and Redistribution. Cambridge University Press.
Bolland, O. (1981). Systems of Domination After Slavery: The Control of Land and Labor in theBritish West Indies after 1838. Comparative Studies in Society and History 23(04), 591–619.
Bourguignon, F. and T. Verdier (2000). Oligarchy, Democracy, Inequality and Growth. Journal ofDevelopment Economics 62(2), 285–313.
Brizan, G. (1984). Grenada, Island of conflict: from Amerindians to People’s Revolution, 1498-1979. ZedBooks London.
Bruckner, M. and A. Ciccone (2011). Rain and the Democratic Window of Opportunity. Economet-rica 79(3), 923–947.
Burroughs, P. (1999). Imperial Institutions and the Government of Empire. The Oxford History ofthe British Empire 3, 170–197.
Cameron, A. C. and D. L. Miller (2013). A Practitioner’s Guide to Cluster-Robust Inference.
Cartwright, J. (1970). Politics in Sierra Leone 1947-67. University of Toronto Press Toronto.
34

Craig-James, S. (2000). The Social and Economic History of Tobago (1838–1990).
Craton, M. (1988). Continuity not Change: the Incidence of Unrest Among Ex-Slaves in the BritishWest Indies, 1838–1876. Slavery & Abolition 9(2), 144–170.
Craton, M. (1997). Empire, Enslavement, and Freedom in the Caribbean. James Currey.
Crossman, C. C. and G. E. M. Baden-Powell (1884). Report on the West Indian Incumbered Estate Act.London: Eyre and Spottiswoode.
Curtin, P. D. (1954, Spring). The British Sugar Duties and West Indian Prosperity. Journal ofEconomic History 14(2), 157–164.
Cust, R. J. E. (1859). A Treatise on the west Indian encumbered estate acts. London: William Amer, LawBookseller.
Deere, N. (1950). The History of Sugar. London: Chapman and Hall.
Dippel, C., A. Greif, and D. Trefler (2015, February). The rents from trade and coercive institutions:Removing the sugar coating. Nber working paper no. 20958.
Dookhan, I. (1977). A Post-Emancipation History of the West Indies. Collins.
Fuller, T. (2014). Thai Army Declares Coup, Citing Need to Reform Nation. New York Times May22nd.
Galloway, J. (2005). The Sugar Cane Industry: An Historical Geography from its Origins to 1914. Cam-bridge Univ Pr.
Green, W. (1991). British Slave Emancipation: the Sugar Colonies and the Great Experiment 1830-1865.Oxford Univ Pr.
Haggard, S. and R. R. Kaufman (1997). The Political Economy of Democratic Transitions. Compar-ative Politics, 263–283.
Haggard, S. and R. R. Kaufman (2012). Inequality and Regime Change: Democratic Transitionsand the Stability of Democratic Rule. American Political Science Review 1(1), 1–22.
Hall, D. (1959). Free Jamaica, 1838-1865: an economic history, Volume 1. Yale University Press.
Hall, D. (1978). The Flight From the Estates Reconsidered: The British West Indies 1838–1842.Journal of Caribbean History 10(11), 7–24.
Higman, B. (1995). Slave Populations of the British Caribbean, 1807-1834. Univ of West Indies Pr.
Higman, B. (2001). Jamaica Surveyed: Plantation Maps and Plans of the Eighteenth and NineteenthCenturies. Univ of West Indies Pr.
35

Higman, B. W. (2000). The Sugar Revolution. Economic History Review 53(2), 213–236.
Holt, T. (1991). The Problem of Freedom: Race, Labor, and Politics in Jamaica and Britain, 1832–1938.The Johns Hopkins University Press.
Honychurch, L. (1995). The Dominica Story: A History of the Island. Macmillan Pub Limited.
Kassimeris, C. (2006). Causes of the 1967 Greek Coup. Democracy and Security 2(1), 61–72.
Kousser, J. (1999). Colorblind Injustice: Minority Voting Rights and the Undoing of the Second Recon-struction. University of North Carolina Press.
Lewis, G. (2004). The growth of the Modern West Indies. Ian Randle Publishers.
Lipset, S. (1959). Some Social Requisites of Democracy: Economic Development and PoliticalLegitimacy. American Political Science Review 53(1), 69–105.
Lizzeri, A. and N. Persico (2004). Why Did the Elites Extend the Suffrage? Democracy and theScope Of Government, with an Application to Britain’s “Age Of Reform”. Quarterly Journal ofEconomics 119(2), 707–765.
Lowes, S. (1994). The Peculiar Class: The Formation, Collapse, and Reformation of the Middle Class inAntigua, West Indies, 1834-1940. Columbia University.
Martin, R. (1839). Statistics of the Colonies of the British Empire.
McDonald, R. A. (1991). Review of “from plots to plantations: Land transactions in jamaica, 1866-1900. by veront m. satchell”. Economic History Review 44(4), 765–766.
McLewin, P. (1987). Power and Economic Change: The Response to Emancipation in Jamaica and BritishGuiana, 1840-1865. Garland.
Meltzer, A. and S. Richard (1981). A Rational Theory of the Size of Government. The Journal ofPolitical Economy, 914–927.
Michels, R. (1911). Political parties: A sociological study of the oligarchical tendencies of modern democ-racy. Reprinted. New York: Free Press, 1962.
Morrell, W. and W. Parker (1969). British Colonial Policy in the Mid-Victorian Age: South Africa, NewZealand, the West Indies. Clarendon P.
Naidu, S. and N. Yuchtman (2013). Coercive Contract Enforcement: Law and the Labor Market inNineteenth Century Industrial Britain. American Economic Review 103(1), 107–44.
North, D. C. and B. R. Weingast (1989). Constitutions and Commitment: the Evolution of In-stitutions Governing Public Choice in Seventeenth-Century England. The journal of economichistory 49(04), 803–832.
36

Przeworski, A., M. Alvarez, J. A. Cheibub, and F. Limongi (2000). Democracy and Development: Po-litical Regimes and Economic Well-Being in the World, 1950-1990. New York: Cambridge UniversityPress.
Richardson, B. (1997). Economy and Environment in the Caribbean: Barbados and the Windwards in theLate 1800s. University Press of Florida.
Riviere, W. (1972). Labour Shortage in the British West Indies after Emancipation. Journal ofCaribbean History 4, 1–130.
Roby, J. (1831). Members of the Assembly of Jamaica from the Institution of that Branch of the Legislatureto the Present Time, Arranged in Parochial Lists. Published by Alex holmes, Montego-bay, Jamaica.
Rogers, H. A. (1970). The Fall of the Old Representative System in the Leeward and Windward Islands,1854-1877. Ph. D. thesis, University of Southern California.
Sewell, W. (1861). The Ordeal of Free Labor in the British West Indies. Harper & brothers.
Taylor, A. (2002). The American Colonies, Volume 1. Penguin Group USA.
Wallace, E. (1977). The British Caribbean from the Decline of Colonialism to the End of Federation.University of Toronto Press.
Wrong, H. (1923). Government of the West Indies. Clarendon Press.
37

Not for Publication
Online Appendix
to
“Elite Competition and the Iron Law of Oligarchy:A Tale of 14 Islands”

Not for Publication
Online Appendix A Data Sources
Online Appendix A.1 The Blue Books
The main data source for this paper are the British Colonial Blue Books, annual statistical accountsthat were sent to London from each individual colony to report on local conditions.26 From 1836,the books’ Councils and Assemblies section reported the names of all local politicians, with elec-tion dates and the parish they represented. Also from 1836, the Comparative Tables of Revenueand Expenditure reported detailed breakdowns of taxation and spending by category, though notby parish. From 1854, the books’ Political Franchise section also reported the number of registeredvoters for the last election by parish.
Online Appendix A.2 Other Colonial Archive Data
For each former colony, The British National Archives maintain 6 data-series:
1. Original correspondence
2. Entry Books
3. Acts
4. Sessional Papers
5. Gazettes
6. Miscellenea
In addition, each colony has a “CO number”. For Tobago for instance, the above corresponds toseries CO 288/285 – CO 288/290. The Blue Books are part of the Miscellenea series, and indeedform the bulk of that series. For the voting data, we collected the Minutes of Assembly for eachcolony. These minutes are part of the Sessional Papers. In many cases, the minutes do not reportactual voting data but in some – including for Barbados and Jamaica – they do.
Online Appendix A.3 Other Sources
26For years before the 1890s, at most two copies exist of each Blue Book, one in the issuing colony’s archives and onein the British National Archives, in London, where this data was hand-collected.
i

Online Appendix A.3 Other Sources Not for Publication
Online Appendix Figure 1: Guyana
Notes: The left panel shows the historical boundaries of Guyana as dashed lines. The panel is from Higman (2000,figure 1.8). The right panel shows the results of geo-coding the map.
Online Appendix Figure 2: The Secular Decline in Sugar Prices (Figure 4 in Dippel et al. (2015))
4.0
4.4
4.8
5.2
5.6
6.0
1838 1853 1868 1883 1898 1913
Log
Pric
e of
Sug
ar
Prefer-ential Tariff phase-
out, 1846-54
Cholera
Beet Bounty, 1884-1903
Notes: This figure plots the log of the London price of sugar. Two events stand out. As part of the repeal of the CornLaws and the move to Free Trade, Britain’s preferential tariff on West Indies sugar was phased out over the period1846–54 (Curtin, 1954). Second, France and Germany subsidized domestic production of beet sugar during 1884–1903,which further drove down sugar prices.
ii

Online Appendix A.3 Other Sources Not for Publication
Online Appendix Figure 3: World Sugar Production by Region and the British West Indies’ Share(Figure 3 in Dippel et al. (2015))
35,000
350,000
3,500,000
1838 1853 1868 1883 1898 1913
Tons
of S
ugar
(Log
Sca
le)
World Cane Sugar
British West Indies Cane Sugar
Beet Sugar
0%
2%
4%
6%
8%
10%
12%
14%
16%
18%
20%
1838 1853 1868 1883 1898 1913 B
WI'
s Sh
are
of W
orld
Sug
ar P
rodu
ctio
n
BWI$Share$of$World$
Notes: The left-hand panel is the log output of sugar (measured in tons) by source: (1) cane sugar grown in our sampleof 14 British West Indies sugar colonies, (2) cane sugar grown worldwide, and (3) beet sugar. The right-hand panel isthe British West Indies’ share of world sugar output i.e., (1) divided by (2)+(3). Data are from Deere (1950).
Online Appendix Figure 4: The Share of Sugar in Total Exports and its Differential Decline (Figure6 in Dippel et al. (2015))
0.0
0.1
0.2
0.3
0.4
0.5
0.6
0.7
0.8
0.9
1.0
1838 1853 1868 1883 1898 1913
Shar
e of
Sug
ar in
Tot
al E
xpor
ts
Antigua Barbados Guyana St. Kitts
Tobago St. Lucia Trinidad
St. Vincent Montserrat
Virgin Is.
Grenada Dominica
Jamaica
Notes: This figure reports the share of sugar in total exports. Nevis is not reported because it stayed between 0.95 and1.00 throughout. Also, Nevis merged with larger St. Kitts in 1883 and Tobago merged with larger Trinidad in 1899.Each series is lowess smoothed. Data are from the Colonial Blue Books.
iii

Not for Publication
Online Appendix B Detailed Account of the Caribbean Incumbered Es-tate Act
Online Appendix C Detailed Description of the Procedures Surround-ing Colonies’ Changing Constitutions
iv

Not for Publication
Online Appendix D Additional Results
First, we show that freedmen had gained real political influence in the lead-up to the regimeswitches. Under the democratic regime, there was a clear electoral cycle in public spending fa-voring the rural poor. In election years, parliaments voted systematically more expenditure oneducation and on a basket of other public goods that freedmen favored but elites did not, relativeto other years in the same electoral cycle.27
Second, we study the effects of abolishing the Assemblies by comparing public expendituresbefore and after the regime switch. Across specifications, spending on education and on otherpublic goods declined with the dismantling of elected parliaments, both in specifications withonly common time-trends (where the control is colonies that had not yet switched), and in spec-ifications with colony-specific time trends (where the control is also each colony’s own counter-factual trend had it not abolished its Assembly). I also investigate more closely the time-path ofpublic expenditure, specifically around the years of regime change. There is some evidence thatpublic-good provision actually increased from one year before to one year after the Assembly’sabolition, perhaps because elites wanted to secure a smooth transition.
Third, I check directly whether elites were able to maintain insider access to the colonial ad-ministration after the regime switch. Two facts are consistent with this insider-access hypothesis:One, old political families continued to hold about 80 % of appointed legislative positions as late as20 years after the regime switch, and two, within each colony, these old families came dispropor-tionately from the plantation parishes.
Online Appendix D.1 Evidence of Political Pressure on Elites in the Lead-Up to theRegime Switch
If political competition from freedmen had real bite, then politicians should have had to cater tofreedmen in election years, leading to electoral cycles (Besley and Case (1995)). The historicalrecord suggests that the interests of the freedmen and the elite were conflicting on several dimen-sions, including taxation sources, land redistribution, and public spending (Holt (1991, ch. 7)). Ifocus on public spending because this is the only one of these dimensions on which there is datain the Blue Books. Two expenditure categories were consistently reported in the Blue Books, andevinced clear conflict between freedmen and planters: spending on education and expendituresrelated to health provision. Both were either irrelevant to the planters or could be provided pri-vately (Lowes (1994)).28 I therefore look for evidence of increased spending on education andhealth-provision in election years, i.e., when politicians had re-election concerns. Specifically, Iestimate
Policiesit = βD(election-year)it + γXit + φel−cycle + εit, (4)
where φel−cycle is a fixed effect for an electoral cycle in a colony so that the effect of an election yearis identified only relative to other years in the same electoral cycle.
Table 1 reports the results of this estimating specification (4). Columns 1 through 3 reporton educational expenditure and columns 4 through 6 on expenditure for health provision. Thefirst column includes only colony-electoral-cycle fixed effects, i.e., each electoral cycle is colony-specific. The second column also controls for more high-frequency variation in total expenditure.
27Educational expenditure was the expenditure category that was most consistently available. The basket of otherpublic goods contains all public goods associated with public health. On both dimensions, the interests of freedmenand planter elites diverged strongly.
28The children of the Caribbean great planters were almost always educated in England, and even their wives fre-quently lived there (Lowes (1994)).
v

Online Appendix D.2 The Consequences of Regime Change Not for Publication
Online Appendix Table 1: Electoral Cycles: Did Elites Cater to Freedmen at Election Time?
Dependent: log(educational expenditure) log(sanitation & health expenditure)
(1) (2) (3) (4) (5) (6)
D(electoral year) 0.200** 0.184** 0.174** 0.224** 0.210** 0.180**(2.283) (2.263) (2.057) (2.617) (2.470) (1.992)
log(total exp) 0.830** 0.675* 0.387* 0.288(2.447) (1.864) (1.802) (1.301)
Fixed Effects decade decade
Observations 172 172 172 243 243 243Note:Allspecificationsincludecolony‐electoral‐cyclefixedeffectssothattheelection‐yeareffectisidentififedrelativetotherestoftheelectoralcycle.Reportedregresssionsuseonlythedatabeforetheswitchsincetherearenoelectionsafter.D(electoralyear)equals1onlyintheyearbeforetheelection.Thenumberofobservationsislessthanfortheregressionsrelatinginstitutionalchangetopolitcialcompetition,becausetheTablesofRevenueandExpendituredidnotreportfinecategoriesintheearlyyears.
Notes: All specifications include colony-electoral-cycle fixed effects so that the election-year effect is identified relativeto the rest of the electoral cycle. Reported regressions use only the data before the switch since there are no electionsafter. D(electoral year) equals 1 only in the year before the election. The number of observations is less than for theregressions relating institutional change to political competition, because the Tables of Revenue and Expenditure didnot report fine categories in the early years.
The third column also adds decade fixed effects to further controls for any broad shifts in publicspending. There is consistent evidence for the existence of an electoral cycle. Within an electoralcycle, politicians spent about 20 % more on both categories in election years. This evidence sug-gests that the freedmen were a political force to be reckoned with in the period after abolitionand leading up to the regime changes. Because specification (4) uses within-electoral-cycle varia-tion, as opposed to within-colony, standard errors should be clustered at the electoral-cycle level.And with 163 electoral cycles in the data, there should not be an issue with the asymptotics ofclustering (Cameron and Miller (2013)). Indeed the p-values for wild-bootstrapped standard er-rors (clustered at the colony level), are 0.000 and 0.0033 in columns 2 and 5 respectively.29 This issmaller than the p-values of 0.0266 and 0.0150, obtained with standard clustering at the electoral-cycle level.
Online Appendix D.2 The Consequences of Regime Change
Next, I investigate the consequences of abolishing parliament. Because of the endogeneity of theregime-switch, the time-window just around it is of separate interest here. For example, it ispossible that elites strategically delayed utilizing the regime change in order to secure a smoothtransition to the new regime. To pick up such transition-patterns in addition to the level effect ofCrown Rule, I regress
Policiesit = βCrown Ruleit +2∑
k=−3λkRegime-Switchit+k + φt + θi + εit, (5)
where Policiesit are the two measures of expenditure, on education or health. The main coefficientof interest is on Crown Ruleit, which estimates the permanent effect of the regime switch; it turnsfrom 0 to 1 on the year of the regime change, and stays at 1 afterward.
∑2k=−3 λkRegime-Switchit+k
is a set indicators for the 6 years around the year of the change.30 Lastly, θi are colony fixed effects,
29A p-value of 0.000 means that there was not a single draw in the bootstrap procedure, that generated a t-valueabove the one obtained with standard clustering.
30I show a window of six years because the only significant movement is in the four years around the change, andcoefficients get monotonically less significant away from the regime switch.
vi

Online Appendix D.3 Did Elites Maintain Insider Access Not for Publication
and the counter-factual time-trend φt is modeled with either year fixed effects only or year fixedeffects plus a colony-specific linear trend. Table 2 shows the results of estimating specification(5). The first two columns consider educational expenditure, the next two expenditure on health-provision. All columns include colony and year fixed effects and columns 2 and 4 add colony-specific linear trends. The permanent effect of abolishing parliament appears to have reducededucational expenditure by about 50 percent and reduced expenditure for health-related publicgoods by about 30 percent while the estimates in Table 6 suggest that it increased by about 20percent in an election year.31,32 Overall, the estimates clearly suggest that Crown Rule helped theelites. For the main regressor Crown Ruleit, table 7 also reports p-values for wild-bootstrappedstandard errors in addition to those clustered by colony. Unlike in Table 1 (where the 163 electoralcycles seemed like a more reasonable cluster-dimension) and in tables 4 and 5 (where the datawas set up as duration data), here the wild-bootstrapped p-values are bigger than the conven-tional ones, although the results do remain largely significant at conventional levels. Especiallyin columns 2 and 4, which include colony-specific time trends, the wild bootstrap makes littledifference.
The coefficient-estimates λk are of separate interest from the main result. They display a veryspecific time-path of public-goods provision around the regime change. There was systematicallyhigher expenditure on public goods from about two years before the change to about two yearsafter. These results are more clear for education, but also come close to 10% significance for theother public good category. Educational expenditure, was between 50% and 90% higher in thethree years around the regime switch. This at least strongly suggests that elites strategically de-layed utilizing the regime change in their favor, in order to secure a smooth transition to the newregime.
Online Appendix D.3 Did Elites Maintain Insider Access
A possible explanation for the findings in Table 7 is that the switch to Crown rule shielded elitesfrom popular pressure but in fact preserved their insider access and influence on the colonial ad-ministration’s policies. Since elites’ access would have depended on them actually staffing criticaladministrative positions, I look for direct evidence of this in the data of appointed legislators un-der Crown rule. I link all individuals into families based on last name, and calculate the share ofappointed legislators whose families ever held elected office under the old Assembly system.33 Ipool all appointed legislators into a common appointed legislature defined by event time, i.e. year1 pools the eleven legislatures after each one’s switch to Crown rule. I then calculate the share oflegislators whose families ever held elected office under the old Assembly system.34
Table 3 shows that this share is both very high and very stable over time. Twenty-one years
31This makes sense because educational expenditure was arguably even less in the interest of elites. While there weresome positive externalities from better health even if health was a private good to elites, education have have evenhad negative externalities. An obedient and stable workforce was key for the profitability of elites’ plantations in theCaribbean (Dippel et al. (2015)), and higher education would have raised the outside options of plantation workers, apattern observed in other agricultural labor markets as well (Bobonis and Morrow (2014)).
32Obviously, if expenditure on public goods shrank as a relative share of total expenditure, some other expendituresmust have increased. I found some evidence that aggregate salaries for the civil administrators increased. This isconsistent with anecdotal evidence that black leaders were co-opted by the planters (Honychurch (1995), Brizan (1984)).However, this evidence was weak because aggregate salaries were reported in inconsistent ways across colonies andover time.
33Under Crown rule, legislative chambers were appointed by the governor. Legislators’ names and appointmentdates continued to be reported in the Blue Books.
34A family is specific to a colony in this calculation, although some influential families owned plantations in severalof the colonies (Taylor (2002)).
vii

Online Appendix D.3 Did Elites Maintain Insider Access Not for Publication
Online Appendix Table 2: The Consequences of Regime ChangeDependent: log(educational expenditure) log(sanitation & health expenditure)
(1) (2) (3) (4)
Crown Ruleit -0.546** -0.404** -0.353** -0.379**(-2.877) (-2.241) (-2.260) (-2.221)
p-val [cluster(colony)] [0.045] [0.048] [0.015] [0.046]
p-val [wild bootstrap] [0.084] [0.064] [0.104] [0.046]
regime-switchit-3 -0.104 -0.036 -0.139 -0.203(1.352) (0.371) (0.693) (1.043)
regime-switchit-2 0.241* 0.277 0.185 0.101(1.931) (1.651) (0.955) (0.530)
regime-switchit-1 0.560*** 0.582** 0.248 0.214(3.733) (2.712) (1.367) (0.993)
regime-switchit 0.371 0.566* 0.416 0.39(1.223) (1.974) (1.783) (1.577)
regime-switchit+1 0.825** 0.916** 0.291 0.206(3.045) (2.816) (1.451) (0.988)
regime-switchit+2 0.328 0.332 -0.063 -0.124(1.587) (1.748) (0.602) (1.172)
colony-specific linear trend: Y Y
Observations 494 494 509 509
R 2 0.942 0.951 0.921 0.934
Notes: All regressions control for colony-fixed effects, year fixed effects and a log(total expenditure). The main regressorCrown Ruleit turns to 1 the year of the regime switch and stays at 1 after that; it estimates the one-time level effect of theregime change. Each of the six regime-switch indicators turns to 1 only in a single year (e.g., regime-switch
it−3turns to
1 only in the single year 3 years before the regime switch); they trace out how the dependent changes around the timeof the regime change. The regime-switch indicators show that there was systematically higher expenditure on publicgoods just around the regime switch. Columns 1 and 3 have year fixed effects and columns 2 and 4 add colony-specificlinear trends. Data for the Tables of Revenue and Expenditure runs from 1838 to 1900 for both variables. However, inearly years, education expenditure was often not separately reported so that N is smaller for educational expenditure.All s.e. clustered at the colony-level.
viii

Online Appendix D.3 Did Elites Maintain Insider Access Not for Publication
Online Appendix Table 3: Measured Elite PersistenceYears Since Switch to Autocracy (Crown Rule): 3 6 9 12 18 21
Share Appointees from Elected Families: 87.04 88.33 91.23 91.04 90.32 86.67
Slave-Density of Appointee's Former Elective Parishes: 3.19 2.66 2.55 2.56 2.64 2.53(relative to equal representation)Note:Thistablereportstwomeasuresofpersistence,in3‐yearstepsaftertheswitchtoCrownrule.BothmeasuresarecalculatedbypoolingallappointedlegislatorsaftertheswitchtoCrownruleintoonelegislatureandcalculatingsharessothatallappointedlegislatorsofall11coloniesarerepresentedineachyear."AppointeesfromElectedFamilies"arethosewhosefamilyhadheldanassemblyseatatanytimebeforeacolony'sabolitionofitsassembly.Toconstructthesecondmeasure,Icalculateforeachparishitsslave‐density(#slaves/area)in1836,relativetothecolony‐average.Thisproxiesforthedominanceoftheplantation‐systeminaparish,andisdividedbythecolonyaveragetomakeitcomparableacrosscolonies.Thetablereportstheaverageofthisrelativeslave‐densityacrossallappointedlegislatures.
Notes: This table reports two measures of persistence, in 3-year steps after the switch to Crown rule. Both measures arecalculated by pooling all appointed legislators after the switch to Crown rule into one legislature and calculating sharesso that all appointed legislators of all 11 colonies are represented in each year. ”Appointees from Elected Families”are those whose family had held an assembly seat at any time before a colony’s abolition of its assembly. To constructthe second measure, I calculate for each parish its slave-density (number-slaves/area) in 1836, relative to the colony-average. This proxies for the dominance of the plantation-system in a parish, and is divided by the colony average tomake it comparable across colonies. The table reports the average of this relative slave-density across all appointedlegislatures.
after parliaments were abolished, almost 90 % of the appointed positions continued to be held bylocals whose families had at one time held elected office in their colony. A shortcoming of thismeasure is that I cannot distinguish between elites’ last names and the last names of politicianswho represented freedmen. Therefore, while this share displays a high degree of persistence,it is not clear whether this persistence differentially favored the planter elites. To better gaugethis, I calculate a measure of the degree to which appointed legislators represented the plantationeconomy. To do this, I first take the 1834 slave-density of each parish from Higman (1995), thenaverage over all parishes that each family had represented in elected parliament to get a family’s“implied” slave-density.35 For each year since the regime change, I then average this family-specific measure over all appointed legislators across colonies. If this average is larger than 1, thenplantation districts are systematically over-represented across colonies. Table 3 shows that thismeasure remains very stable at around 2.5 over the two decades after parliaments were abolished.This evidence suggests that the planters continued to wield disproportionate influence over policymaking long after the regime changes.
35I normalize this measure by a colony’s total slave-density to create a measure that is comparable across colonies.
ix