emerging trends remodeling market
TRANSCRIPT
EMERGINGTRENDS
IN THE
REMODELINGMARKET
J O I N T C E N T E R F O R H O U S I N G S T U D I E S O F H A R V A R D U N I V E R S I T Y
I M P R O V I N G A M E R I C A’ S H O U S I N G 2 0 1 5

Principal support for this research was provided by the Policy Advisory Board of the Joint Center for Housing Studies. Policy Advisory Board member companies participating in the Remodeling Futures Steering Committee include:
ABC SupplyAndersen CorporationBuilders FirstSourceDow Building SolutionsFerguson EnterprisesFortune Brands Home & SecurityGAF Materials CorporationHanley Wood, LLCThe Home DepotJELD-WENKohler Co.Lutron Electronics
Masco CorporationMove, Inc.National Gypsum CompanyOldcastle Building Products, Inc.Owens CorningPella CorporationPly Gem Industries, Inc.ProBuild, Inc.The Sherwin-Williams CompanyUSG CorporationZillow
Additional support was provided by member companies of the Remodeling Futures Steering Committee:
AARPAmerican Exteriors, LLCBostikBSCiCase Design/Remodeling Inc.CEDIAClearwater Exteriors LLCCustom Design & ConstructionCygnus Business MediaDreamstyle RemodelingDuPont Building InnovationsThe Farnsworth GroupFirstService BrandsHarvey Building ProductsHearth, Patio & Barbecue AssociationHenkel CorporationHIRIHomeAdvisorHouzzITW PaslodeJames Hardie Building Products
Lowe’s Companies, Inc.National Association of Home BuildersNational Association of Realtors®National Association of the Remodeling Industry Neil Kelly CompanyOwens ConstructionPower Home Remodeling GroupRebuilding Together, Inc.Robert Bowden, Inc.Roxul Inc.SGC HorizonSola Group Inc.Statewide RemodelingSteves and Sons, Inc.Synchrony FinancialThe Tapco GroupU.S. Census BureauU.S. Department of Housing and Urban DevelopmentWellborn Cabinet Inc.Wells Fargo Retail Services
Joint Center for Housing Studies of Harvard University
H A R VA R D G R A D U AT E S C H O O L O F D E S I G N | H A R VA R D K E N N E DY S C H O O L
The Joint Center for Housing Studies thanks Masco Corporation for supporting the production of this report.
The opinions expressed in this report do not necessarily represent the views of Harvard University, the Policy Advisory Board of the Joint Center for Housing Studies, sponsors of the Remodeling Futures Program, or other persons or organizations providing support to the Joint Center for Housing Studies.
©2015 President and Fellows of Harvard College.

E M E R G I N G T R E N D S I N T H E R E M O D E L I N G M A R K E T J O I N T C E N T E R F O R H O U S I N G S T U D I E S O F H A R V A R D U N I V E R S I T Y 1
As a $300 billion industry,
home improvements and repairs
currently generate about 1.8
percent of US economic activity—
slightly below its decade-long
average share. Indeed, the slow
recovery in the housing market
as well as in the broader
economy is holding back
homeowner spending on the
larger discretionary projects
that typically fuel growth in
remodeling. But as prices for
both single-family owner-
occupied homes and rental
properties continue to firm,
and as new industry niches
continue to emerge, investment
in improvements to the nation’s
housing stock is likely to
strengthen.
While the US construction industry is recovering, most sec-tors still have a long way to go. By 2014 estimates, spending on homebuilding was less than 60 percent of its pre-recession levels, while spending on nonresidential construction had retraced less than 40 percent of its drop during the downturn. Indeed, many analysts believe that changes in the demograph-ics of the population and in the structure of the economy will delay a full rebound in both residential and nonresidential construction activity for several years.
The home improvement industry, however, has fared much better in the aftermath of the Great Recession. The US housing stock of more than 130 million homes requires regular invest-ment merely to offset normal depreciation. And many house-holds that might have traded up to more desirable homes during the downturn decided instead to make improvements to their current homes. Meanwhile, federal and state stimu-lus programs encouraged homeowners and rental property owners to invest in energy-efficient upgrades that they might otherwise have deferred. Finally, many rental property own-ers, responding to a surge in demand from households either facing foreclosure or nervous about buying amid the housing market uncertainty, reinvested in their units.
As a result, improvement and repair spending held up rela-tively well over the cycle, falling only 13 percent from peak to trough compared with the more than 60 percent plunge in residential construction spending. And while homebuilding is many years away from a full recovery, the home improvement industry could easily post record-level spending in 2015.
Even so, the remodeling industry faces a radically different landscape than before the recession. The generation of house-
1INTRODUCTION AND SUMMARY

E M E R G I N G T R E N D S I N T H E R E M O D E L I N G M A R K E T J O I N T C E N T E R F O R H O U S I N G S T U D I E S O F H A R V A R D U N I V E R S I T Y 2
holds now entering the housing market has different home improvement priorities. And, after years of declining revenue and high failure rates, a revitalized home improvement indus-try is in the process of repositioning itself to address emerging growth markets and rebuild its workforce to better serve its evolving customer base. Finally, as housing developers shift their focus from exurban communities toward urban and older suburban neighborhoods, high-income metropolitan areas on both coasts are re-emerging as leaders in home improvement spending. With these changes comes a new set of opportuni-ties for the remodeling industry that will help to ensure its long-term growth.
THE IMPROVEMENT SPENDING RECOVERYIn 2013, homeowner improvement spending accounted for just under 65 percent of the nearly $300 billion remodeling market (Figure 1). While still below the nearly 70 percent peak in 2007, this share is up from the trough in 2011. Meanwhile, homeowner maintenance and repair expenditures totaled $52 billion in 2013, lifting its share from 14 percent in 2007 to about 18 percent by 2013. Investment in the rental stock was also on an uptick, increasing from just over 16 percent of spending in 2007 to about 18 percent in 2013.
At this level of spending, the home improvement market appears to be returning to its long-term trend. On an infla-tion-adjusted basis, outlays per owner averaged $2,500 in 2013, well below the peak of $3,400 in 2007 but more than 8 percent above the $2,300 annual average posted between 1995 and 2005.
Annual homeowner spending on improvements as a share of home value, averaging just over 1 percent in 2013, has remained remarkably stable over the past decade. Even during the market boom in 2004–07, per-owner expendi-tures remained near this level, with percentage increases in spending roughly matching the percentage rise in house prices. Similarly, the decline in home improvement spend-ing during the downturn was proportional to that in national house prices.
DISCRETIONARY PROJECTS ON THE UPSWING With the economy strengthening and house prices recover-ing, spending by owners on discretionary home improvements rose by almost $6 billion between 2011 and 2013. Even more significantly, the share of spending on discretionary projects increased for the first time since 2005. This category includes larger home remodels and additions that improve homeowner lifestyles but can be deferred when economic conditions are uncertain. In 2013, discretionary spending on kitchen and bath
Notes: Tabulations of 2013 data use JCHS-adjusted weights. For more information about the re-weighting methodology, see www.jchs.harvard.edu/research/improving-americas-housing.
Sources: JCHS tabulations of US Department of Housing and Urban Development (HUD), American Housing Surveys; US Department of Commerce, Surveys of Expenditures for Residential Improvement and Repairs (C-50); and Abbe Will, Estimating National Levels of Home Improvement and Repair Spending by Rental Property Owners, JCHS Research Note N10-2, October 2010.
� Owner Improvements � Rental Improvements
� Owner Maintenance � Rental Maintenance
350
300
250
200
150
100
50
02001 2003 2005 2007 2009 2011 2013
132
34
2523
214
134
37
32
25
188
43
3118
228
280
226
46
3220
324
189
34
21
47
291
180
30
50
21281
192
52
31
23298
The Rebound in Homeowner Improvement Spending Has Lifted the Remodeling Market Back Near $300 BillionBillions of Dollars
Figure 1
Notes: Tabulations use JCHS-adjusted weights. Other room additions and alterations include outside attachments.
Source: Table A-1.
Homeowner Spending in 2013 = $192 Billion
Kitchen Remodels and Additions9.5
Bath Remodels and Additions7.7
Other RoomAdditions andAlterations13.1
System Upgrades15.7Exterior
Replacements20.3
Interior Replacements
11.8
PropertyImprovements
13.7
DisasterRepairs
8.2
Discretionary Projects Account for a Significant Share of Improvement Spending Share of Spending in 2013 (Percent)
Figure 2

E M E R G I N G T R E N D S I N T H E R E M O D E L I N G M A R K E T J O I N T C E N T E R F O R H O U S I N G S T U D I E S O F H A R V A R D U N I V E R S I T Y 3
upgrades contributed 17 percent of the $192 billion in total homeowner spending, while expenditures for additions and major structural alterations to other rooms made up another 13 percent (Figure 2).
Replacement projects, in contrast, refer to improvements that affect the safety and efficient functioning of the home. Spending in this category across the business cycle is gener-ally more stable than on discretionary projects. In 2013, exte-rior replacements (for example, roofing, siding, windows, and exterior doors) accounted for 20 percent of total homeowner expenditures, and interior replacements (including flooring, wall coverings, and ceilings) for almost 12 percent. Meanwhile, spending on systems and equipment upgrades (including plumbing, electrical, HVAC, and major appliances) amounted to almost 16 percent of overall outlays.
Until the housing downturn, the shares of homeowner spend-ing for discretionary and replacement projects were almost equal. But in 2013, discretionary spending had fallen to 30 per-cent of the total, while replacement spending had increased to
almost 50 percent. However, given the sharp retreat in discre-tionary spending during the downturn and the current recovery in housing prices, the modest uptick in discretionary outlays from 2011 to 2013 suggests that these types of projects will likely drive a significant share of growth in the home improve-ment market in the future.
The final two project categories—property improvements and disaster repairs—together contributed over 20 percent of homeowner spending. Property improvements refer to outlays for structures other than the principal residence, such as detached garages, sheds, or other outbuildings. This category also covers nonstructural improvements, such as driveways and walkways, fencing and walls, patios and terraces, and swimming pools and tennis courts. Disaster-related repairs and improvements are not linked to specific project categories.
HOUSEHOLD SPENDING BY GENERATION Spending on home improvement activity peaks among own-ers in their mid-30s to mid-50s, a time when family sizes and household incomes are typically growing. In 2013, owners in this age range spent about 30 percent more on average on improvement projects than the rest of the population. The fact that most of the baby-boom generation (born 1945–64) was in this high-spending age group during the housing boom no doubt contributed to the record levels of home improvement expenditures in the middle of the last decade.
While the baby boomers are moving out of the prime home improvement spending years, they are still active in the mar-ket. They survived the housing downturn better than most other generations, buffered from the drop in house values by many years of strong house price appreciation. The baby boomers have also remained in the labor force well beyond the traditional retirement age of previous generations. Indeed, although average per-owner spending on home improvement projects fell more than 15 percent from 2007 to 2013, spending by owners aged 55 and over declined less than 9 percent. Baby boomers thus accounted for almost half of all home improve-ment spending nationally in 2013 (Figure 3).
Meanwhile, most gen-X homeowners (born 1965–84) are now in their prime spending years. Although this generation originally numbered almost 10 million (12 percent) less than the baby boom, years of strong immigration filled its ranks. By the time they were 20–39 years old in 2005, the number of gen-Xers thus equaled that of the baby boomers at compa-rable ages. In 2013, gen-Xers contributed over a third of home improvement outlays, with the leading edge alone accounting for over 20 percent.
Notes: The pre-baby boom generation was born before 1945, leading baby boom in 1945–54, trailing baby boom in 1955–64, leading gen-X in 1965–74, trailing gen-X in 1975–84, and millennial in 1985–2004. Tabulations use JCHS-adjusted weights.
Source: Table A-3.
Homeowner Spending in 2013 = $192 Billion $
Millennial2.6
TrailingGen-X
13.4
Leading Gen-X20.9
Trailing Baby Boom26.6
Leading Baby Boom21.2
Pre-Baby Boom15.3
The Baby Boomers Continue to Dominate Spending, While Millennials Still Account for Only a Small Share of the Market Share of Improvement Spending by Generation (Percent)
Figure 3

E M E R G I N G T R E N D S I N T H E R E M O D E L I N G M A R K E T J O I N T C E N T E R F O R H O U S I N G S T U D I E S O F H A R V A R D U N I V E R S I T Y 4
Much of the millennial generation (born 1985–2004), in con-trast, has yet to enter the housing market. Even the oldest members of this age group have been slow to form households and buy homes because of high levels of student loan debt; high rates of unemployment or underemployment (and low salaries and wages for those that are employed); and stringent mortgage lending standards. In 2013, millennial homeowners therefore accounted for just under $5 billion in home improve-ment spending, or only 2.6 percent of the total.
Once the millennials begin to catch up with the gen-Xers in terms of progress in the housing market, however, their sheer numbers alone will drive up improvement spending. At more than 79 million births between 1985 and 2004, the number of native-born members of the millennial generation already equals the number of births of the baby-boom generation. By 2025, when millennials are more fully engaged in the hous-ing market, immigration is expected to have increased their numbers to more than 86 million. This will make the millennial generation almost 7 percent larger than the baby-boom gen-eration at comparable ages.
INDUSTRY STRUCTURE AND WORKFORCE TRENDSSmall contractor firms continue to dominate the home improve-ment industry, with a majority consisting of self-employed individuals or partnerships with no employees on payroll. The traditional dominance of small businesses in this industry has
provided little opportunity for firms to develop skilled employ-ees, which in turn has created growing fears of a labor short-age as the market continues to recover.
From a high of more than 20 percent in 2010, the national unemployment rate for the broader construction industry declined to just over 8 percent at the end of 2014. However, the last time that construction unemployment was this low was in 2007, when the workforce was 26 percent larger. The con-struction labor force shrank significantly during the downturn, suggesting that workers either moved to other industries or dropped out of the labor force altogether.
The construction labor force is not only smaller than at the peak of the market, but it also has different characteristics (Figure 4). Most notably, the industry attracts fewer younger workers, with the share of the labor force under age 35 down eight percentage points between 2007 and 2013. And despite rapid growth in the foreign-born population in recent decades and the industry’s long-time reliance on immigrants, the foreign-born share of the labor force was flat over this period. Finally, women workers, already underrepresented in the industry, made up a slightly smaller share of the construction workforce in 2013.
GEOGRAPHIC CONCENTRATION OF SPENDING During the housing downturn, the sharpest declines in improve-ment spending were generally in the Sunbelt. These areas of the country were home to most of the overbuilt markets that ultimately experienced high shares of distressed properties. As a result, improvement spending in the South and West has been slow to rebound, although the strong house price recov-ery in these regions suggests that remodeling activity will likely accelerate in the coming years.
Homeowners in the nation’s metropolitan areas continue to account for a disproportionately large share—81 percent—of overall improvement spending. Thanks primarily to their higher incomes and higher home values, owners in metro areas spent 50 percent more on improvement projects on average than their non-metro counterparts in 2013. Moreover, spending was up 5.0 percent among metro area owners between 2011 and 2013, but down by 0.2 percent among non-metro households.
Within metropolitan areas, the growing popularity of infill developments has stimulated an increase in improvement spending in central cities. The strongest growth, however, has occurred in inner suburban neighborhoods, where homes are typically older and smaller than in the outer suburbs. Indeed, home improvement spending in inner suburbs rose 11 percent
Note: The number of employed and unemployed workers in the construction industry fell from 8.3 million in 2007 to 6.8 million in 2013.
Source: JCHS tabulations of US Census Bureau, American Community Surveys.
50
40
30
20
10
0Under Age 35 Foreign-Born Women
42.9
34.8
27.9 27.9
2.6 2.5
After the Downturn, the Construction Industry Included a Smaller Share of Younger WorkersShare of Construction Labor Force (Percent)
Figure 4
� 2007 � 2013

E M E R G I N G T R E N D S I N T H E R E M O D E L I N G M A R K E T J O I N T C E N T E R F O R H O U S I N G S T U D I E S O F H A R V A R D U N I V E R S I T Y 5
between 2011 and 2013, surpassing the growth rate for metro areas overall.
The rental stock in metro areas also has benefited from higher improvement spending. With many younger households delay-ing marriage and family, demand for rental housing—particu-larly in downtown locations—has surged. While these house-holds are likely to gravitate toward homeownership in the suburbs as they age, growth in investment in rental properties is likely to remain strong in the coming years.
OPPORTUNITIES FOR GROWTH While the home improvement market has largely recovered from the Great Recession, the aging of the US population brings several opportunities for further growth. In particular, the movement of the baby-boom generation into the traditional retirement years is already pushing up demand for accessibil-ity improvements that will enable owners to remain safely in their homes as they age. Given their significant housing wealth and willingness to remain in the labor force longer than previ-ous generations, baby boomers are likely to remain active in the home improvement market. Indeed, with the large gen-X
population in their peak remodeling years, their spending should compensate for any falloff among the baby boomers.
However, the key to future market growth is the millennial generation. While currently lagging previous generations in forming households and buying homes, the millennials will eventually give a dramatic lift to home improvement spend-ing. More immediately, the growing presence of millennials in the rental market is encouraging property owners to invest in updates to their units.
The impending influx of younger homeowners is also likely to reverse the long-term slide in the do-it-yourself (DIY) market. In 2013, younger owners (under the age of 35) put a third of their outlays into DIY improvements—almost twice the share among all owners (Figure 5). Since a much larger share of DIY than of professional spending is for discretionary projects (over 40 percent vs. 28 percent), increased DIY spending should also boost the discretionary share of improvement expenditures.
The growing involvement of younger households in the home improvement market also holds out promise that sustainable home improvements will continue to be one of the fastest growing market segments. Increasing demand for energy-efficient upgrades, spurred by government incentives in the form of tax credits, remains the primary driver of sustainable projects, although homeowner spending on healthy home modifications, water conservation and efficiency upgrades, and products utilizing rapidly renewable or recycled materials also continues to gain momentum. With US household mobility rates declining steadily, homeowners have more incentive to make energy-efficient improvements to their current homes despite typically long payback periods.
Note: Tabulations use JCHS-adjusted weights.
Source: JCHS tabulations of HUD, American Housing Survey.
40
30
20
10
0Under 35 35 to 44 45 to 54 55 to 64
Age of Homeowner
65 andOver
All
34
2118
14
11
17
Younger Homeowners Devote a Much Larger Share of Improvement Spending to DIY Projects Do-It-Yourself Share of Spending in 2013 (Percent)
Figure 5

E M E R G I N G T R E N D S I N T H E R E M O D E L I N G M A R K E T J O I N T C E N T E R F O R H O U S I N G S T U D I E S O F H A R V A R D U N I V E R S I T Y 6
The shifting characteristics of
US households will shape the
home remodeling market for
many years to come. Longer-
term trends include the aging
population, stagnating incomes,
and declining household mobility,
while more recent changes
include increasing racial and
ethnic diversity and growth in the
number of young renters. Each of
these forces will have meaningful
impacts on improvement spending
levels, the mix of discretionary
and replacement projects, and the
choice of professional or do-it-
yourself installation.
CHANGING HOUSEHOLD DEMOGRAPHICS
OLDER HOMEOWNERS REMAIN KEY With members of the baby-boom generation now entering their retirement years, the number and share of older households are set to increase significantly. According to the Joint Center’s 2013 projections, the number of householders age 65 and over will rise from 26 million in 2010 to 35 million in 2020, and to 45 million in 2030.
Meanwhile, the share of improvement spending by homeowners age 65 and over has already increased dramatically, rising from just 13 percent in 2005 to 23 percent in 2013. This growth reflects not only the rising number of older owners, but also an increase in per-owner outlays. Indeed, more than 60 percent of the growth in share is due to higher inflation-adjusted per-owner spending.
On average, baby boomers have more wealth and greater lon-gevity, and remain in the workforce longer than previous gen-erations. But like those that preceded them, the overwhelming majority prefer to age in place. A 2013 survey by the Demand Institute found that 55 percent of baby boomers have lived in their current homes for more than ten years, and 63 percent do not plan to move again. Of that group, fully 85 percent intend to stay in their current homes by choice (rather than being forced to stay for financial or other reasons).
Baby boomers have been, and continue to be, a driving force in the home improvement market. As members of this generation have aged from their 30s and 40s in 1995 to their 50s and 60s today, they have consistently accounted for about half of total spending (Figure 6). Although their share has started to dip in recent years as the gen-Xers moved into the prime home-ownership and improvement spending years (roughly ages 35 to 55), baby boomers still make up the largest share of the remodeling market.
2

E M E R G I N G T R E N D S I N T H E R E M O D E L I N G M A R K E T J O I N T C E N T E R F O R H O U S I N G S T U D I E S O F H A R V A R D U N I V E R S I T Y 7
The aging of US homeowners affects the demand for home improvements in several ways. Regardless of economic con-ditions or changes in the business cycle, older homeowners tend to focus much more of their spending on replacement projects related to roofing, siding, windows, doors, plumbing, electrical wiring, and other systems (over 50 percent in a typi-cal year), and less on discretionary projects such as kitchen and bath upgrades (under 30 percent). Younger homeowners, in contrast, tend to spend equal shares (about 40 percent) of their budgets on replacements and on discretionary projects.
Since replacement projects often involve professional installation, an important impact of higher replacement spending is that it has reduced the share of do-it-yourself expenditures. The DIY share of total home improvement spending trended down from about 25 percent in the late 1990s to just 17 percent in 2013, primarily because of the aging population. Indeed, younger homeowners (under age 35) consistently devote much larger shares of their improve-ment spending—about one in three dollars—to DIY projects, while older homeowners (age 65 and over) spend much less. In fact, the DIY share of expenditures among this older group shrank from over 14 percent in 2005 to under 11 percent in 2013 as the leading edge of the baby-boom generation moved into this age range.
SLUGGISH HOUSEHOLD INCOME GAINS The stagnation or erosion of incomes among all but the top quintile of households is another long-term trend that affects remodeling expenditures. The average inflation-adjusted income of households in the lowest income quintile remained unchanged from 1993 to 2013, while that for households in the middle income quintiles rose a modest 3–8 percent. In contrast, households in the highest income quintile saw a 15 percent increase over the same period.
Lower-income homeowners are much less likely than higher-income households to make improvements, and those that do spend considerably less on those projects. Among households between ages 35 and 64, only half (51 percent) of those in the lowest income quintile reported undertaking a project in 2012–13 compared with more than two-thirds of owners in the highest income quintile (Figure 7a). Middle-aged homeown-ers in the lowest income quintile who did make improvements spent just $2,900 annually, significantly less than the $8,600 average among highest-income homeowners. Even owners in the middle income quintiles spent 40–60 percent less on home remodeling projects than top-income owners.
At the same time, however, lowest-quintile households spend much more of their incomes on home improvements (4.4 per-cent) than top-quintile households (1.5 percent) (Figure 7b). This is because much of their spending is not discretionary, and most homeowners ultimately make the upgrades to roof-ing, plumbing, electrical, and other systems necessary to keep their properties safe and comfortable. The cost of these often unavoidable projects thus falls much more heavily on lowest-income homeowners.
In fact, the mix of replacement and discretionary projects changes dramatically with income, with lowest-quintile owners focusing much more of their remodeling budgets (58 percent) on replacements than highest-income owners (42 percent). While the split between professional and DIY installations is largely a function of a homeowner’s age, the DIY share of spending among 35–64 year olds also declines considerably with household income. Top-quintile homeowners spend less than 13 percent of their outlays on DIY improvements, while all other owners spend over 20 percent.
Given these large differences in improvement activity, it is not surprising that high-spending homeowners drive the upswings and downswings in the remodeling market. For example, at the height of the housing boom in 2005, homeowners that were in the top 5 percent of spenders accounted for just over 60 percent of all improvement outlays. In 2003, their share had fallen to about 52 percent as even high-spending homeowners focused more on replacements than on high-end discretion-
Note: The millennial generation was born in 1985–2004, gen-X in 1965–84, baby boom in 1945–64, and pre-baby boom before 1945. Tabulations of 2013 data use JCHS-adjusted weights.
Source: JCHS tabulations of HUD, American Housing Surveys.
100
90
80
70
60
50
40
30
20
10
01995 1997 1999 2001 2003 2005 2007 2009 2011 2013
� Millennial � Gen-X � Baby Boom � Pre-Baby Boom
While the Baby Boomers Are Still the Primary Drivers of Improvement Spending, Gen-Xers Are Gaining ShareShare of Spending by Generation (Percent)
Figure 6

E M E R G I N G T R E N D S I N T H E R E M O D E L I N G M A R K E T J O I N T C E N T E R F O R H O U S I N G S T U D I E S O F H A R V A R D U N I V E R S I T Y 8
ary projects. And while high-income owners making large discretionary improvements will remain responsible for much of spending growth, the flat or falling incomes of most home-owners will likely have a dampening effect on total outlays in the market.
DECLINING HOUSEHOLD MOBILITY Mobility rates, or the share of households changing residences within a given year, have fallen steadily for several decades. A number of factors have contributed to the decline, including the aging of the population; the increase in two-earner house-holds, making it both less critical and more difficult to relocate for work; and the postponement of retirement, whether out of choice or necessity.
The housing market crash further diminished mobility rates as falling house prices left millions of homeowners under-water on their mortgages (owing more than the value of their homes). Between 2007 and 2013, the share of recent homebuy-ers shrank from 17 percent to 12 percent of owners, while the share of total improvement spending by these homeowners dropped from 23 percent to 15 percent. Although house prices in much of the country have now recovered, historically low interest rates provide an incentive for owners to remain in their current homes when mortgage rates head up again. This mort-gage lock-in effect may thus continue to depress household mobility and future remodeling activity.
In general, lower household mobility reduces remodeling demand because households tend to spend more on improve-ments both when they are putting their homes on the market and during the first several years after purchase. According to a 2014 Home Improvement Research Institute survey, fully half of recent sellers (who had sold and purchased homes in the preceding three years) undertook one or more improvement projects to prepare their homes for sale, with their expendi-tures averaging well over $8,000.
The post-purchase spending of recent buyers is also consid-erably higher than the spending of non-movers, even after controlling for age and income. Recent buyers aged 35–64 in the middle-income quintiles consistently spend significantly more—about 33 percent—on improvements than otherwise similar non-movers (Figure 8). In particular, homeowners that have recently moved devote much higher shares of their improvement dollars to DIY and discretionary projects. As a result, falling household mobility rates are likely to put down-ward pressure on the DIY and discretionary shares of improve-ment spending.
Notes: Quintiles are equal fifths of homeowners ranked by total household income. Tabulations use JCHS-adjusted weights.
Source: JCHS tabulations of HUD, American Housing Survey.
80
70
60
50
40
30
20
10
0Lowest Lower-Middle Middle Upper-Middle Highest
Household Income Quintiles
5154
5965
68
Although Lower-Income Owners Are Less Likely to Make Home Improvements…Share of Homeowners Aged 35–64 Reporting One or More Projectsin 2012–13 (Percent)
Figure 7a
Notes: Estimates include only homeowners aged 35–64 undertaking improvement projects. Quintiles are equal fifths of those homeowners ranked by total household income. Tabulations use JCHS-adjusted weights.
Source: JCHS tabulations of HUD, 2013 American Housing Survey.
10,000
9,000
8,000
7,000
6,000
5,000
4,000
3,000
2,000
1,000
0
5.0
4.5
4.0
3.5
3.0
2.5
2.0
1.5
1.0
0.5
0.0Lowest Lower-
MiddleMiddle Upper-
MiddleHighest
Household Income Quintiles
2,9003,300
4,000
5,400
8,600
4.4
2.1 2.1
2.1 1.5
� Average Annual Spending � Share of Income
…Those That Do Spend a Much Larger Share of Their IncomesAverage Annual Spending(Dollars)
Figure 7b
Median Share of Income(Percent)

E M E R G I N G T R E N D S I N T H E R E M O D E L I N G M A R K E T J O I N T C E N T E R F O R H O U S I N G S T U D I E S O F H A R V A R D U N I V E R S I T Y 9
GROWING DIVERSITY AMONG YOUNGER GENERATIONS The millennial generation is already as large as the baby boom and its numbers will continue to increase with the arrival of new immigrants. Millennials are also much more racially and ethnically diverse, with minority householders making up nearly 40 percent of their ranks, compared with just 27 per-cent of the baby boomers. Moreover, immigration will help to expand the minority share of millennial households over the coming decades.
This demographic shift is important for the home improve-ment market because minority households traditionally have lower incomes and wealth as well as far lower homeownership rates than white households. Joint Center tabulations of the American Housing Survey indicate that minorities have con-sistently earned about 70 percent of white incomes since 1995 and their homeownership rates have held about 25 percentage points below white rates. Minority homeowners also tend to be younger, with a third under age 45 in 2013 compared with only a quarter of white owners.
The impacts of increasing racial and ethnic diversity on the level and mix of remodeling projects are due primarily to dif-ferences in income and age between whites and minorities. Minority owners historically spend about 25 percent less on home improvements than white households, and Hispanic, Asian, and multiracial owners devote more of their budgets to DIY and discretionary projects. Even when looking just at middle-aged and middle-income households, Hispanic, Asian, and multiracial homeowners spend a larger share on DIY and discretionary improvements than white homeowners.
MILLENNIALS’ SLOW START TO HOMEOWNERSHIPMillennials are much less likely than previous generations to have formed their own households, be married, or have chil-dren by the age of 28. As a 2012 report from the Bipartisan Policy Center notes, nearly half (47 percent) of millennials between the ages of 18 and 28 were living with at least one family member, compared with 43 percent of the gen-X and 39 percent of the baby-boom generations at similar ages. Just 21 percent of millennials were married by age 28, compared with 29 percent of gen-Xers and half of baby boomers. Finally, only 20 percent of millennials had children compared with 30 percent of baby boomers at the same ages.
Although these differences in part reflect long-term declines in household formation, marriage, and childbearing rates, the severity of the recent recession also played a key role. Having come of age during the country’s worst downturn since the Great Depression, millennials have faced significant chal-
lenges to homeownership including high student loan debt, limited employment opportunities, and housing affordability pressures. At more than 64 percent in 2014, the rentership rate for householders under age 35 still exceeds the 61 percent average in the late 1990s, a period that might be considered more typical for rental and owner markets.
Continuation of a high rentership rate has implications for the home improvement market because per-unit spending on rental housing is significantly lower than on owner-occupied housing. According to Joint Center estimates, spending for improvements to renter-occupied units averaged just $770 in 2013. By comparison, outlays for improvements to owner-occupied single-family homes averaged $2,600. Even condo-minium owners spent over $800 more on remodeling in 2013 than the typical rental unit owner.
If individuals under the age of 30 today formed households and purchased homes at the same rates as their counterparts a decade ago, improvement spending by this age group would be nearly 11 percent higher (Figure 9). By this calculation, depressed household formation and homeownership rates among this age group shaved about three-quarters of a billion dollars off total improvement spending on owner-occupied units in 2013.
Notes: Recent movers bought their homes within the previous three calendar years. Estimates include owners in the lower-middle, middle, and upper-middle income quintiles. Quintiles are equal fifths of homeowners aged 35–64 ranked by total household income. Tabulations of 2013 data use JCHS-adjusted weights.
Source: JCHS tabulations of HUD, American Housing Surveys.
� Recent Movers � Non-Movers
4,000
3,000
2,000
1,0002005 2007 2009 2011 2013
Recent Movers Spend Considerably More on Home ImprovementsAverage Annual Spending by Owners Aged 35–64 in the Middle Income Quintiles (Dollars)
Figure 8

E M E R G I N G T R E N D S I N T H E R E M O D E L I N G M A R K E T J O I N T C E N T E R F O R H O U S I N G S T U D I E S O F H A R V A R D U N I V E R S I T Y 10
Delayed marriage by millennials is also a concern for the home remodeling market because, regardless of age, married homeowners spend considerably more on improvements than singles (Figure 10). The presence of children provides an even bigger lift to spending. Among homeowners between the ages of 45 and 64, married couples (with or without children) spent about the same on DIY projects as single homeowners, while married owners with children spent significantly more on discretionary projects.
THE OUTLOOKOf the many household characteristics that are changing, age and income are the most important to future remodeling demand. Other major demographic shifts—including contin-ued declines in household mobility, growth in the minority share of households, and delayed household formation, mar-riage, childbearing, and homebuying among the millennial generation—also influence remodeling expenditures primarily through their age and income effects.
As the baby boomers move into their retirement years, their improvement spending already outpaces that of the preceding generation at similar ages, and it is expected that older home-owners will continue to play a significant role in the remodel-ing market for years to come. Meanwhile, members of the equally large gen-X generation are now in the peak remodeling age group and represent a growing segment of the market. Finally, although off to a slow start, millennials have similar aspirations to homeownership as previous generations. As a recent Fannie Mae National Housing Survey indicates, well over 90 percent of young people today expect to buy homes in the future, suggesting that members of the millennial genera-tion will ultimately represent a substantial force in the home improvement market.
Notes: Expected figures assume 2003 household formation and homeownership rates for persons under age 30. Tabulations use JCHS-adjusted weights.
Sources: US Census Bureau, Current Population Survey, March and Annual Social and Economic Supplements, Housing Vacancies & Homeownership Rates, and Population Estimates; JCHS tabulations of HUD, American Housing Survey.
16
14
12
10
8
6
4
2
0Households
(Millions)Homeowners
(Millions)Improvement Spending
(Billions of dollars)
� Actual � Expected Assuming 2003 Rates
13.6 13.7
3.6 4.0
6.87.5
With Their Lower Household Formation and Homeownership Rates, Millennials Spend Less than Expected on Home ImprovementsActual and Expected Households, Homeowners, and Spending in 2013 for Persons Under Age 30
Figure 9
Note: Tabulations use JCHS-adjusted weights.
Source: JCHS tabulations of HUD, American Housing Survey.
5,000
4,500
4,000
3,500
3,000
2,500
2,000
1,500
1,000
500
0Under 35 35 to 44 45 to 54
Age of Homeowner
55 to 64 65 and Over
� Single � Married without Children � Married with Children
Married Couples of All Ages Spend More on Home Improvements than Single HomeownersAverage Annual Spending in 2013 (Dollars)
Figure 10

E M E R G I N G T R E N D S I N T H E R E M O D E L I N G M A R K E T J O I N T C E N T E R F O R H O U S I N G S T U D I E S O F H A R V A R D U N I V E R S I T Y 11
Remodeling contractors are
experiencing a strong rebound,
especially larger-scale firms that
could take advantage of their size
to gain market share during the
downturn. While the remodeling
industry is still highly fragmented,
specialty trade or replacement
contractors have been particularly
successful in achieving scale
economies and posting strong,
steady growth over the business
cycle. Meanwhile, industry
employment is still well below the
market peak and the construction
workforce is aging. As housing
and improvement demand revives,
it will be critical for the industry
to attract and develop a younger
workforce.
Since the market bottom, the number of general residential remodeling firms with payrolls increased from less than 80,000 in 2011 to more than 83,000 in the second quarter of 2014, with the pace of growth accelerating each year. The industry has now recovered fully half of the payroll firms lost since the market peak. Job growth has been even faster, up 20 percent from the market low to an estimated 282,000 employees in 2014, restoring more than 60 percent of jobs lost during the downturn (Figure 11).
With employment levels outpacing growth in the number of firms, the average size of general remodelers has ticked up from a decade low of 2.9 payroll employees in 2010 to 3.3 in the second quarter of 2014. While still below the 2006 peak of 3.7 payroll employees, the firm size of general remodelers has thus returned to the decade average.
Unlike other industries within the broader construction sec-tor, remodeling remains highly fragmented with large shares of self-employed contractors and small-scale, single-location payroll businesses. According to the most recently available economic census, the revenues of residential remodelers with payrolls averaged $700,000 in 2007—just one-third the size of a typical firm in the broader construction sector (including both residential and nonresidential), one-fifth the size of build-ing material dealers, and one-tenth the size of wood product manufacturers. In fact, the average residential remodeling contractor with a payroll operated on even a smaller scale than the typical business serving the similarly fragmented accom-modations and food services sector.
During the housing market downturn and Great Recession, the remodeling industry became even more fragmented. The share of general remodeling firms with fewer than five employ-
INDUSTRY STRUCTURE AND LABOR TRENDS
3

E M E R G I N G T R E N D S I N T H E R E M O D E L I N G M A R K E T J O I N T C E N T E R F O R H O U S I N G S T U D I E S O F H A R V A R D U N I V E R S I T Y 12
ees increased from less than 81 percent in 2007 to 84 percent in 2010, where it remained in 2012 (the most recent year for which data are available). Clearly contributing to this growing fragmentation, although difficult to quantify, is the increased presence of single-family home builders in the remodeling market since the housing crash. According to member census-es by the National Association of Home Builders (NAHB), the share of home builders that reported residential remodeling as a secondary activity jumped from 44 percent in 2008 to 50 percent in 2010 and remained at this elevated level as the new home construction market continued its own slow recovery.
PERFORMANCE OF LARGER-SCALE CONTRACTORSThe obstacles to achieving scale economies in the remodeling industry are many: low barriers to entry, volatile business cycles, and difficulty attracting capital, to name only a few. Firms that are able to overcome these hurdles, however, enjoy a long list of potential benefits, including stronger revenue growth, higher labor productivity, significantly lower failure rates, improved buying power, more efficient management, and increased brand recognition and trust. Indeed, the performance of larger-scale remodeling contractors in recent years provides clear evidence of the many advantages of scale and of the growing momentum toward full recovery from the worst downturn on record.
In 2013, firms on Qualified Remodeler magazine’s Top 500 list reported median annual revenue growth of 10.8 percent, far outstripping the 3.6 percent increase in total market spending for professionally installed improvements that year. Indeed, recent revenue growth at these larger companies was even stronger than during the housing boom (Figure 12). Overall, revenues of larger-scale contractors grew 5.2 percent annually in 2010–13, compared with 4.6 percent annually in 2004–07. And now that homeowners are making some of the discretion-ary improvements that they deferred during the downturn, revenue growth at design/build and full-service firms is out-pacing that at lower-ticket replacement contractors. The scale of the average job for companies in the Top 500 is also edging back up to the pre-recession level of $17,000, rising 15 percent between 2011 and 2013 to $13,000.
The very largest firms consistently outperform the rest of the remodelers on the Top 500 list by a considerable margin. In 2013, businesses ranked in the Top 100 reported average rev-enues of $43 million, while firms ranked below that group had average revenues of less than $4 million. The Top 100 remod-elers also experienced significantly smaller losses during the downturn and much stronger gains during the recovery than other large contractors (Figure 13).
DEVELOPING SCALE AND EFFICIENCIES THROUGH SPECIALIZATIONSince the remodeling industry encompasses many diverse business segments and market niches, there is no one-size-fits-all approach to achieving scale. Remodeling companies employ a wide variety of strategies that may involve partner-ships with franchisors, investors, or nationally known manu-facturing and retail brands.
Opportunities for scale and consolidation are especially likely to exist in the specialty replacements segment, which includes
Note: Estimate for 2014:2 is preliminary.
Source: US Department of Labor, Bureau of Labor Statistics, Quarterly Census of Employment and Wages.
90
85
80
75
702005 2006 2007 2008 2009 2010 2011 2012 2013 2014:2
79.9
84.4
86.9 86.4
80.3 79.6 79.980.8
83.282.5
While the Number of General Remodeling Firms Is Growing Steadily…Number of Firms with Payrolls (Thousands)
Figure 11a
Note: The 2014 estimate is annualized using reported data through November.
Source: US Department of Labor, Bureau of Labor Statistics, Current Employment Statistics.
320
300
280
260
240
220
2002005 2006 2007 2008 2009 2010 2011 2012 2013 2014
289
310306
284
235 241
252
266
282
248
…Employment Is Climbing Back Even More QuicklyNumber of Employees at General Residential Remodeling Firms (Thousands)
Figure 11b

E M E R G I N G T R E N D S I N T H E R E M O D E L I N G M A R K E T J O I N T C E N T E R F O R H O U S I N G S T U D I E S O F H A R V A R D U N I V E R S I T Y 13
roofing, siding, windows, painting, cabinet refacing, bath liners and surrounds, and other kitchen and bath product replace-ments. Scheduling and installation of specialty replacement projects tend to be much less labor-intensive than for full-service remodeling projects, which means shorter job cycles and potentially higher margins. This specialization also allows
replacement firms to develop greater efficiencies in their operations and obtain more favorable pricing on materials than full-service remodeling firms.
Specialty firms have pursued scale by focusing heavily on lead generation and sales and marketing, and by integrating with manufacturers of their core product lines. Specialization and vertical integration give companies substantial competitive advantages and provide significant value, thus strengthening their position for outside investment, mergers, or acquisitions.
Indeed, specialty replacement contractors represent a much greater share of the largest firms on the Qualified Remodeler Top 500 list. Over the past decade, these firms have made up 45–50 percent of the top 100 contractors on that list each year, compared with only 27–30 percent of companies ranking below 100. Given that specialty companies have already been more effective than full-service companies in achieving scale, it is likely that consolidation in this segment of the industry will increase moving forward.
CHANGING CHARACTERISTICS OF THE WORKFORCEMany construction workers have moved on to other indus-tries or left the workforce entirely since the downturn. The labor force in the broader construction industry—including all employed or unemployed workers in construction and extrac-tion occupations, whether self-employed or on a payroll—num-bered 6.8 million in 2013 and represented 4.3 percent of the total US workforce. At the peak of the market in 2007, how-
Note: Companies qualifying for the Qualified Remodeler Top 500 list typically generate annual revenues of $1 million or more. Analysis includes firms reporting revenue in any two consecutive years and ranking in the Top 400 in at least one of those years.
Source: JCHS tabulations of Qualified Remodeler Top 500 lists.
� Top 100 � Rest of Top 500
20
15
10
5
0
-5
-10
-152005 2006 2008 2009 2010 2011 2012 20132007
6.7
8.4
5.5
2.8 2.0
-1.5
-5.2 -5.6
-12.4
5.6 4.7 5.4
2.8
8.9
5.3
13.9
10.2
4.8
Revenue Growth at the Top 100 Remodeling Contractors Has Been Much More Stable than at Other Large FirmsMedian Annual Change in Revenue for Qualified Remodeler Top 500 Firms (Percent)
Figure 13
Notes: Companies qualifying for the Qualified Remodeler Top 500 list typically generate annual revenues of $1 million or more. Analysis includes firms reporting revenue in the beginning and ending years of each time period and ranking in the Top 400 in at least one of those years.
Source: JCHS tabulations of Qualified Remodeler Top 500 lists.
8
6
4
2
0
-2
-4
-6
-8
-10
-12Design/Build Full-Service Replacement All Larger Firms
5.5
-9.4
-6.3
6.6
2.6
4.9
0.1
4.2 4.6
-4.6
5.24.3
� Boom (2004–07) � Bust (2007–10) � Recovery (2010–13)
Larger Contractors Have Seen a Sharp Rebound in RevenuesMedian Compound Annual Change in Revenue for Qualified Remodeler Top 500 Firms (Percent)
Figure 12

E M E R G I N G T R E N D S I N T H E R E M O D E L I N G M A R K E T J O I N T C E N T E R F O R H O U S I N G S T U D I E S O F H A R V A R D U N I V E R S I T Y 14
ever, the construction labor force was 1.5 million stronger and accounted for a 5.5 percent share of the national workforce.
The demographic characteristics of those engaged in con-struction and extraction occupations are strikingly different from those of the national labor force (Figure 14). The larg-est disparity is in the share of women, who made up only 2.5 percent of the construction labor force in 2013, compared with nearly half of the total workforce. Less than 31 percent of construction workers had education beyond a high school diploma or GED, compared with nearly two-thirds of the national workforce. And fully 28 percent of construction work-ers were foreign-born, compared with less than 17 percent of the national labor force. While figures specifically for the residential remodeling labor force are not available, the profile of workers is likely to be quite similar to that of construction workers overall.
The large differences between the construction and national workforces are important as the industry looks to rebuild its ranks. The general concern is that the construction sector might have difficulties securing the labor force it needs if it cannot broaden its hiring to include more female, college-educated, and native-born workers, especially given the uncertainty surrounding the current immigration system. The
fact that the construction sector has not traditionally attract-ed women and more educated workers has likely contributed to the aging of the labor force. From 2002 to 2013, the share of the construction workforce aged 55 and over increased from under 9 percent to almost 16 percent, and the share of the workforce under age 35 declined from 44 percent to less than 35 percent.
The inability to attract young workers is detrimental to the future vitality of the industry. This concern relates not only to workers that left construction for more stable sectors, but also to the industry’s ability to find new skilled workers. Indeed, a 2013 survey by the Associated General Contractors of America indicated that fully 45 percent of member respondents consid-ered the quantity and quality of local college, trade school, and apprenticeship programs to be poor or below average. Better preparation of younger workers is clearly necessary.
Immigrants remain a major source of labor for the construction industry, although their characteristics changed in meaningful ways during the industry boom and bust (Figure 15). While most foreign-born construction workers come from Mexico, their share of the immigrant labor force declined noticeably from 62 percent in 2002 to 57 percent in 2013. The drop in share of young immigrant workers was even more dramatic, falling from 55
Notes: Data include all workers age 16 and over housed in non-group quarters and are employed or unemployed but available for and seeking work. The construction labor force includes workers with construction and extraction occupations in the construction industry.
Source: JCHS tabulations of US Census Bureau, American Community Survey.
70
60
50
40
30
20
10
0Women More than
High SchoolEducation
Foreign-Born
47.3
2.5
63.8
30.9
16.6
27.9
� All Industries � Construction
The Construction Workforce Di�ers from the Overall Labor Force in Several Key AreasShare of Labor Force in 2013 (Percent)
Figure 14
Notes: Data include all foreign-born workers age 16 and over housed in non-group quarters and are employed or unemployed but available for and seeking work. The construction labor force includes workers with construction and extraction occupations in the construction industry.
Source: JCHS tabulations of the US Census Bureau, American Community Survey.
70
60
50
40
30
20
10
0Born in Mexico Under Age 35 More than
High SchoolEducation
� 2002 � 2007 � 2013
62 6257
5551
37
14 15 16
The Characteristics of the Foreign-Born Construction Workforce Have Shifted Somewhat Share of Foreign-Born Construction Labor Force (Percent)
Figure 15

E M E R G I N G T R E N D S I N T H E R E M O D E L I N G M A R K E T J O I N T C E N T E R F O R H O U S I N G S T U D I E S O F H A R V A R D U N I V E R S I T Y 15
percent to only 37 percent over this period. Although the share of immigrant construction workers having more than a high school education inched up over the decade, it still stood at only 16 per-cent in 2013—less than half the share of native-born workers. Future immigration levels will certainly be an important factor in whether the construction industry is able to meet its demand for younger, less educated workers.
THE OUTLOOKAlthough the remodeling industry will almost certainly remain more fragmented than the overall construction sector, oppor-tunities for consolidation and economies of scale are especially likely in the specialty replacement segment. Companies that are focused on branding and customer satisfaction, develop-ing and retaining skilled labor, and finding innovative uses of technology will also gain competitive advantage.
The massive decline in, and aging of, the construction industry labor force following the Great Recession have raised alarms about potential shortages of both skilled and unskilled work-ers as the market recovers. Ultimately, the construction and remodeling industries will need to attract new employees from key segments of the labor force whose shares have either declined or stagnated in recent years—in particular, young, female, and immigrant workers.

E M E R G I N G T R E N D S I N T H E R E M O D E L I N G M A R K E T J O I N T C E N T E R F O R H O U S I N G S T U D I E S O F H A R V A R D U N I V E R S I T Y 16
METRO AND REGIONAL REMODELING MARKETS
Remodeling activity is highly
concentrated within the nation’s
metropolitan areas, with
homeowners in those markets
accounting for four out of five
dollars of spending. Even so,
wide differences in household
incomes and house prices mean
that average improvement
expenditures, especially on larger
discretionary projects, vary sharply
across metro areas. Emerging
opportunities for spending
growth—driven by shifting
demographics and increasing
demand for energy-efficient
retrofits and rental property
improvements—also exhibit strong
geographic patterns.
REGIONAL SPENDING PATTERNSConsistent with historical trends, home improvement spending in 2013 was highest in the Northeast and West. In large mea-sure, this strength reflects the fact that home values in the two regions were more than 20 percent above the national average while household incomes were at least 10 percent above.
In the Northeast, home improvement spending climbed 5.6 percent from 2009 to 2011 and another 10.8 percent from 2011 to 2013 in real terms (Figure 16). Average per homeowner expenditures stand at $3,300, or nearly 90 percent of the pre-recession peak. The larger and earlier remodeling rebound in the Northeast reflects relatively moderate losses in home values and jobs during the downturn.
In contrast, home prices and remodeling activity in the West were much more volatile during the recent housing cycle. When home prices soared in 2007, remodeling expenditures also rose rapidly. But when the housing bubble burst and plunging house prices eroded home equity, improvement spending in the region fell sharply. Average spending per homeowner continued to slide from 2011 to 2013, dipping 1.2 percent to $2,600 or more than 40 percent below the previ-ous peak.
While lower than in the Northeast and West, average annual improvement spending in the South and Midwest has been more stable over time. Remodeling expenditures rose 4.4 percent in the South and edged up 0.5 percent in the Midwest in 2011–13, marking the first period of growth since the crash. These small increases lifted average spending per homeowner to just over $2,300, or about 80 percent of pre-recession peaks.
4

E M E R G I N G T R E N D S I N T H E R E M O D E L I N G M A R K E T J O I N T C E N T E R F O R H O U S I N G S T U D I E S O F H A R V A R D U N I V E R S I T Y 17
METRO MARKET PERFORMANCEThe home improvement recovery in the Northeast owes much of its strength to the healthy house price recovery in some metro areas. Metro area homeowners spend about 50 percent more on average on remodeling than those living in non-metro areas. Nationwide, metro area households contributed more than four-fifths of improvement expenditures in 2013, but fully 92 percent in the Northeast. By comparison, the metro shares of spending were 84 percent in the West, 77 percent in the South, and 74 percent in the Midwest.
Moreover, the top 50 remodeling markets in the country accounted for nearly 60 percent of all home improvement spending in 2013, and the top 15 for fully a third. New York was the largest remodeling market, with over $12 billion in expenditures. Washington, DC, Los Angeles, Chicago, and Philadelphia were the next largest, with spending that ranged from $4 billion to $7 billion.
Owners in the 50 largest markets spent $3,000 on average on home improvements, although outlays in specific markets ranged from less than $2,000 to nearly $5,000. Spending was typically higher in metros located on the coasts, where higher property values and household incomes encouraged more reinvestment in housing (Figure 17). While Washington, DC
($5,000) and Boston ($4,900) were the top remodeling markets, several other metros in the Northeast—including New York and Philadelphia—posted above-average spending. On the West Coast, San Francisco and San Jose reported the highest
Note: Tabulations of 2013 data use JCHS-adjusted weights.
Source: JCHS tabulations of HUD, American Housing Surveys.
5,000
4,500
4,000
3,500
3,000
2,500
2,000
1,500
1,0001995 1997 1999 2001 2003 2005 2007 2009 2011 2013
� Northeast � West � Midwest � South
The Northeast Is Leading the Recovery in Home Improvement SpendingAverage Annual Per-Owner Spending (2013 dollars)
Figure 16
Source: Table A-5.
Average Per-Owner Spending in 2013
Less than $2,500 (Down to $1,700)
$2,500–2,999
$3,000–3,499
$3,500 or More (Up to $5,000)
Washington, DC
Richmond Virginia Beach
BuffaloRochester
Hartford
BirminghamAtlanta
Memphis
NashvilleCharlotte
New York
PhiladelphiaBaltimore
San Jose
Sacramento
Portland
Seattle
Las Vegas
Phoenix
Riverside
Denver
Orlando
Jacksonville
Detroit
Pittsburgh
St. LouisKansas City
Minneapolis
Cincinnati
Louisville
Columbus
Cleveland
AustinHouston
Tampa
San Francisco
Los Angeles
San Diego
Chicago
Indianapolis
Dallas
San AntonioNew Orleans
Oklahoma City
Boston
Milwaukee
Tucson
Providence
Owners in Coastal Metro Areas Generally Spend More on Improvements
Figure 17

E M E R G I N G T R E N D S I N T H E R E M O D E L I N G M A R K E T J O I N T C E N T E R F O R H O U S I N G S T U D I E S O F H A R V A R D U N I V E R S I T Y 18
average spending of more than $3,700 per homeowner, fol-lowed by San Diego and Los Angeles.
But not all high-spending metros are concentrated on the coasts, nor have all coastal metros performed well. For exam-ple, average homeowner spending levels in Denver ($4,000) and Phoenix ($3,800) were especially strong. At the same time, major metro areas in Florida—including Miami, Orlando, and Jacksonville—registered below-average spending of $2,000 or less per homeowner. This weakness reflects the fact that prices in these markets are still depressed and shares of dis-tressed properties remain high.
The depth of the recent housing downturn is a key factor in the hardest-hit markets, where prices fell 40 percent or more. Homeowner improvement spending in these areas averaged only $2,300 in 2013, compared with $3,200 in markets with less dramatic price drops. The metros with the lowest expenditures are Las Vegas, Orlando, Jacksonville, and Detroit, where per-owner spending averaged less than $2,000. In addition to steep house price declines, these markets experienced high unem-ployment and a glut of foreclosed properties. Another contrib-uting factor in Las Vegas is its newer housing stock.
METRO HOME VALUES AND INCOMES Big-ticket home improvements typically drive remodeling market growth. Indeed, large projects costing $50,000 or more in 2013 made up half of all expenditures in Boston,
nearly 45 percent in Washington, DC, and 44 percent in New York City (Figure 18). To illustrate the role of large projects in boosting expenditures, spending in the 10 markets with the largest shares of major projects averaged $3,800 per home-owner, compared with just $2,500 in the 10 markets with the smallest shares of major projects. St. Louis, Pittsburgh, and Jacksonville were among the second group, with less than 15 percent of spending originating from high-cost projects.
Differences in home values and household incomes explain much of this variation. Large remodeling projects generally make sense only for higher-value homes and for owners with financial resources. For example, the average property value in the top 10 markets ranked by large project spending was $446,000—more than twice the $176,000 average in the 10 metros with the smallest shares of large project spending. In addition, owner household incomes averaged $114,000 in the top metros, compared with just $78,000 in the bottom group.
Housing affordability, measured by the ratio of incomes to home values, also plays a role. On average, owners reinvest about 1.1 percent of their home values in improvements each year. But households living in more affordable areas of the country tend to spend more than that share. In 2013, improvement spending as a share of home value was 1.8 percent or more in several Midwestern and Rustbelt cities, including Oklahoma City, Buffalo, Louisville, Kansas City, and Columbus. In less affordable areas such as San Francisco, New York, Los Angeles, and Miami, the reinvestment share was just 0.8 percent or less.
Source: Table A-5.
� Top Five Metros � Bottom Five Metros
Boston
Washington, DC
New York
Providence
San Jose
Cleveland
Kansas City
Jacksonville
Pittsburgh
St. Louis
0 5 10 15 20 25 30 35 40 45 50 55
Metro Markets with Higher Levels of Spending Also Have Larger Shares of High-Cost ProjectsShare of Spending on Improvements Costing $50,000 or More in 2013 (Percent)
Figure 18

E M E R G I N G T R E N D S I N T H E R E M O D E L I N G M A R K E T J O I N T C E N T E R F O R H O U S I N G S T U D I E S O F H A R V A R D U N I V E R S I T Y 19
The types of projects that homeowners undertake also differ by metro area. Since discretionary improvements such as kitchen and bath remodels, room additions, and outside attachments are typically higher-end projects, they are more concentrated in metros with higher home values. Indeed, discretionary proj-ects contributed 36 percent of total outlays in the 10 metro markets with the highest home values, compared with just 25 percent in the 10 markets with the lowest home values. For example, discretionary projects accounted for 40 percent or more of total spending in Boston, Los Angeles, and San Francisco, but only 20 percent or less in Kansas City, Dallas, and Oklahoma City.
At the same time, energy-sensitive projects—including replace-ments of roofing, siding, windows and doors, insulation, and HVAC systems—made up the largest share of expenditures in sev-eral mid-sized markets such as Buffalo, Milwaukee, Providence, Charlotte, and Nashville. Not surprisingly, per household spending on energy-sensitive improvements was highest in the Northeast, where the housing stock is older and the winters harsher. Several metros in the middle of the country—including Oklahoma City, Milwaukee, Louisville, Denver, and Minneapolis—also posted higher than average energy-sensitive spending. Incentives for energy retrofits are likely a factor, with fully 39 of the 50 states providing subsidies in one form or another in 2014. For instance, Wisconsin offers rebates to help offset the costs of air-sealing
and insulation, while Minnesota provides low-interest loans for certain energy-efficient improvements.
CONTRIBUTIONS OF YOUNGER AND OLDER HOUSEHOLDS Housing affordability is a key factor in the geographic distribu-tion of remodeling activity. Younger households contribute larger shares of improvement spending in metros with lower house prices, where they are more able to buy and invest in first homes. Indeed, areas with the largest shares of spending by young households are significantly more affordable, with prices aver-aging $210,000. By comparison, home values in markets where young homeowners account for the smallest share of improve-ment spending average $400,000. For example, younger house-holds accounted for 12–14 percent of remodeling expenditures in lower-cost metros such as Cincinnati, St. Louis, Philadelphia, and Denver (Figure 19). Although younger households typically have lower incomes, their spending in these top 10 markets still averaged $2,900 annually. The relatively large shares of younger households already active in these home improvement markets suggest a strong base for future spending.
Meanwhile, the markets with the largest shares of improve-ment spending by older adults are concentrated mainly in the South Atlantic and Southwest regions. In Tucson, Miami, Tampa, Virginia Beach, Las Vegas, and Phoenix, older house-
Note: Analysis includes esitmates for 50 metro markets using data pooled from the 2011 and 2013 American Housing Surveys.
Source: JCHS tabulations of HUD, American Housing Surveys.
� Top 10 Metros with Largest Share of Spending by Owners Under Age 35
� Top 10 Metros with Largest Share of Spending by Owners Age 65 and Over
Cinc
inna
tiSt
. Lou
isPh
ilade
lphi
a
Denve
rM
ilwau
kee
Prov
iden
ce
Detro
itNew
Orle
ans
Kans
as C
ityM
emph
is
Tucs
on
Miam
iPr
ovid
ence
Tam
paVi
rgin
ia Bea
chLa
s Veg
asPh
oeni
xJa
ckso
nvill
eM
ilwau
kee
San
Anto
nio
35
30
25
20
15
10
5
0
Metro Areas with High Shares of Spending by Younger or Older Households Are Typically More A�ordable Share of Improvement Spending in 2013 (Percent)
Figure 19

E M E R G I N G T R E N D S I N T H E R E M O D E L I N G M A R K E T J O I N T C E N T E R F O R H O U S I N G S T U D I E S O F H A R V A R D U N I V E R S I T Y 20
holds provided at least 27 percent of remodeling expenditures in 2013. Home values in these areas are also more moderate, but because incomes tend to fall during the retirement years, per homeowner outlays in the top 10 areas for older household spending averaged only $2,700.
Even so, households in this age group represent a large and growing market for universal design features that allow aging in place. Metro areas with high concentrations of households aged 55–64 should see increasing demand for accessibility retrofits in the coming years. Riverside, Portland, New Orleans, Birmingham, and Cleveland already report high shares of improvement spending by households in this age group. Other areas with large shares of older residents included Baltimore, Richmond, St. Louis, and Philadelphia.
The need for accessibility improvements will be particularly acute in the Midwest and Northeast, where less than one-third of homes have no-step entries versus nearly half of homes in the South and West. In addition, fully 43 percent of homes in the Northeast and 28 percent in the Midwest lack a bedroom and full bath on the first floor, compared with 19 percent in the West and 16 percent in the South.
RENEWAL OF THE RENTAL STOCKIn the wake of the housing market crash, soaring demand for rental units has fueled a strong recovery in spending on
the rental stock. The Joint Center estimates that improve-ment expenditures in this market amounted to about $31 billion as of 2013, or $54 billion if maintenance and repairs are included. This translates into average annual spending of about $770 on capital improvements per rental unit and about $560 in maintenance and repairs. According to the National Apartment Association’s Annual Survey of Operating Income and Expenses, per-unit capital spending on professionally managed garden-style properties with 50 or more apartments is even higher at $900.
The NAA survey also indicates that capital investment in these rental properties increased in 2013 in nearly all regions of the country. Similar to homeowner improvement spending, aver-age annual rental expenditures in the Northeast and Pacific regions climbed sharply during the housing boom and then fell sharply during the bust, and are now well below the pre-recession peaks (Figure 20). In contrast, spending on rental properties in the interior regions has already surpassed previ-ous highs. The only region where rental spending appears to have leveled off is the Southeast, where homeowner spending has also struggled to revive.
Among professionally managed properties, top markets for rental improvement spending include San Francisco, Los Angeles, Washington, DC, Minneapolis, and Denver, where annual expenditures averaged $1,200 or more per unit over 2012–13. Compared with the previous two-year period, rental
Note: See Table W-8 for information about survey coverage and definitions.
Source: JCHS tabulations of National Apartment Association, Surveys of Operating Income and Expenses in Rental Apartment Communities.
� 2007 � 2008 � 2009 � 2010 � 2011 � 2012 � 2013
1,600
1,400
1,200
1,000
800
600
400
200
0
Mountain/South Midwest
SouthCentral
NorthMidwest
Pacific SoutheastNortheast
While Recovering Across the Nation, Rental Improvement Outlays in Formerly High–Spending Regions Still Lag Previous PeaksAverage Per-Unit Capital Expenditures for Professionally Managed Garden-Style Properties (2013 dollars)
Figure 20

E M E R G I N G T R E N D S I N T H E R E M O D E L I N G M A R K E T J O I N T C E N T E R F O R H O U S I N G S T U D I E S O F H A R V A R D U N I V E R S I T Y 21
spending rose rapidly in several metros, including certain dis-tressed markets (such as Detroit and Phoenix) as well as areas where rents were already high or rising (San Francisco, Dallas, Denver, Austin, and Washington, DC).
Metros with the lowest expenditures on apartment properties include St. Louis, San Antonio, Sacramento, and Las Vegas, averaging less than $700 per unit. In most of these areas, both rents and operating incomes were lower than average, leav-ing few resources available for reinvestment. In some cases, the rental stock is newer and thus in less need of repair. In other cases, the markets were especially hard hit by the Great Recession. The average apartment turnover rate in these met-ros is also higher, perhaps indicating greater difficulty main-taining profitability in these markets.
THE OUTLOOKAs house prices and incomes continue to recover, homeowner improvement spending should pick up steam, particularly in the West. Given their higher mobility rates and higher incomes, homeowners in markets such as San Francisco, Sacramento, Las Vegas, and San Jose are likely to boost their spending on improvements. In other areas such as Phoenix and Denver, however, spending growth is expected to moderate from its recent strong pace. Meanwhile, homeowner improvement spending in many metros of the Northeast should remain strong, although growth in other regions will gradually close some of the gap in performance.
In the Midwest and South, homeowner spending growth should be more moderate but also more stable. With significant shares of their owner-occupied housing stocks built before the 1960s, Detroit, Chicago, Cincinnati, and St. Louis should
all see a pickup in improvement expenditures. In the South Atlantic region, remodeling activity in Florida metros such as Jacksonville and Orlando is also expected to revive as home values recover. However, the relatively new owner-occupied stock in this region will limit spending gains in these and simi-lar areas. Other Southern metros where improvement spend-ing is likely to increase include Houston and Richmond, where recent activity has been lower than expected.
On the rental property side, remodeling expenditures are expect-ed to remain strong, although growth could moderate in a hand-ful of metro areas if new construction results in excess supply. Overall, though, this market is likely to grow as rental demand and rents continue to rise, especially in the Northeast and West. At the same time, affordability concerns in several major markets are likely to shift demand toward middle-market rentals. These properties may in turn see stronger investment relative to the higher-end, professionally managed stock.
Single-family rentals are also a potential growth market for remodelers. From 2006 to 2013, about 3.6 million single-family homes were added on net to the pool of units either rented or for rent. The American Community Survey indicates that met-ros where at least 100,000 single-family homes were converted to rentals include Phoenix, Los Angeles, and Atlanta. Given the larger average size of single-family homes, as well as the higher turnover rates and maintenance needs of rentals, prop-erty owners will have to make significant investments to repair and update this stock.

E M E R G I N G T R E N D S I N T H E R E M O D E L I N G M A R K E T J O I N T C E N T E R F O R H O U S I N G S T U D I E S O F H A R V A R D U N I V E R S I T Y 22
During the housing boom, rapidly appreciating home values and the resulting increase in home equity, coupled with very accommodating lending standards, helped to fuel the upper-end improvement market. In 2005, homeowners that were in the top 1 percent of spenders accounted for more than one-third of total spending. Today, though, several socioeconomic and demographic changes are shifting consumer demand to smaller-scale and more targeted projects. As a result, more than 57 percent of homeowners reported spending on home improvements in 2012–13 (a slightly higher share than during the 2002–07 upturn), while the top 1 percent contributed less than one-quarter of the total.
Chief among the trends driving this shift in the remodeling market are the delayed entrance of the large millennial gener-ation into homeownership; the aging of the baby boomers into their retirement years; the ongoing decline in the US house-hold mobility rate; and increasing environmental awareness and technological sophistication, particularly among younger households. With these changes come opportunities for stron-ger growth in spending in several key areas: improvements to the rental stock, retrofits of existing homes to improve acces-sibility, and system upgrades that are environmentally sustain-able. The DIY market is also poised for a rebound.
REINVESTING IN THE RENTAL STOCKSince the housing downturn, the share of US households that rent rather than own their homes has increased. Indeed, the national rentership rate for households under age 35 stood at 64 percent in 2014, its highest level in three decades. For many of these younger households, the decision to rent reflects lifestyle preferences for more urban locations, hous-
With the home improvement
market nearing full recovery,
spending growth is likely to
moderate. Indeed, given the
demographic and economic
obstacles facing the industry,
generating even modest increases
in the near term could be a
challenge. Fortunately, several
emerging market niches will
give momentum to growth over
the longer run even as spending
in some traditional segments
stabilizes.
OPPORTUNITIES FOR GROWTH
5
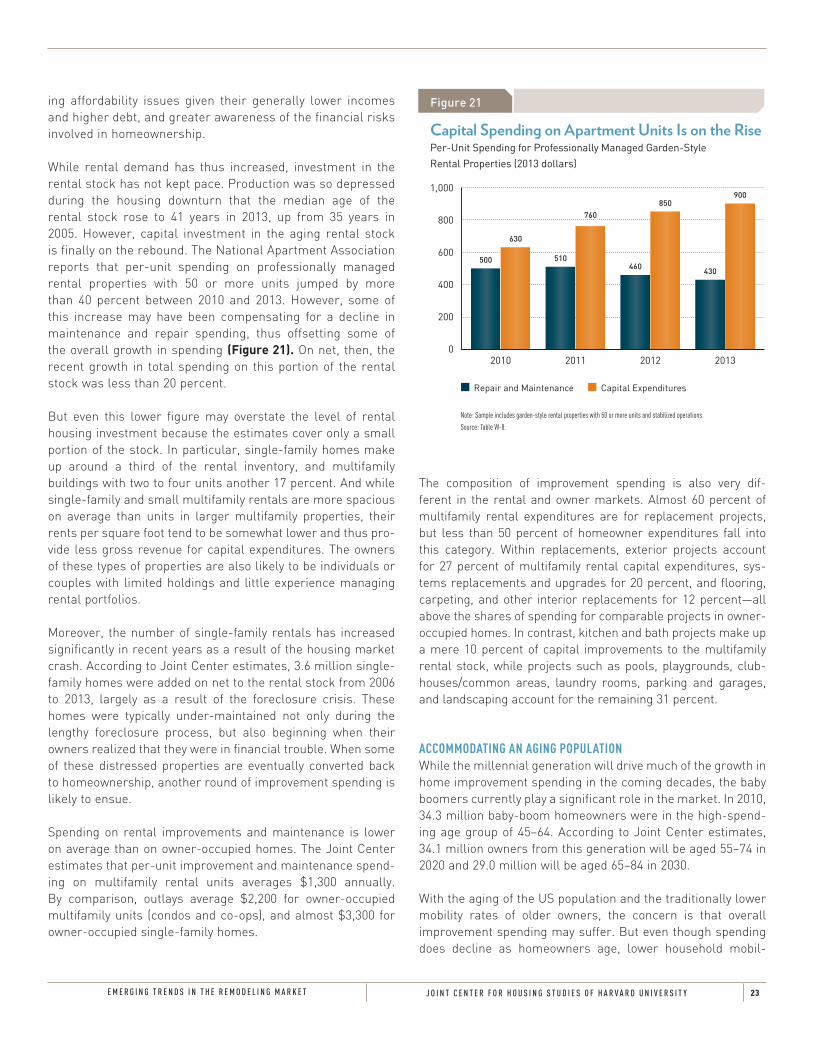
E M E R G I N G T R E N D S I N T H E R E M O D E L I N G M A R K E T J O I N T C E N T E R F O R H O U S I N G S T U D I E S O F H A R V A R D U N I V E R S I T Y 23
ing affordability issues given their generally lower incomes and higher debt, and greater awareness of the financial risks involved in homeownership.
While rental demand has thus increased, investment in the rental stock has not kept pace. Production was so depressed during the housing downturn that the median age of the rental stock rose to 41 years in 2013, up from 35 years in 2005. However, capital investment in the aging rental stock is finally on the rebound. The National Apartment Association reports that per-unit spending on professionally managed rental properties with 50 or more units jumped by more than 40 percent between 2010 and 2013. However, some of this increase may have been compensating for a decline in maintenance and repair spending, thus offsetting some of the overall growth in spending (Figure 21). On net, then, the recent growth in total spending on this portion of the rental stock was less than 20 percent.
But even this lower figure may overstate the level of rental housing investment because the estimates cover only a small portion of the stock. In particular, single-family homes make up around a third of the rental inventory, and multifamily buildings with two to four units another 17 percent. And while single-family and small multifamily rentals are more spacious on average than units in larger multifamily properties, their rents per square foot tend to be somewhat lower and thus pro-vide less gross revenue for capital expenditures. The owners of these types of properties are also likely to be individuals or couples with limited holdings and little experience managing rental portfolios.
Moreover, the number of single-family rentals has increased significantly in recent years as a result of the housing market crash. According to Joint Center estimates, 3.6 million single-family homes were added on net to the rental stock from 2006 to 2013, largely as a result of the foreclosure crisis. These homes were typically under-maintained not only during the lengthy foreclosure process, but also beginning when their owners realized that they were in financial trouble. When some of these distressed properties are eventually converted back to homeownership, another round of improvement spending is likely to ensue.
Spending on rental improvements and maintenance is lower on average than on owner-occupied homes. The Joint Center estimates that per-unit improvement and maintenance spend-ing on multifamily rental units averages $1,300 annually. By comparison, outlays average $2,200 for owner-occupied multifamily units (condos and co-ops), and almost $3,300 for owner-occupied single-family homes.
The composition of improvement spending is also very dif-ferent in the rental and owner markets. Almost 60 percent of multifamily rental expenditures are for replacement projects, but less than 50 percent of homeowner expenditures fall into this category. Within replacements, exterior projects account for 27 percent of multifamily rental capital expenditures, sys-tems replacements and upgrades for 20 percent, and flooring, carpeting, and other interior replacements for 12 percent—all above the shares of spending for comparable projects in owner-occupied homes. In contrast, kitchen and bath projects make up a mere 10 percent of capital improvements to the multifamily rental stock, while projects such as pools, playgrounds, club-houses/common areas, laundry rooms, parking and garages, and landscaping account for the remaining 31 percent.
ACCOMMODATING AN AGING POPULATIONWhile the millennial generation will drive much of the growth in home improvement spending in the coming decades, the baby boomers currently play a significant role in the market. In 2010, 34.3 million baby-boom homeowners were in the high-spend-ing age group of 45–64. According to Joint Center estimates, 34.1 million owners from this generation will be aged 55–74 in 2020 and 29.0 million will be aged 65–84 in 2030.
With the aging of the US population and the traditionally lower mobility rates of older owners, the concern is that overall improvement spending may suffer. But even though spending does decline as homeowners age, lower household mobil-
Note: Sample includes garden-style rental properties with 50 or more units and stabilized operations.
Source: Table W-8.
1,000
800
600
400
200
02010 2011 2012 2013
� Repair and Maintenance � Capital Expenditures
500
630
510
760
460
850
430
900
Capital Spending on Apartment Units Is on the RisePer-Unit Spending for Professionally Managed Garden-Style Rental Properties (2013 dollars)
Figure 21

E M E R G I N G T R E N D S I N T H E R E M O D E L I N G M A R K E T J O I N T C E N T E R F O R H O U S I N G S T U D I E S O F H A R V A R D U N I V E R S I T Y 24
ity within a given age range does not necessarily imply lower spending. In fact, improvement spending in 2013 was actually modestly higher among owners aged 55–64 who had lived in their current homes for 20 years or more compared to that of same-aged owners with shorter tenure (Figure 22).
Many owners in their mid-50s to mid-60s begin to consider their post-retirement housing needs. Given that much of the US housing stock lacks basic accessibility features, how-ever, many of these older households will have to modify their homes to age safely in place. While over three-quarters of homes owned by households aged 55 and over have a bedroom and full bath on the entry level, only about 60 percent of these homes have no steps between rooms, and less than half have a no-step entry (Figure 23). In total, less than a quarter of homes occupied by older owners have all of these features. Other accessibility features needed by those with more limited mobility are even less common. For example, only one in ten homes occupied by older owners have extra-wide hallways and doors, while less than 1 percent of older homeowners living in multi-story units have an in-home elevator.
Home builders are responding to the emerging need for more accessible housing, and newly constructed homes could dra-matically reduce the gap between demand and supply. The problem, however, is the mismatch between where the aging population lives and where more accessible homes are being built. Households aged 55 and over are spread proportion-ately across the country, with a slightly higher concentration in slower-growing Frostbelt locations. In fact, the states with the largest shares of older households in 2013 were Delaware, Maine, Michigan, Montana, Pennsylvania, Vermont, and West Virginia (in addition to Florida, Hawaii, and New Mexico). Meanwhile, almost three-quarters of new homes built in the last decade are located in the South and West.
3,500
3,000
2,500
2,000
1,500
1,000
500
055 to 64 65 to 74
Age of Homeowner
75 and Over
Note: Tabulations use JCHS-adjusted weights.
Source: JCHS tabulations of HUD, American Housing Survey.
Years in Home: � Under 10 � 10 to 19 � 20 and Over
For Older Owners, Improvement Expenditures Decline with Age But Not with Length of TenureAverage Annual Per-Owner Spending in 2013 (Dollars)
Figure 22
90
80
70
60
50
40
30
20
10
0Bedroom andFull Bath onEntry Level
No StepsBetweenRooms
No StepEntry Into
Home
WheelchairAccessibleBathroom
WheelchairAccessible
Kitchen
Extra-WideHallways and
Doors
In-HomeElevator
Note: In-unit elevators are computed for multi-story homes only.
Source: JCHS tabulations of HUD, American Housing Survey.
76.5
61.3
44.942.1
32.2
10.2
0.5
Many of the Homes Owned by Older Households Lack the Accessibility Features that Enable Aging in PlaceShare of Units Owned by Households Aged 55 and Over with Accessibility Feature in 2011 (Percent)
Figure 23

E M E R G I N G T R E N D S I N T H E R E M O D E L I N G M A R K E T J O I N T C E N T E R F O R H O U S I N G S T U D I E S O F H A R V A R D U N I V E R S I T Y 25
As a result, many older households in slower-growing regions of the country will likely have to retrofit their existing homes with accessibility features rather than move to new homes. The Joint Center has estimated that even if every new home pro-jected to be built over the coming decade in the Northeast and Midwest had basic accessibility features, the shortfall between the supply of and demand for these units would still be almost a million homes.
PROMOTING ENVIRONMENTAL SUSTAINABILITYWith the growing popularity of energy efficiency retrofits over the past three decades, home improvement projects that promote environmental sustainability have accounted for a growing share of spending. Sustainable projects are defined as those motivated by one or more of the following objectives: energy efficiency; water efficiency and conservation; healthy home/indoor air quality; use of recycled building products; use of rapidly renew-able materials; home automation related to other sustainability goals; and utilization of renewable energy sources.
Recent surveys conducted by the Joint Center and the Farnsworth Group found that sustainable home improvement projects generate about 30 percent of revenue at full-service remodeling firms. Moreover, more than four out of five con-tractors report that sustainable projects account for at least 10 percent of their revenue. Energy efficiency projects are far and away the most common subcategory, with 84 percent of respondents indicating that they had installed these types of improvements during the previous year (Figure 24). Projects
related to water efficiency, home health, and use of recycled products are the next most popular subcategories, with about half of contractors indicating that they had recently installed such improvements. Projects related to home automation and renewable energy are much less commonly installed by the typical full-service remodeler, in part because specialty firms have sprung up to serve these markets.
Of the households reporting home improvement spending in 2012 or 2013 in the American Housing Survey, 20 percent indicated that at least one of their projects was for energy efficiency purposes. A broad cross-section of homeowners has made energy efficiency a priority. For example, lower-income owners were almost as likely as those with higher incomes to pursue such improvements. Similarly, younger owners and recent homebuyers (who might be expected to have a long list of competing home improvement priorities) were almost as likely as other households to undertake energy efficiency upgrades.
Interest in most sustainable home improvement categories seems to be on the upswing. Although recent increases in domestic energy production and falling costs may reduce some of the momentum behind energy efficiency investments, other areas remain strong. In particular, spending on projects related to healthy homes and indoor air quality is increasing. According to a 2014 Joint Center/Farnsworth Group survey, almost a quarter of owner respondents indicated some degree of concern about the health impacts of their homes, and one in 20 expressed major or moderate concern over whether their
Notes: Respondents were asked to select sustainable remodeling projects that their companies had installed over the previous year. Estimates are averages for the 2013:3, 2014:1, and 2014:3 surveys.
Source: JCHS/Farnsworth Group Survey on Environmental Sustainability Trends in Remodeling.
0 10 20 30 40 50 80 9060 70
Energy Efficiency
Water Efficiency/Conservation
Healthy Home/Indoor Air Quality
Use of Recycled Products/Reuse of Existing Materials
Use of Rapidly Renewable Materials
Home Automation
Renewable Energy
Projects that Boost Energy E�ciency Remain the Most Popular Sustainable Improvements Share of Contractors Reporting Installation of Environmentally Sustainable Projects (Percent)
Figure 24
84
56
54
49
34
28
14

E M E R G I N G T R E N D S I N T H E R E M O D E L I N G M A R K E T J O I N T C E N T E R F O R H O U S I N G S T U D I E S O F H A R V A R D U N I V E R S I T Y 26
homes negatively affected the health of household members. Renters are even more apprehensive about conditions, with over a third conveying some level of concern and one in six indicating that healthy home issues are a problem.
REBOUND IN DO-IT-YOURSELF ACTIVITY From 1995 to 2005, the DIY share of home improvement spending averaged around 25 percent. The DIY share of home improvement product purchases is much higher, however, because costs for DIY projects include only materials while costs for professionally installed projects also include labor, profit, and overhead. A 25 percent share of spending on DIY projects could thus imply that upwards of 45 percent of remod-eling materials purchases are installed on a DIY basis.
Since 2005, though, the DIY share of home improvement spend-ing has been on the decline, falling to 17 percent in 2013. The DIY share of home improvement activity is associated with the types of projects undertaken, and key homeowner characteris-tics such as age, income, household composition, and racial and ethnic mix. All of these factors now point to a turnaround in DIY activity in the coming years.
The recent increase in spending on discretionary home improve-ment projects is the clearest sign of an imminent rebound. About a quarter of spending on discretionary projects (kitchens, baths, and other additions and alterations) is DIY—significantly higher than the 14 percent share of spending on replacement projects. As the discretionary share of spending returns to more traditional levels, the DIY share should thus follow suit.
The potential for additional growth in discretionary home improvement activity is largely due to changing demographic characteristics—specifically, the impending move of the young, diverse millennial generation into the home improvement mar-ket. Younger homeowners devote a larger share of their spend-ing to DIY projects. Indeed, owners under age 35 spent a third of their budgets on DIY projects in 2013, while owners aged 65 and over spent just 11 percent. Income levels also affect the DIY share. More than 20 percent of spending by non-elderly households in the lowest income quintile was on DIY projects, compared with less than 13 percent by those in the highest income quintile.
With the exception of blacks, most racial and ethnic minorities also devote a larger share of their home improvement spend-
ing to DIY projects than whites. In addition, married-couple owners spend a slightly larger share of their improvement dol-lars on DIY projects than do single-person households.
Even though the DIY share did not increase in 2013, overall market growth pushed total DIY spending up from $32.0 billion in 2011 to $33.5 billion. This was the first DIY spending increase since the market peaked in 2007 (Figure 25). The movement of the large millennial generation into the housing market and ultimately into homeownership should propel even stronger growth in DIY spending moving forward. With their moderate incomes and growing racial/ethnic diversity, these households have the key characteristics associated with higher shares of DIY activity.
Beyond the DIY market, millennials are key to the remodeling outlook. With the baby boomers still active in the market and the gen-Xers in their prime home improvement years, spend-ing on remodeling has a solid base on which to build. The mil-lennials’ increasing presence in the rental market has already helped to boost improvement spending in that segment, and it is only a matter of time before this generation becomes more active in the owner-occupied housing market. As that transition occurs, the millennial generation will support strong growth in home improvement spending for decades to come.
Note: Tabulations of 2013 data use JCHS-adjusted weights.
Source: JCHS tabulations of HUD, American Housing Survey.
60
50
40
30
20
10
01995 1997 1999 2001 2003 2005 2007 2009 2011 2013
2024 25
29
36
4549
39
32 34
The DIY Market Has Finally Begun to RecoverDo-It-Yourself Improvement Expenditures (Billions of dollars)
Figure 25

E M E R G I N G T R E N D S I N T H E R E M O D E L I N G M A R K E T J O I N T C E N T E R F O R H O U S I N G S T U D I E S O F H A R V A R D U N I V E R S I T Y 27
Table A-1 ........................Homeowner Improvement Expenditures: 2013
Table A-2 ........................Professional and Do-It-Yourself Home Improvement Expenditures: 2013
Table A-3 ........................Improvement Expenditures by Homeowner Characteristics: 2013
Table A-4 ........................Professional and Do-It-Yourself Improvement Expenditures by Homeowner Characteristics: 2013
Table A-5 ........................Metropolitan Trends in Home Improvement and Repair Spending: 2013
The following Web tables provide historical data on improvement spending and additional homeowner detail such as income quintiles, nativity, metro status, and recent mover status. Visit the Joint Center’s website at www.jchs.harvard.edu.
Table W-1 .......................Homeowner Improvement Expenditures: 1995–2013
Table W-2 .......................Professional Home Improvement Expenditures: 1995–2013
Table W-3 .......................Do-It-Yourself Home Improvement Expenditures: 1995–2013
Table W-4 .......................Improvement Expenditures by Homeowner Characteristics: 1995-2013
Table W-5 .......................Professional Improvement Expenditures by Homeowner Characteristics: 1995–2013
Table W-6 .......................Do-It-Yourself Improvement Expenditures by Homeowner Characteristics: 1995–2013
Table W-7 .......................Homeowner Maintenance and Repair Expenditures: 1995–2013
Table W-8 .......................Trends in Rental Apartment Property Spending: 2007-2013
6APPENDIX TABLES

E M E R G I N G T R E N D S I N T H E R E M O D E L I N G M A R K E T J O I N T C E N T E R F O R H O U S I N G S T U D I E S O F H A R V A R D U N I V E R S I T Y 28
Homeowner Improvement Expenditures: 2013 Table A-1
Homeowners Reporting Projects (000s)
Average Expenditure($)
Total Expenditures (Millions of $)
DISCRETIONARY 5,138 11,318 58,147Kitchen Remodels 1,826 9,459 17,273 Minor 1,059 3,207 3,398 Major 767 18,097 13,876
Bath Remodels 2,459 4,844 11,910 Minor 1,348 1,558 2,101 Major 1,111 8,829 9,809
Room Additions and Alterations 1,765 13,314 23,496 Kitchen Addition 28 34,699 976 Bath 342 8,294 2,834
Created finished bathroom from unfinished space 111 7,325 812Added bathroom onto home 90 12,822 1,151Bathroom created through structural changes 141 6,173 871
Bedroom 550 14,506 7,984 Created finished bedroom from unfinished space 192 6,758 1,296 Added bedroom onto home 132 39,536 5,233 Bedroom created through structural changes 226 6,429 1,455
Other 1,210 9,673 11,702 Created finished recreation room from unfinished space 199 9,661 1,921 Created other finished inside room from unfinished space 380 7,146 2,713 Added other inside room onto home 175 23,306 4,083 Other room created through structural changes 456 6,544 2,985
Outside Attachments 730 7,489 5,468 Porch/Deck 633 5,867 3,714
Added porch onto home 290 5,594 1,625 Added deck onto home 343 6,099 2,089
Garage/Carport 121 14,439 1,754 Added attached garage onto home 61 23,606 1,450 Added carport onto home 60 5,069 305
REPLACEMENT 18,751 4,889 91,681Systems and Equipment Additions & Replacements 12,671 2,375 30,097
Internal water pipes 1,461 1,148 1,677 Plumbing fixtures 4,038 933 3,769 Electrical wiring, fuse boxes or breaker switches 2,220 1,228 2,726 HVAC 4,445 3,782 16,808
Central air conditioning 2,215 4,187 9,275 Built-in heating equipment 2,230 3,378 7,533
Appliances/Major Equipment 8,597 595 5,117 Water heater 3,245 794 2,577 Built-in dishwasher 2,360 611 1,443 Garbage disposal 1,636 183 299 Security system 1,356 589 799
Exterior Additions & Replacements 7,127 5,467 38,962 Roofing 3,628 6,485 23,525 Siding 1,055 4,594 4,846 Windows or doors 3,894 2,720 10,591
Interior Additions & Replacements 7,705 2,936 22,622 Insulation 1,625 1,187 1,929 Flooring/Paneling/Ceiling 8,433 2,021 17,046
Wall-to-wall carpeting 2,215 2,086 4,620 Other flooring such as wood, tile, marble, or vinyl 4,346 2,297 9,980 Paneling or ceiling tiles 1,872 1,306 2,445
Other major improvements inside home 832 4,386 3,647
OTHER 6,510 6,475 42,156Disaster Repairs 1,138 13,896 15,819
Other Property Additions & Replacements 7,125 3,697 26,336Other outside structure 217 6,071 1,315Septic tank 176 3,328 585Driveways or walkways 1,840 2,976 5,475Fencing or walls 1,880 1,915 3,600Patio, terrace, or detached deck 1,293 3,928 5,081Swimming pool, tennis court, or other recreational structure 372 8,289 3,087Shed, detached garage, or other building 909 5,892 5,356Other major improvements or repairs to lot or yard 438 4,197 1,838
Total 21,736 8,833 191,984
Notes: Homeowner numbers do not add to total because respondents may report projects in more than one category. Major remodels are defined as professional home improvements of more than $10,000 for kitchen projects and more than $5,000 for bath projects, and DIY improvements of more than $4,000 for kitchen projects and $2,000 for bath projects. Tabulations use JCHS-adjusted weights. For more information about the re-weighting methodology, see www.jchs.harvard.edu/research/improving-americas-housing.
Source: JCHS tabulations of HUD, American Housing Survey.

E M E R G I N G T R E N D S I N T H E R E M O D E L I N G M A R K E T J O I N T C E N T E R F O R H O U S I N G S T U D I E S O F H A R V A R D U N I V E R S I T Y 29
Professional and Do-It-Yourself Home Improvement Expenditures: 2013 Table A-2
Professional Do-It-Yourself
Homeowners Reporting Projects
(000s)Average Expenditure
($)
Total Expenditures (Millions of $)
Homeowners Reporting Projects
(000s)
Average Expenditure
($)
Total Expenditures (Millions of $)
DISCRETIONARY 3,210 13,816 44,353 2,836 4,864 13,794
Kitchen Remodels 1,068 28,401 12,432 758 13,051 4,841
Minor 670 4,109 2,752 390 1,656 645
Major 398 24,292 9,680 368 11,394 4,196
Bath Remodels 1,343 6,650 8,933 1,116 2,668 2,977
Minor 715 2,217 1,584 633 815 516
Major 629 11,690 7,349 482 5,101 2,460
Room Additions and Alterations 908 20,231 18,379 886 5,775 5,118
Kitchen 21 41,269 881 7 14,070 96
Bath 168 13,254 2,229 153 3,941 605
Bedroom 246 25,981 6,398 252 6,300 1,586
Other 548 16,183 8,871 556 5,092 2,831
Outside Attachments 428 10,773 4,609 302 2,841 859
Porch/Deck 353 8,332 2,945 272 2,830 769
Garage/Carport 86 19,427 1,664 35 2,595 90
REPLACEMENT 14,026 5,601 78,557 7,764 1,690 13,124
Systems and Equipment Additions & Replacements 8,853 2,903 25,702 5,116 859 4,395
Internal Water Pipes 889 1,598 1,421 572 448 256
Plumbing Fixtures 2,074 1,292 2,681 1,964 554 1,088
Electrical System 1,464 1,540 2,256 756 622 470
HVAC 3,033 5,131 15,560 459 2,722 1,248
Appliances/Major Equipment 4,579 827 3,785 2,884 462 1,332
Exterior Additions & Replacements 5,386 6,454 34,760 1,987 2,115 4,202
Roofing 3,059 7,099 21,713 569 3,183 1,812
Siding 779 5,665 4,412 276 1,571 433
Windows/Doors 2,505 3,448 8,635 1,390 1,408 1,957
Interior Additions & Replacements 5,074 3,566 18,095 3,200 1,415 4,527
Insulation 997 1,587 1,582 628 552 347
Flooring/Paneling/Ceiling 4,061 3,330 13,524 2,722 1,294 3,522
Other Interior 602 4,962 2,989 252 2,609 658
OTHER 4,322 8,237 35,596 2,531 2,592 6,559
Disaster Repairs 950 14,259 13,549 188 12,061 2,271
Other Property Additions & Replacements 3,508 6,285 22,048 2,378 1,804 4,289
Total 16,319 9,713 158,506 9,783 3,422 33,478
Notes: Homeowner numbers do not add to total because respondents may report projects in more than one category. Major remodels are defined as professional home improvements of more than $10,000 for kitchen projects and more than $5,000 for bath projects, and DIY improvements of more than $4,000 for kitchen projects and $2,000 for bath projects. Job categories are aggregations of the detailed projects reported in the AHS (see Table A-1). Tabulations use JCHS-adjusted weights. For more information about the re-weighting methodology, see www.jchs.harvard.edu/research/improving-americas-housing.
Source: JCHS tabulations of HUD, American Housing Survey.

E M E R G I N G T R E N D S I N T H E R E M O D E L I N G M A R K E T J O I N T C E N T E R F O R H O U S I N G S T U D I E S O F H A R V A R D U N I V E R S I T Y 30
Improvement Expenditures by Homeowner Characteristics: 2013 Table A-3
Number of Homeowners
(000s)
Homeowners Reporting Projects (000s)
Average Expenditure
($)
Total Expenditures
(Millions of $)
Income
Under $40,000 24,095 5,967 5,590 33,356
$40,000–79,999 22,360 6,410 6,966 44,654
$80,000–119,999 13,811 4,320 9,314 40,232
$120,000 and Over 14,312 4,818 15,017 72,358
Home Value
Under $100,000 19,627 5,047 4,814 24,297
$100,000–149,999 12,894 3,786 6,022 22,802
$150,000–199,999 11,358 3,414 7,191 24,551
$200,000–249,999 7,621 2,292 8,063 18,475
$250,000–399,999 13,231 3,903 11,511 44,925
$400,000 and Over 10,944 3,294 17,283 56,933
Age of Householder
Under 35 8,907 2,510 6,962 17,473
35–44 12,161 3,578 10,131 36,243
45–54 16,327 4,829 9,933 47,962
55–64 16,635 4,959 9,162 45,441
65 and Over 21,646 5,861 7,655 44,865
Generation
Millennial (Born 1985-2004) 2,877 772 6,355 4,905
Trailing Gen-X (Born 1975-84) 10,237 2,990 8,600 25,709
Leading Gen-X (Born 1965-74) 13,852 4,078 9,849 40,167
Trailing Baby Boom (Born 1955-64) 17,298 5,141 9,949 51,148
Leading Baby Boom (Born 1945-54) 15,446 4,575 8,877 40,614
Pre-Baby Boom (Born before 1945) 15,965 4,180 7,043 29,440
Race/Ethnicity
White 58,826 17,191 9,188 157,948
Black 6,355 1,758 6,375 11,208
Hispanic 6,738 1,787 7,781 13,903
Asian 2,593 655 9,734 6,379
Multirace 1,163 345 7,392 2,547
Spending Level
Under $2,500 9,309 9,309 838 7,797
$2,500–4,999 3,345 3,345 3,538 11,835
$5,000–9,999 3,979 3,979 6,866 27,319
$10,000–19,999 2,853 2,853 13,537 38,618
$20,000–34,999 1,240 1,240 26,006 32,248
$35,000–49,999 445 445 41,070 18,270
$50,000 and Over 565 565 98,961 55,897
No Projects 53,940
Total 75,676 21,736 8,833 191,984
Notes: Income data exclude households that did not respond to the question. White, black, Asian, and multirace householders are non-Hispanic. Hispanic householders may be of any race. Tabulations use JCHS-adjusted weights. For more information about the re-weighting methodology, see www.jchs.harvard.edu/research/improving-americas-housing.
Source: JCHS tabulations of HUD, American Housing Survey.

E M E R G I N G T R E N D S I N T H E R E M O D E L I N G M A R K E T J O I N T C E N T E R F O R H O U S I N G S T U D I E S O F H A R V A R D U N I V E R S I T Y 31
Professional and Do-It-Yourself Improvement Expenditures by Homeowner Characteristics: 2013Table A-4
Number of Homeowners
(000s)
Professional Do-It-Yourself
Homeowners Reporting Projects
(000s)
AverageExpenditure
($)
Total Expenditures (Millions of $)
Homeowners Reporting Projects
(000s)
AverageExpenditure
($)
Total Expenditures (Millions of $)
Income
Under $40,000 24,095 4,356 6,346 27,642 2,494 2,291 5,714
$40,000–79,999 22,360 4,594 7,683 35,294 3,119 3,001 9,360
$80,000–119,999 13,811 3,205 10,020 32,115 2,095 3,874 8,117
$120,000 and Over 14,312 4,008 15,599 62,519 1,957 5,028 9,360
Home Value
Under $100,000 19,627 3,375 5,338 18,017 2,602 2,414 6,280
$100,000–149,999 12,894 2,742 6,448 17,684 1,846 2,772 5,118
$150,000–199,999 11,358 2,556 7,771 19,859 1,629 2,881 4,693
$200,000–249,999 7,621 1,777 8,170 14,521 1,018 3,884 3,954
$250,000–399,999 13,231 3,063 12,437 38,096 1,625 4,203 6,830
$400,000 and Over 10,944 2,805 17,942 50,330 1,063 6,214 6,603
Age of Householder
Under 35 8,907 1,658 6,998 11,604 1,518 3,867 5,868
35–44 12,161 2,526 11,361 28,696 1,882 4,010 7,547
45–54 16,327 3,541 11,080 39,233 2,462 3,546 8,730
55–64 16,635 3,773 10,335 38,999 2,122 3,036 6,442
65 and Over 21,646 4,820 8,293 39,974 1,800 2,718 4,891
Generation
Millennial (Born 1985-2004) 2,877 492 6,390 3,145 457 3,852 1,760
Trailing Gen-X (Born 1975-84) 10,237 2,036 9,085 18,492 1,752 4,120 7,217
Leading Gen-X (Born 1965-74) 13,852 2,910 11,200 32,588 2,148 3,529 7,579
Trailing Baby Boom (Born 1955-64) 17,298 3,813 11,125 42,421 2,450 3,562 8,727
Leading Baby Boom (Born 1945-54) 15,446 3,603 9,810 35,342 1,759 2,998 5,272
Pre-Baby Boom (Born before 1945) 15,965 3,466 7,652 26,517 1,218 2,400 2,105
Race/Ethnicity
White 58,826 12,892 10,170 131,105 7,782 3,449 26,843
Black 6,355 1,457 6,482 9,444 631 2,797 1,763
Hispanic 6,738 1,182 9,026 10,668 982 3,293 3,235
Asian 2,593 534 9,935 5,304 220 4,888 1,075
Multirace 1,163 254 7,810 1,985 168 3,345 562
Spending Level
Under $2,500 9,309 5,360 869 4,658 4,939 635 3,138
$2,500–4,999 3,345 2,734 3,215 8,791 1,339 2,274 3,044
$5,000–9,999 3,979 3,481 6,280 21,857 1,525 3,581 5,462
$10,000–19,999 2,853 2,633 12,058 31,751 1,166 5,889 6,867
$20,000–34,999 1,240 1,151 23,539 27,089 441 11,692 5,159
$35,000–49,999 445 416 36,511 15,192 159 19,371 3,079
$50,000 and Over 565 544 90,397 49,168 214 31,441 6,729
No Projects 53,940
Total 75,676 16,319 9,713 158,506 9,783 3,422 33,478
Notes: Income data exclude households that did not respond to the question. White, black, Asian, and multirace householders are non-Hispanic. Hispanic householders may be of any race. Tabulations use JCHS-adjusted weights. For more information about the re-weighting methodology, see www.jchs.harvard.edu/research/improving-americas-housing.
Source: JCHS tabulations of HUD, American Housing Survey.

E M E R G I N G T R E N D S I N T H E R E M O D E L I N G M A R K E T J O I N T C E N T E R F O R H O U S I N G S T U D I E S O F H A R V A R D U N I V E R S I T Y 32
Metropolitan Trends in Home Improvement and Repair Spending: 2013Table A-5
Metropolitan Area
Owner-Occupied HomesGarden-Style Rental
Apartment Properties
Share of Homeowners
Reporting Projects (Percent)
Share of Spending on
Improvements Costing $50,000
or More (Percent)
Average Annual Per-Owner Improvement Spending ($)
Average Annual Capital Expenditures
per Unit ($)
Average Annual
Repair and Maintenance Expenditures
per Unit ($)Total Professional Do-It-Yourself Discretionary Replacements
Energy-Sensitive
Atlanta, GA* 31 24 3,050 2,660 390 1,050 1,380 1,100 800 460Austin, TX 32 38 3,480 2,970 510 1,420 1,250 980 1,060 440Baltimore, MD 31 28 3,420 2,940 490 1,250 1,530 1,160 850 560Birmingham, AL* 28 22 2,410 2,110 310 730 1,040 850 480 400Boston, MA 30 50 4,890 4,350 540 2,160 2,030 1,320 930 660Buffalo, NY* 35 19 3,240 2,620 620 1,170 1,630 1,340 - -Charlotte, NC* 33 18 3,110 2,720 390 950 1,500 1,220 910 390Chicago, IL 27 26 2,520 2,160 360 980 1,100 910 910 530Cincinnati, OH* 33 16 2,670 2,100 570 940 1,210 960 900 420Cleveland, OH* 32 15 2,660 2,160 490 1,060 1,090 920 - -Columbus, OH* 32 34 3,120 2,620 500 1,460 1,170 940 1,110 400Dallas, TX* 33 23 2,960 2,540 420 950 1,290 1,050 1,020 470Denver, CO* 35 24 4,000 3,320 680 1,430 1,590 1,250 1,210 380Detroit, MI 27 16 1,920 1,570 350 690 870 720 1,060 410Hartford, CT 29 30 3,260 2,790 470 1,320 1,340 1,070 - -Houston, TX 27 26 2,310 1,800 510 950 880 630 780 420Indianapolis, IN* 34 17 2,870 2,290 570 1,090 1,220 990 1,020 440Jacksonville, FL 22 14 1,840 1,450 380 610 840 680 980 450Kansas City, MO* 34 15 3,160 2,760 410 1,020 1,390 1,190 840 440Las Vegas, NV 27 23 1,700 1,330 370 650 640 400 640 400Los Angeles, CA* 27 37 3,140 2,620 520 1,700 960 630 1,270 500Louisville, KY 35 21 3,460 2,870 590 1,060 1,540 1,310 - -Memphis, TN* 33 18 2,340 2,100 250 740 930 730 660 490Miami, FL 23 27 2,010 1,660 340 820 870 700 - -Milwaukee, WI* 35 20 3,370 2,850 530 1,160 1,640 1,390 - -Minneapolis, MN 32 28 3,530 2,930 600 1,420 1,440 1,180 1,520 680Nashville, TN 31 19 2,990 2,570 430 880 1,460 1,230 870 430New Orleans, LA* 24 26 2,220 1,830 390 810 910 680 - -New York, NY 25 44 3,670 3,110 560 1,180 1,130 920 - -Oklahoma City, OK 34 27 3,970 3,470 490 810 1,730 1,490 - -Orlando, FL 22 24 1,770 1,420 350 650 770 620 800 460Philadelphia, PA 32 26 3,210 2,810 410 1,290 1,300 990 960 640Phoenix, AZ* 35 32 3,840 3,380 460 1,190 1,410 1,130 960 370Pittsburgh, PA* 34 14 2,750 2,250 500 1,040 1,120 870 - -Portland, OR* 33 25 3,130 2,550 580 1,360 1,170 850 1,070 270Providence, RI* 32 42 4,020 3,310 710 1,480 1,930 1,600 - -Richmond, VA 27 25 2,420 2,030 390 850 1,010 800 840 400Riverside, CA* 28 34 2,630 2,140 490 1,170 790 550 790 540Rochester, NY 34 21 2,770 2,190 580 1,160 1,200 910 - -Sacramento, CA* 31 16 2,760 2,260 510 1,050 1,030 800 500 800St. Louis, MO* 31 13 2,380 1,910 470 780 1,000 800 660 320San Antonio, TX 30 18 2,130 1,700 430 700 970 750 550 400San Diego, CA* 28 32 3,390 2,950 450 1,770 1,010 720 970 430San Francisco, CA* 29 39 3,760 3,200 560 1,970 1,200 840 1,450 430San Jose, CA* 27 42 3,890 3,470 430 1,900 1,360 980 - -Seattle, WA 32 35 3,390 2,700 690 1,540 1,240 990 1,020 330Tampa, FL 28 26 2,440 2,060 390 920 1,070 900 1,170 510Tucson, AZ 32 21 2,420 1,990 430 950 1,080 760 820 310Virginia Beach, VA* 33 34 3,180 2,750 440 1,240 1,370 1,120 650 300Washington, DC 32 45 4,960 4,530 440 2,110 1,910 1,430 1,260 680
50 Metro Average 30 26 3,010 2,540 470 1,150 1,230 970 930 460
United States 29 29 2,540 2,090 440 1,000 980 760 880 440
Notes: Homeowner improvement spending for the 50 metro areas is pooled from the 2011 and 2013 American Housing Surveys. Spending levels in 2011 for 26 metros (indicated by asterisk) are adjusted by the CPI-U for All Items, as well as by the national change in average spending from 2011 to 2013. See Table A-1 for definitions of discretionary and replacement projects. Energy-sensitive projects include roofing, siding, windows/doors, insulation, and HVAC.
Survey data from the National Apartment Association cover rental apartment properties with 50 or more units under professional management with stabilized operations. Average annual apartment expenditures were calculated over 2012–13 for metro areas with a minimum of 2,000 apartment units and 10 properties sampled. See NAA survey for definitions of capital expenditures and repairs and maintenance.
Sources: JCHS tabulations of HUD, American Housing Surveys; National Apartment Association, Surveys of Operating Income and Expenses.

William Apgar
Kermit Baker
Pamela Baldwin
Kerry Donahue
Rachel Drew
Angela Flynn
Christopher Herbert
Elizabeth La Jeunesse
Mary Lancaster
Irene Lew
Karen Manning
Ellen Marya
George Masnick
Daniel McCue
Jennifer Molinsky
Nicolas Retsinas
Mark Richardson
Rocio Sanchez-Moyano
Alexander von Hoffman
Abbe Will
Improving America’s Housing—Emerging Trends in the Remodeling Market was prepared by the Harvard Joint Center for Housing Studies. The Center advances understanding of housing issues and informs policy. Through its research, education, and public outreach programs, the Center helps leaders in government, business, and the civic sectors make decisions that effectively address the needs of cities and communities. Through graduate and executive courses, as well as fellowships and internship opportunities, the Joint Center also trains and inspires the next generation of housing leaders.
EditorMarcia Fernald
DesignJohn Skurchak
For additional information, please contact:
Joint Center for Housing StudiesHarvard University1033 Massachusetts Avenue, 5th FloorCambridge, MA 02138
617.495.7908
www.jchs.harvard.edu
Twitter: @Harvard_JCHS

Joint Center for Housing Studies of Harvard University
FIVE DECADES OF HOUSING RESEARCH SINCE 1959