enea 2014 q3
TRANSCRIPT
Krzysztof Zamasz President of the Board
Warsaw, 12 November 2014
Dalida Gepfert Vice-President of the Board for Financial Affairs
New corporate governance allows for optimum use of organisational capabilities
Q3, Q1-Q3 2014
Paweł Orlof Vice-President of the Board for Corporate Affairs
Grzegorz Kinelski Vice-President of the Board for Commercial Affairs

2
Agenda
Energy market and key operating data
ENEA CG's results in Q3 and Q1-Q3 2014
ENEA's corporate governance
A new unit in Kozienice
Grzegorz Kinelski Vice-President of the Board for Commercial Affairs
Energy market is sensitive to actions undertaken in the EU

4
• Higher average price of baseload by 14.4% yoy
• SPOT market was affected by:
• situation on the European carbon market
• demand for energy
• introduced mechanism of compensating for operating power reserve
• deficiencies in the capacity available for the Operator of the transmission system
• significant growth in capacities installed in wind farms
• limitations in intersystem exchange
• Almost for the whole period of Q1-Q3 2014 energy prices on the forward market were in the upward trend and only during the last months of Q3 2014 a sideways trend was observable
The average price of energy in Q3 2014 was the highest in the recent ten quarters
130
140
150
160
170
180
190
200
210
220
I II III IV V VI VII VIII IX X XI XII
PLN
/MW
h
Average prices of electricity on SPOT market on PPE
Baseload - 2012 Baseload - 2013 Baseload - 2014
140
150
160
170
180
190
0
20
40
60
80
100
120
140
160
180
200
04/10/2012 29/04/2013 30/07/2013 11/10/2013 27/12/2013 25/02/2014 17/04/2014 12/06/2014 05/08/2014 30/09/2014
Prices and trading volumes - baseload for 2015
trading volume weighted average price
MW
PLN
/MW
h
5
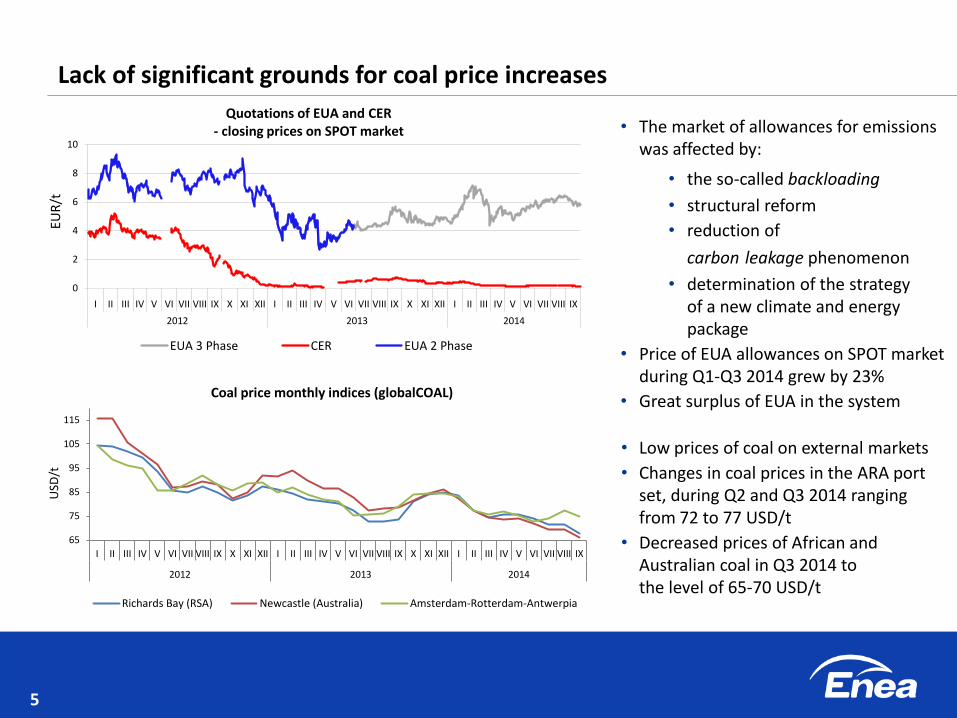
• Low prices of coal on external markets
• Changes in coal prices in the ARA port set, during Q2 and Q3 2014 ranging from 72 to 77 USD/t
• Decreased prices of African and Australian coal in Q3 2014 to the level of 65-70 USD/t
• The market of allowances for emissions was affected by:
• the so-called backloading • structural reform
• reduction of
carbon leakage phenomenon • determination of the strategy
of a new climate and energy package
• Price of EUA allowances on SPOT market during Q1-Q3 2014 grew by 23%
• Great surplus of EUA in the system
Lack of significant grounds for coal price increases
0
2
4
6
8
10
IXVIIIVIIVIVIVIIIIIIXIIXIXIXVIIIVIIVIVIVIIIIIIXIIXIXIXVIIIVIIVIVIVIIIIII
201420132012
EUR
/t
Quotations of EUA and CER - closing prices on SPOT market
EUA 3 Phase CER EUA 2 Phase
65
75
85
95
105
115
I II III IV V VI VII VIII IX X XI XII I II III IV V VI VII VIII IX X XI XII I II III IV V VI VII VIII IX
2012 2013 2014
USD
/t
Coal price monthly indices (globalCOAL)
Richards Bay (RSA) Newcastle (Australia) Amsterdam-Rotterdam-Antwerpia
6
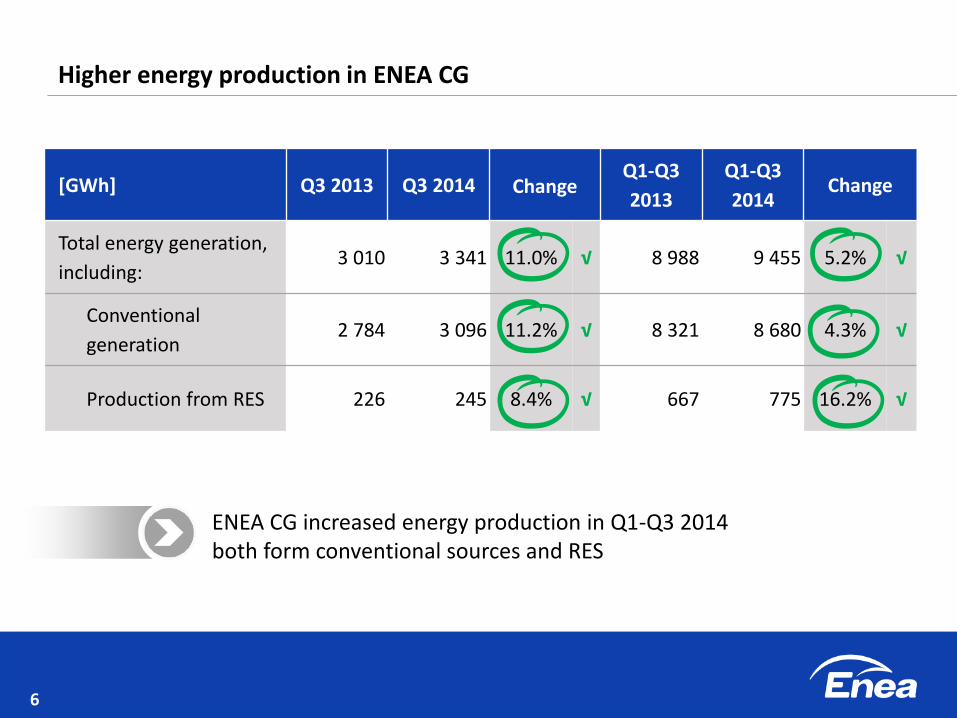
[GWh] Q3 2013 Q3 2014 Change Q1-Q3
2013
Q1-Q3
2014 Change
Total energy generation,
including: 3 010 3 341 11.0% √ 8 988 9 455 5.2% √
Conventional
generation 2 784 3 096 11.2% √ 8 321 8 680 4.3% √
Production from RES 226 245 8.4% √ 667 775 16.2% √
Higher energy production in ENEA CG
ENEA CG increased energy production in Q1-Q3 2014 both form conventional sources and RES
7
Agenda
Energy market and key operating data
ENEA CG's results in Q3 and Q1-Q3 2014
ENEA's corporate governance
A new unit in Kozienice
Dalida Gepfert Vice-President of the Board for Financial Affairs
ENEA CG reports good financial results
9
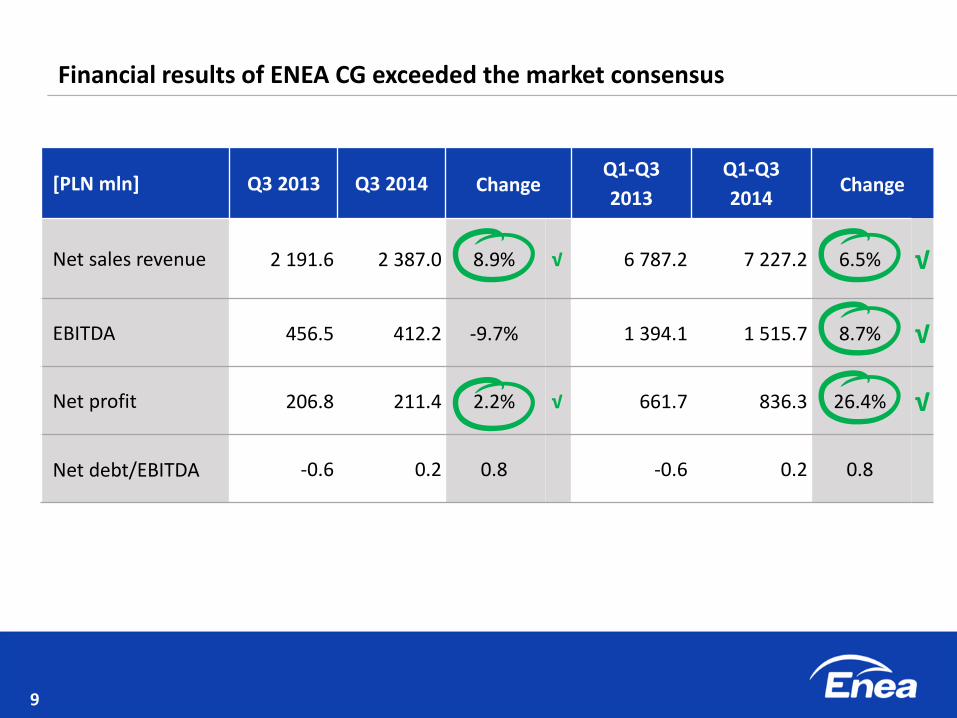
[PLN mln] Q3 2013 Q3 2014 Change Q1-Q3
2013
Q1-Q3
2014 Change
Net sales revenue 2 191.6 2 387.0 8.9% √ 6 787.2 7 227.2 6.5% √
EBITDA 456.5 412.2 -9.7% 1 394.1 1 515.7 8.7% √
Net profit 206.8 211.4 2.2% √ 661.7 836.3 26.4% √
Net debt/EBITDA -0.6 0.2 0.8 -0.6 0.2 0.8
Financial results of ENEA CG exceeded the market consensus
10
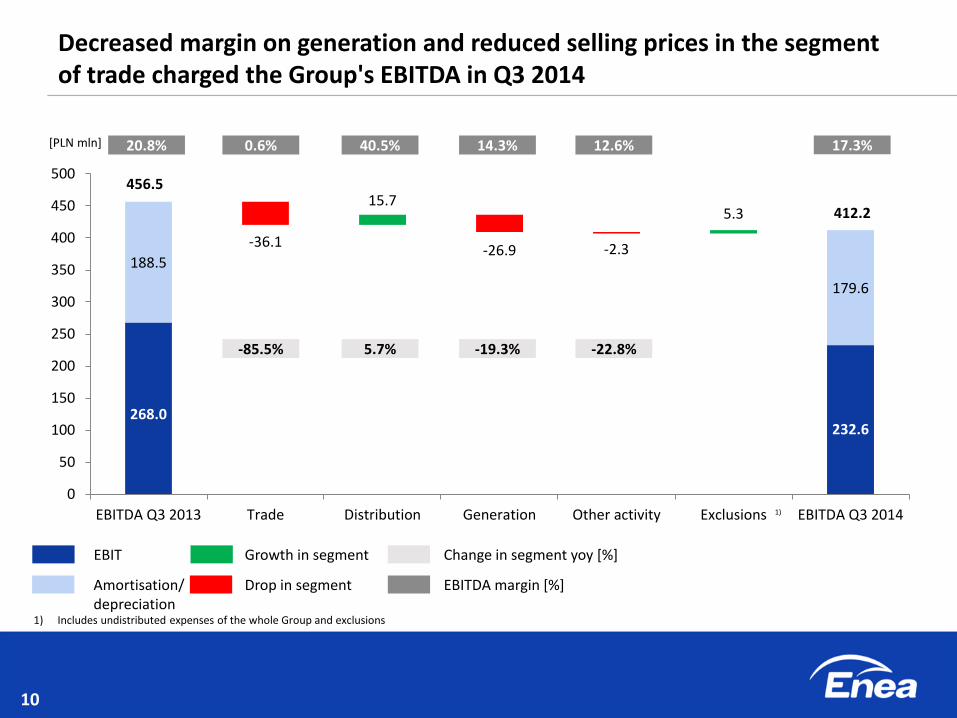
Decreased margin on generation and reduced selling prices in the segment of trade charged the Group's EBITDA in Q3 2014
0.6% 40.5% 14.3% 12.6% 17.3% 20.8% [PLN mln]
268.0 232.6
188.5
-36.1
15.7
-26.9 -2.3
5.3
179.6
0
50
100
150
200
250
300
350
400
450
500
EBITDA Q3 2013 Trade Distribution Generation Other activity Exclusions EBITDA Q3 2014
456.5
412.2
-22.8% 5.7% -85.5% -19.3%
EBIT
Amortisation/ depreciation
Growth in segment
Drop in segment
Change in segment yoy [%]
EBITDA margin [%]
1) Includes undistributed expenses of the whole Group and exclusions
1)
11
[PLN mln] Q3 2013 Q3 2014 Change
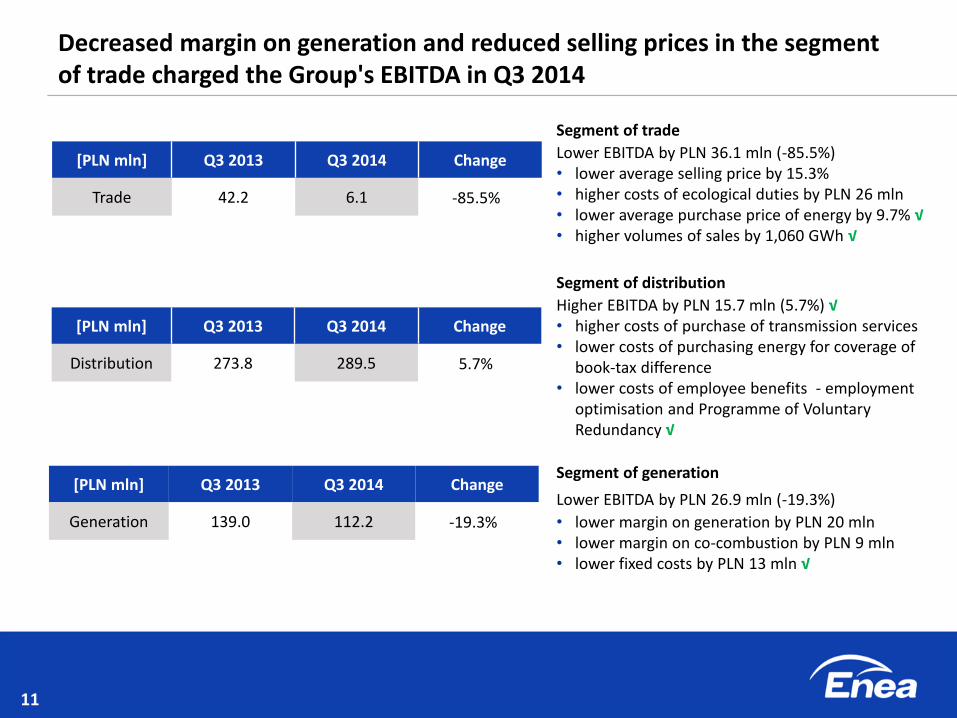
Generation 139.0 112.2 -19.3%
[PLN mln] Q3 2013 Q3 2014 Change
Trade 42.2 6.1 -85.5%
Decreased margin on generation and reduced selling prices in the segment of trade charged the Group's EBITDA in Q3 2014
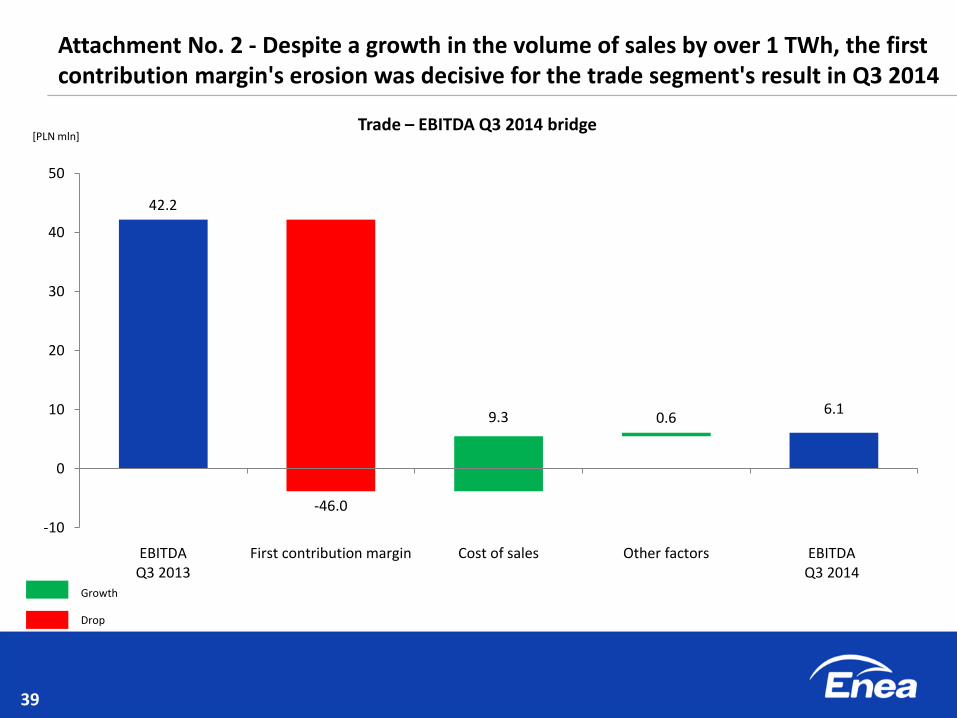
Segment of trade Lower EBITDA by PLN 36.1 mln (-85.5%) • lower average selling price by 15.3% • higher costs of ecological duties by PLN 26 mln • lower average purchase price of energy by 9.7% √ • higher volumes of sales by 1,060 GWh √
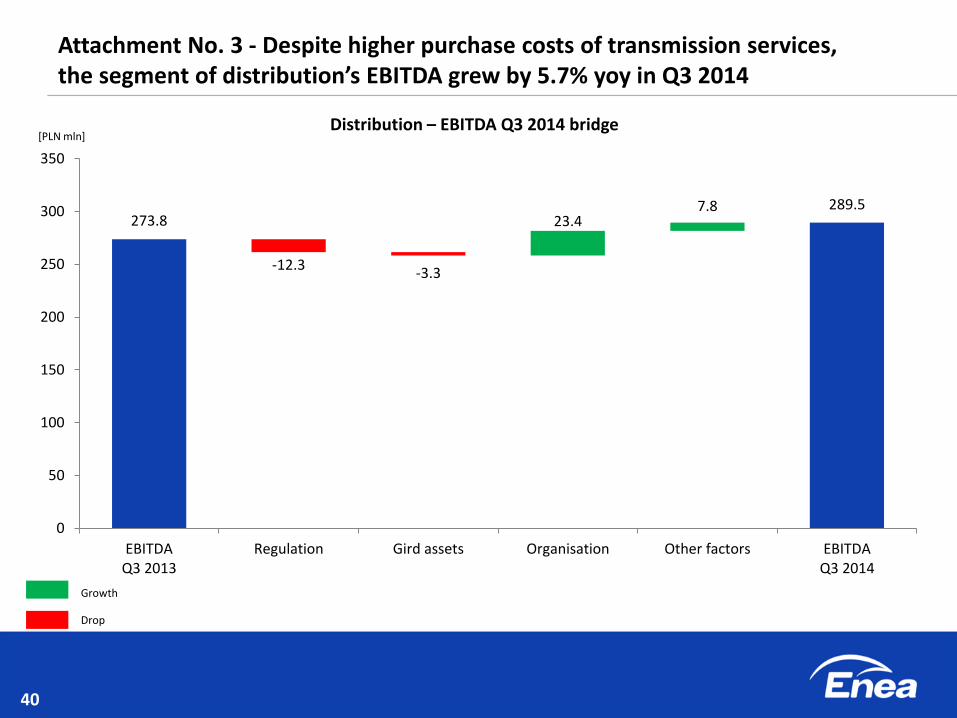
Segment of distribution Higher EBITDA by PLN 15.7 mln (5.7%) √ • higher costs of purchase of transmission services • lower costs of purchasing energy for coverage of
book-tax difference • lower costs of employee benefits - employment
optimisation and Programme of Voluntary Redundancy √
Segment of generation
Lower EBITDA by PLN 26.9 mln (-19.3%) • lower margin on generation by PLN 20 mln • lower margin on co-combustion by PLN 9 mln • lower fixed costs by PLN 13 mln √
[PLN mln] Q3 2013 Q3 2014 Change
Distribution 273.8 289.5 5.7%
12
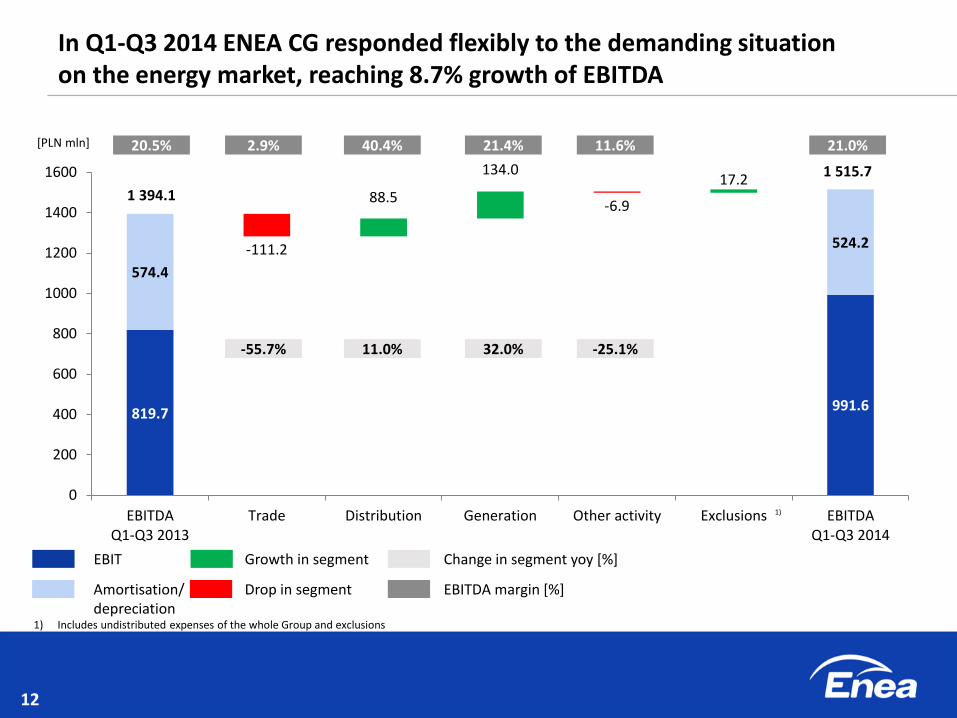
In Q1-Q3 2014 ENEA CG responded flexibly to the demanding situation on the energy market, reaching 8.7% growth of EBITDA
819.7 991.6
574.4
-111.2
88.5
134.0
-6.9
17.2
524.2
0
200
400
600
800
1000
1200
1400
1600
EBITDAQ1-Q3 2013
Trade Distribution Generation Other activity Exclusions EBITDAQ1-Q3 2014
-55.7% 11.0% 32.0%
1 394.1
1 515.7
[PLN mln]
-25.1%
20.5% 40.4% 21.4% 11.6% 21.0% 2.9%
1) Includes undistributed expenses of the whole Group and exclusions
EBIT
Amortisation/ depreciation
Growth in segment
Drop in segment
Change in segment yoy [%]
EBITDA margin [%]
1)
13
[PLN mln] Q1-Q3 2013 Q1-Q3 2014 Change
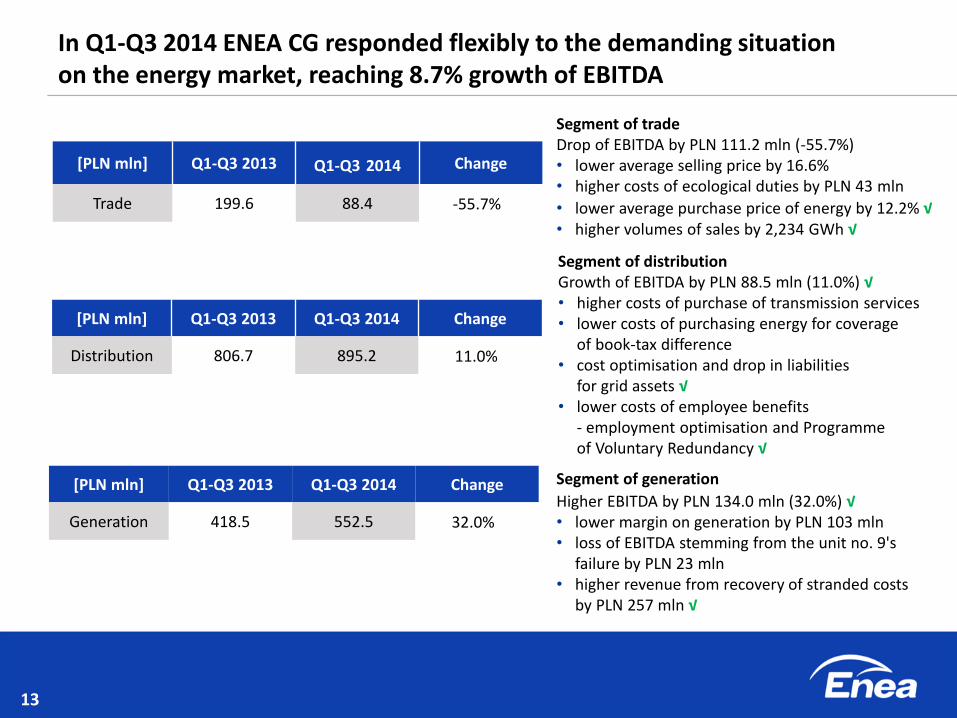
Generation 418.5 552.5 32.0%
[PLN mln] Q1-Q3 2013 Q1-Q3 2014 Change
Distribution 806.7 895.2 11.0%
In Q1-Q3 2014 ENEA CG responded flexibly to the demanding situation on the energy market, reaching 8.7% growth of EBITDA
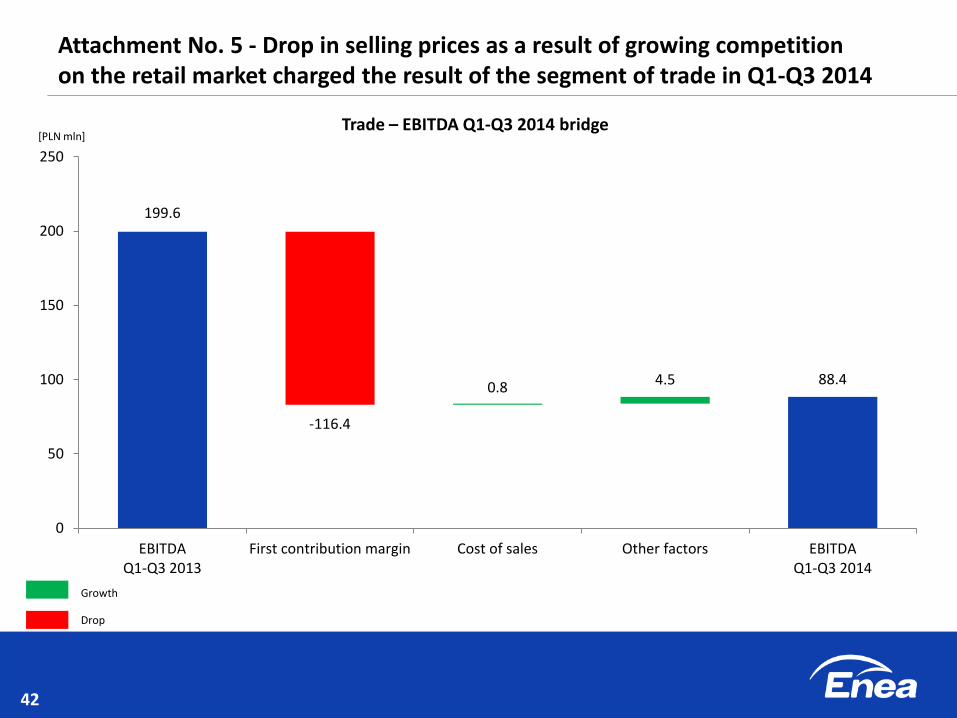
Segment of trade Drop of EBITDA by PLN 111.2 mln (-55.7%) • lower average selling price by 16.6% • higher costs of ecological duties by PLN 43 mln
• lower average purchase price of energy by 12.2% √ • higher volumes of sales by 2,234 GWh √
Segment of distribution Growth of EBITDA by PLN 88.5 mln (11.0%) √ • higher costs of purchase of transmission services • lower costs of purchasing energy for coverage
of book-tax difference • cost optimisation and drop in liabilities
for grid assets √ • lower costs of employee benefits
- employment optimisation and Programme of Voluntary Redundancy √
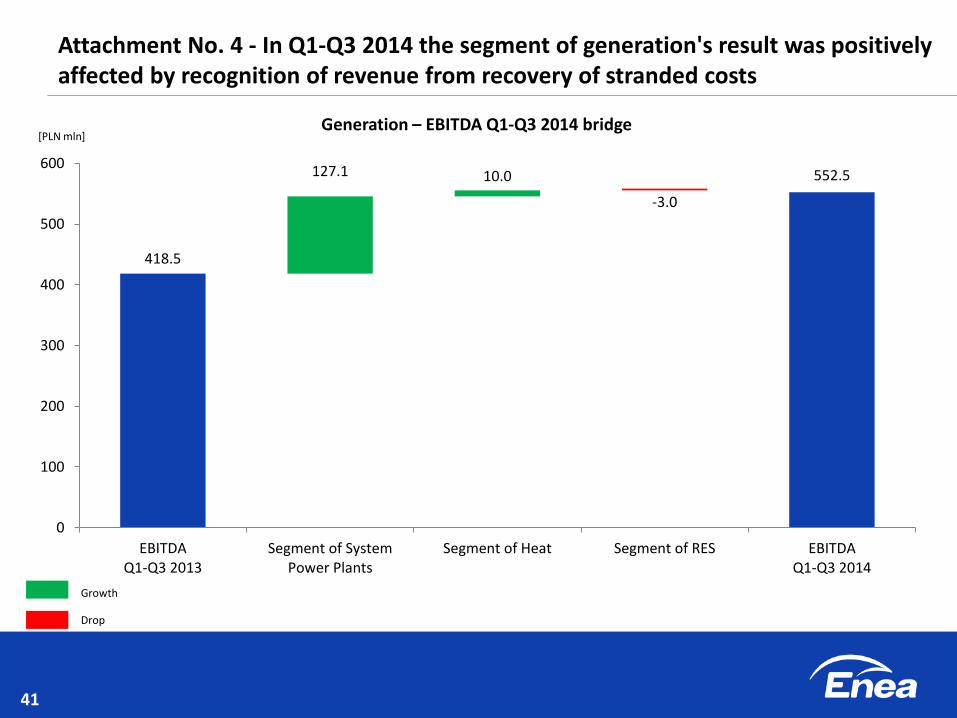
Segment of generation Higher EBITDA by PLN 134.0 mln (32.0%) √ • lower margin on generation by PLN 103 mln • loss of EBITDA stemming from the unit no. 9's
failure by PLN 23 mln • higher revenue from recovery of stranded costs
by PLN 257 mln √
[PLN mln] Q1-Q3 2013 Q1-Q3 2014 Change
Trade 199.6 88.4 -55.7%
14
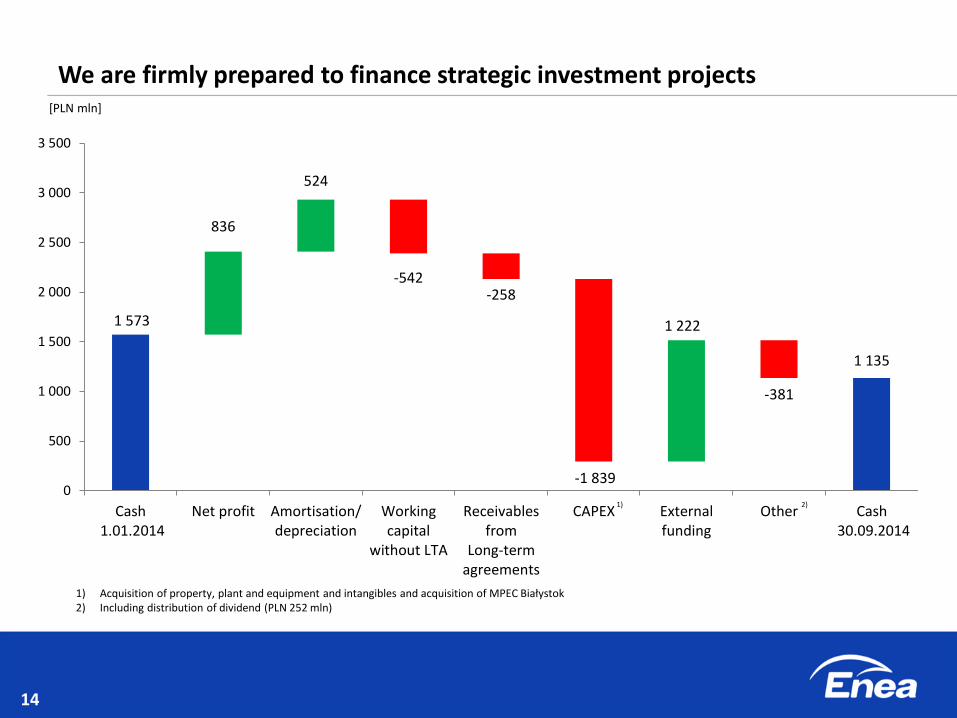
We are firmly prepared to finance strategic investment projects
1 573
836
524
-542 -258
-1 839
1 222
-381
1 135
0
500
1 000
1 500
2 000
2 500
3 000
3 500
Cash 1.01.2014
Net profit Amortisation/depreciation
Workingcapital
without LTA
Receivablesfrom
Long-termagreements
CAPEX Externalfunding
Other Cash 30.09.2014
[PLN mln]
1) Acquisition of property, plant and equipment and intangibles and acquisition of MPEC Białystok 2) Including distribution of dividend (PLN 252 mln)
1) 2)
15
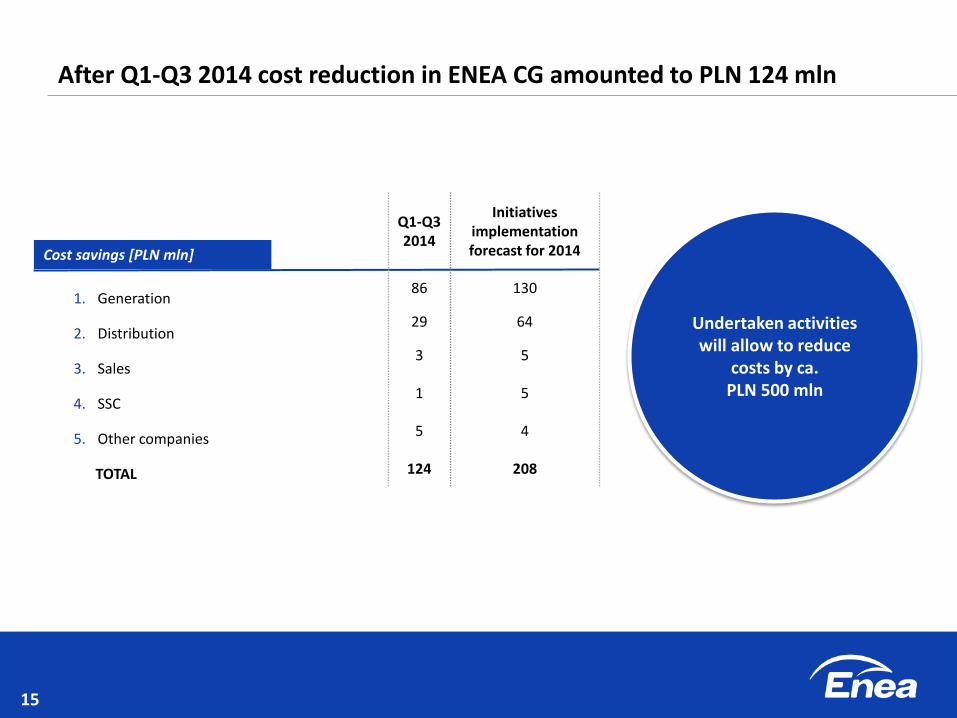
After Q1-Q3 2014 cost reduction in ENEA CG amounted to PLN 124 mln
1. Generation
2. Distribution
3. Sales
4. SSC
5. Other companies
TOTAL
Cost savings [PLN mln]
Q1-Q3 2014
Initiatives implementation forecast for 2014
86 130
29 64
3 5
1 5
5 4
124 208
Undertaken activities will allow to reduce
costs by ca. PLN 500 mln

16
ENEA CG develops according to the precise plan
Consistent development of ENEA CG - higher CAPEX by PLN 258 mln in Q1-Q3 2014 with a low value of net debt/EBITDA ratio on the level of 0.2
New corporate governance increases ENEA CG's strength of action
ENEA CG's financial results are above the market consensus
PLN 124 mln cost savings after Q1-Q3 2014
Pursuant to the strategy, we are researching the market as regards new acquisitions (wind power plants, cogeneration sources and heating networks)
17
Agenda
Energy market and key operating data
ENEA CG's results in Q3 and Q10Q3 2014
ENEA's corporate governance
A new unit in Kozienice

Paweł Orlof Vice-President of the Board for Corporate Affairs
New corporate governance - efficient management of ENEA CG
19
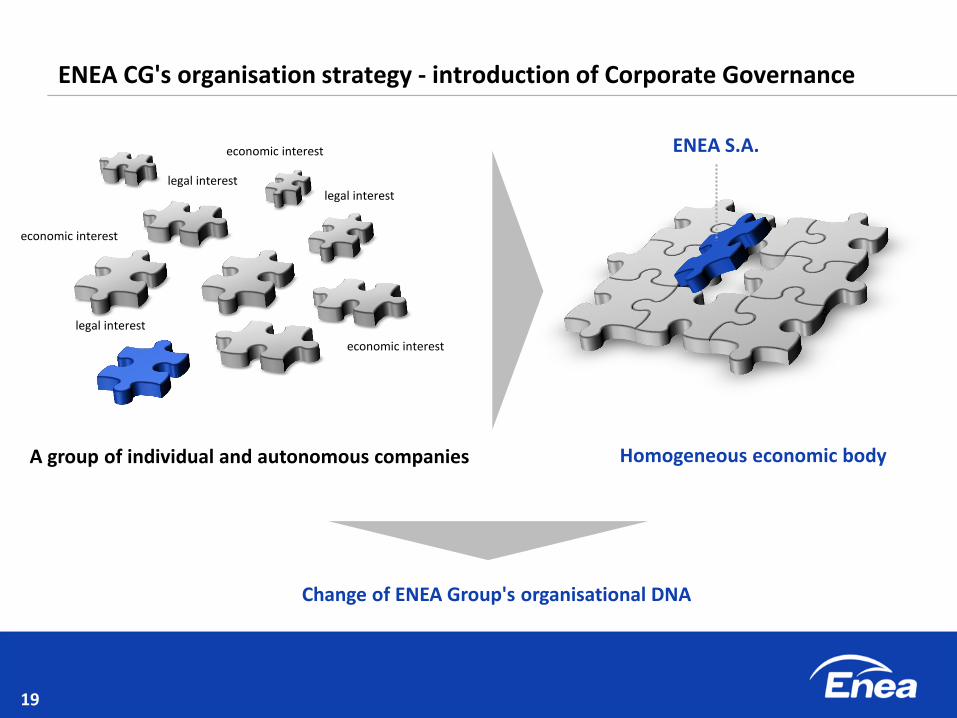
Homogeneous economic body A group of individual and autonomous companies
legal interest
economic interest
legal interest
economic interest
economic interest
legal interest
ENEA S.A.
Change of ENEA Group's organisational DNA
ENEA CG's organisation strategy - introduction of Corporate Governance
20
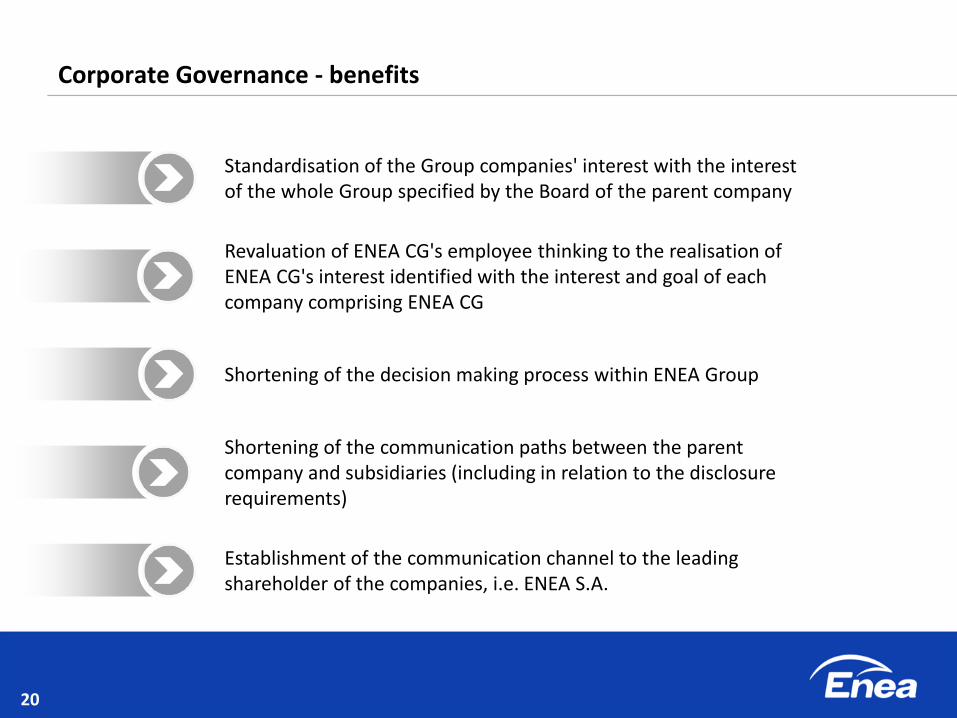
Corporate Governance - benefits
Standardisation of the Group companies' interest with the interest of the whole Group specified by the Board of the parent company
Revaluation of ENEA CG's employee thinking to the realisation of ENEA CG's interest identified with the interest and goal of each company comprising ENEA CG
Shortening of the decision making process within ENEA Group
Shortening of the communication paths between the parent company and subsidiaries (including in relation to the disclosure requirements)
Establishment of the communication channel to the leading shareholder of the companies, i.e. ENEA S.A.
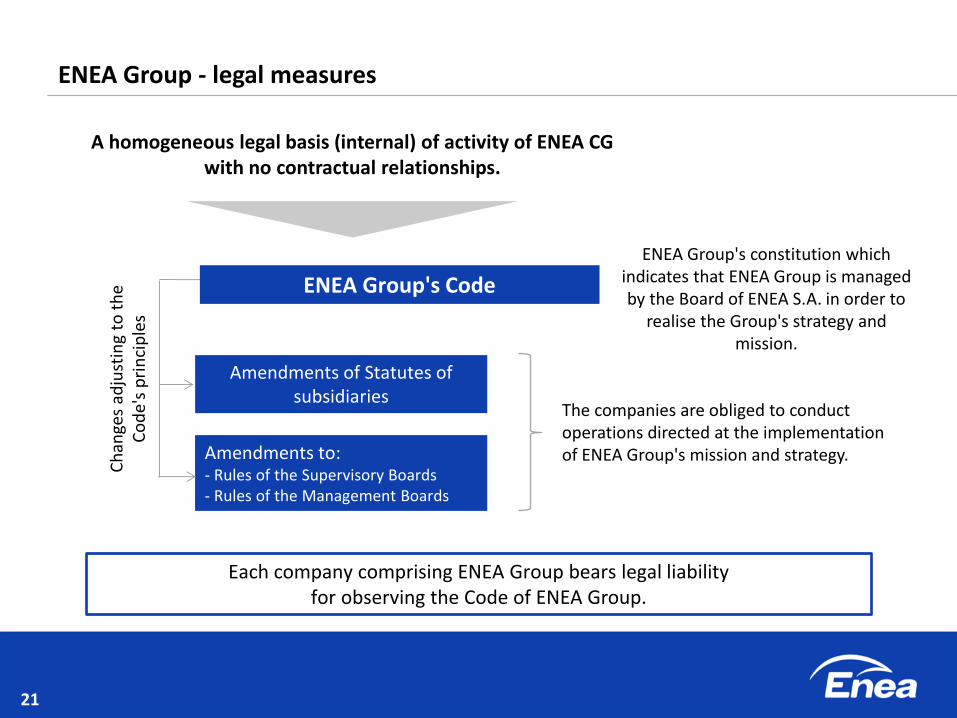
21
ENEA Group's Code
Each company comprising ENEA Group bears legal liability for observing the Code of ENEA Group.
Ch
ange
s ad
just
ing
to t
he
Co
de'
s p
rin
cip
les
The companies are obliged to conduct operations directed at the implementation of ENEA Group's mission and strategy.
Amendments of Statutes of subsidiaries
Amendments to: - Rules of the Supervisory Boards - Rules of the Management Boards
A homogeneous legal basis (internal) of activity of ENEA CG with no contractual relationships.
ENEA Group's constitution which indicates that ENEA Group is managed by the Board of ENEA S.A. in order to
realise the Group's strategy and mission.
ENEA Group - legal measures
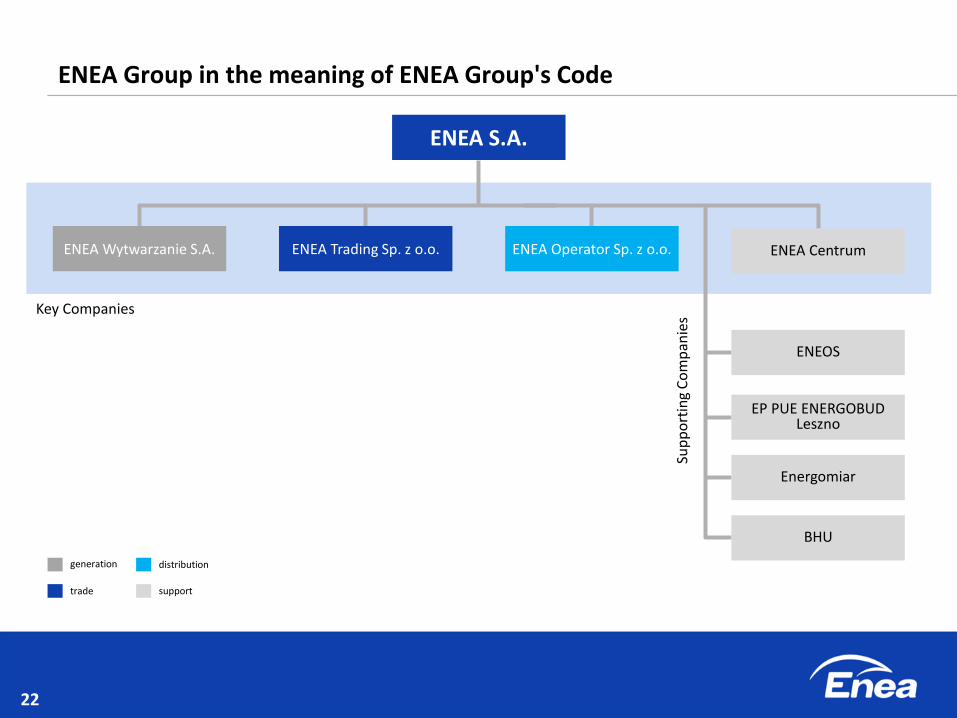
22
Key Companies
Sup
po
rtin
g C
om
pan
ies
ENEA Group in the meaning of ENEA Group's Code
ENEA S.A.
ENEA Trading Sp. z o.o. ENEA Operator Sp. z o.o. ENEA Wytwarzanie S.A. ENEA Centrum
EP PUE ENERGOBUD Leszno
Energomiar
BHU
ENEOS
generation
trade
distribution
support

23
Corporate Governance implementation process
V 2014 VII 2014 X 2014 VII 2013 IX 2013
Amendment to: ‐ Statutes of subsidiaries ‐ Rules of the Management
Boards ‐ Rules of the Supervisory
Boards
Approval by the Board of ENEA S.A. of ENEA Group's Code
Establishment of Committees: ‐ Management Committee ‐ Compliance Committee ‐ Investment Committee
Establishment of the Audit Management Department
Commencement of operations in the full scope:
‐ Management Committee ‐ Compliance Committee ‐ Investment Committee
Adoption of the final list of ENEA Group's Committees and
new list of Management Departments Completion of the corporate
governance reconstruction
Establishment and commencement of new Committees' operations:
‐ Risk Committee ‐ Trade and Promotion Committee ‐ Finance and IT Committee
Establishment and commencement of new Management Departments' operations:
‐ Communication Management Department
‐ Purchases Management Department ‐ HR Management Department ‐ Security and Legal Service Management
Department
Commencement of works over the new corporate governance model
24
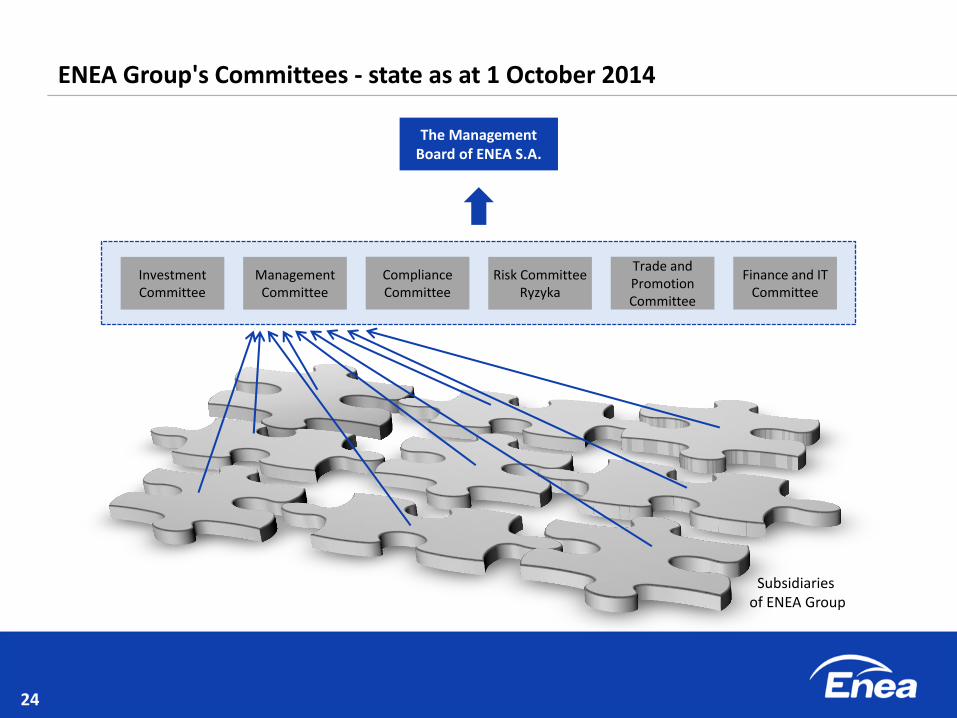
The Management Board of ENEA S.A.
Investment Committee
Management Committee
Compliance Committee
Trade and Promotion Committee
Risk Committee Ryzyka
Finance and IT Committee
ENEA Group's Committees - state as at 1 October 2014
Subsidiaries of ENEA Group
25
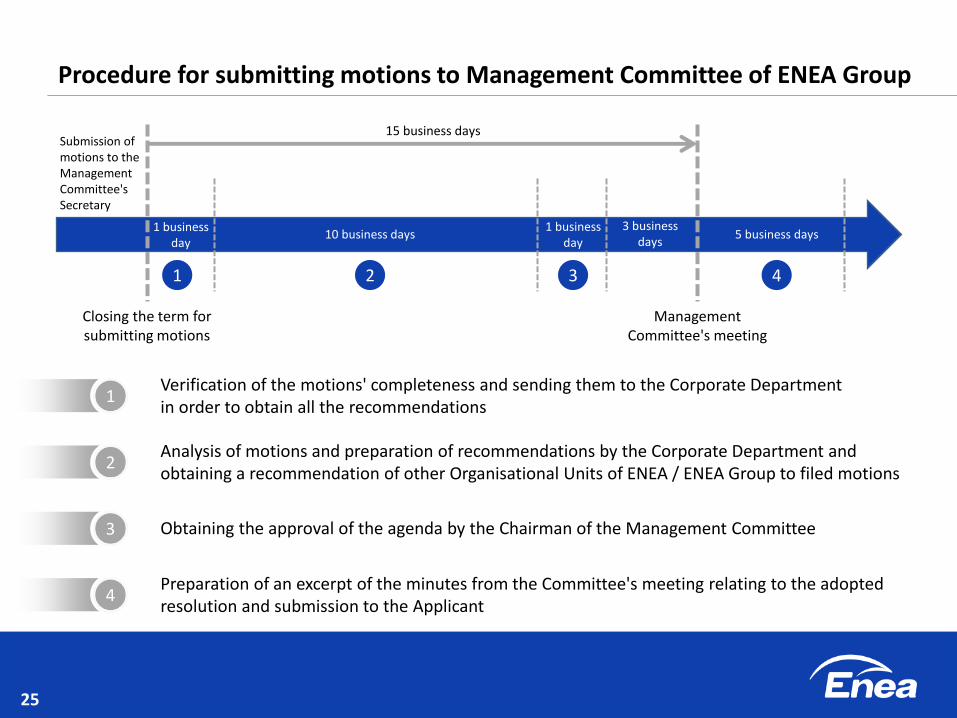
Procedure for submitting motions to Management Committee of ENEA Group
1 business day
10 business days 1 business
day
3 business days
5 business days
15 business days
Closing the term for submitting motions
Management Committee's meeting
Submission of motions to the Management Committee's Secretary
Verification of the motions' completeness and sending them to the Corporate Department in order to obtain all the recommendations
Analysis of motions and preparation of recommendations by the Corporate Department and obtaining a recommendation of other Organisational Units of ENEA / ENEA Group to filed motions
Obtaining the approval of the agenda by the Chairman of the Management Committee
Preparation of an excerpt of the minutes from the Committee's meeting relating to the adopted resolution and submission to the Applicant
1 2 3 4
1
2
3
4
26
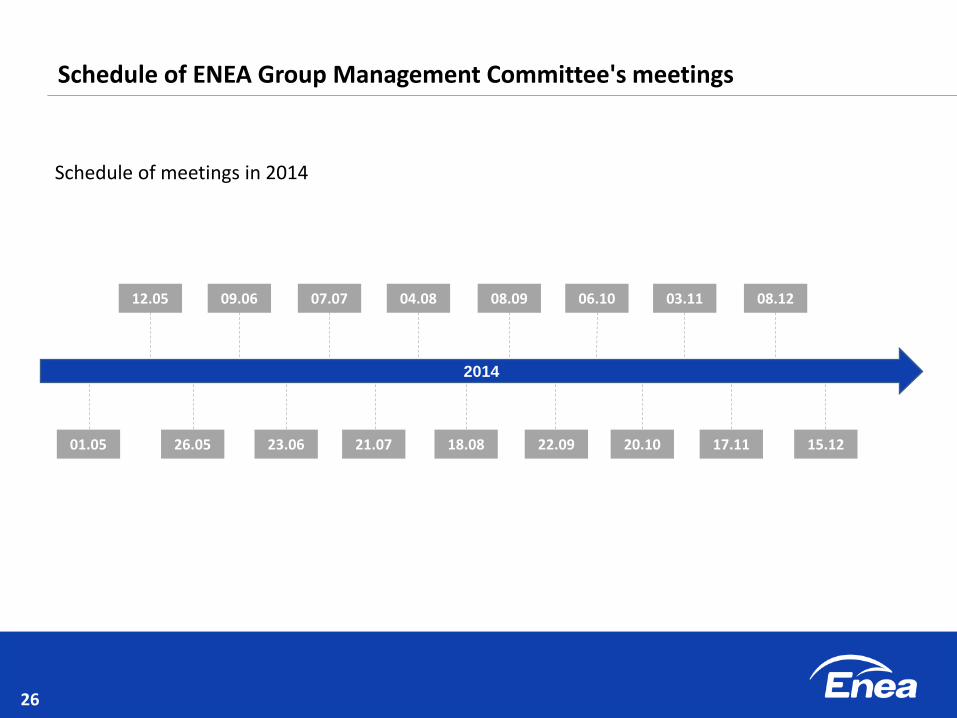
12.05 09.06 07.07
26.05 23.06
04.08 08.09 06.10 03.11 08.12
21.07 18.08 22.09 20.10 17.11 15.12
2014
01.05
Schedule of ENEA Group Management Committee's meetings
Schedule of meetings in 2014
27
Trade and Promotion Committee
Finance and IT Committee
Risk Committee
Management Committee
Investment Committee
Compliance Committee
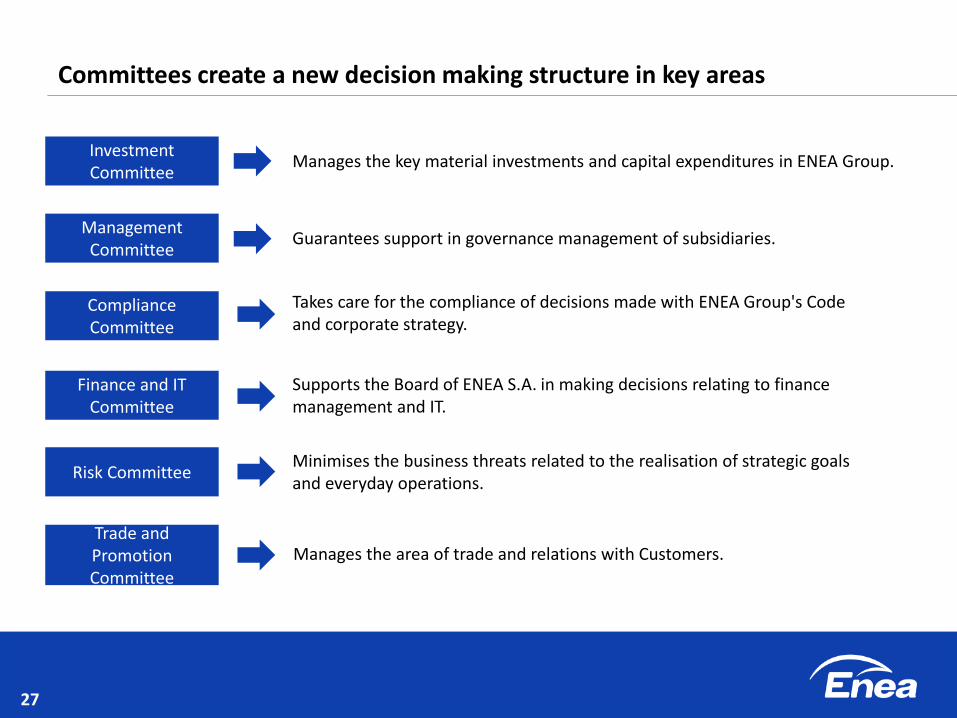
Committees create a new decision making structure in key areas
Manages the key material investments and capital expenditures in ENEA Group.
Guarantees support in governance management of subsidiaries.
Takes care for the compliance of decisions made with ENEA Group's Code and corporate strategy.
Supports the Board of ENEA S.A. in making decisions relating to finance management and IT.
Minimises the business threats related to the realisation of strategic goals and everyday operations.
Manages the area of trade and relations with Customers.
28
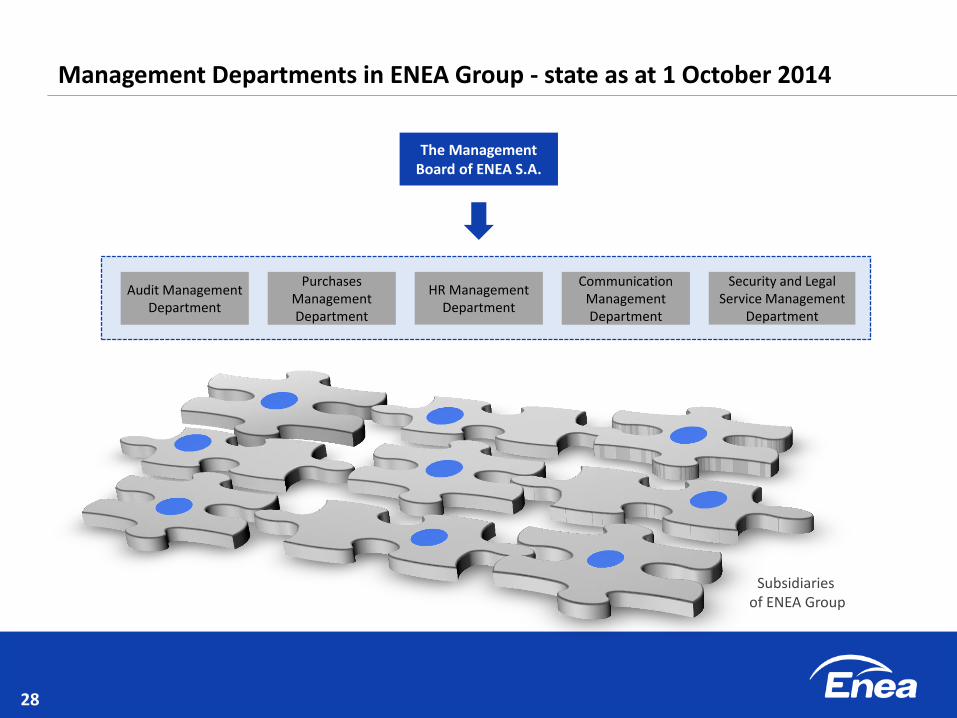
Management Departments in ENEA Group - state as at 1 October 2014
Subsidiaries of ENEA Group
The Management Board of ENEA S.A.
Audit Management Department
Purchases Management Department
HR Management Department
Security and Legal Service Management
Department
Communication Management Department

29
ENEA's Corporate Communication Department
Director
Press office Promotion bureau Internal
communication bureau
Investor relations bureau
ENEA Operator • Public Relations and Promotion Bureau • Communication and HR Development Bureau • 5 regional spokesmen
ENEA Wytwarzanie • PR and Exchange Information Department • Board's Adviser - Spokesman
ENEOS • Marketing Department
ENERGOBUD • Board's Office
BHU • Sales Development Department
ENEA Centrum • Administration and HR Department
– Communication Specialist
Man
agin
g U
nit
C
oo
per
atin
g U
nit
B
usi
nes
s U
nit
ENEA Group Companies' organisational units
Communication Management Department's structure
30
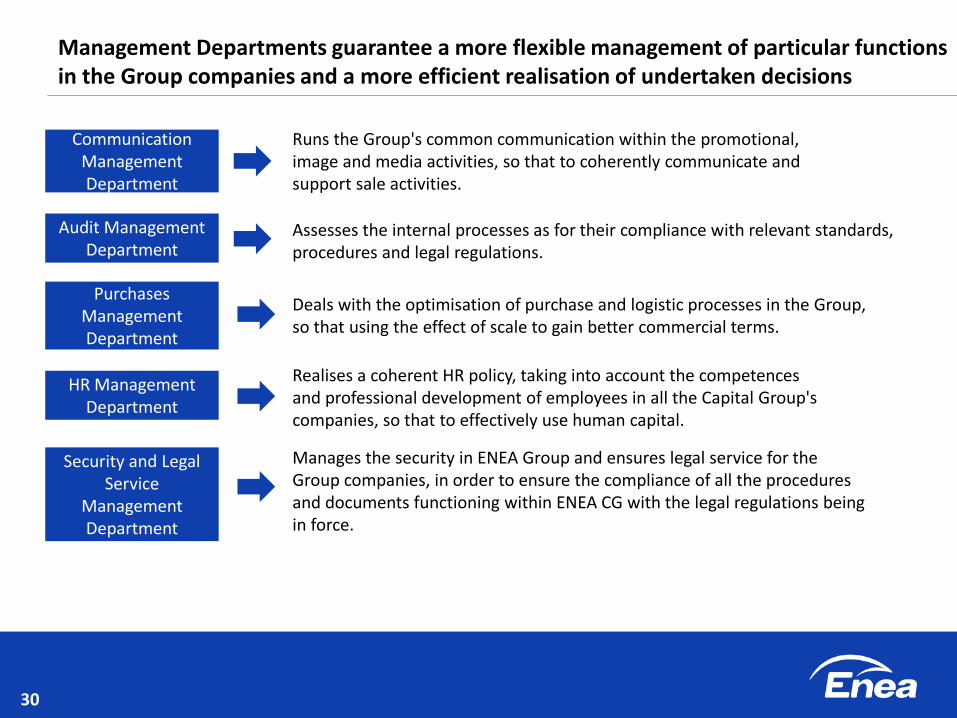
Management Departments guarantee a more flexible management of particular functions in the Group companies and a more efficient realisation of undertaken decisions
Security and Legal Service
Management Department
Runs the Group's common communication within the promotional, image and media activities, so that to coherently communicate and support sale activities.
Assesses the internal processes as for their compliance with relevant standards, procedures and legal regulations.
Deals with the optimisation of purchase and logistic processes in the Group, so that using the effect of scale to gain better commercial terms.
Manages the security in ENEA Group and ensures legal service for the Group companies, in order to ensure the compliance of all the procedures and documents functioning within ENEA CG with the legal regulations being in force.
Realises a coherent HR policy, taking into account the competences and professional development of employees in all the Capital Group's companies, so that to effectively use human capital.
Audit Management Department
Communication Management Department
Purchases Management Department
HR Management Department
31
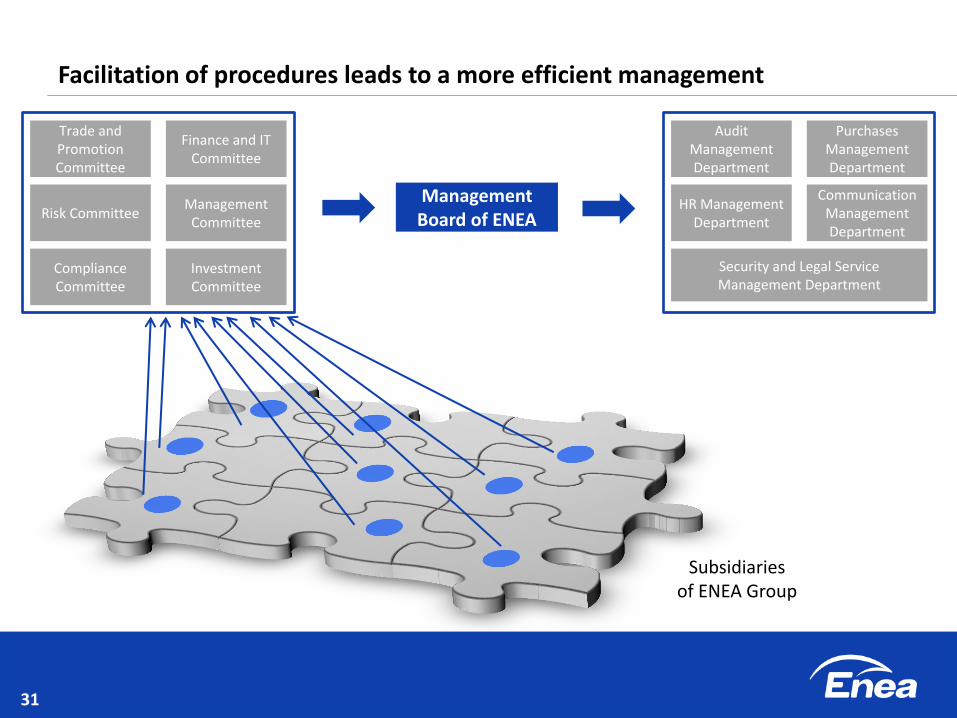
Facilitation of procedures leads to a more efficient management
Subsidiaries of ENEA Group
The Management Board of ENEA
S.A.
Trade and Promotion Committee
Finance and IT Committee
Risk Committee
Compliance Committee
Management Committee
Investment Committee
Audit Management Department
Purchases Management Department
HR Management Department
Security and Legal Service Management Department
Communication Management Department
32
Agenda
Energy market and key operating data
ENEA CG's results in Q3 and Q10Q3 2014
ENEA's corporate governance
A new unit in Kozienice
Paweł Orlof Vice-President of the Board for Corporate Affairs
Unit No. 11 will satisfy the strictest European criteria of environment protection
34
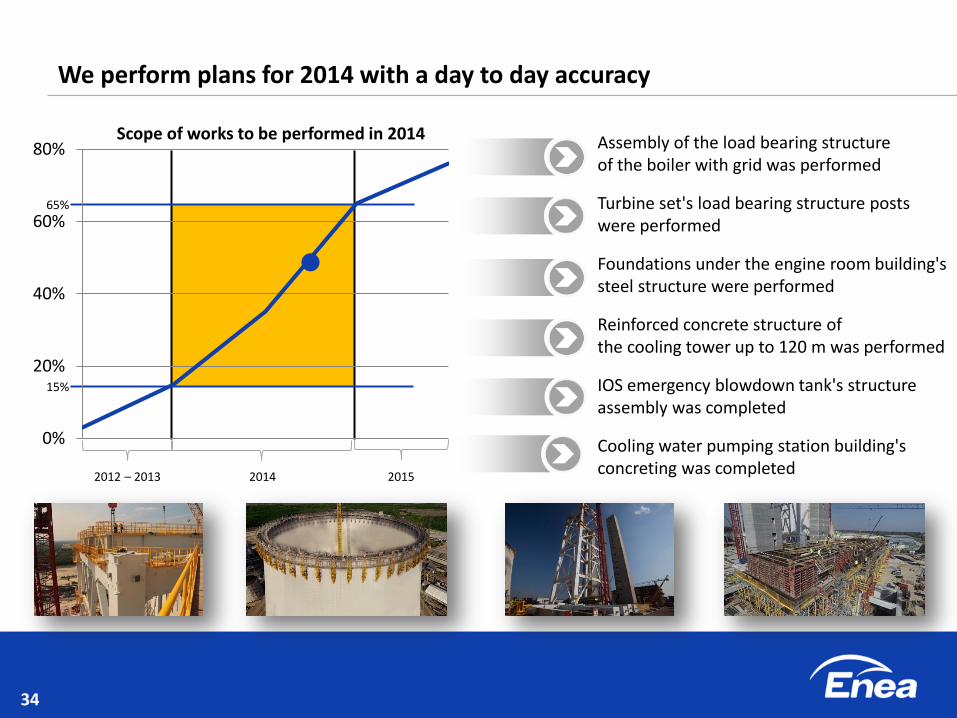
We perform plans for 2014 with a day to day accuracy
65%
15%
2012 – 2013 2014 2015
Assembly of the load bearing structure of the boiler with grid was performed
Turbine set's load bearing structure posts were performed
Foundations under the engine room building's steel structure were performed
Reinforced concrete structure of the cooling tower up to 120 m was performed
IOS emergency blowdown tank's structure assembly was completed
Cooling water pumping station building's concreting was completed
0%
20%
40%
60%
80%Scope of works to be performed in 2014
35
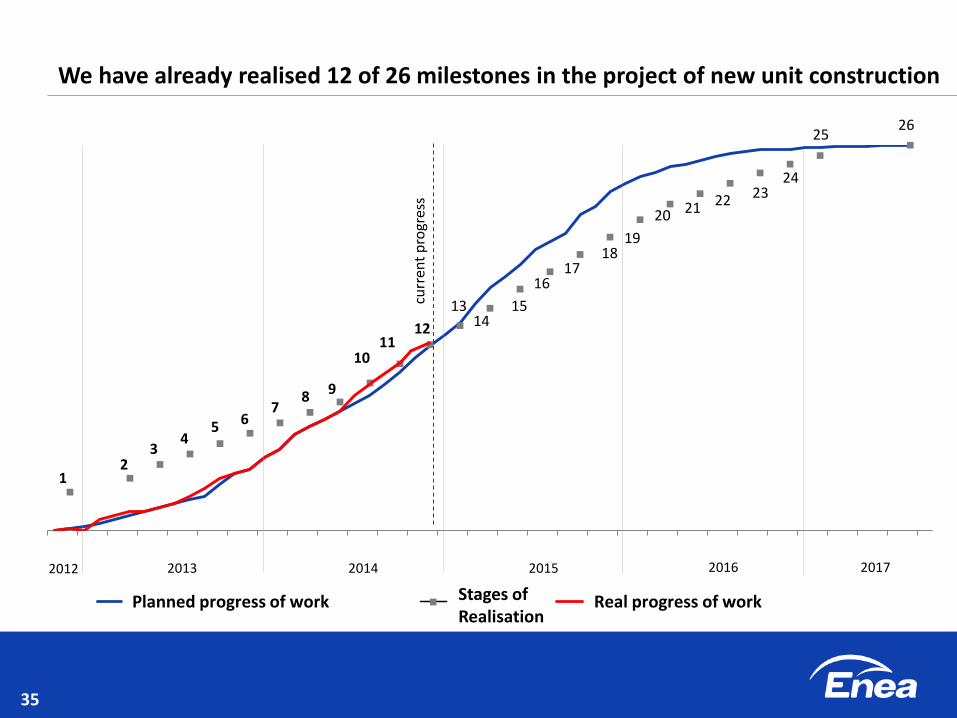
We have already realised 12 of 26 milestones in the project of new unit construction
Planowane Zaawansowanie Prac Płatności Rzeczywiste Zaawansowanie Prac
2012 2013 2014 2015 2016 2017
5 6 7
8 9
10 11
12
18
16 17
13 14
19
20 21 22
2 1
4 3
26
15
23 24
25
Stages of Realisation
Planned progress of work Real progress of work
curr
ent
pro
gres
s
New corporate governance allows for optimum use of the organisational capabilities
Q3, Q1-Q3 2014
Additional information
38
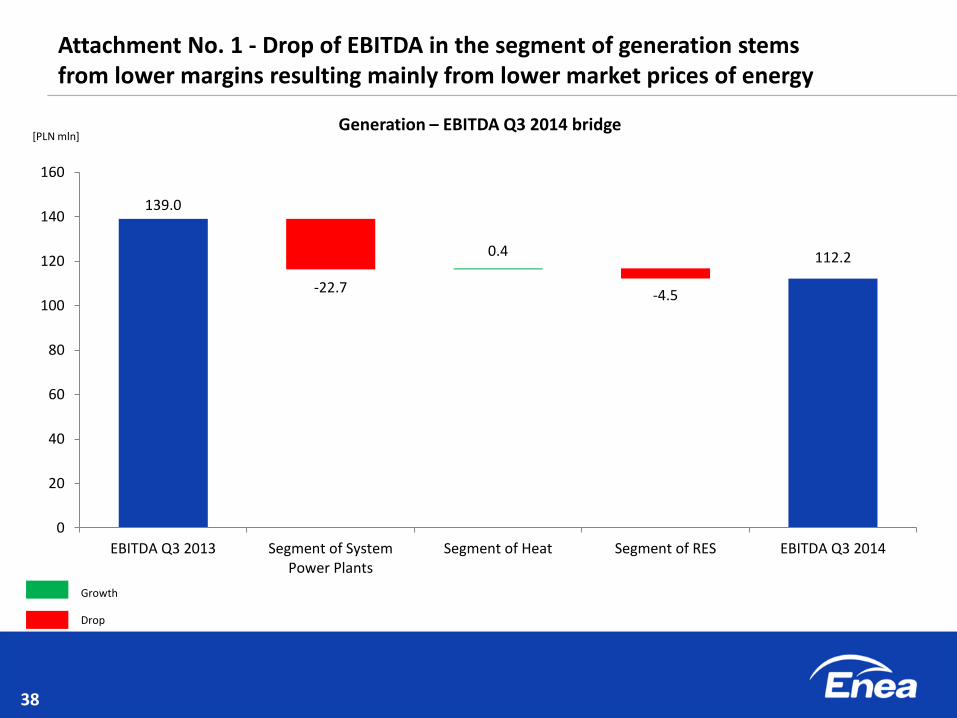
139.0
112.2 0.4
-22.7 -4.5
0
20
40
60
80
100
120
140
160
EBITDA Q3 2013 Segment of SystemPower Plants
Segment of Heat Segment of RES EBITDA Q3 2014
Growth
Drop
[PLN mln] Generation – EBITDA Q3 2014 bridge
Attachment No. 1 - Drop of EBITDA in the segment of generation stems from lower margins resulting mainly from lower market prices of energy
39
-46.0
42.2
6.1 9.3 0.6
-10
0
10
20
30
40
50
EBITDAQ3 2013
First contribution margin Cost of sales Other factors EBITDAQ3 2014
Trade – EBITDA Q3 2014 bridge
Attachment No. 2 - Despite a growth in the volume of sales by over 1 TWh, the first contribution margin's erosion was decisive for the trade segment's result in Q3 2014
Growth
Drop
[PLN mln]
40
273.8 289.5
23.4 7.8
-12.3 -3.3
0
50
100
150
200
250
300
350
EBITDAQ3 2013
Regulation Gird assets Organisation Other factors EBITDAQ3 2014
Attachment No. 3 - Despite higher purchase costs of transmission services, the segment of distribution’s EBITDA grew by 5.7% yoy in Q3 2014
Distribution – EBITDA Q3 2014 bridge
Growth
Drop
[PLN mln]
41
418.5
552.5 127.1 10.0
-3.0
0
100
200
300
400
500
600
EBITDAQ1-Q3 2013
Segment of SystemPower Plants
Segment of Heat Segment of RES EBITDAQ1-Q3 2014
Attachment No. 4 - In Q1-Q3 2014 the segment of generation's result was positively affected by recognition of revenue from recovery of stranded costs
Generation – EBITDA Q1-Q3 2014 bridge
Growth
Drop
[PLN mln]
42
199.6
88.4 0.8 4.5
-116.4
0
50
100
150
200
250
EBITDAQ1-Q3 2013
First contribution margin Cost of sales Other factors EBITDAQ1-Q3 2014
Attachment No. 5 - Drop in selling prices as a result of growing competition on the retail market charged the result of the segment of trade in Q1-Q3 2014
Trade – EBITDA Q1-Q3 2014 bridge
Growth
Drop
[PLN mln]
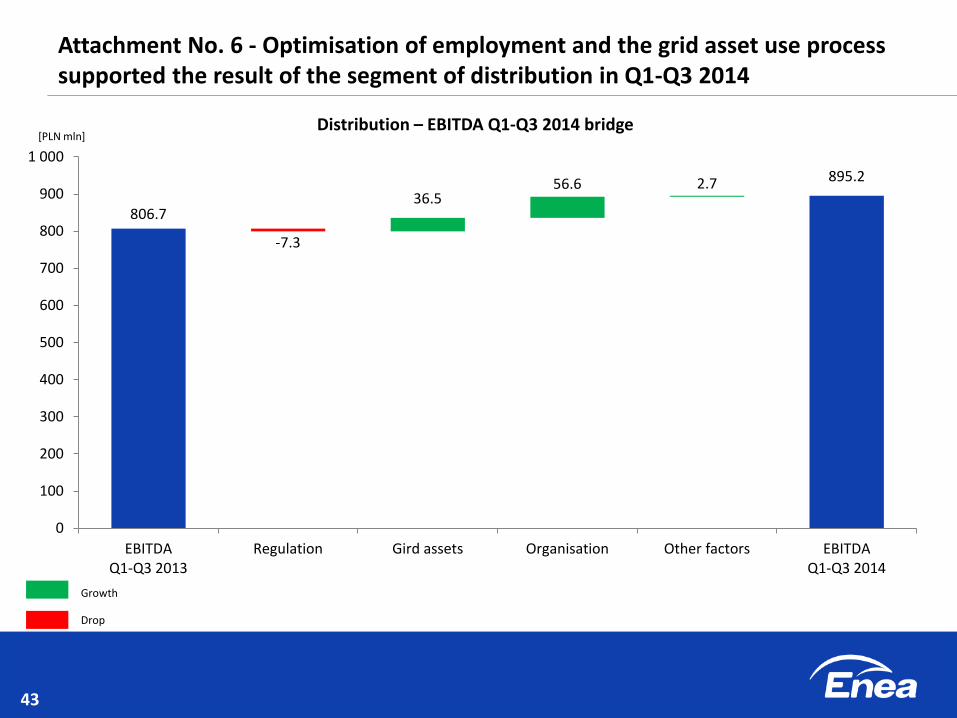
43
806.7
895.2
36.5 56.6 2.7
-7.3
0
100
200
300
400
500
600
700
800
900
1 000
EBITDAQ1-Q3 2013
Regulation Gird assets Organisation Other factors EBITDAQ1-Q3 2014
Attachment No. 6 - Optimisation of employment and the grid asset use process supported the result of the segment of distribution in Q1-Q3 2014
Distribution – EBITDA Q1-Q3 2014 bridge
Growth
Drop
[PLN mln]