energy, electricity and nuclear power estimates for the
TRANSCRIPT

INTERNATIONAL ATOMIC ENERGY AGENCYVIENNA
ISBN 978-92-0-104918-6ISSN 1011-2642 @
18-0
3841
RE
FER
EN
CE
DATA
SE
RIE
S N
o. 12018 E
dition
Energy, Electricity and Nuclear Power Estimates for the Period up to 2050
REFERENCE DATA SERIES No. 12018 Edition
148 pages, 7.73mm on 80gsm ppaper
18-03841 RDS 1-38 Cover 16x24 PRESS.indd 1 2018-08-31 14:24:09


ENERGY, ELECTRICITY AND NUCLEAR POWER ESTIMATES FOR THE PERIOD UP TO 2050


REFERENCE DATA SERIES No. 1
ENERGY, ELECTRICITY AND NUCLEAR POWER ESTIMATES FOR THE PERIOD UP TO 205050
2018 Edition
INTERNATIONAL ATOMIC ENERGY AGENCYVIENNA, 2018

ENERGY, ELECTRICITY AND NUCLEAR POWER ESTIMATES FOR THE PERIOD UP TO 2050
IAEA-RDS-1/38ISBN 978-92-0-104918-6
ISSN 1011-2642Printed by the IAEA in Austria
August 2018Cover photo credit:
China National Nuclear Corporation / 2018

CONTENTS
INTRODUCTION . . . . . . . . . . . . . . . . . . . . . . . . . . . . . . . . . . . . . . . . . . . 1
WORLD . . . . . . . . . . . . . . . . . . . . . . . . . . . . . . . . . . . . . . . . . . . . . . . . . . 5
Nuclear Power Development around the World in 2017 . . . . . . . . . . . . . . 7Final Energy Consumption in 2017 . . . . . . . . . . . . . . . . . . . . . . . . . . . . . . 13Electricity Production . . . . . . . . . . . . . . . . . . . . . . . . . . . . . . . . . . . . . . . . . 14Energy and Electricity Projections . . . . . . . . . . . . . . . . . . . . . . . . . . . . . . . 16Nuclear Electrical Generating Capacity Projections . . . . . . . . . . . . . . . . . 18Reactor Retirements and Additions . . . . . . . . . . . . . . . . . . . . . . . . . . . . . . 20Electricity and Nuclear Production Projections . . . . . . . . . . . . . . . . . . . . . 22
NORTHERN AMERICA . . . . . . . . . . . . . . . . . . . . . . . . . . . . . . . . . . . . . . 27
Final Energy Consumption in 2017 . . . . . . . . . . . . . . . . . . . . . . . . . . . . . . 28Electricity Production in 2017 . . . . . . . . . . . . . . . . . . . . . . . . . . . . . . . . . . 29Energy and Electricity Projections . . . . . . . . . . . . . . . . . . . . . . . . . . . . . . . 30Nuclear Electrical Generating Capacity Projections . . . . . . . . . . . . . . . . . 32Reactor Retirements and Additions . . . . . . . . . . . . . . . . . . . . . . . . . . . . . . 34Electricity and Nuclear Production Projections . . . . . . . . . . . . . . . . . . . . . 36
LATIN AMERICA AND THE CARIBBEAN . . . . . . . . . . . . . . . . . . . . . . . . 39
Final Energy Consumption in 2017 . . . . . . . . . . . . . . . . . . . . . . . . . . . . . . 40Electricity Production in 2017 . . . . . . . . . . . . . . . . . . . . . . . . . . . . . . . . . . 41Energy and Electricity Projections . . . . . . . . . . . . . . . . . . . . . . . . . . . . . . . 42Nuclear Electrical Generating Capacity Projections . . . . . . . . . . . . . . . . . 44Reactor Retirements and Additions . . . . . . . . . . . . . . . . . . . . . . . . . . . . . . 46Electricity and Nuclear Production Projections . . . . . . . . . . . . . . . . . . . . . 48
NORTHERN, WESTERN AND SOUTHERN EUROPE . . . . . . . . . . . . . . 51
Final Energy Consumption in 2017 . . . . . . . . . . . . . . . . . . . . . . . . . . . . . . 52Electricity Production in 2017 . . . . . . . . . . . . . . . . . . . . . . . . . . . . . . . . . . 53Energy and Electricity Projections . . . . . . . . . . . . . . . . . . . . . . . . . . . . . . . 54Nuclear Electrical Generating Capacity Projections . . . . . . . . . . . . . . . . . 56Reactor Retirements and Additions . . . . . . . . . . . . . . . . . . . . . . . . . . . . . . 58Electricity and Nuclear Production Projections . . . . . . . . . . . . . . . . . . . . . 60

EASTERN EUROPE . . . . . . . . . . . . . . . . . . . . . . . . . . . . . . . . . . . . . . . . 63
Final Energy Consumption in 2017 . . . . . . . . . . . . . . . . . . . . . . . . . . . . . . 64Electricity Production in 2017 . . . . . . . . . . . . . . . . . . . . . . . . . . . . . . . . . . 65Energy and Electricity Projections . . . . . . . . . . . . . . . . . . . . . . . . . . . . . . . 66Nuclear Electrical Generating Capacity Projections . . . . . . . . . . . . . . . . . 68Reactor Retirements and Additions . . . . . . . . . . . . . . . . . . . . . . . . . . . . . . 70Electricity and Nuclear Production Projections . . . . . . . . . . . . . . . . . . . . . 72
AFRICA. . . . . . . . . . . . . . . . . . . . . . . . . . . . . . . . . . . . . . . . . . . . . . . . . . . 75
Final Energy Consumption in 2017 . . . . . . . . . . . . . . . . . . . . . . . . . . . . . . 76Electricity Production in 2017 . . . . . . . . . . . . . . . . . . . . . . . . . . . . . . . . . . 77Energy and Electricity Projections . . . . . . . . . . . . . . . . . . . . . . . . . . . . . . . 78Per Capita Energy and Electricity . . . . . . . . . . . . . . . . . . . . . . . . . . . . . . . 80Nuclear Electrical Generating Capacity Projections . . . . . . . . . . . . . . . . . 82Electricity and Nuclear Production Projections . . . . . . . . . . . . . . . . . . . . . 84
WESTERN ASIA. . . . . . . . . . . . . . . . . . . . . . . . . . . . . . . . . . . . . . . . . . . . 87
Final Energy Consumption in 2017 . . . . . . . . . . . . . . . . . . . . . . . . . . . . . . 88Electricity Production in 2017 . . . . . . . . . . . . . . . . . . . . . . . . . . . . . . . . . . 89Energy and Electricity Projections . . . . . . . . . . . . . . . . . . . . . . . . . . . . . . . 90Nuclear Electrical Generating Capacity Projections . . . . . . . . . . . . . . . . . 92Electricity and Nuclear Production Projections . . . . . . . . . . . . . . . . . . . . . 94
SOUTHERN ASIA. . . . . . . . . . . . . . . . . . . . . . . . . . . . . . . . . . . . . . . . . . . 97
Final Energy Consumption in 2017 . . . . . . . . . . . . . . . . . . . . . . . . . . . . . . 98Electricity Production in 2017 . . . . . . . . . . . . . . . . . . . . . . . . . . . . . . . . . . 99Energy and Electricity Projections . . . . . . . . . . . . . . . . . . . . . . . . . . . . . . . 100Nuclear Electrical Generating Capacity Projections . . . . . . . . . . . . . . . . . 102Reactor Retirements and Additions . . . . . . . . . . . . . . . . . . . . . . . . . . . . . . 104Electricity and Nuclear Production Projections . . . . . . . . . . . . . . . . . . . . . 106
CENTRAL AND EASTERN ASIA . . . . . . . . . . . . . . . . . . . . . . . . . . . . . . . 109
Final Energy Consumption in 2017 . . . . . . . . . . . . . . . . . . . . . . . . . . . . . . 110Electricity Production in 2017 . . . . . . . . . . . . . . . . . . . . . . . . . . . . . . . . . . 111Energy and Electricity Projections . . . . . . . . . . . . . . . . . . . . . . . . . . . . . . . 112Nuclear Electrical Generating Capacity Projections . . . . . . . . . . . . . . . . . 114Reactor Retirements and Additions . . . . . . . . . . . . . . . . . . . . . . . . . . . . . . 116Electricity and Nuclear Production Projections . . . . . . . . . . . . . . . . . . . . . 118

SOUTH-EASTERN ASIA . . . . . . . . . . . . . . . . . . . . . . . . . . . . . . . . . . . . . 121
Final Energy Consumption in 2017 . . . . . . . . . . . . . . . . . . . . . . . . . . . . . . 122Electricity Production in 2017 . . . . . . . . . . . . . . . . . . . . . . . . . . . . . . . . . . 123Energy and Electricity Projections . . . . . . . . . . . . . . . . . . . . . . . . . . . . . . . 124Nuclear Electrical Generating Capacity Projections . . . . . . . . . . . . . . . . . 126
OCEANIA . . . . . . . . . . . . . . . . . . . . . . . . . . . . . . . . . . . . . . . . . . . . . . . . . 129
Final Energy Consumption in 2017 . . . . . . . . . . . . . . . . . . . . . . . . . . . . . . 130Electricity Production in 2017 . . . . . . . . . . . . . . . . . . . . . . . . . . . . . . . . . . 131Energy and Electricity Projections . . . . . . . . . . . . . . . . . . . . . . . . . . . . . . . 132Nuclear Electrical Generating Capacity Projections . . . . . . . . . . . . . . . . . 134
REGIONAL POPULATION DATA . . . . . . . . . . . . . . . . . . . . . . . . . . . . . . . 137


1
Introduction
Reference Data Series No. 1 (RDS-1) is an annual publication — currently in its thirty-eighth edition — containing estimates of energy, electricity and nuclear power trends up to the year 2050.
RDS-1 starts with a summary of the status of nuclear power in IAEA Member States as of the end of 2017 based on statistical data collected by the IAEA’s Power Reactor Information System (PRIS). It then presents estimates of energy and electricity up to 2050 derived from various international studies, including the International Energy Agency’s World Energy Outlook 2017 and the United States Energy Information Administration’s International Energy Outlook 2017. The energy and electricity data for 2017 are estimated, as the latest information available from the United Nations Department of Economic and Social Affairs is for 2015. Population data originate from World Population Prospects (2015 revision), published by the Population Division of the United Nations Department of Economic and Social Affairs. The 2017 values again are estimates.
As in previous editions of RDS-1, projections of nuclear power are presented as low and high estimates encompassing the uncertainties inherent in projecting trends. The projections are based on a critical review of (i) the global and regional energy, electricity and nuclear power projections made by other international organizations, (ii) national projections supplied by individual countries for a recent OECD Nuclear Energy Agency study and (iii) the estimates of the expert group participating in the IAEA’s yearly consultancy on nuclear capacity projections.
The estimates of future nuclear electrical generating capacity presented in Table 5 are derived using a country by country ‘bottom up’ approach. In deriving these estimates, a group of experts considers all the operating reactors, possible licence renewals, planned shutdowns and plausible construction projects foreseen for the next several decades. The experts build the projections project by project by assessing the plausibility of

2
each in light of, first, the assumptions of the low projections and, second, the assumptions of the high projections.
The low and high estimates reflect contrasting, but not extreme, underlying assumptions on the different driving factors that have an impact on nuclear power deployment. These factors, and the ways they might evolve, vary from country to country. The estimates presented provide a plausible range of nuclear capacity growth by region and worldwide. They are not intended to be predictive nor to reflect the whole range of possible futures from the lowest to the highest feasible.
The low case represents expectations about the future assuming that current market, technology and resource trends continue and there are few additional changes in laws, policies and regulations directly affecting nuclear power. This case was explicitly designed to produce a ‘conservative’ set of projections. Additionally, the low case does not assume that targets for nuclear power in a particular country will necessarily be achieved. These assumptions are relaxed in the high case.
The high case projections are much more ambitious, but are still plausible and technically feasible. The high case assumes that current rates of economic and electricity consumption growth will continue, particularly in the Eastern Asia region. Country policies toward climate change are also considered in the high case.
Over the short term, the low price of natural gas and the impact of subsidized intermittent renewable energy sources on electricity prices are expected to continue to affect nuclear growth prospects in some regions of the world. Moreover, natural gas has become more competitive owing to low prices and increased supply as a result of technological advances in gas extraction. In the near term, ongoing financial uncertainty and declining electricity consumption in some regions will continue to present challenges for capital intensive projects such as nuclear power. Heightened safety requirements, challenges in deploying advanced technologies and other factors have increased construction times and costs, contributing to delays. The expert group assumed that these challenges, in addition to the accident at the Fukushima Daiichi nuclear power plant, will

3
continue to affect nuclear development plans. The underlying fundamentals of population growth and electricity consumption in the developing world, as well as climate change and air quality concerns, security of energy supply and price volatility of other fuels, continue to point to nuclear generating capacity playing an important role in the energy mix in the longer run.
Compared with the 2017 projections to 2030, the 2018 projections were reduced by 45 gigawatt (electrical) (GW(e))1 in the high case and were increased by 6 GW(e) in the low case. These reductions reflect responses to the Fukushima Daiichi accident and other factors noted above. There are increasing uncertainties in these projections owing to the considerable number of reactors scheduled to be retired in some regions around 2030 and beyond. Significant new nuclear capacity would be necessary to offset any retirements resulting from factors such as ageing fleets and economic difficulties.
With respect to projections from 2030 to 2050, assumptions are made about the general rate of development and retirements. Given all the uncertainties, these estimates should be considered as suggestive of the potential outcomes.
Interest in nuclear power remains strong in some regions, particularly in the developing world. Commitments agreed to at the 21st session of the Conference of the Parties to the United Nations Framework Convention on Climate Change may also have an impact on nuclear energy development in the future.
1 The projections consist of both available capacity (currently supplying electricity to the grid) and installed nominal capacity (available, but not currently supplying electricity to the grid).

4
Geographical RegionsThe nuclear electrical generating capacity projections
presented in RDS-1 are grouped according to the geographical regions used by the Statistics Division of the United Nations Secretariat, available on-line at unstats.un.org/unsd/methodology/m49/.
The designations employed and the presentation of material in this publication do not imply the expression of any opinion whatsoever on the part of the IAEA concerning the legal status of any country, territory, city or area or of its authorities, or concerning the delimitation of its frontiers or boundaries.
NotesThe data on electricity produced by nuclear power plants are
converted to joules based on the average efficiency of a nuclear power plant (i.e. 33%); the data on electricity generated by geothermal heat are converted to joules based on the average efficiency of a geothermal power plant (i.e. 10%).
The conversion to joules of electricity generated from hydropower or from other non-thermal sources such as wind, tide and solar is based on the energy content of the electricity generated (the equivalent of assuming 100% efficiency).
Total final energy consumption refers to all fuel and energy delivered to users for their energy use and does not include non-energy use (i.e. deliveries of energy products for use as chemical feedstocks or as raw materials).
Owing to rounding, numbers presented throughout this publication may not add up precisely to the totals provided, and percentages may not precisely reflect the absolute figures.
Energy Units
1 MW(e) = 106 watts (electrical)1 GW(e) = 1000 MW(e) = 109 watts (electrical)1 GJ = 1 gigajoule = 109 joules1 EJ = 1 exajoule = 1018 joules1 EJ = 23.9 megatonnes of oil equivalent (Mtoe)1 TW·h = 1 terawatt-hour = 109 kW·h = 3.6 × 10⁻³ EJ

World


7
World
Nuclear Power Development around the World in 2017● There were 448 operational nuclear power reactors in the
world at the end of 2017, with a total net installed powercapacity of 392 GW(e).
● An additional 59 units with a total capacity of 60 GW(e)were under construction.
● During 2017, four new nuclear power reactors with a totalcapacity of 3373 MW(e) were connected to the grid, andfive reactors with a total capacity of 3025 MW(e) wereretired. In 2017, construction began on four new units thatare expected to add a total capacity of 4254 MW(e).
● Electricity generation from operational nuclear reactorsincreased about 1% in 2017, reaching 2503 TW∙h.
● Nuclear power accounted for about 10% of total electricityproduction in 2017.

8
World
Num
ber o
f U
nits
Net
Cap
acity
(M
W(e
))N
umbe
r of
Uni
tsN
et C
apac
ity
(MW
(e))
TW·h
Per c
ent o
f To
tal
Arg
entin
a3
1 63
31
25
5.7
4.0
Arm
enia
1 3
752.
436
.6
Bel
arus
11
080
Bel
gium
Bra
zil
75
918
11
340
40.0
47.7
Bul
garia
21
884
14.9
2.6
Can
ada
1913
554
95.1
13.8
Chi
na39
34 5
1418
19 0
1623
2.8
3.8
Cze
ch R
epub
lic6
3 93
026
.833
.5
Finl
and
42
769
11
600
21.6
32.6
Fran
ce58
63 1
301
1 63
038
1.8
72.3
Ger
man
y7
9 51
572
.211
.7
Hun
gary
41
889
15.2
49.1
Indi
a22
6 25
57
4 82
434
.92.
4
TAB
LE 1
. NU
CLE
AR
PO
WER
REA
CTO
RS
IN T
HE
WO
RLD
(end
of 2
017)
Cou
ntry
Ope
ratio
nal
Und
er C
onst
ruct
ion
Nuc
lear
Ele
ctric
ity
Prod
uctio
n in
2017
Bel
arus
Ban
glad
esh
22
220
21
926
14.9
40.0
Iran,
Isla
mic
Rep
ublic
of
1 9
156.
42.
1

9
World
Japa
n42
39 7
522
2 65
329
.32.
7
Kore
a, R
epub
lic o
f 24
22 4
944
5 36
014
1.3
25.5
Rom
ania
21
300
10.6
17.9
Rus
sian
Fed
erat
ion
3526
142
75
520
190.
118
.5
Slov
akia
41
814
2 8
8014
.060
.1
Slov
enia
1 6
886.
035
.5
Sout
h Af
rica
21
860
15.1
6.3
Spai
n7
7 12
155
.621
.0
Swed
en8
8 62
963
.139
.5
Switz
erla
nd5
3 33
319
.635
.1
Ukr
aine
1513
107
22
070
80.4
55.3
Uni
ted
Arab
Em
irate
s4
5 38
0
Uni
ted
King
dom
158
918
63.9
20.0
Uni
ted
Stat
es o
f Am
eric
a99
99 9
522
2 23
480
5.6
19.9
Wor
ld T
otal
a44
839
1 721
5960
460
2 502.9
10.3
a In
clud
es th
e fo
llow
ing
data
from
Tai
wan
, Chi
na: 6
uni
ts in
ope
ratio
n w
ith a
tota
l cap
acity
of 5
052
MW
(e),
2 un
its u
nder
con
stru
ctio
n w
ith a
to
tal c
apac
ity o
f 260
0 M
W(e
), an
d 21
.6 T
W·h
of n
ucle
ar e
lect
ricity
gen
erat
ion,
repr
esen
ting
8.4%
of t
he to
tal e
lect
ricity
pro
duce
d.
Mex
ico
21
552
10.6
3.5
Net
herla
nds
1 4
823.
33.
0
Paki
stan
51
318
22
028
8.1
6.8
10
World
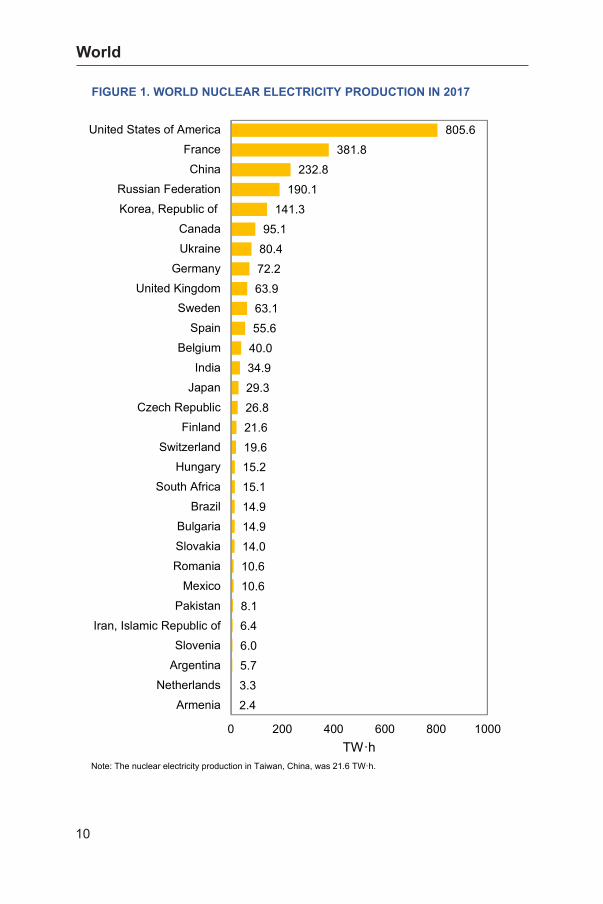
FIGURE 1. WORLD NUCLEAR ELECTRICITY PRODUCTION IN 2017
Note: The nuclear electricity production in Taiwan, China, was 21.6 TW·h.
8.16.46.05.73.32.4
10.610.6
34.929.326.821.619.615.215.114.914.914.0
40.0
72.263.963.155.6
95.180.4
141.3190.1
232.8381.8
805.6
0 200 400 600 800 1000
CanadaUkraine
GermanyUnited Kingdom
SwedenSpain
BelgiumIndia
JapanCzech Republic
FinlandSwitzerland
HungarySouth Africa
BrazilBulgariaSlovakiaRomania
MexicoPakistan
Iran, Islamic Republic ofSlovenia
ArgentinaNetherlands
Armenia
ChinaRussian FederationKorea, Republic of
FranceUnited States of America
TW·h

11
World
FIGURE 2. SHARE OF NUCLEAR IN TOTAL ELECTRICITY PRODUCTION IN THE WORLD IN 2017
Note: The share of nuclear in the total electricity production of Taiwan, China, was 8.4%.
0 20 80 10040 60Nuclear Share (%)
3.83.53.02.72.62.42.1
6.34.0
6.811.713.8
17.918.5
21.020.019.9
32.625.5
33.535.135.536.6
39.540.0
47.749.1
55.360.1
72.3
SpainUnited Kingdom
United States of AmericaRussian Federation
RomaniaCanada
GermanyPakistan
South AfricaArgentina
ChinaMexico
NetherlandsJapanBrazilIndia
Iran, Islamic Republic of
FinlandKorea, Republic of
Czech RepublicSwitzerland
BelgiumBulgariaSwedenArmeniaSlovenia
FranceSlovakiaUkraine
Hungary


13
World
Final Energy Consumption in 2017Globally, electricity accounted for about 19% of the total final energy consumption in 2017. About 70% of the final energy consumption was in the form of fossil fuels. Bioenergy and waste accounted for 11%.
As electricity consumption is expected to increase faster than total final energy consumption in the coming years, the share of electricity consumption is expected to rise.
FIGURE 3. WORLD FINAL ENERGY CONSUMPTION BY ENERGY SOURCE IN 2017
13%
40%
14%
11%
19%
3.4%
Coal, Lignite and Peat
Oil
Natural Gas
Bioenergy and Waste
Electricity
Heat and Other

14
World
Electricity Production ● Total electricity production grew by 2.7% in 2017 while the growth in nuclear electricity production was 1.1%.
● Among the various sources for electricity production, coal remained dominant despite the significant growth of natural gas based generation.
● The share of electricity production from natural gas increased by 0.4 percentage points to reach 23.1% of total electricity production.
● The contribution of hydropower and renewable energy sources continued to increase significantly, reaching 25.1% in 2017, while the share of nuclear electricity production remained at about 10.3% of the total electricity production.

15
World
Note: Estimates are expressed in gross figures. Gross electricity production is the total electrical energy produced by all generating units and installations, including pumped storage, measured at the output terminals of the generators.
FIGURE 4. BREAKDOWN OF WORLD TOTAL ELECTRICITY PRODUCTION BY ENERGY SOURCE DURING THE PERIOD 1971–2017
0
5 000
10 000
15 000
20 000
25 000
30 000
1971 1975 1980 1985 1990 1995 2000 2005 2010 2017
TW
·h
GeothermalSolarWindBioenergy and WasteNuclearHydroNatural GasOilCoal, Lignite and Peat

16
World
Energy and Electricity Projections ● World energy consumption is expected to increase by 18% by 2030 and by 38% by 2050, at an annual growth rate of about 1%.
● Electricity consumption will grow at a higher rate of about 2.5% per year up to 2030 and around 2% per year thereafter.
● The share of electricity in total final energy consumption will thus increase from 18.5% in 2017 to 21% by 2030 and to 26.6% by the middle of the century.

17
World
FIGURE 5. WORLD FINAL CONSUMPTION OF ENERGY AND ELECTRICITY
0
100
200
300
400
500
600
700
2017 2030 2040 2050
EJ
Electricity Energy
Energy (EJ)
Electricity (EJ)
% of total 21.1
76.5
18.5
a Final consumption refers to all fuel and energy that is delivered to energy consumers.
125.0
24.0
151.8 102.6
26.6
TABLE 2. WORLD FINAL CONSUMPTION OF ENERGY AND ELECTRICITY
Final Consumption 2017
412.8 486.7 520.7 571.6
2030 2040 2050
a

18
World
Nuclear Electrical Generating Capacity Projections
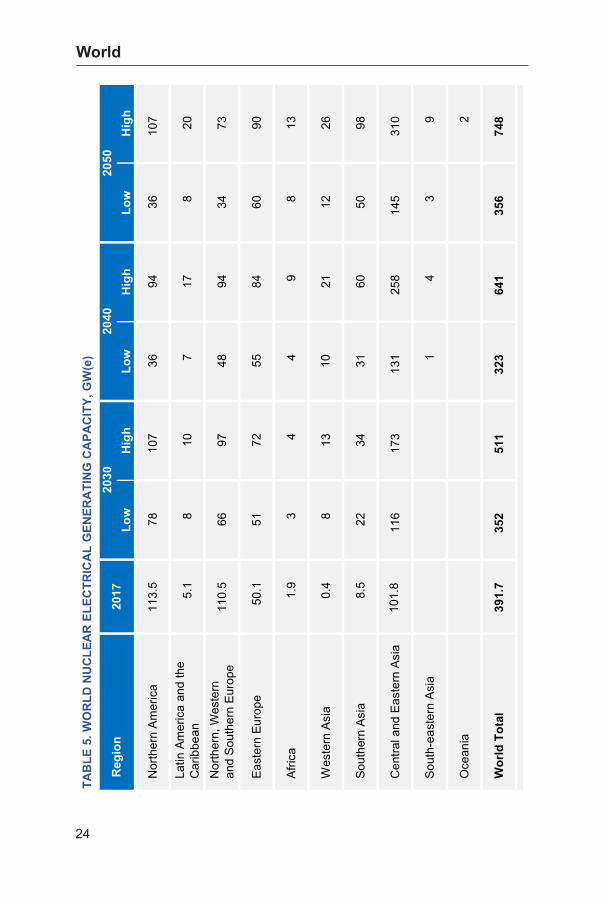
● The world nuclear electrical generating capacity is projected to increase to 511 GW(e) by 2030 and to 748 GW(e) by 2050 in the high case. This represents a 30% increase over current levels by 2030 and a 90% increase of capacity by 2050.
● In the low case, the world nuclear electrical generating capacity is projected to gradually decline until 2040 and then rebound to the 2030 level by 2050.
● The world total electrical generating capacity is expected to increase from 6922 GW(e) in 2017 to 9826 GW(e) by 2030 and to 12 908 GW(e) by 2050.
● The share of nuclear electrical generating capacity in the world total electrical capacity will be about 3% in the low case and about 6% in the high case by the middle of the century.

19
World
FIGURE 6. WORLD NUCLEAR ELECTRICAL GENERATING CAPACITY
0
100
200
300
400
500
600
700
800
Low High Low High Low High2017 2030 2040 2050
GW
(e)
Low High Low High Low High
352 511 323 641 356 748
Total (GW(e))
Nuclear (GW(e))
% of total 3.6 5.2 2.8 5.6 2.8 5.8
2050a
TABLE 3. WORLD TOTAL AND NUCLEAR ELECTRICAL GENERATING CAPACITY
Electrical Capacity
6 922
20172030a 2040a
9 826 11 518 12 908
392
5.7
a Nuclear capacity estimates take into account the scheduled retirement of older units at the end of their lifetime.
20
World
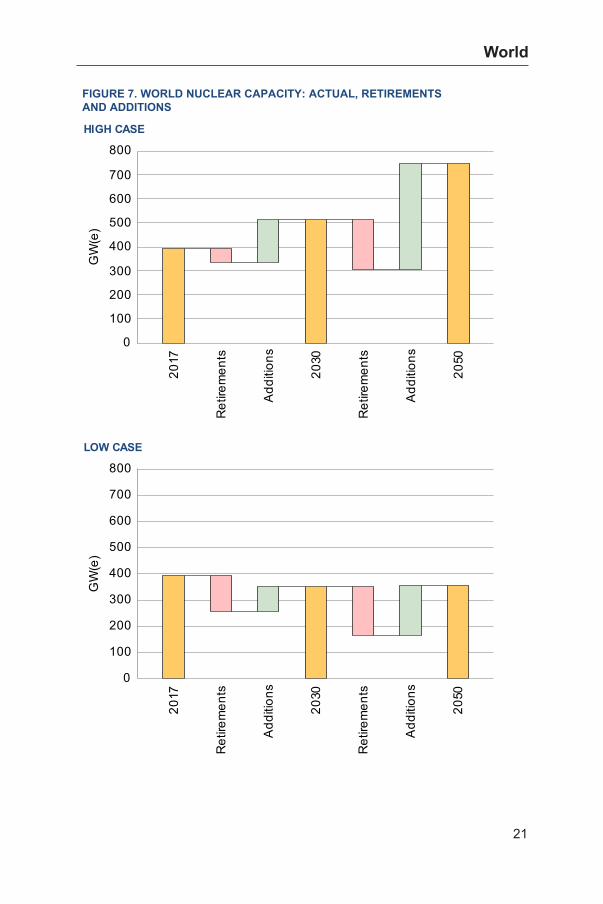
Reactor Retirements and Additions ● More than half of the existing nuclear power reactors are over 30 years old and are scheduled to be retired in the coming years.
● In the low case, about 139 GW(e) of nuclear electrical generating capacity will be retired and new reactors will add 99 GW(e) of capacity by 2030. Between 2030 and 2050, an additional 186 GW(e) will be retired and 190 GW(e) of new capacity will be added.
● In the high case, it is assumed that several of the nuclear power reactors scheduled for retirement will be given a life extension, so that only 55 GW(e) of nuclear electrical generating capacity will be retired by 2030, with an additional 207 GW(e) retired by 2050. In this case, the new reactors will add 175 GW(e) of nuclear electrical generating capacity by 2030 and about 443 GW(e) of capacity by 2050.
21
World
LOW CASE
HIGH CASE
2017
Retirements
Additions
2030
Retirements
Additions
2050
GW(e)
0
100
200
300
400
500
600
700
800
2017
Retirements
Additions
2030
Retirements
Additions
2050
GW(e)
0
100
200
300
400
500
600
700
800
FIGURE 7. WORLD NUCLEAR CAPACITY: ACTUAL, RETIREMENTS AND ADDITIONS

22
World
Electricity and Nuclear Production Projections
● The total nuclear electricity production in the world will continue to increase between now and 2050.
● In the high case, by 2030 nuclear electricity production will increase by 59% from the 2017 level of 2503 TW·h, and a further increase of 52% will occur over the next 20 years. Altogether, a 2.4-fold increase over the present level is expected by 2050.
● In the low case, despite nuclear electrical generating capacity declining from the present level until 2040 and then rebounding, nuclear electricity production will increase by about 9% by 2030 and about 15% by 2050.
● The share of nuclear electricity in total electricity production in the world will decrease in the low case from about 10.3% in 2017 to 7.9% in 2030 and 5.6% in 2050. However, in the high case, its share will increase to 12% in 2030 and to 11.7% in 2050.

23
World
FIGURE 8. WORLD NUCLEAR ELECTRICITY PRODUCTION
0
1 000
2 000
3 000
4 000
5 000
6 000
7 000
Low High Low High Low High2017 2030 2040 2050
TW·h
Low High Low High Low High
Total (TW·h)
Nuclear (TW·h) 2 732 3 969 2 560 5 087 2 869 6 028
% of total 7.9 11.5 6.0 12.0 5.6 11.7
2 503
10.3
a The nuclear production data presented in this table and the nuclear electrical generating capacity data presented in Table 3 cannot be used to calculate average annual capacity factors for nuclear plants as Table 3 presents year-end capacity.
TABLE 4. WORLD TOTAL AND NUCLEAR ELECTRICAL PRODUCTIONa
Electricity Production 2017
2030 2040 2050
24 269 34 579 42 335 51 388
24
World
Low
Hig
hLo
wH
igh
Low
Hig
h
Nor
ther
n Am
eric
a11
3.5
78107
3694
36107
Latin
Am
eric
a an
d th
e C
arib
bean
5.1
810
717
820
Nor
ther
n, W
este
rn
and
Sout
hern
Eur
ope
110.5
6697
4894
3473
East
ern
Euro
pe50
.151
7255
8460
90
Afric
a1.
93
44
98
13
Wes
tern
Asi
a0.
48
1310
2112
26
Sout
hern
Asi
a8.5
2234
3160
5098
Cen
tral a
nd E
aste
rn A
sia
101.8
116
173
131
258
145
310
Oce
ania
2
Wor
ld T
otal
391.7
352
511
323
641
356
748
TAB
LE 5
. WO
RLD
NU
CLE
AR
ELE
CTR
ICA
L G
ENER
ATI
NG
CA
PAC
ITY,
GW
(e)
Reg
ion
2030
2040
2050
2017
Sout
h-ea
ster
n As
ia1
43
9

25
World
Low
Hig
hLo
wH
igh
Low
Hig
h
Nor
ther
n Am
eric
a 9
00.7
6
24 8
54 2
89 7
53 2
91 8
66
Latin
Am
eric
a an
d th
e C
arib
bean
31.
2 6
0 7
5 5
4 1
34 6
3 1
62
Nor
ther
n, W
este
rn
and
Sout
hern
Eur
ope
727
.1
523
765
383
752
274
590
East
ern
Euro
pe 3
52.0
3
99 5
73 4
40 6
70 4
80 7
23
Afric
a 1
5.1
23
32
34
72
68
108
Wes
tern
Asi
a 2
.4
59
98
77
163
95
208
Sout
hern
Asi
a 4
9.4
173
272
252
482
404
786
Cen
tral a
nd E
aste
rn A
sia
425
.0
871
1 30
01
023
2 030
1 17
02
496
Oce
ania
16
Wor
ld T
otal
2 50
2.9
2 73
23
969
2 56
05
087
2 87
06
028
TAB
LE 6
. WO
RLD
NU
CLE
AR
ELE
CTR
ICIT
Y PR
OD
UC
TIO
N, T
W·h
Reg
ion
2017
2030
2040
2050
Sout
h-ea
ster
n As
ia 8
31
24
73


Northern America

28
Northern America
Final Energy Consumption in 2017Final energy consumption in the Northern America region in 2017 was dominated by the use of oil. Electricity made up about one fifth of the total consumption, followed by gas, accounting for another fifth.
FIGURE 9. FINAL ENERGY CONSUMPTION BY ENERGY SOURCE IN THE NORTHERN AMERICA REGION IN 2017
1.4%
50%
21%
5%
21%
0.5%
Coal, Lignite and Peat
Oil
Natural Gas
Bioenergy and Waste
Electricity
Heat and Other

29
Northern America
FIGURE 10. ELECTRICITY PRODUCTION BY ENERGY SOURCE IN THE NORTHERN AMERICA REGION IN 2017
28%
1%
28%
2%
15%
19%
6%
1.6%0.4%
0.2% Coal, Lignite and Peat
Oil
Natural Gas
Bioenergy and Waste
Hydro
Nuclear
Wind
Solar
Geothermal
Other
Electricity Production in 2017In the electricity production mix in 2017, gas based electricity production grew to around 30% of the total, reaching the level of coal. Nuclear electricity remained at about 20% of the total. Hydropower and other renewables provided about 25% of the total electricity production.

30
Northern America
Energy and Electricity Projections ● Final energy consumption in the Northern America region is expected to decrease owing to efficiency improvements and structural changes in the economy. A decrease of about 5.6% from the present level of 72 EJ is expected by 2030, reaching about 9.7% by 2050.
● In contrast, electricity consumption will continue to increase, albeit at a slow pace (0.5% growth annually).
● The share of electricity in final energy consumption will thus stay level from 2017 to 2030 at 21.3% and increase to about 27% by the middle of the century.

31
Northern America
FIGURE 11. FINAL CONSUMPTION OF ENERGY AND ELECTRICITY IN THE NORTHERN AMERICA REGION
0
10
20
30
40
50
60
70
80
2017 2030 2040 2050
EJ
Electricity Energy
Energy (EJ)
Electricity (EJ)
% of total
TABLE 7. FINAL CONSUMPTION OF ENERGY AND ELECTRICITY IN THE NORTHERN AMERICA REGION
Final Consumption 2017
71.6 68.5 66.1 65.3
2030 2040 2050
15.3
21.3
a Final consumption refers to all fuel and energy that is delivered to energy consumers.
16.4
24.8
17.5 15.8
26.823.1
a

32
Northern America
Nuclear Electrical Generating Capacity Projections
● Electrical generating capacity in the Northern America region is projected to increase by 8.9% to reach 1474 GW(e) by 2030, and then to decrease slightly to 1435 GW(e) by 2050.
● Nuclear electrical generating capacity is expected to change significantly in this region over the next two decades.
● In the low case, nuclear electrical generating capacity is projected to decrease from the 2017 level of 113 GW(e) to 78 GW(e) by 2030 and then to 36 GW(e) by 2050. The share of nuclear electrical generating capacity in total electricity capacity is projected to decrease from 8.4% in 2017 to 5.3% by 2030 and to 2.5% by 2050.
● In the high case, nuclear electrical generating capacity is projected to remain near its current level throughout the period. It will first decrease to 107 GW(e) in 2030, then decrease to 94 GW(e) in 2040, and finally return back to 2030 level. The share of nuclear electrical generating capacity in total electricity capacity will, however, decrease from 8.4% to 7.3% in 2030 and then increase slightly to 7.5% by 2050.

33
Northern America
FIGURE 12. NUCLEAR ELECTRICAL GENERATING CAPACITY IN THE NORTHERN AMERICA REGION
0
20
40
60
80
100
120
Low High Low High Low High2017 2030 2040 2050
GW
(e)
Low High Low High Low High
Total (GW(e))
Nuclear (GW(e)) 78 107 36 94 36 107
% of total 5.3 7.3 2.4 6.3 2.5 7.5
a Nuclear capacity estimates take into account the scheduled retirement of older units at the end of their lifetime.
1 474 1 488 1 435
113
8.4
2050a
TABLE 8. TOTAL AND NUCLEAR ELECTRICAL GENERATING CAPACITYIN THE NORTHERN AMERICA REGION
Electrical Capacity
1 353
20172030a 2040a

34
Northern America
Reactor Retirements and Additions ● Almost all of the existing nuclear power reactors in the Northern America region are scheduled to be retired by the middle of the century.
● In the low case, about 36 GW(e) of nuclear electrical generating capacity will be retired by 2030. An additional 77 GW(e) of capacity will be retired between 2030 and 2050. The projected additions of nuclear electrical generating capacity in this case are only minimal by 2030 and some 35 GW(e) by 2050.
● In the high case, some nuclear power reactor retirements will be delayed by plant life extensions; however, these plants will also be retired by the middle of the century. The additions of nuclear electrical generating capacity in this case are projected to be 6 GW(e) by 2030 and some 75 GW(e) by 2050.

35
Northern America
LOW CASE
HIGH CASE
2017
Retirements
Additions
2030
Retirements
Additions
2050
GW(e)
0
20
40
60
80
100
120
140
2017
Retirements
Additions
2030
Retirements
Additions
2050
GW(e)
0
20
40
60
80
100
120
140
FIGURE 13. NUCLEAR CAPACITY IN THE NORTHERN AMERICA REGION: ACTUAL, RETIREMENTS AND ADDITIONS

36
Northern America
Electricity and Nuclear Production Projections
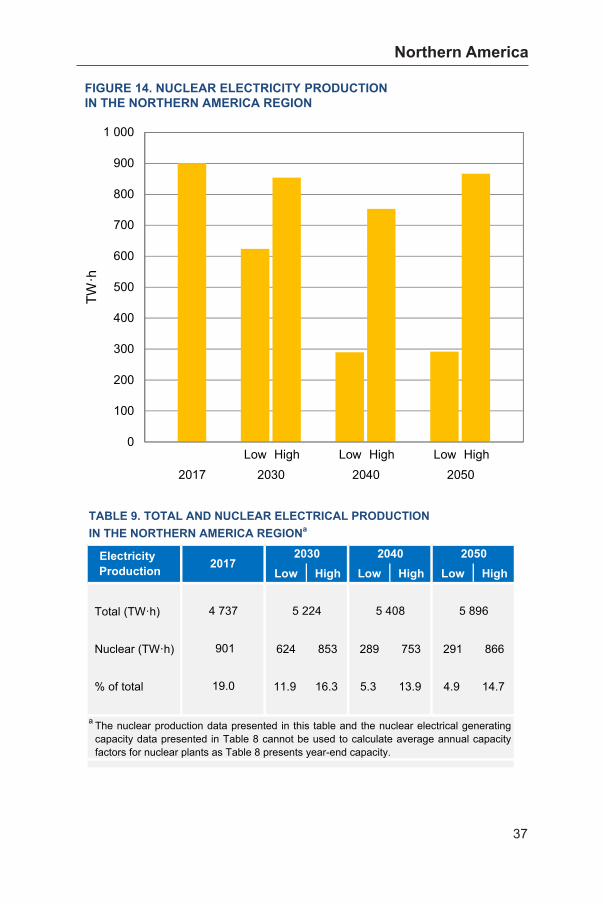
● The total electricity production in the Northern America region is projected to increase from 4737 TW∙h in 2017 to 5224 TW∙h in 2030 — an increase of about 10% over 13 years — and then to 5896 TW∙h by 2050.
● The contribution of nuclear electricity is projected to undergo significant changes in both the low and the high case.
● In the low case, nuclear electricity production is projected to decrease significantly — from 901 TW∙h in 2017 to 624 TW∙h in 2030 and to 291 TW∙h in 2050. The share of nuclear electricity in total electricity production will thus decrease from 19% in 2017 to 11.9% in 2030 and to only about 5% in 2050.
● In the high case, nuclear electricity production is projected to decrease by about 5.3% from 901 TW∙h in 2017 to 853 TW∙h in 2030, and then to increase to 866 TW∙h in 2050. The share of nuclear electricity production in total electricity will likewise decrease, falling from 19% to 16.3% in 2030 and to 14.7% in 2050.
37
Northern America
FIGURE 14. NUCLEAR ELECTRICITY PRODUCTION IN THE NORTHERN AMERICA REGION
0
100
200
300
400
500
600
700
800
900
1 000
Low High Low High Low High2017 2030 2040 2050
TW·h
Low High Low High Low High
Total (TW·h)
Nuclear (TW·h) 624 853 289 753 291 866
% of total 11.9 16.3 5.3 13.9 4.9 14.7
901
19.0
a The nuclear production data presented in this table and the nuclear electrical generating capacity data presented in Table 8 cannot be used to calculate average annual capacity factors for nuclear plants as Table 8 presents year-end capacity.
TABLE 9. TOTAL AND NUCLEAR ELECTRICAL PRODUCTIONIN THE NORTHERN AMERICA REGIONa
Electricity Production 2017
2030 2040 2050
4 737 5 224 5 408 5 896


Latin America and the Caribbean
40
Latin America and the Caribbean
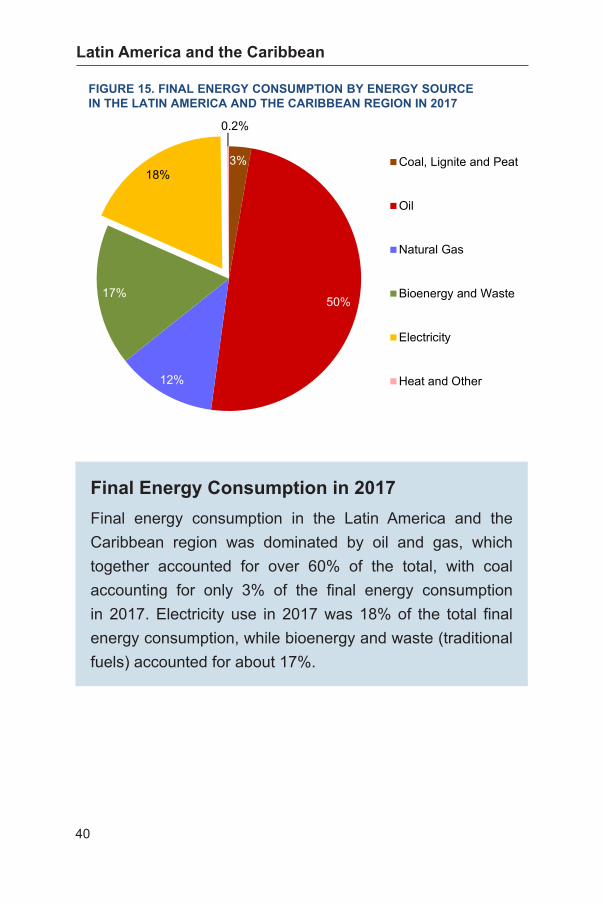
Final Energy Consumption in 2017Final energy consumption in the Latin America and the Caribbean region was dominated by oil and gas, which together accounted for over 60% of the total, with coal accounting for only 3% of the final energy consumption in 2017. Electricity use in 2017 was 18% of the total final energy consumption, while bioenergy and waste (traditional fuels) accounted for about 17%.
FIGURE 15. FINAL ENERGY CONSUMPTION BY ENERGY SOURCE IN THE LATIN AMERICA AND THE CARIBBEAN REGION IN 2017
3%
50%
12%
17%
18%
0.2%
Coal, Lignite and Peat
Oil
Natural Gas
Bioenergy and Waste
Electricity
Heat and Other

41
Latin America and the Caribbean
FIGURE 16. ELECTRICITY PRODUCTION BY ENERGY SOURCE IN THE LATIN AMERICA AND THE CARIBBEAN REGION IN 2017
6%
9%
27%
5%
45%
2%
4%
0.5% 0.6%Coal, Lignite and Peat
Oil
Natural Gas
Bioenergy and Waste
Hydro
Nuclear
Wind
Solar
Geothermal
Electricity Production in 2017 Hydropower is the main source of electricity production in the Latin America and the Caribbean region, providing about 45% of the total electricity production. Fossil fuel based electricity production accounted for about 42% of the total, led by gas at 27%. Renewables and other sources contributed about 12% to the total electricity production in 2017. Nuclear electricity had only a 2% share in total electricity production in the region.

42
Latin America and the Caribbean
Energy and Electricity Projections ● The total final energy consumption in the Latin America and the Caribbean region is expected to increase by about 1.5% per year up to the middle of the century.
● Electricity consumption, however, will increase at a slightly faster rate of 2.1% growth annually.
● The share of electricity in final energy consumption will increase from 18.2% in 2017 to 18.8% in 2030 and about 23.7% by the middle of the century.

43
Latin America and the Caribbean
FIGURE 17. FINAL CONSUMPTION OF ENERGY AND ELECTRICITYIN THE LATIN AMERICA AND THE CARIBBEAN REGION
0
5
10
15
20
25
30
35
40
45
50
2017 2030 2040 2050
EJ
Electricity Energy
Energy (EJ)
Electricity (EJ)
% of total
TABLE 10. FINAL CONSUMPTION OF ENERGY AND ELECTRICITYIN THE LATIN AMERICA AND THE CARIBBEAN REGION
Final Consumption 2017
25.3 33.1 38.1 43.0
2030 2040 2050
4.6
18.2
a Final consumption refers to all fuel and energy that is delivered to energy consumers.
8.0
21.1
10.2 6.2
23.718.8
a

44
Latin America and the Caribbean
Nuclear Electrical Generating Capacity Projections
● Electrical generating capacity in the Latin America and the Caribbean region is projected to increase by 32%, reaching 548 GW(e) by 2030 and 809 GW(e) by 2050.
● Nuclear electrical generating capacity is projected to increase in both the low and the high case, but the role of nuclear electricity will remain small.
● In the low case, nuclear electrical generating capacity is projected to increase from 5 GW(e) in 2017 to 8 GW(e) by 2030 and to stay at that level until 2050. The share of nuclear in the total electrical generating capacity is projected to increase slightly from 1.2% to 1.4% by 2030 and then to decrease to 1% by 2050.
● In contrast, in the high case, nuclear electrical generating capacity is projected to increase to 10 GW(e) in 2030 and to 20 GW(e) in 2050. The share of nuclear electrical generating capacity in total electrical capacity will thus increase to 1.8% in 2030 and to 2.5% in 2050.

45
Latin America and the Caribbean
FIGURE 18. NUCLEAR ELECTRICAL GENERATING CAPACITYIN THE LATIN AMERICA AND THE CARIBBEAN REGION
0
5
10
15
20
25
Low High Low High Low High2017 2030 2040 2050
GW
(e)
Low High Low High Low High
Total (GW(e))
Nuclear (GW(e)) 8 10 7 17 8 20
% of total 1.4 1.8 1.0 2.5 1.0 2.5
a Nuclear capacity estimates take into account the scheduled retirement of older units at the end of their lifetime.
548 685 809
5
1.2
2050a
TABLE 11. TOTAL AND NUCLEAR ELECTRICAL GENERATING CAPACITYIN THE LATIN AMERICA AND THE CARIBBEAN REGION
Electrical Capacity
415
20172030a 2040a
46
Latin America and the Caribbean
Reactor Retirements and Additions ● There are seven nuclear power reactors operating in the Latin America and the Caribbean region. All but one were constructed before 2001 and are scheduled to be retired by the middle of the century.
● In the low case, 4.4 GW(e) of the existing nuclear electrical generating capacity will be retired by 2050. In the high case, retirement of some of the nuclear power reactors will be delayed by plant life extensions, and about half the existing nuclear capacity will be retired.
● The projected additions of nuclear electrical generating capacity in the high case are 5 GW(e) by 2030 and an additional 12 GW(e) by 2050. In the low case, only 7 GW(e) of additional capacity is projected for the entire period.

47
Latin America and the Caribbean
LOW CASE
HIGH CASE
2017
Retirements
Additions
2030
Retirements
Additions
2050
GW(e)
0
5
10
15
20
25
302017
Retirements
Additions
2030
Retirements
Additions
2050
GW(e)
0
5
10
15
20
25
30
FIGURE 19. NUCLEAR CAPACITY IN THE LATIN AMERICA AND THE CARIBBEAN REGION: ACTUAL, RETIREMENTS AND ADDITIONS

48
Latin America and the Caribbean
Electricity and Nuclear Production Projections
● Total electricity production in the Latin America and the Caribbean region is projected to increase by around 2.4% per year.
● Nuclear electricity production is projected to increase in both the low and the high case, but its role will remain small in the coming decades.
● In the low case, nuclear electricity production will almost double in the next 13 years to reach 60 TW∙h in 2030, after which it will first decrease and then recover to 63 TW∙h in 2050. The share of nuclear electricity in total electricity production will thus initially increase to 2.8% in 2030 and then decrease to 1.8% in 2050.
● In the high case, nuclear electricity production is projected to increase by 7% per year up to 2030 and then by 4% per year up to 2050. The share of nuclear electricity in total electricity production will therefore increase from 2% in 2017 to 3.5% in 2030 and to 4.5% in 2050.

49
Latin America and the Caribbean
FIGURE 20. NUCLEAR ELECTRICITY PRODUCTIONIN THE LATIN AMERICA AND THE CARIBBEAN REGION
0
20
40
60
80
100
120
140
160
180
Low High Low High Low High2017 2030 2040 2050
TW·h
Low High Low High Low High
Total (TW·h)
Nuclear (TW·h) 60 75 54 134 63 162
% of total 2.8 3.5 1.9 4.8 1.8 4.5
31
2.0
a The nuclear production data presented in this table and the nuclear electrical generating capacity data presented in Table 11 cannot be used to calculate average annual capacity factors for nuclear plants as Table 11 presents year-end capacity.
TABLE 12. TOTAL AND NUCLEAR ELECTRICAL PRODUCTIONIN THE LATIN AMERICA AND THE CARIBBEAN REGIONa
Electricity Production 2017
2030 2040 2050
1 559 2 171 2 809 3 576


Northern, Western and Southern Europe

52
Northern, Western and Southern Europe
FIGURE 21. FINAL ENERGY CONSUMPTION BY ENERGY SOURCE IN THE COMBINED REGIONS OF NORTHERN, WESTERN AND SOUTHERN EUROPE IN 2017
3%
42%
21%
8%
22%
4% Coal, Lignite and Peat
Oil
Natural Gas
Bioenergy and Waste
Electricity
Heat and Other
Final Energy Consumption in 2017Final energy consumption in the combined regions of Northern, Western and Southern Europe continued to be dominated by fossil fuels in 2017. Electricity provided 22% of the total final energy consumed.
53
Northern, Western and Southern Europe
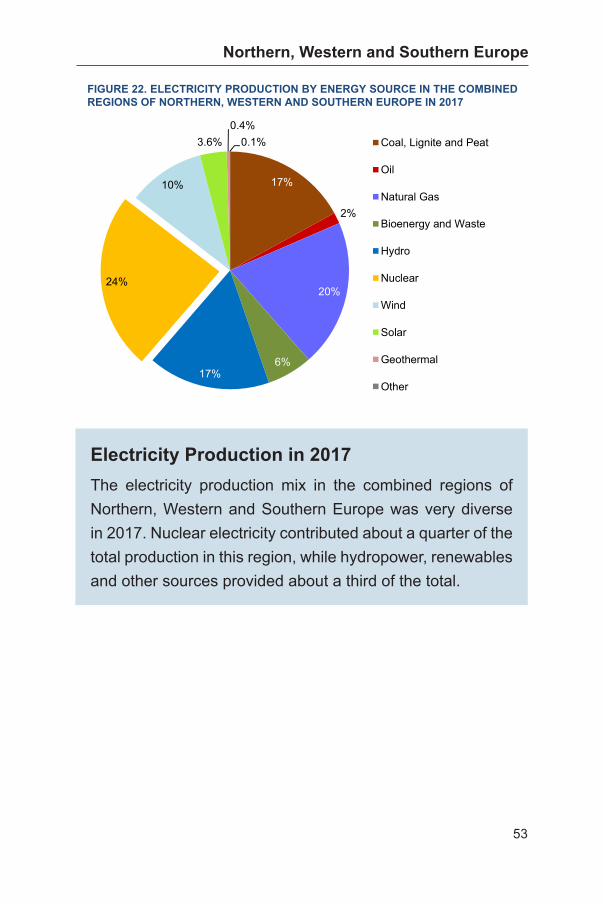
FIGURE 22. ELECTRICITY PRODUCTION BY ENERGY SOURCE IN THE COMBINED REGIONS OF NORTHERN, WESTERN AND SOUTHERN EUROPE IN 2017
17%
2%
20%
6%17%
24%
10%
3.6%0.4%
0.1% Coal, Lignite and Peat
Oil
Natural Gas
Bioenergy and Waste
Hydro
Nuclear
Wind
Solar
Geothermal
Other
Electricity Production in 2017 The electricity production mix in the combined regions of Northern, Western and Southern Europe was very diverse in 2017. Nuclear electricity contributed about a quarter of the total production in this region, while hydropower, renewables and other sources provided about a third of the total.

54
Northern, Western and Southern Europe
Energy and Electricity Projections ● Total final energy consumption in the combined regions of Northern, Western and Southern Europe is expected to decrease as a result of efficiency improvements and structural changes in the economy. Decreases of about 6% and about 13% from the present level of 45 EJ are expected by 2030 and by 2050, respectively.
● Electricity consumption will initially remain the same but will increase after 2030, with a 20% increase expected between 2030 and 2050.
● The share of electricity in final energy consumption will thus increase from 21.7% in 2017 to 24.2% by 2030 and to 30.3% by 2050.

55
Northern, Western and Southern Europe
FIGURE 23. FINAL CONSUMPTION OF ENERGY AND ELECTRICITY IN THE COMBINED REGIONS OF NORTHERN, WESTERN AND SOUTHERN EUROPE
0
5
10
15
20
25
30
35
40
45
50
2017 2030 2040 2050
EJ
Electricity Energy
Energy (EJ)
Electricity (EJ)
% of total
TABLE 13. FINAL CONSUMPTION OF ENERGY AND ELECTRICITY IN THE COMBINED REGIONS OF NORTHERN, WESTERN AND SOUTHERN EUROPE
Final Consumption 2017
44.7 42.2 39.6 39.4
2030 2040 2050
9.7
21.7
a Final consumption refers to all fuel and energy that is delivered to energy consumers.
10.8
27.3
11.9 10.2
30.324.2
a

56
Northern, Western and Southern Europe
Nuclear Electrical Generating Capacity Projections
● Total electrical generating capacity in the combined regions of Northern, Western and Southern Europe is projected to increase by 14% by 2030 and by 10% to reach 1215 GW(e) by 2050.
● Several countries in these regions have announced a phaseout of nuclear power. The regions’ nuclear power capacity will therefore change significantly in the coming years.
● In the low case, nuclear electrical generating capacity is projected to decrease by 40% by 2030 and by 70% by 2050. The share of nuclear power capacity in total electricity capacity will thus decrease from 11.3% in 2017 to 6% by 2030 and to 2.8% by 2050.
● In the high case, the nuclear electrical generating capacity is projected to remain to decrease to 97 GW(e) by 2030 and then down to 73 GW(e) in 2050. The share of nuclear power capacity in the total electricity production capacity will therefore decrease from 11.3% in 2017 to 8.7% in 2030 and to 6% in 2050.

57
Northern, Western and Southern Europe
FIGURE 24. NUCLEAR ELECTRICAL GENERATING CAPACITY IN THE COMBINED REGIONS OF NORTHERN, WESTERN AND SOUTHERN EUROPE
0
20
40
60
80
100
120
Low High Low High Low High2017 2030 2040 2050
GW
(e)
Low High Low High Low High
Total (GW(e))
Nuclear (GW(e)) 66 97 48 94 34 73
% of total 6.0 8.7 4.1 8.1 2.8 6.0
a Nuclear capacity estimates take into account the scheduled retirement of older units at the end of their lifetime.
1 108 1 164 1 215
111
11.3
2050a
TABLE 14. TOTAL AND NUCLEAR ELECTRICAL GENERATING CAPACITY IN THE COMBINED REGIONS OF NORTHERN, WESTERN AND SOUTHERN EUROPE
Electrical Capacity
970
20172030a 2040a

58
Northern, Western and Southern Europe
Reactor Retirements and Additions ● Almost all of the existing nuclear power reactors in the combined regions of Northern, Western and Southern Europe are scheduled to be retired by the middle of the century.
● In the low case, about 52 GW(e) of nuclear electrical generating capacity will be retired by 2030 and an additional 47 GW(e) of capacity will be retired between 2030 and 2050. The projected additions of nuclear capacity in this case are only 8 GW(e) by 2030 and some 16 GW(e) by 2050.
● In the high case, nuclear power reactor retirements will be delayed; the majority of the reactors will be retired between 2030 and 2050. The additions of nuclear capacity in this case are projected to be 9 GW(e) by 2030 and some 50 GW(e) by 2050.

59
Northern, Western and Southern Europe
LOW CASE
HIGH CASE
2017
Retirements
Additions
2030
Retirements
Additions
2050
GW(e)
0
20
40
60
80
100
120
1402017
Retirements
Additions
2030
Retirements
Additions
2050
GW(e)
0
20
40
60
80
100
120
140
FIGURE 25. NUCLEAR CAPACITY IN THE COMBINED REGIONS OF NORTHERN, WESTERN AND SOUTHERN EUROPE: ACTUAL, RETIREMENTS AND ADDITIONS

60
Northern, Western and Southern Europe
Electricity and Nuclear Production Projections
● Total electricity production in the combined regions of Northern, Western and Southern Europe is projected to increase from 3032 TW∙h in 2017 to 3252 TW∙h in 2030 — an increase of about 7% over 13 years — with an additional increase of 18% to reach 3809 TW∙h by 2050.
● In the low case, nuclear electricity production will decrease significantly from 727 TW∙h in 2017 to 523 TW∙h in 2030 and to 274 TW∙h in 2050. The share of nuclear electricity in the total will thus decrease from 24% in 2017 to 16.1% by 2030 and to 7.2% by 2050.
● In the high case, nuclear electricity production is projected first to increase by about 5% by 2030, and then to decrease significantly by 23% between 2030 and 2050. The share of nuclear electricity in total electricity production will essentially remain constant until 2030, but gradually decrease thereafter to reach 15.5% by 2050.

61
Northern, Western and Southern Europe
FIGURE 26. NUCLEAR ELECTRICITY PRODUCTION IN THE COMBINED REGIONS OF NORTHERN, WESTERN AND SOUTHERN EUROPE
0
100
200
300
400
500
600
700
800
900
Low High Low High Low High2017 2030 2040 2050
TW·h
Low High Low High Low High
Total (TW·h)
Nuclear (TW·h) 523 765 383 752 274 590
% of total 16.1 23.5 11.1 21.8 7.2 15.5
TABLE 15. TOTAL AND NUCLEAR ELECTRICAL PRODUCTION IN THE COMBINED REGIONS OF NORTHERN, WESTERN AND SOUTHERN EUROPEa
Electricity Production 2017
2030 2040 2050
3 032 3 252 3 445 3 809
727
24.0
a The nuclear production data presented in this table and the nuclear electrical generating capacity data presented in Table 14 cannot be used to calculate average annual capacity factors for nuclear plants as Table 14 presents year-end capacity.


Eastern Europe

64
Eastern Europe
Final Energy Consumption in 2017Final energy consumption in the Eastern Europe region in 2017 was based on a diverse mix of fuels: oil (30%), gas (24%), coal (10%), electricity (14%), heat and other sources (19%).
FIGURE 27. FINAL ENERGY CONSUMPTION BY ENERGY SOURCE IN THE EASTERN EUROPE REGION IN 2017
10%
30%
24%
3%
14%
19%
Coal, Lignite and Peat
Oil
Natural Gas
Bioenergy and Waste
Electricity
Heat and Other

65
Eastern Europe
FIGURE 28. ELECTRICITY PRODUCTION BY ENERGY SOURCE IN THE EASTERN EUROPE REGION IN 2017
25%
1%
36%1%
13%
22%
2% 0.4% 0.02%0.01% Coal, Lignite and Peat
Oil
Natural Gas
Bioenergy and Waste
Hydro
Nuclear
Wind
Solar
Geothermal
Other
Electricity Production in 2017Nuclear electricity production is very significant in this region, accounting for 22% of total electricity production in 2017. Nonetheless, fossil fuel based generation accounted for more than 60% of the total electricity production (gas (36%), coal (25%) and oil (1%)). Hydropower accounted for 13%, and renewables and other sources provided about 3% of the total electricity production.
66
Eastern Europe
Energy and Electricity Projections ● The final energy consumption in the Eastern Europe region is expected to increase by 5% in the next 13 years, with an additional 15% increase in the subsequent 20 years to 2050. Throughout the period, the annual growth rate will only be 0.8%.
● Electricity consumption will increase much faster, with a 50% increase between 2017 and 2030, and an additional 33% increase in the subsequent 20 years.
● The share of electricity in final energy consumption will thus increase from 15.6% in 2017 to 17.8% in 2030 and to about 23.6% by the middle of the century.

67
Eastern Europe
FIGURE 29. FINAL CONSUMPTION OF ENERGY AND ELECTRICITYIN THE EASTERN EUROPE REGION
0
5
10
15
20
25
30
35
40
2017 2030 2040 2050
EJ
Electricity Energy
Energy (EJ)
Electricity (EJ)
% of total
TABLE 16. FINAL CONSUMPTION OF ENERGY AND ELECTRICITY IN THE EASTERN EUROPE REGION
Final Consumption 2017
29.7 31.0 33.2 35.7
2030 2040 2050
4.3
15.6
a Final consumption refers to all fuel and energy that is delivered to energy consumers.
6.9
20.7
8.4 5.5
23.617.8
a
68
Eastern Europe
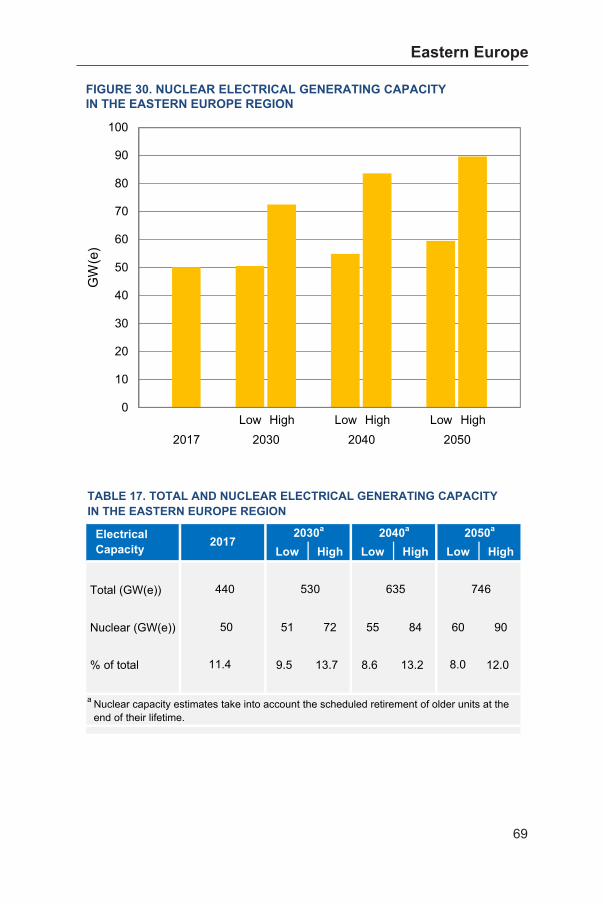
Nuclear Electrical Generating Capacity Projections
● Electrical generating capacity in the Eastern Europe region is projected to increase significantly, by about 20% by 2030 and by an additional 40% in the subsequent 20 years.
● Nuclear electrical generating capacity is also projected to increase significantly in both the low and the high case.
● In the low case, nuclear electrical generating capacity is projected to grow slowly at first, from 50 GW(e) in 2017 to 51 GW(e) in 2030, and then to grow moderately, reaching 60 GW(e) by 2050. However, the share of nuclear capacity in the total electrical generating capacity will remain around 8% throughout the period in this case.
● In the high case, the nuclear electrical generating capacity is projected to increase at a faster rate — from 50 GW(e) in 2017 to 72 GW(e) by 2030 and to 90 GW(e) by 2050. The share of nuclear capacity in the total electrical generating capacity will therefore increase from 11.4% in 2017 to 13.7% in 2030 and fall to 12% in 2050.
69
Eastern Europe
FIGURE 30. NUCLEAR ELECTRICAL GENERATING CAPACITYIN THE EASTERN EUROPE REGION
0
10
20
30
40
50
60
70
80
90
100
Low High Low High Low High2017 2030 2040 2050
GW
(e)
Low High Low High Low High
Total (GW(e))
Nuclear (GW(e)) 51 72 55 84 60 90
% of total 9.5 13.7 8.6 13.2 8.0 12.0
a Nuclear capacity estimates take into account the scheduled retirement of older units at the end of their lifetime.
530 635 746
50
11.4
2050a
TABLE 17. TOTAL AND NUCLEAR ELECTRICAL GENERATING CAPACITYIN THE EASTERN EUROPE REGION
Electrical Capacity
440
20172030a 2040a

70
Eastern Europe
Reactor Retirements and Additions ● The majority of the existing nuclear power reactors in the Eastern Europe region are scheduled to be retired by the middle of the century.
● In the low case, about 17 GW(e) of nuclear electrical generating capacity will be retired by 2030 and another 25 GW(e) of capacity will be retired between 2030 and 2050. The projected additions in this case will compensate for the retirements between 2017 and 2030; thereafter, nuclear capacity will increase, with the addition of about 34 GW(e) of nuclear power capacity by 2050.
● In the high case, nuclear power reactor retirements will be delayed. Only 10 GW(e) of nuclear capacity will be retired by 2030, but about 26 GW(e) will be retired between 2030 and 2050. The additions of nuclear capacity in this case are projected to be 32 GW(e) by 2030 and some 44 GW(e) by 2050.

71
Eastern Europe
LOW CASE
HIGH CASE
2017
Retirements
Additions
2030
Retirements
Additions
2050
GW(e)
0
20
40
60
80
100
120
2017
Retirements
Additions
2030
Retirements
Additions
2050
GW(e)
0
20
40
60
80
100
120
FIGURE 31. NUCLEAR CAPACITY IN THE EASTERN EUROPE REGION: ACTUAL, RETIREMENTS AND ADDITIONS
72
Eastern Europe
Electricity and Nuclear Production Projections
● Total electricity production in the Eastern Europe region is expected to double by the middle of the century, with an annual growth rate of 2.3%.
● Nuclear electricity production is also projected to continue to grow in both the low and the high case, albeit at different rates.
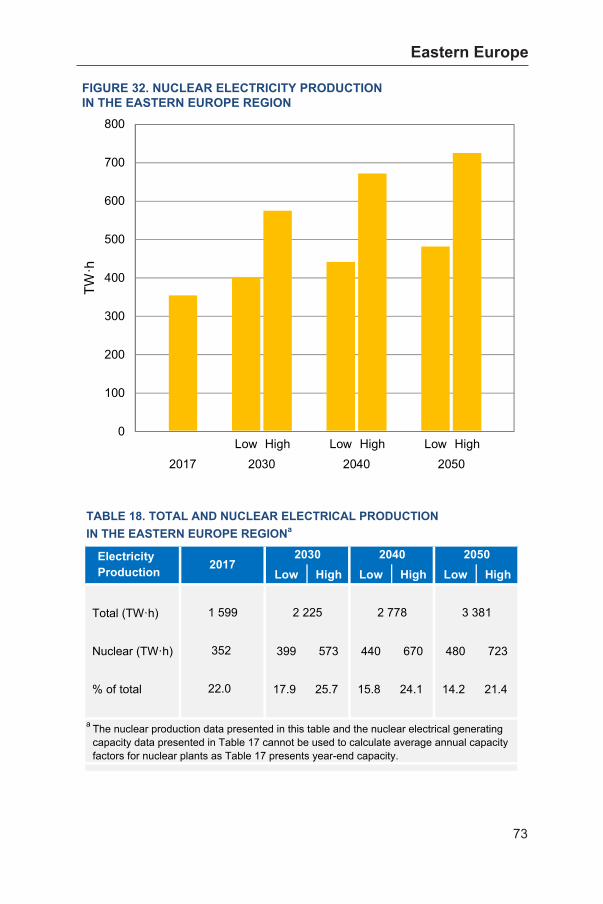
● In the low case, nuclear electricity production is projected to increase moderately from 352 TW∙h in 2017 to 399 TW∙h in 2030 and then at a relatively slower rate, reaching 480 TW∙h in 2050. The share of nuclear electricity in total electricity production will, however, decrease from 22% in 2017 to 17.9% in 2030 and to 14.2% in 2050.
● In the high case, nuclear electricity production is projected to increase much faster, with a 63% increase by 2030 and a further 43% increase between 2030 and 2050. The share of nuclear electricity in total electricity production will increase from 22% in 2017 to 25.7% in 2030, but will decrease to 21.4% in 2050.
73
Eastern Europe
FIGURE 32. NUCLEAR ELECTRICITY PRODUCTION IN THE EASTERN EUROPE REGION
0
100
200
300
400
500
600
700
800
Low High Low High Low High2017 2030 2040 2050
TW·h
Low High Low High Low High
Total (TW·h)
Nuclear (TW·h) 399 573 440 670 480 723
% of total 17.9 25.7 15.8 24.1 14.2 21.4
352
22.0
a The nuclear production data presented in this table and the nuclear electrical generating capacity data presented in Table 17 cannot be used to calculate average annual capacity factors for nuclear plants as Table 17 presents year-end capacity.
TABLE 18. TOTAL AND NUCLEAR ELECTRICAL PRODUCTION IN THE EASTERN EUROPE REGIONa
Electricity Production 2017
2030 2040 2050
1 599 2 225 2 778 3 381


Africa

76
Africa
Final Energy Consumption in 2017Final energy consumption in the Africa region in 2017 was dominated by the use of bioenergy and waste (traditional fuels); electricity accounted for only 10% of the total final energy consumption.
FIGURE 33. FINAL ENERGY CONSUMPTION BY ENERGY SOURCE IN THE AFRICA REGION IN 2017
3%
27%
7%53%
10%
0.03%
Coal, Lignite and Peat
Oil
Natural Gas
Bioenergy and Waste
Electricity
Heat and Other
77
Africa
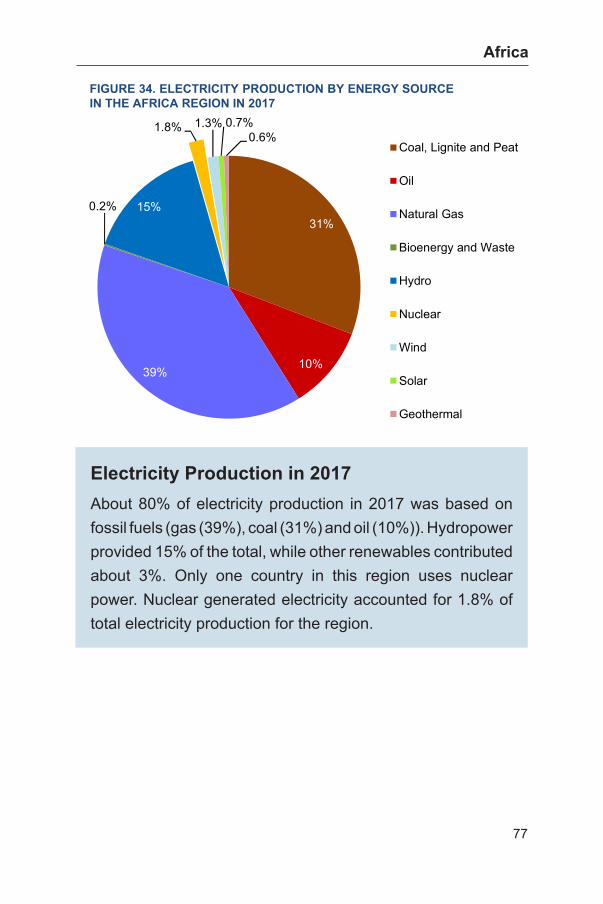
FIGURE 34. ELECTRICITY PRODUCTION BY ENERGY SOURCE IN THE AFRICA REGION IN 2017
31%
10%39%
0.2% 15%
1.8% 1.3% 0.7%0.6%
Coal, Lignite and Peat
Oil
Natural Gas
Bioenergy and Waste
Hydro
Nuclear
Wind
Solar
Geothermal
Electricity Production in 2017About 80% of electricity production in 2017 was based on fossil fuels (gas (39%), coal (31%) and oil (10%)). Hydropower provided 15% of the total, while other renewables contributed about 3%. Only one country in this region uses nuclear power. Nuclear generated electricity accounted for 1.8% of total electricity production for the region.

78
Africa
Energy and Electricity Projections ● Final energy consumption in the Africa region is expected to initially increase by about 2% per year and then to grow by 3% per year.
● Electricity consumption is expected to grow at a faster rate — about 5% per year during the entire period. It is expected to increase from 2 EJ in 2017 to 4 EJ and 11 EJ by 2030 and 2050, respectively.
● The share of electricity in final energy consumption will thus increase from 9.8% in 2017 to 13.1% in 2030 and to 18.5% by the middle of the century.

79
Africa
FIGURE 35. FINAL CONSUMPTION OF ENERGY AND ELECTRICITYIN THE AFRICA REGION
0
10
20
30
40
50
60
70
2017 2030 2040 2050
EJ
Electricity Energy
Energy (EJ)
Electricity (EJ)
% of total 13.1
2.3
9.8
a Final consumption refers to all fuel and energy that is delivered to energy consumers.
6.5
15.8
10.6 4.0
18.5
TABLE 19. FINAL CONSUMPTION OF ENERGY AND ELECTRICITY IN THE AFRICA REGION
Final Consumption 2017
23.6 30.9 40.9 57.3
2030 2040 2050
a

80
Africa
Per Capita Energy and Electricity ● The region’s final energy consumption on a per capita basis is not expected to increase by 2030 owing to continued population growth. However, between 2030 and 2050, there will be a significant increase in per capita energy consumption.
● Electricity consumption on a per capita basis is expected to increase significantly, with a 50% increase in the next 13 years, from 0.6 MW·h per person in 2017 to 0.9 MW·h per person in 2030, and a further 67% increase to reach 1.5 MW·h per person in 2050.

81
Africa
FIGURE 36. PER CAPITA ELECTRICITY PRODUCTION IN THE AFRICA REGION
0.0
0.2
0.4
0.6
0.8
1.0
1.2
1.4
1.6
2017 2030 2040 2050
MW∙h
FIGURE 37. PER CAPITA FINAL ENERGY CONSUMPTION IN THE AFRICA REGION
0
5
10
15
20
25
2017 2030 2040 2050
EJ

82
Africa
Nuclear Electrical Generating Capacity Projections
● Electrical generating capacity in the Africa region is expected to increase substantially, from 202 GW(e) in 2017 to 349 GW(e) by 2030 and to 841 GW(e) by 2050.
● The development of nuclear power is expected to face significant uncertainty.
● In the low case, nuclear electrical generating capacity is projected to increase from present level of 2 GW(e) to 3 GW(e) by 2030 and then to 8 GW(e) by 2050. The share of nuclear electrical generating capacity in the total electrical generating capacity is thus projected to stay at the present level of 0.9% until 2030 and then to increase slightly to 1% by 2050.
● In the high case, nuclear electrical generating capacity is projected to increase to 4 GW(e) by 2030 and then to 13 GW(e) by 2050. The share of nuclear electrical generating capacity in total electrical capacity is expected to reach about 1.6% by 2050.

83
Africa
FIGURE 38. NUCLEAR ELECTRICAL GENERATING CAPACITY IN THE AFRICA REGION
0
2
4
6
8
10
12
14
16
Low High Low High Low High2017 2030 2040 2050
GW
(e)
Low High Low High Low High
Total (GW(e))
Nuclear (GW(e)) 3 4 4 9 8 13
% of total 0.9 1.2 0.8 1.7 1.0 1.6
2050a
TABLE 20. TOTAL AND NUCLEAR ELECTRICAL GENERATING CAPACITY IN THE AFRICA REGION
Electrical Capacity
202
20172030a 2040a
349 556 841
2
0.9
a Nuclear capacity estimates take into account the scheduled retirement of older units at the end of their lifetime.

84
Africa
Electricity and Nuclear Production Projections
● Total electricity production in the Africa region is expected to double by 2030 and then increase further, at an even faster rate, reaching 3699 TW∙h by 2050.
● Nuclear electricity production is projected to follow the nuclear electrical generating capacity trend.
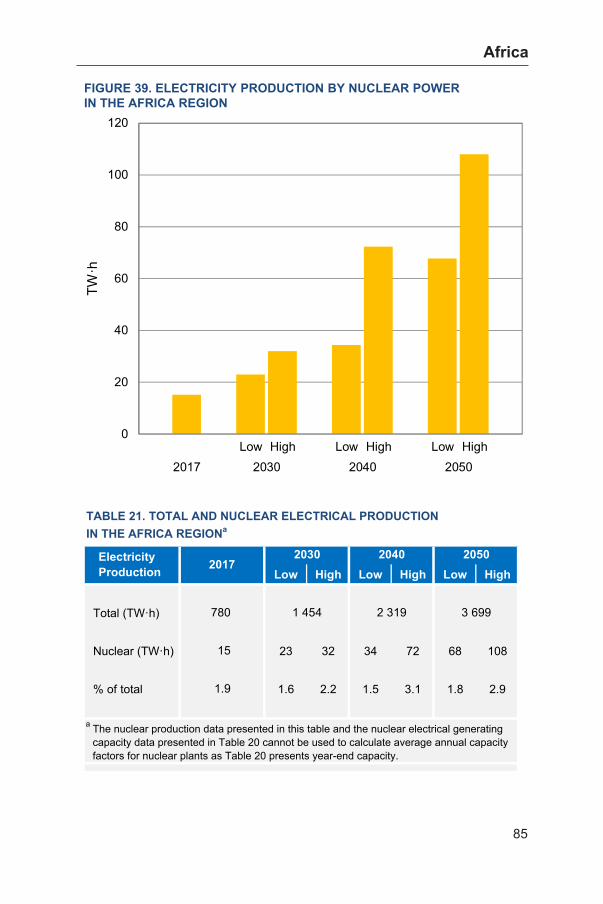
● In the low case, nuclear electricity production is projected to increase to 23 TW∙h by 2030 and then to 68 TW∙h by 2050. The share of nuclear electricity in total electricity production will thus decrease from 1.9% in 2017 to 1.6% in 2030 and then increase to 1.8% in 2050.
● In the high case, nuclear electricity production is projected to first increase by about 50%, growing from 15 TW∙h in 2017 to 32 TW∙h by 2030, and then to increase substantially, reaching 108 TW∙h by 2050. The share of nuclear electricity in total electricity production will increase from 1.9% in 2017 to 2.2% in 2030 and then to 2.9% in 2050.
85
Africa
FIGURE 39. ELECTRICITY PRODUCTION BY NUCLEAR POWER IN THE AFRICA REGION
0
20
40
60
80
100
120
Low High Low High Low High2017 2030 2040 2050
TW·h
Low High Low High Low High
Total (TW·h)
Nuclear (TW·h) 23 32 34 72 68 108
% of total 1.6 2.2 1.5 3.1 1.8 2.9
TABLE 21. TOTAL AND NUCLEAR ELECTRICAL PRODUCTION IN THE AFRICA REGIONa
Electricity Production 2017
2030 2040 2050
780 1 454 2 319 3 699
15
1.9
a The nuclear production data presented in this table and the nuclear electrical generating capacity data presented in Table 20 cannot be used to calculate average annual capacity factors for nuclear plants as Table 20 presents year-end capacity.


Western Asia

88
Western Asia
Final Energy Consumption in 2017More than half the final energy consumed in the Western Asia region in 2017 was in the form of oil and gas. Electricity accounted for 19% of the total energy consumption.
FIGURE 40. FINAL ENERGY CONSUMPTION BY ENERGY SOURCE IN THE WESTERN ASIA REGION IN 2017
4%
50%
25%
1%
19%
1.3%
Coal, Lignite and Peat
Oil
Natural Gas
Bioenergy and Waste
Electricity
Heat and Other

89
Western Asia
FIGURE 41. ELECTRICITY PRODUCTION BY ENERGY SOURCE IN THE WESTERN ASIA REGION IN 2016
10%
20%
61%
0.2%6%
1.5% 0.5% 0.5%0.2% 0.05% Coal, Lignite and Peat
Oil
Natural Gas
Bioenergy and Waste
Hydro
Nuclear
Wind
Solar
Geothermal
Other
Electricity Production in 2017The electricity production mix in the Western Asia region in 2017 was dominated by gas (61%), followed by oil (20%) and coal (10%). Hydropower and other renewables contributed about 8.5%. Nuclear electricity accounted for only 0.2% of total electricity production in the region.

90
Western Asia
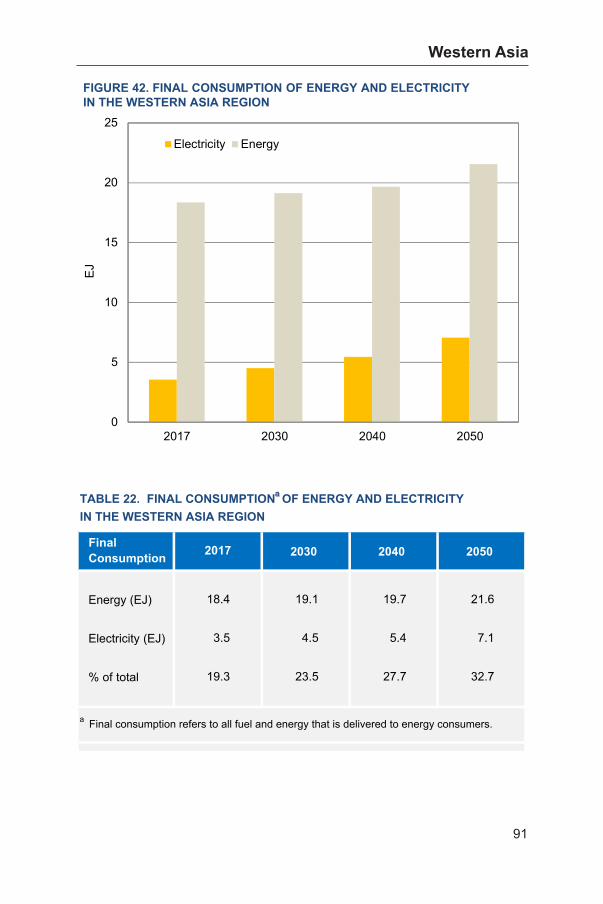
Energy and Electricity Projections ● Final energy consumption in the Western Asia region is expected to stay at around the present level up to 2030 and to increase slightly thereafter.
● Electricity consumption, however, is expected to increase by about 2.5% per year over the entire period — by 2% per year between 2017 to 2030 and by 2.8% per year in the subsequent 20 years.
● Consequently, the share of electricity in final energy consumption will increase from 19.3% in 2017 to 23.5% by 2030 and to 32.7% by the middle of the century.
91
Western Asia
FIGURE 42. FINAL CONSUMPTION OF ENERGY AND ELECTRICITY IN THE WESTERN ASIA REGION
0
5
10
15
20
25
2017 2030 2040 2050
EJ
Electricity Energy
Energy (EJ)
Electricity (EJ)
% of total 23.5
3.5
19.3
a Final consumption refers to all fuel and energy that is delivered to energy consumers.
5.4
27.7
7.1 4.5
32.7
Final Consumption 2017
18.4 19.1 19.7 21.6
2030 2040 2050
aTABLE 22. FINAL CONSUMPTION OF ENERGY AND ELECTRICITY IN THE WESTERN ASIA REGION

92
Western Asia
Nuclear Electrical Generating Capacity Projections
● Electrical generating capacity in the Western Asia region is projected to increase by 27% to reach 409 GW(e) by 2030, from 325 GW(e) in 2017, and then by 40% to reach 574 GW(e) by 2050.
● Although there currently is only one nuclear power reactor operating in this region, more nuclear electrical generating capacity is projected in the coming years.
● In the low case, the nuclear electrical generating capacity is projected to be 8 GW(e) in 2030 and 12 GW(e) by 2050. The share of nuclear electrical generating capacity in the total electrical capacity will thus increase from 0.1% to 1.9% by 2030 and to about 2.1% by 2050.
● In the high case, the nuclear electrical generating capacity is projected to increase to 13 GW(e) in 2030 and to about 26 GW(e) in 2050. The share of nuclear electrical generating capacity in total electricity capacity will reach 3.1% in 2030 and about 4.5% in 2050.

93
Western Asia
FIGURE 43. NUCLEAR ELECTRICAL GENERATING CAPACITYIN THE WESTERN ASIA REGION
0
5
10
15
20
25
30
Low High Low High Low High2017 2030 2040 2050
GW
(e)
Low High Low High Low High
Total (GW(e))
Nuclear (GW(e)) 8 13 10 21 12 26
% of total 1.9 3.1 2.0 4.3 2.1 4.5
2050a
TABLE 23. TOTAL AND NUCLEAR ELECTRICAL GENERATING CAPACITYIN THE WESTERN ASIA REGION
Electrical Capacity
335
20172030a 2040a
409 481 574
0.38
0.1
a Nuclear capacity estimates take into account the scheduled retirement of older units at the end of their lifetime.

94
Western Asia
Electricity and Nuclear Production Projections
● Total electricity production in the Western Asia region is projected to increase from 1163 TW∙h in 2017 to 1479 TW∙h in 2030 — an increase of about 27% — and then to 2281 TW∙h by 2050 — an additional increase of about 69%.
● Although the single nuclear power reactor in the region provided only 2 TW∙h in 2017, nuclear electricity production is expected to increase significantly in both the low and the high case.
● In the low case, nuclear electricity production is projected to increase to 59 TW∙h in 2030 and to 95 TW∙h in 2050. The share of nuclear electricity in total electricity production will thus increase from 0.2% in 2017 to 4% in 2030 and to about 4.2% in 2050.
● In the high case, nuclear electricity production is projected to grow faster, reaching 98 TW∙h by 2030 and 208 TW∙h by 2050. The share of nuclear electricity in total electricity production will thus increase to 6.6% in 2030 and to 9.1% in 2050.

95
Western Asia
FIGURE 44. NUCLEAR ELECTRICITY PRODUCTION IN THE WESTERN ASIA REGION
0
50
100
150
200
250
Low High Low High Low High2017 2030 2040 2050
TW·h
Low High Low High Low High
Total (TW·h)
Nuclear (TW·h) 59 98 77 163 95 208
% of Nuclear 4.0 6.6 4.3 9.2 4.2 9.1
TABLE 24. TOTAL AND NUCLEAR ELECTRICAL PRODUCTION IN THE WESTERN ASIA REGIONa
Electricity Production 2017
2030 2040 2050
1 163 1 479 1 773 2 281
2
0.2
a The nuclear production data presented in this table and the nuclear electrical generating capacity data presented in Table 23 cannot be used to calculate average annual capacity factors for nuclear plants as Table 23 presents year-end capacity.


Southern Asia

98
Southern Asia
Final Energy Consumption in 2017Final energy consumption in the Southern Asia region was dominated by the use of fossil fuels in 2017, but bioenergy and waste (traditional fuels) continued to provide a large proportion, accounting for 27% of the total. The use of electricity is growing but still accounted for only 14% of total consumption.
FIGURE 45. FINAL ENERGY CONSUMPTION BY ENERGY SOURCE IN THE SOUTHERN ASIA REGION IN 2017
14%
29%
16%
27%
14%
0.1%
Coal, Lignite and Peat
Oil
Natural Gas
Bioenergy and Waste
Electricity
Heat and Other

99
Southern Asia
FIGURE 46. ELECTRICITY PRODUCTION BY ENERGY SOURCE IN THE SOUTHERN ASIA REGION IN 2017
56%
6%
20%
1.4% 10%
2.8%
3%
0.9% Coal, Lignite and Peat
Oil
Natural Gas
Bioenergy and Waste
Hydro
Nuclear
Wind
Solar
Electricity Production in 2017About 82% of electricity production in 2017 was fossil fuel based (coal (56%), gas (20%) and oil (6%)). Hydropower accounted for 10%, while nuclear power contributed only 2.8% of the total. Renewables and other sources accounted for about 5% of the total electricity production.
100
Southern Asia
Energy and Electricity Projections ● Final energy consumption in the Southern Asia region is expected to increase at an average annual growth rate of 2.5% — more than doubling between 2017 and 2050. The growth rate is expected to be 3.2% per year until 2030, decreasing to 2% per year thereafter.
● Electricity consumption is expected to grow even faster, doubling in the next 13 years and doubling again between 2030 and 2050.
● The share of electricity in final energy consumption will thus increase from 13.8% in 2017 to 16.6% in 2030 and to 22.8% by the middle of the century.

101
Southern Asia
FIGURE 47. FINAL CONSUMPTION OF ENERGY AND ELECTRICITYIN THE SOUTHERN ASIA REGION
0
20
40
60
80
100
120
2017 2030 2040 2050
EJ
Electricity Energy
Energy (EJ)
Electricity (EJ)
% of total 16.6
5.7
13.8
a Final consumption refers to all fuel and energy that is delivered to energy consumers.
15.7
19.8
21.9 10.7
22.8
TABLE 25. FINAL CONSUMPTION OF ENERGY AND ELECTRICITY IN THE SOUTHERN ASIA REGION
Final Consumption 2017
41.0 64.4 79.3 96.0
2030 2040 2050
a

102
Southern Asia
Nuclear Electrical Generating Capacity Projections
● Electrical generating capacity in the Southern Asia region is projected to reach 973 GW(e) by 2030, from the 2017 level of 495 GW(e), representing a doubling of the capacity in 13 years. This trend will continue in the subsequent 20 years, resulting in an 85.6% increase in total electrical generating capacity.
● Nuclear electrical generating capacity is also projected to increase considerably in both the low and the high case.
● In the low case, nuclear electrical generating capacity is projected to increase from the 2017 level of 8.5 GW(e) to 22 GW(e) by 2030 and to 50 GW(e) by 2050. The share of nuclear electrical generating capacity in total electricity capacity is thus projected to increase from 1.7% in 2017 to 2.3% by 2030 and 2.8% by 2050.
● In the high case, nuclear electrical generating capacity is projected to increase substantially, from 8.5 GW(e) in 2017 to 34 GW(e) by 2030 and 98 GW(e) by 2050. The share of nuclear in total electrical generating capacity will thus increase from 1.7% in 2017 to 3.5% by 2030 and to 5.4% by 2050.

103
Southern Asia
FIGURE 48. NUCLEAR ELECTRICAL GENERATING CAPACITYIN THE SOUTHERN ASIA REGION
0
20
40
60
80
100
120
Low High Low High Low High2017 2030 2040 2050
GW
(e)
Low High Low High Low High
Total (GW(e))
Nuclear (GW(e)) 22 34 31 60 50 98
% of total 2.3 3.5 2.4 4.5 2.8 5.4
2050a
TABLE 26. TOTAL AND NUCLEAR ELECTRICAL GENERATING CAPACITYIN THE SOUTHERN ASIA REGION
Electrical Capacity
495
20172030a 2040a
973 1 330 1 806
8.5
1.7
a Nuclear capacity estimates take into account the scheduled retirement of older units at the end of their lifetime.

104
Southern Asia
Reactor Retirements and Additions ● The existing nuclear power reactors in the Southern Asia region are relatively young, and the majority are expected to remain in operation until the middle of the century.
● In the low case, only 1 GW(e) of nuclear electrical generating capacity will be retired by 2030 and an additional 2 GW(e) of capacity will be retired between 2030 and 2050. The projected additions of nuclear capacity in this case are 15 GW(e) by 2030 and some 30 GW(e) by 2050.
● In the high case, the nuclear capacity retired will be even smaller — only 2 GW(e) over the entire period. The projected additions of nuclear electrical generating capacity in this case are very substantial — about 26 GW(e) added by 2030 and some 65 GW(e) added by 2050.

105
Southern Asia
LOW CASE
HIGH CASE
2017
Retirements
Additions
2030
Retirements
Additions
2050
GW(e)
0
20
40
60
80
100
120
2017
Retirements
Additions
2030
Retirements
Additions
2050
GW(e)
0
20
40
60
80
100
120
FIGURE 49. NUCLEAR CAPACITY IN THE SOUTHERN ASIA REGION: ACTUAL, RETIREMENTS AND ADDITIONS

106
Southern Asia
Electricity and Nuclear Production Projections
● The total electricity production in the Southern Asia region is expected to double in the next 13 years, and then to double again in the subsequent 20 years to 2050.
● The nuclear generated electricity is projected to show even higher growth.
● In the low case, nuclear electricity production is projected to increase 3.5-fold in the next 13 years, with a further 2.5-fold increase over the subsequent 20 years. The share of nuclear electricity in the total will thus increase from 2.5% in 2017 to 4.4% in 2030 and to 5% in 2050.
● In the high case, much greater increases in nuclear electricity production are projected: an almost sixfold increase in the next 13 years and another almost threefold increase in the subsequent 20 years. The share of nuclear electricity in total electricity production will increase from 2.5% in 2017 to 6.9% in 2030 and to 9.8% in 2050.

107
Southern Asia
FIGURE 50. NUCLEAR ELECTRICITY PRODUCTIONIN THE SOUTHERN ASIA REGION
0
100
200
300
400
500
600
700
800
900
Low High Low High Low High2017 2030 2040 2050
TW·h
Low High Low High Low High
Total (TW·h)
Nuclear (TW·h) 173 272 252 482 404 786
% of total 4.4 6.9 4.4 8.4 5.0 9.8
TABLE 27. TOTAL AND NUCLEAR ELECTRICAL PRODUCTION IN THE SOUTHERN ASIA REGIONa
Electricity Production 2017
2030 2040 2050
1 953 3 921 5 754 8 044
49
2.5
a The nuclear production data presented in this table and the nuclear electrical generating capacity data presented in Table 26 cannot be used to calculate average annual capacity factors for nuclear plants as Table 26 presents year-end capacity.


Central and Eastern Asia

110
Central and Eastern Asia
Final Energy Consumption in 2017Fossil fuels accounted for about two thirds of the final energy consumption in the combined regions of Central and Eastern Asia in 2017. Electricity supplied 22% of the total final energy used.
FIGURE 51. FINAL ENERGY CONSUMPTION BY ENERGY SOURCE IN THE COMBINED REGIONS OF CENTRAL AND EASTERN ASIA IN 2017
31%
30%
8%
4%
22%
5% Coal, Lignite and Peat
Oil
Natural Gas
Bioenergy and Waste
Electricity
Heat and Other

111
Central and Eastern Asia
FIGURE 52. ELECTRICITY PRODUCTION BY ENERGY SOURCE IN THE COMBINED REGIONS OF CENTRAL AND EASTERN ASIA IN 2017
60%
1%
11%1%
16%
5% 4%
2%0.03%
0.02% Coal, Lignite and Peat
Oil
Natural Gas
Bioenergy and Waste
Hydro
Nuclear
Wind
Solar
Geothermal
Other
Electricity Production in 2017The electricity production mix in 2017 was highly dominated by coal, which accounted for as much as 60% of the total production, followed by hydropower (16%) and gas (11%). Nuclear power contributed about 5%, while renewable sources accounted for about 7% of total electricity production.

112
Central and Eastern Asia
Energy and Electricity Projections ● Final energy consumption in the combined regions of Central and Eastern Asia is expected to increase significantly (21%) between 2017 and 2030, and to flatten out thereafter, increasing only 3.5% from 2030 to 2050.
● Electricity consumption will increase much faster, with a 45% increase from 2017 to 2030. This trend will continue thereafter, with an additional increase of 36% in the subsequent 20 years until 2050. Altogether, there will be almost doubling of electricity use between 2017 and 2050.
● The share of electricity in final energy consumption will thus increase from 22.6% in 2017 to 27.2% in 2030 and to 35.7% in 2050.
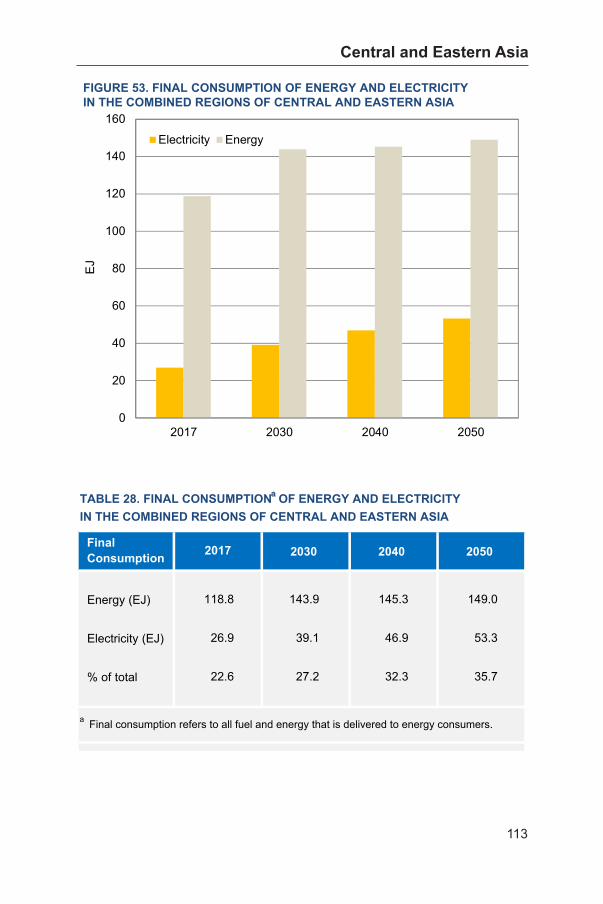
113
Central and Eastern Asia
FIGURE 53. FINAL CONSUMPTION OF ENERGY AND ELECTRICITYIN THE COMBINED REGIONS OF CENTRAL AND EASTERN ASIA
0
20
40
60
80
100
120
140
160
2017 2030 2040 2050
EJ
Electricity Energy
Energy (EJ)
Electricity (EJ)
% of total 27.2
26.9
22.6
a Final consumption refers to all fuel and energy that is delivered to energy consumers.
46.9
32.3
53.3 39.1
35.7
TABLE 28. FINAL CONSUMPTION OF ENERGY AND ELECTRICITY IN THE COMBINED REGIONS OF CENTRAL AND EASTERN ASIA
Final Consumption 2017
118.8 143.9 145.3 149.0
2030 2040 2050
a

114
Central and Eastern Asia
Nuclear Electrical Generating Capacity Projections
● The combined regions of Central and Eastern Asia are expected to continue to grow at a fast pace. Electrical generating capacity is projected to increase by 64% in the next 13 years to reach 3903 GW(e) by 2030 and 4609 GW(e) by 2050.
● Nuclear electrical generating capacity is also projected to increase significantly in both the low and the high case.
● Even in the low case, nuclear electrical generating capacity is projected to increase from the 2017 level of 102 GW(e) to 116 GW(e) by 2030 and 145 GW(e) by 2050. However, since the growth of nuclear electrical generating capacity is projected to be slower than that of total electrical capacity, the share of nuclear electrical generating capacity is projected to decrease from 4.3% in 2017 to 3% by 2030 and 3.1% by 2050.
● In the high case, nuclear electrical generating capacity is projected to increase much faster, doubling in the next 13 years and increasing by a further 80% by 2050. The share of nuclear electrical generating capacity in total electrical generating capacity will thus increase from 4.3% in 2017 to 4.4% in 2030 and to 6.7% in 2050.

115
Central and Eastern Asia
FIGURE 54. NUCLEAR ELECTRICAL GENERATING CAPACITYIN THE COMBINED REGIONS OF CENTRAL AND EASTERN ASIA
0
50
100
150
200
250
300
350
Low High Low High Low High2017 2030 2040 2050
GW
(e)
Low High Low High Low High
Total (GW(e))
Nuclear (GW(e)) 116 173 131 258 145 310
% of total 3.0 4.4 2.9 5.8 3.1 6.7
2050a
TABLE 29. TOTAL AND NUCLEAR ELECTRICAL GENERATING CAPACITYIN THE COMBINED REGIONS OF CENTRAL AND EASTERN ASIA
Electrical Capacity
2 383
20172030a 2040a
3 903 4 487 4 609
102
4.3
a Nuclear capacity estimates take into account the scheduled retirement of older units at the end of their lifetime.

116
Central and Eastern Asia
Reactor Retirements and Additions ● Most of the existing nuclear power reactors in the combined regions of Central and Eastern Asia are relatively new, and only a few are scheduled to be retired by 2030.
● In the low case, several of the nuclear power reactors in this region currently out of operation in the aftermath of the Fukushima Daiichi accident will not be put back into operation. Consequently, some 32 GW(e) of nuclear power capacity will be retired by 2030 and an additional 28 GW(e) will be retired by 2050. The projected additions of nuclear capacity in this case are 46 GW(e) by 2030 and an additional 57 GW(e) by 2050.
● In the high case, it is assumed that most of the units taken out of operation after the Fukushima Daiichi accident will resume operation. As such, only 10 GW(e) of nuclear capacity will be retired by 2030; thereafter, some 27 GW(e) of capacity will be retired by 2050. Construction of new capacity in this case is projected to be extensive: about 81 GW(e) in the next 17 years and some 163 GW(e) between 2030 and 2050.

117
Central and Eastern Asia
LOW CASE
HIGH CASE
2017
Retirements
Additions
2030
Retirements
Additions
2050
GW(e)
0
50
100
150
200
250
300
350
2017
Retirements
Additions
2030
Retirements
Additions
2050
GW(e)
0
50
100
150
200
250
300
350
FIGURE 55. NUCLEAR CAPACITY IN THE COMBINED REGIONS OF CENTRAL AND EASTERN ASIA: ACTUAL, RETIREMENTS AND ADDITIONS

118
Central and Eastern Asia
Electricity and Nuclear Production Projections
● To meet the fast growing demand for electricity in the combined regions of Central and Eastern Asia, electricity production will increase by 57% by 2030, with a further increase of 80% by 2050.
● The contribution of nuclear power is projected to undergo significant changes in both the low and the high case.
● In the low case, nuclear electricity production is projected to increase significantly — from 425 TW∙h in 2017 to 871 TW∙h by 2030 and to 1170 TW∙h by 2050. The share of nuclear electricity in the total will thus increase from 5.2% in 2017 to 6.8% in 2030 and stay nearly constant until 2050.
● In the high case, there will be about a threefold increase in nuclear electricity production in the next 13 years — from 425 TW∙h in 2017 to 1300 TW∙h by 2030 — with a further 90% increase, to 2496 TW∙h, by 2050. The share of nuclear electricity in total electricity will thus increase from 5.2% in 2017 to 10.1% in 2030 and to 14.4% in 2050.

119
Central and Eastern Asia
FIGURE 56. NUCLEAR ELECTRICITY PRODUCTIONIN THE COMBINED REGIONS OF CENTRAL AND EASTERN ASIA
0
500
1 000
1 500
2 000
2 500
3 000
Low High Low High Low High2017 2030 2040 2050
TW·h
Low High Low High Low High
Total (TW·h)
Nuclear (TW·h) 871 1 300 1 023 2 030 1 170 2 496
% of total 6.8 10.1 6.6 13.2 6.8 14.4
TABLE 30. TOTAL AND NUCLEAR ELECTRICAL PRODUCTION IN THE COMBINED REGIONS OF CENTRAL AND EASTERN ASIAa
Electricity Production 2017
2030 2040 2050
8 217 12 861 15 418 17 281
425
5.2
a The nuclear production data presented in this table and the nuclear electrical generating capacity data presented in Table 29 cannot be used to calculate average annual capacity factors for nuclear plants as Table 29 presents year-end capacity.


South-eastern Asia

122
South-eastern Asia
Final Energy Consumption in 2017Final energy consumption in the South-eastern Asia region was dominated by the use of fossil fuels (oil (44%), gas (8%) and coal (8%)). Electricity use in 2017 was about one sixth of the total energy consumption.
FIGURE 57. FINAL ENERGY CONSUMPTION BY ENERGY SOURCE IN THE SOUTH-EASTERN ASIA REGION IN 2017
8%
44%
8%
24%
16% Coal, Lignite and Peat
Oil
Natural Gas
Bioenergy and Waste
Electricity

123
South-eastern Asia
FIGURE 58. ELECTRICITY PRODUCTION BY ENERGY SOURCE IN THE SOUTH-EASTERN ASIA REGION IN 2017
40%
3%
39%
1.5%14%
0.2%0.8%
2.3%Coal, Lignite and Peat
Oil
Natural Gas
Bioenergy and Waste
Hydro
Wind
Solar
Geothermal
Electricity Production in 2017Coal was the primary source of electricity production in 2017, followed by gas. Hydropower, renewables and other sources accounted for about one fifth of the total electricity production. At present, nuclear power is not used in this region.

124
South-eastern Asia
Energy and Electricity Projections ● Final energy consumption in the South-eastern Asia region is expected to continue to increase at a relatively rapid rate up to 2030, with about a 50% increase between 2017 and 2030. In the subsequent 20 years, the growth is expected to slow to about 1% per year.
● Electricity consumption is expected to increase at an even faster rate: 3.7% per year from 2017 to 2030 and about 3% per year in the subsequent 20 years to 2050.
● The share of electricity in final energy consumption will thus increase from 16.5% in 2017 to 17.8% in 2030 and to 25.6% by the middle of the century.
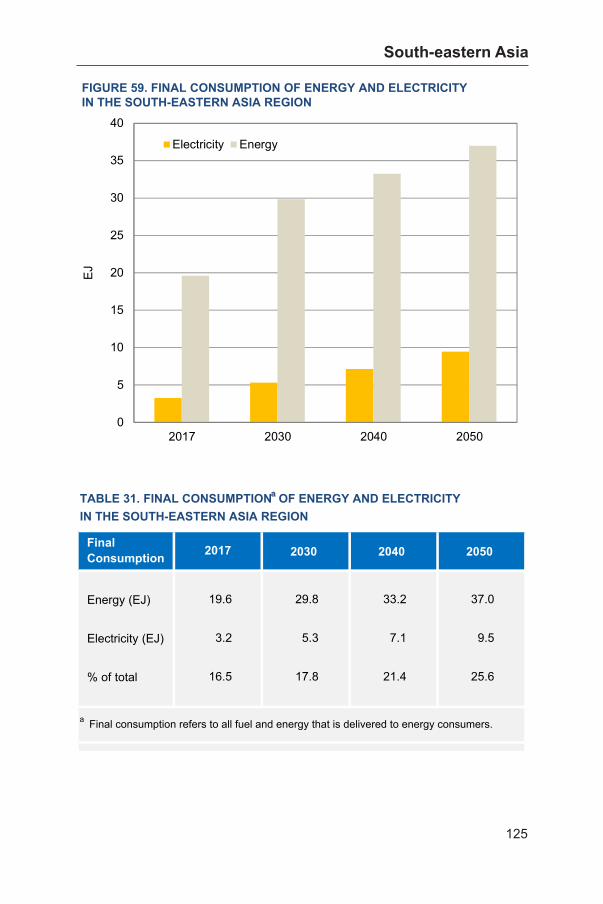
125
South-eastern Asia
FIGURE 59. FINAL CONSUMPTION OF ENERGY AND ELECTRICITY IN THE SOUTH-EASTERN ASIA REGION
0
5
10
15
20
25
30
35
40
2017 2030 2040 2050
EJ
Electricity Energy
Energy (EJ)
Electricity (EJ)
% of total 17.8
3.2
16.5
a Final consumption refers to all fuel and energy that is delivered to energy consumers.
7.1
21.4
9.5 5.3
25.6
TABLE 31. FINAL CONSUMPTION OF ENERGY AND ELECTRICITYIN THE SOUTH-EASTERN ASIA REGION
Final Consumption 2017
19.6 29.8 33.2 37.0
2030 2040 2050
a

126
South-eastern Asia
Nuclear Electrical Generating Capacity Projections
● Electrical generating capacity in the South-eastern Asia region is projected to increase by 72% to reach 421 GW(e) by 2030 and then to increase by 68% to 709 GW(e) by 2050.
● The nuclear electrical generating capacity in this region is not projected to make a significant contribution: no nuclear reactor is projected to be operational up to 2030 and only 3 GW(e) of nuclear electrical generating capacity is projected by 2050 in the low case.
● Even in the high case, no nuclear power plant is projected to be on-line by 2030. However, some 9 GW(e) of nuclear power capacity is projected to be operational by 2050.
● Correspondingly, nuclear electricity will appear in the electricity production mix of this region only after 2030. In the low case, its contribution to total electricity production is projected to be only 0.8% in 2050, while in the high case it is projected to be 2.5% of the total electricity production in 2050.

127
South-eastern Asia
Low High Low High Low High
Total (GW(e))
Nuclear (GW(e)) 0 0 1 4 3 9
% of total 0 0 0.2 0.7 0.4 1.3
2050a
TABLE 32. TOTAL AND NUCLEAR ELECTRICAL GENERATING CAPACITY IN THE SOUTH-EASTERN ASIA REGION
Electrical Capacity
245
20172030a 2040a
421 556 709
0
0
a Nuclear capacity estimates take into account the scheduled retirement of older units at the end of their lifetime.
Low High Low High Low High
Total (TW·h)
Nuclear (TW·h) 0 0 8 31 24 73
% of total 0 0 0.4 1.4 0.8 2.5
TABLE 33. TOTAL AND NUCLEAR ELECTRICAL PRODUCTION IN THE SOUTH-EASTERN ASIA REGIONa
Electricity Production 2017
2030 2040 2050
904 1 642 2 210 2 928
0
0
a The nuclear production data presented in this table and the nuclear electrical generatingcapacity data presented in Table 32 cannot be used to calculate average annual capacityfactors for nuclear plants as Table 32 presents year-end capacity.


Oceania

130
Oceania
Final Energy Consumption in 2017Final energy consumption in the Oceania region was dominated by oil in 2017. Electricity contributed 21% to total consumption, followed by gas at 17%.
FIGURE 60. FINAL ENERGY CONSUMPTION BY ENERGY SOURCE IN THE OCEANIA REGION IN 2017
4%
51%
17%
7%
21%
0.5%
Coal, Lignite and Peat
Oil
Natural Gas
Bioenergy and Waste
Electricity
Heat and Other
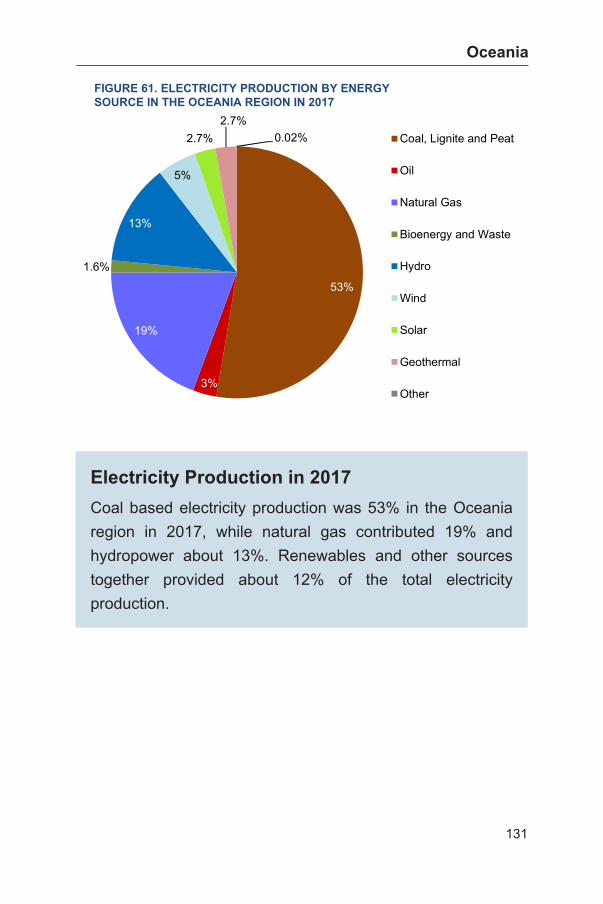
131
Oceania
FIGURE 61. ELECTRICITY PRODUCTION BY ENERGY SOURCE IN THE OCEANIA REGION IN 2017
53%
3%
19%
1.6%
13%
5%
2.7%2.7%
0.02% Coal, Lignite and Peat
Oil
Natural Gas
Bioenergy and Waste
Hydro
Wind
Solar
Geothermal
Other
Electricity Production in 2017Coal based electricity production was 53% in the Oceania region in 2017, while natural gas contributed 19% and hydropower about 13%. Renewables and other sources together provided about 12% of the total electricity production.

132
Oceania
Energy and Electricity Projections ● Final energy consumption in the Oceania region is expected to increase at about 1% per year to 2050 — an increase of about 11% by 2030 and another 12% by 2050.
● Electricity consumption will grow faster, at an average annual rate of about 1.5%.
● The share of electricity in final energy consumption will thus increase from 21.2% in 2017 to 28% by the middle of the century.

133
Oceania
FIGURE 62. FINAL CONSUMPTION OF ENERGY AND ELECTRICITYIN THE OCEANIA REGION
0
1
2
3
4
5
6
2017 2030 2040 2050
EJ
Electricity Energy
Energy (EJ)
Electricity (EJ)
% of total 21.8
0.9
21.2
a Final consumption refers to all fuel and energy that is delivered to energy consumers.
1.3
24.6
1.51.1
28.0
TABLE 34. FINAL CONSUMPTION OF ENERGY AND ELECTRICITYIN THE OCEANIA REGION
Final Consumption 2017
4.4 4.9 5.2 5.4
2030 2040 2050
a

134
Oceania
Nuclear Electrical Generating Capacity Projections
● Electrical generating capacity in the Oceania region is projected to increase at a higher rate than electricity consumption. A 40% increase in electrical generating capacity is expected, reaching 111 GW(e) by 2030, followed by another increase of 48% over the next 20 years, reaching 164 GW(e) by 2050.
● Total electricity production is expected to reach an annual growth rate of about 1.5%.
● Nuclear power is not projected to be introduced into the electricity generation mix of this region in the low case.
● In the high case, nuclear power is projected to become part of the electricity production system by the middle of the century, reaching 2 GW(e) of capacity in 2050, providing some 3% of total electricity production in the region.

135
Oceania
Low High Low High Low High
Total (GW(e))
Nuclear (GW(e)) 0 0 0 0 0 2
% of total 0 0 0 0 0 1.2
2050a
TABLE 35. TOTAL AND NUCLEAR ELECTRICAL GENERATING CAPACITYIN THE OCEANIA REGION
Electrical Capacity
79
20172030a 2040a
111 136 164
0
0
a Nuclear capacity estimates take into account the scheduled retirement of older units at the end of their lifetime.
Low High Low High Low High
Total (TW·h)
Nuclear (TW·h) 0 0 0 0 0 16
% of total 0 0 0 0 0 3.3
TABLE 36. TOTAL AND NUCLEAR ELECTRICAL PRODUCTION IN THE OCEANIA REGIONa
Electricity Production 2017
2030 2040 2050
289 350 421 493
0
0
a The nuclear production data presented in this table and the nuclear electrical generatingcapacity data presented in Table 35 cannot be used to calculate average annual capacityfactors for nuclear plants as Table 35 presents year-end capacity.


Regional Population Data


139
Regional Population Data
Nor
ther
n Am
eric
a 3
63 4
330.
531.19
Latin
Am
eric
a an
d th
e C
arib
bean
648
784
0.58
1.21
Nor
ther
n, W
este
rn a
nd
Sout
hern
Eur
ope
447
455
0.05
1.02
East
ern
Euro
pe 292
252
– 0.
450.
86
Afric
a1
247
2 47
82.
101.99
Wes
tern
Asi
a 266
395
1.21
1.49
Sout
hern
Asi
a1
870
2 42
40.79
1.30
Sout
h-ea
ster
n As
ia 6
48 7
920.
611.
22
Oce
ania
40
57
1.02
1.43
Wor
ld T
otal
7 515
9 72
50.
781.29
Reg
ion
2017
(Mill
ion In
habi
tant
s)20
50(M
illio
n In
habi
tant
s)
TAB
LE 37.
PO
PULA
TIO
N G
RO
WTH
BY
REG
ION
Gro
wth
Rat
e (%
/a)
2017–2
050
Rat
io (
2050:2
017)
Cen
tral a
nd E
aste
rn A
sia
1 694
1 65
5–
0.07
0.98

INTERNATIONAL ATOMIC ENERGY AGENCYVIENNA
ISBN 978-92-0-104918-6ISSN 1011-2642 @
18-0
3841
RE
FER
EN
CE
DATA
SE
RIE
S N
o. 12018 E
dition
Energy, Electricity and Nuclear Power Estimates for the Period up to 2050
REFERENCE DATA SERIES No. 12018 Edition
148 pages, 7.73mm on 80gsm ppaper
18-03841 RDS 1-38 Cover 16x24 PRESS.indd 1 2018-08-31 14:24:09