ensemble alpha - nomura · 1 . ensemble alpha • even though mutual funds have done poorly, the...
TRANSCRIPT
Connecting Markets East & West
Equity Research
See Appendix A-1 for analyst certification, important disclosures, and the status of non-U.S. analysts. May 2015
Ensemble Alpha
Joseph Mezrich– NSI +212 667 9316 [email protected]

1
Ensemble Alpha
• Even though mutual funds have done poorly,
the stock picks across funds managers have done well
• The ensemble of manager stock picks have alpha,
the funds do not

2
The Most Overweight and Underweight Stocks in Russell 1000 at the End of 2014
Note: Shows the 10 stocks with highest and lowest active weight in the Russell 1000 universe as of December 2014. Active weight is calculated as fund weight minus benchmark weight, where the fund is based on aggregated fund holding in large-cap funds using Lipper’s fund classification and the benchmark is based on the asset-weighted benchmarks for each fund. Source: CRSP, Russell, S&P, Compustat, IDC, Nomura research
10 highest active weight stocks
Rank Ticker NameHolding Value
(million $)
Aggregated NAV for funds holding the stock (million $)
Total number of funds holding
the stock
Fund Weight ( Wp )
Benchmark Weight ( Wb )
Active Weight ( Wp - Wb )
1 GOOG GOOGLE INC 54,903 1,727,538 1,657 2.655% 1.812% 0.842%2 GILD GILEAD SCIENCES INC 31,867 1,408,984 1,377 1.541% 0.845% 0.696%3 AMZN AMAZON.COM INC 27,180 1,288,586 984 1.314% 0.736% 0.578%4 BIIB BIOGEN IDEC INC 19,060 1,218,303 1,089 0.922% 0.472% 0.449%5 UNH UNITEDHEALTH GROUP INC 14,839 1,360,370 1,031 0.718% 0.393% 0.325%6 WFC WELLS FARGO & CO 28,347 1,378,316 1,310 1.371% 1.091% 0.280%7 PCLN PRICELINE GROUP INC/THE 12,932 1,013,133 973 0.625% 0.347% 0.278%8 V VISA INC-CLASS A SHARES 21,588 1,301,684 1,247 1.044% 0.768% 0.276%9 CMCSA COMCAST CORP-CLASS A 22,380 1,479,957 1,395 1.082% 0.810% 0.272%
10 COF CAPITAL ONE FINANCIAL CORP 9,255 830,493 716 0.448% 0.186% 0.261%10 lowest active weight stocks
Rank Ticker NameHolding Value
(million $)
Aggregated NAV for funds holding the stock (million $)
Total number of funds holding
the stock
Fund Weight ( Wp )
Benchmark Weight ( Wb )
Active Weight ( Wp - Wb )
1 AAPL APPLE INC 54,853 1,615,697 1,854 2.652% 3.875% -1.222%2 XOM EXXON MOBIL CORP 12,484 787,037 995 0.604% 1.579% -0.975%3 IBM INTL BUSINESS MACHINES CORP 5,578 594,260 669 0.270% 0.905% -0.635%4 WMT WAL-MART STORES INC 7,445 643,848 616 0.360% 0.839% -0.479%5 KO COCA-COLA CO/THE 11,485 1,014,372 621 0.555% 1.017% -0.462%6 T AT&T INC 6,653 648,784 597 0.322% 0.698% -0.376%7 MCD MCDONALD'S CORP 3,830 544,822 587 0.185% 0.541% -0.356%8 VZ VERIZON COMMUNICATIONS INC 16,416 973,498 1,155 0.794% 1.139% -0.345%9 MMM 3M CO 6,503 648,570 569 0.314% 0.626% -0.311%
10 PG PROCTER & GAMBLE CO/THE 14,598 1,130,359 965 0.706% 1.012% -0.306%
3
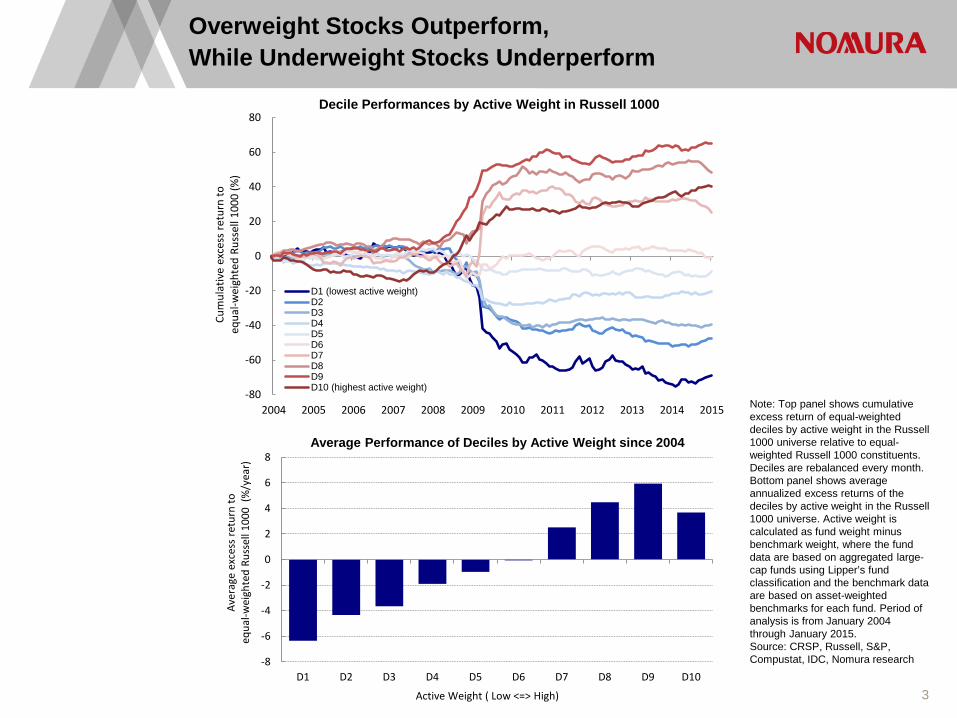
Overweight Stocks Outperform, While Underweight Stocks Underperform
Note: Top panel shows cumulative excess return of equal-weighted deciles by active weight in the Russell 1000 universe relative to equal-weighted Russell 1000 constituents. Deciles are rebalanced every month. Bottom panel shows average annualized excess returns of the deciles by active weight in the Russell 1000 universe. Active weight is calculated as fund weight minus benchmark weight, where the fund data are based on aggregated large-cap funds using Lipper’s fund classification and the benchmark data are based on asset-weighted benchmarks for each fund. Period of analysis is from January 2004 through January 2015. Source: CRSP, Russell, S&P, Compustat, IDC, Nomura research
-80
-60
-40
-20
0
20
40
60
80
2004 2005 2006 2007 2008 2009 2010 2011 2012 2013 2014 2015
Cum
ulat
ive
exce
ss re
turn
to
equa
l-wei
ghte
d Ru
ssel
l 100
0 (%
)
Decile Performances by Active Weight in Russell 1000
D1 (lowest active weight)D2D3D4D5D6D7D8D9D10 (highest active weight)
-8
-6
-4
-2
0
2
4
6
8
D1 D2 D3 D4 D5 D6 D7 D8 D9 D10
Aver
age
exce
ss re
turn
to
equa
l-wei
ghte
d Ru
ssel
l 100
0 (%
/yea
r)
Active Weight ( Low <=> High)
Average Performance of Deciles by Active Weight since 2004

4
Performance of Long-Short Portfolios by Active Weight
Note: Shows cumulative spread return between equal-weighted top and bottom deciles by active weight in the Russell 1000 universe. Active weight is calculated as fund weight minus benchmark weight, where the fund is based on aggregated large-cap funds based on Lipper’s fund classification and the benchmark is based on asset-weighted benchmarks for each fund. Period of analysis ranges from January 2004 through January 2015. Source: CRSP, Russell, S&P, Compustat, IDC, Nomura research
-40
-20
0
20
40
60
80
100
120
2004 2005 2006 2007 2008 2009 2010 2011 2012 2013 2014 2015
Cum
ulat
ive
deci
le sp
read
retu
rn (%
)
Decile Spread Performances by Active Weight in Russell 1000
5
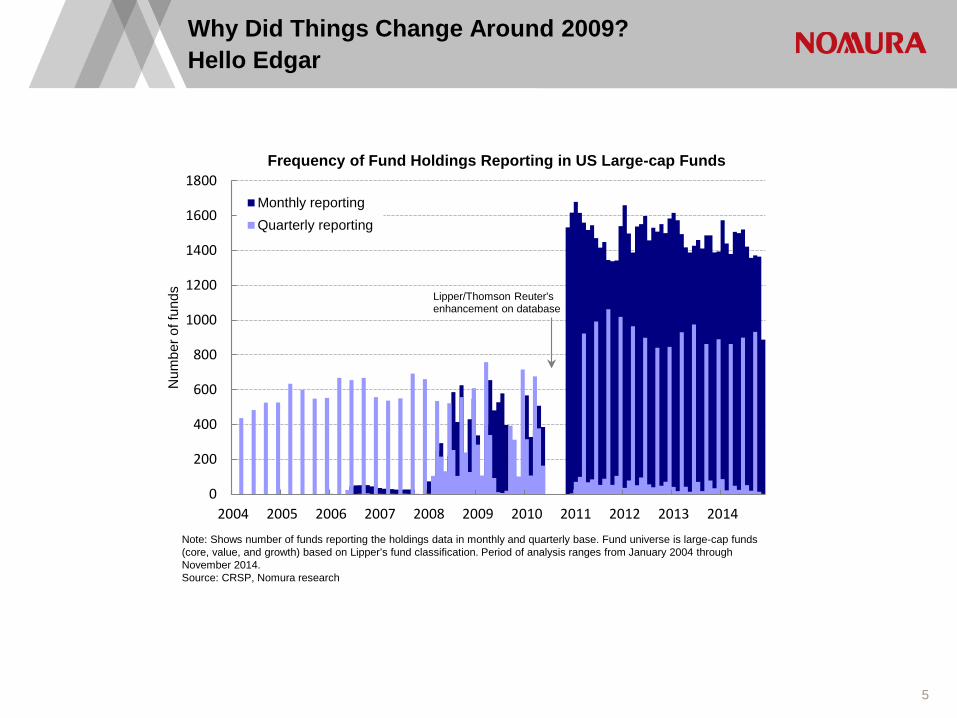
Why Did Things Change Around 2009? Hello Edgar
Note: Shows number of funds reporting the holdings data in monthly and quarterly base. Fund universe is large-cap funds (core, value, and growth) based on Lipper’s fund classification. Period of analysis ranges from January 2004 through November 2014. Source: CRSP, Nomura research
0
200
400
600
800
1000
1200
1400
1600
1800
2004 2005 2006 2007 2008 2009 2010 2011 2012 2013 2014
Num
ber o
f fun
dsFrequency of Fund Holdings Reporting in US Large-cap Funds
Monthly reportingQuarterly reporting
Lipper/Thomson Reuter'senhancement on database
6
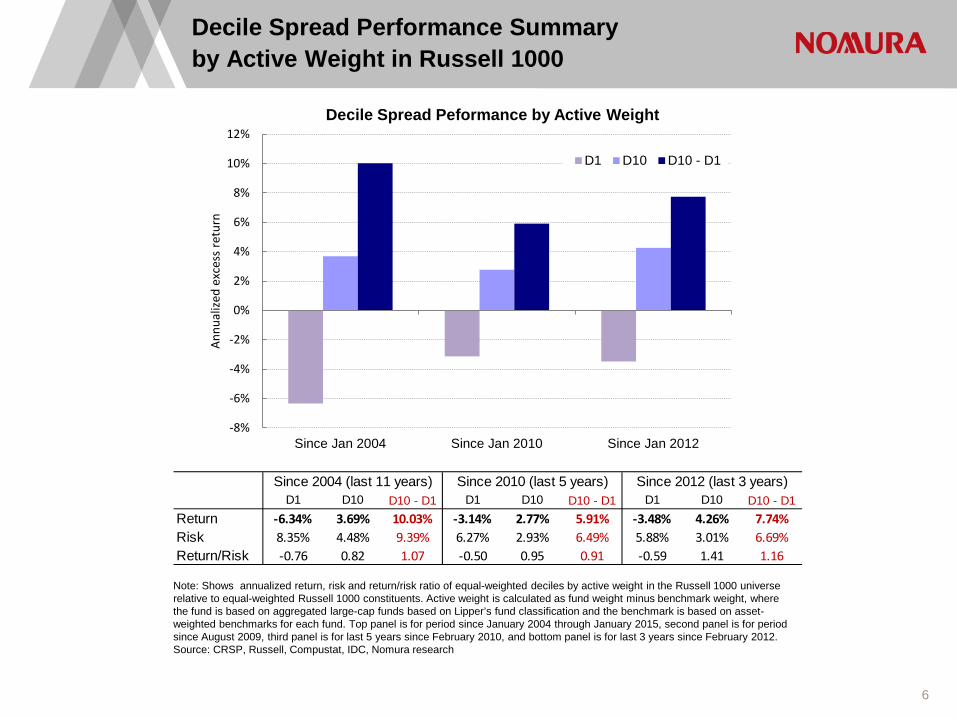
Decile Spread Performance Summary by Active Weight in Russell 1000
Note: Shows annualized return, risk and return/risk ratio of equal-weighted deciles by active weight in the Russell 1000 universe relative to equal-weighted Russell 1000 constituents. Active weight is calculated as fund weight minus benchmark weight, where the fund is based on aggregated large-cap funds based on Lipper’s fund classification and the benchmark is based on asset-weighted benchmarks for each fund. Top panel is for period since January 2004 through January 2015, second panel is for period since August 2009, third panel is for last 5 years since February 2010, and bottom panel is for last 3 years since February 2012. Source: CRSP, Russell, Compustat, IDC, Nomura research
-8%
-6%
-4%
-2%
0%
2%
4%
6%
8%
10%
12%
Since Jan 2004 Since Jan 2010 Since Jan 2012
Annu
alize
d ex
cess
retu
rn
Decile Spread Peformance by Active Weight
D1 D10 D10 - D1
D1 D10 D10 - D1 D1 D10 D10 - D1 D1 D10 D10 - D1Return -6.34% 3.69% 10.03% -3.14% 2.77% 5.91% -3.48% 4.26% 7.74%Risk 8.35% 4.48% 9.39% 6.27% 2.93% 6.49% 5.88% 3.01% 6.69%Return/Risk -0.76 0.82 1.07 -0.50 0.95 0.91 -0.59 1.41 1.16
Since 2004 (last 11 years) Since 2010 (last 5 years) Since 2012 (last 3 years)
7
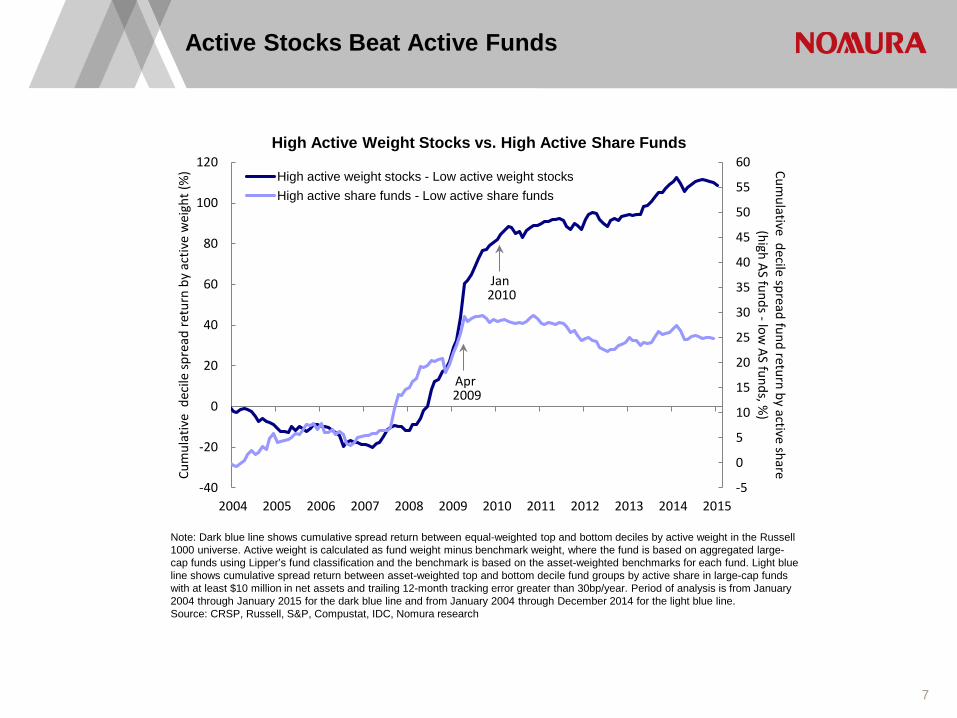
Active Stocks Beat Active Funds
Note: Dark blue line shows cumulative spread return between equal-weighted top and bottom deciles by active weight in the Russell 1000 universe. Active weight is calculated as fund weight minus benchmark weight, where the fund is based on aggregated large-cap funds using Lipper’s fund classification and the benchmark is based on the asset-weighted benchmarks for each fund. Light blue line shows cumulative spread return between asset-weighted top and bottom decile fund groups by active share in large-cap funds with at least $10 million in net assets and trailing 12-month tracking error greater than 30bp/year. Period of analysis is from January 2004 through January 2015 for the dark blue line and from January 2004 through December 2014 for the light blue line. Source: CRSP, Russell, S&P, Compustat, IDC, Nomura research
-5
0
5
10
15
20
25
30
35
40
45
50
55
60
-40
-20
0
20
40
60
80
100
120
2004 2005 2006 2007 2008 2009 2010 2011 2012 2013 2014 2015
Cumulative decile spread fund return by active share
(high AS funds -low AS funds, %
)Cu
mul
ativ
e d
ecile
spre
ad re
turn
by
activ
e w
eigh
t (%
)
High Active Weight Stocks vs. High Active Share Funds
High active weight stocks - Low active weight stocksHigh active share funds - Low active share funds
Apr 2009
Jan 2010
8
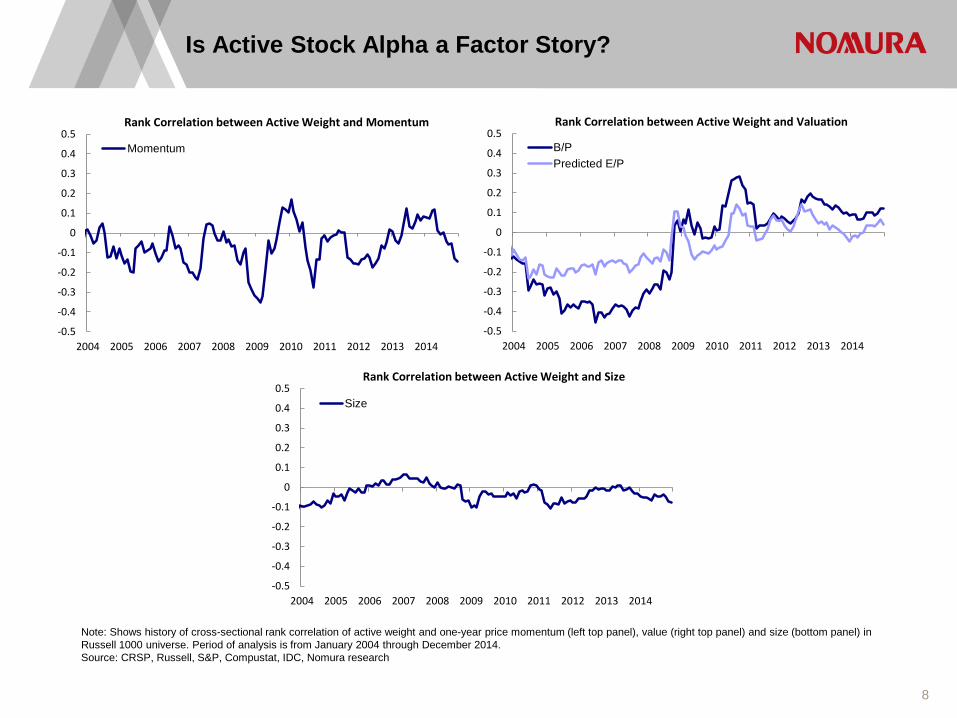
Is Active Stock Alpha a Factor Story?
Note: Shows history of cross-sectional rank correlation of active weight and one-year price momentum (left top panel), value (right top panel) and size (bottom panel) in Russell 1000 universe. Period of analysis is from January 2004 through December 2014. Source: CRSP, Russell, S&P, Compustat, IDC, Nomura research
-0.5
-0.4
-0.3
-0.2
-0.1
0
0.1
0.2
0.3
0.4
0.5
2004 2005 2006 2007 2008 2009 2010 2011 2012 2013 2014
Rank Correlation between Active Weight and Momentum
Momentum
-0.5
-0.4
-0.3
-0.2
-0.1
0
0.1
0.2
0.3
0.4
0.5
2004 2005 2006 2007 2008 2009 2010 2011 2012 2013 2014
Rank Correlation between Active Weight and Valuation
B/PPredicted E/P
-0.5
-0.4
-0.3
-0.2
-0.1
0
0.1
0.2
0.3
0.4
0.5
2004 2005 2006 2007 2008 2009 2010 2011 2012 2013 2014
Rank Correlation between Active Weight and Size
Size
9
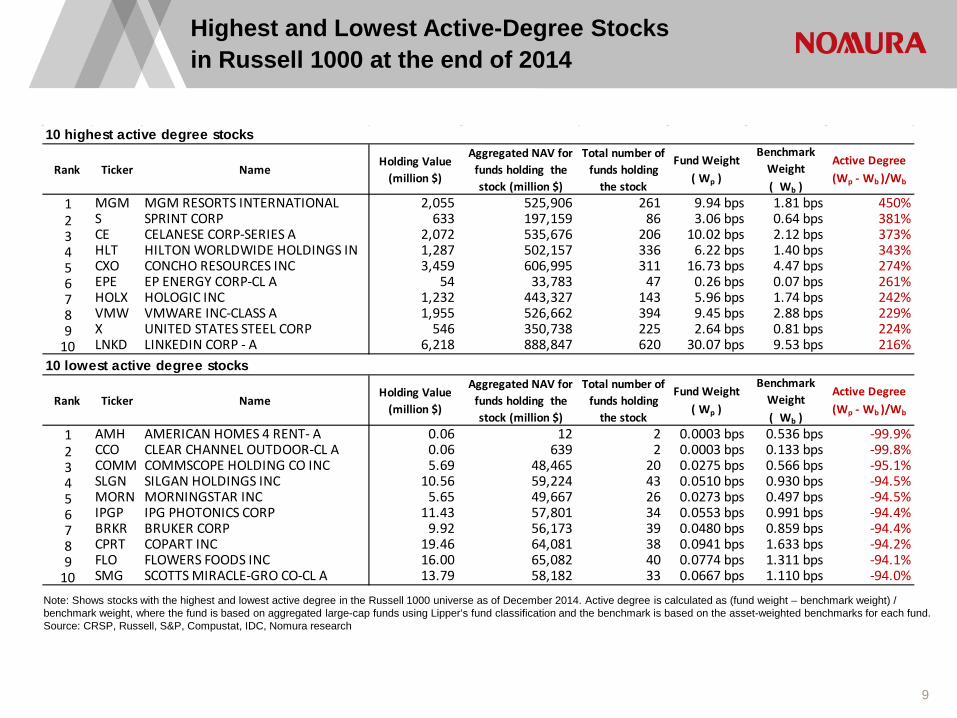
Highest and Lowest Active-Degree Stocks in Russell 1000 at the end of 2014
Note: Shows stocks with the highest and lowest active degree in the Russell 1000 universe as of December 2014. Active degree is calculated as (fund weight – benchmark weight) / benchmark weight, where the fund is based on aggregated large-cap funds using Lipper’s fund classification and the benchmark is based on the asset-weighted benchmarks for each fund. Source: CRSP, Russell, S&P, Compustat, IDC, Nomura research
10 highest active degree stocks
Rank Ticker NameHolding Value
(million $)
Aggregated NAV for funds holding the stock (million $)
Total number of funds holding
the stock
Fund Weight ( Wp )
Benchmark Weight ( Wb )
Active Degree (Wp - Wb )/Wb
1 MGM MGM RESORTS INTERNATIONAL 2,055 525,906 261 9.94 bps 1.81 bps 450%2 S SPRINT CORP 633 197,159 86 3.06 bps 0.64 bps 381%3 CE CELANESE CORP-SERIES A 2,072 535,676 206 10.02 bps 2.12 bps 373%4 HLT HILTON WORLDWIDE HOLDINGS IN 1,287 502,157 336 6.22 bps 1.40 bps 343%5 CXO CONCHO RESOURCES INC 3,459 606,995 311 16.73 bps 4.47 bps 274%6 EPE EP ENERGY CORP-CL A 54 33,783 47 0.26 bps 0.07 bps 261%7 HOLX HOLOGIC INC 1,232 443,327 143 5.96 bps 1.74 bps 242%8 VMW VMWARE INC-CLASS A 1,955 526,662 394 9.45 bps 2.88 bps 229%9 X UNITED STATES STEEL CORP 546 350,738 225 2.64 bps 0.81 bps 224%
10 LNKD LINKEDIN CORP - A 6,218 888,847 620 30.07 bps 9.53 bps 216%10 lowest active degree stocks
Rank Ticker NameHolding Value
(million $)
Aggregated NAV for funds holding the stock (million $)
Total number of funds holding
the stock
Fund Weight ( Wp )
Benchmark Weight ( Wb )
Active Degree (Wp - Wb )/Wb
1 AMH AMERICAN HOMES 4 RENT- A 0.06 12 2 0.0003 bps 0.536 bps -99.9%2 CCO CLEAR CHANNEL OUTDOOR-CL A 0.06 639 2 0.0003 bps 0.133 bps -99.8%3 COMM COMMSCOPE HOLDING CO INC 5.69 48,465 20 0.0275 bps 0.566 bps -95.1%4 SLGN SILGAN HOLDINGS INC 10.56 59,224 43 0.0510 bps 0.930 bps -94.5%5 MORN MORNINGSTAR INC 5.65 49,667 26 0.0273 bps 0.497 bps -94.5%6 IPGP IPG PHOTONICS CORP 11.43 57,801 34 0.0553 bps 0.991 bps -94.4%7 BRKR BRUKER CORP 9.92 56,173 39 0.0480 bps 0.859 bps -94.4%8 CPRT COPART INC 19.46 64,081 38 0.0941 bps 1.633 bps -94.2%9 FLO FLOWERS FOODS INC 16.00 65,082 40 0.0774 bps 1.311 bps -94.1%
10 SMG SCOTTS MIRACLE-GRO CO-CL A 13.79 58,182 33 0.0667 bps 1.110 bps -94.0%
10
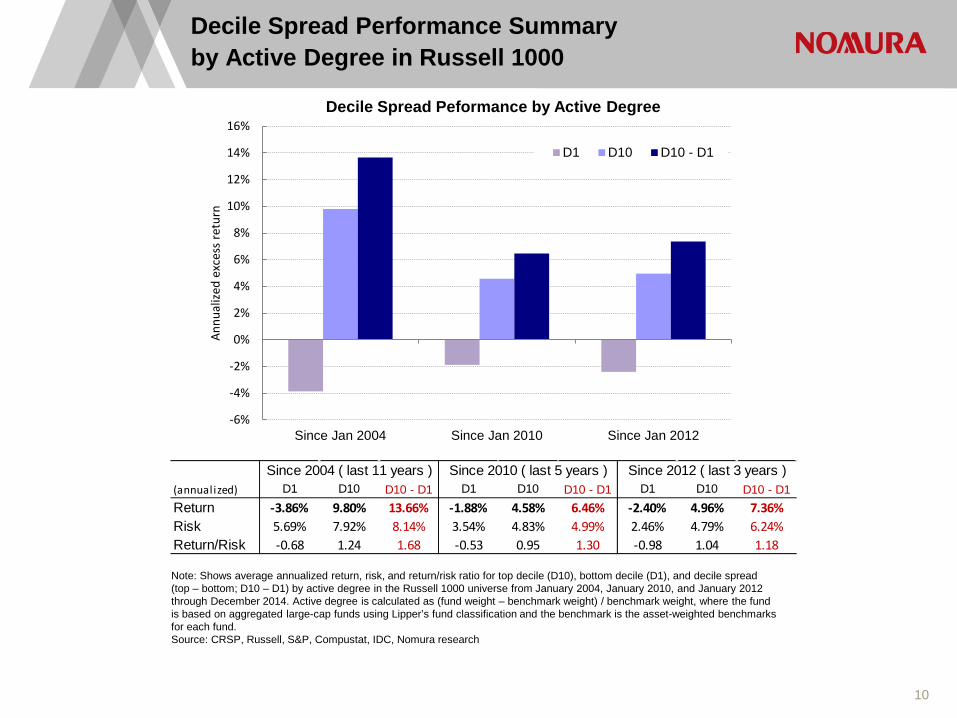
Decile Spread Performance Summary by Active Degree in Russell 1000
Note: Shows average annualized return, risk, and return/risk ratio for top decile (D10), bottom decile (D1), and decile spread (top – bottom; D10 – D1) by active degree in the Russell 1000 universe from January 2004, January 2010, and January 2012 through December 2014. Active degree is calculated as (fund weight – benchmark weight) / benchmark weight, where the fund is based on aggregated large-cap funds using Lipper’s fund classification and the benchmark is the asset-weighted benchmarks for each fund. Source: CRSP, Russell, S&P, Compustat, IDC, Nomura research
(annualized) D1 D10 D10 - D1 D1 D10 D10 - D1 D1 D10 D10 - D1Return -3.86% 9.80% 13.66% -1.88% 4.58% 6.46% -2.40% 4.96% 7.36%Risk 5.69% 7.92% 8.14% 3.54% 4.83% 4.99% 2.46% 4.79% 6.24%Return/Risk -0.68 1.24 1.68 -0.53 0.95 1.30 -0.98 1.04 1.18
Since 2004 ( last 11 years ) Since 2010 ( last 5 years ) Since 2012 ( last 3 years )
-6%
-4%
-2%
0%
2%
4%
6%
8%
10%
12%
14%
16%
Since Jan 2004 Since Jan 2010 Since Jan 2012
Annu
alize
d ex
cess
retu
rn
Decile Spread Peformance by Active Degree
D1 D10 D10 - D1
11
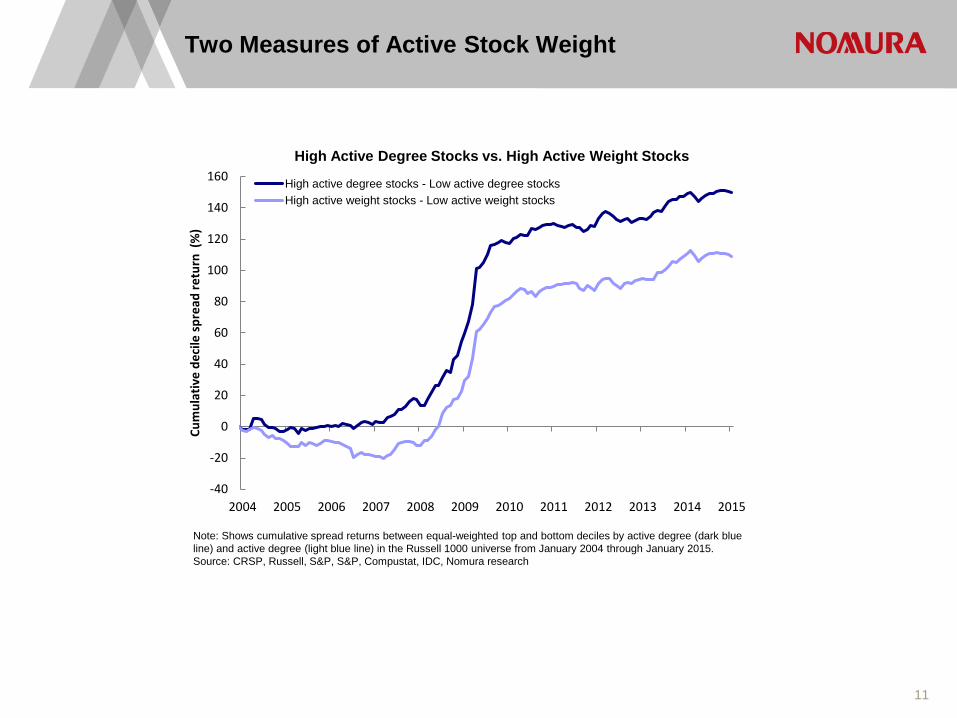
Two Measures of Active Stock Weight
-40
-20
0
20
40
60
80
100
120
140
160
2004 2005 2006 2007 2008 2009 2010 2011 2012 2013 2014 2015
Cum
ulat
ive
deci
le s
prea
d re
turn
(%
)
High Active Degree Stocks vs. High Active Weight Stocks
High active degree stocks - Low active degree stocksHigh active weight stocks - Low active weight stocks
Note: Shows cumulative spread returns between equal-weighted top and bottom deciles by active degree (dark blue line) and active degree (light blue line) in the Russell 1000 universe from January 2004 through January 2015. Source: CRSP, Russell, S&P, S&P, Compustat, IDC, Nomura research
12
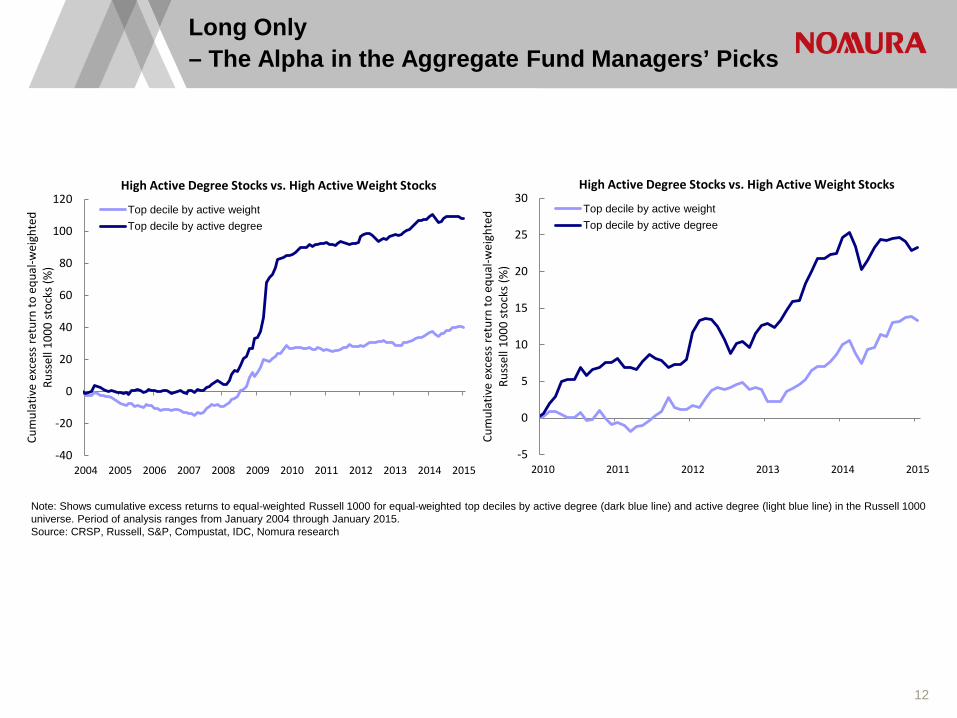
Long Only – The Alpha in the Aggregate Fund Managers’ Picks
Note: Shows cumulative excess returns to equal-weighted Russell 1000 for equal-weighted top deciles by active degree (dark blue line) and active degree (light blue line) in the Russell 1000 universe. Period of analysis ranges from January 2004 through January 2015. Source: CRSP, Russell, S&P, Compustat, IDC, Nomura research
-40
-20
0
20
40
60
80
100
120
2004 2005 2006 2007 2008 2009 2010 2011 2012 2013 2014 2015
Cum
ulat
ive
exce
ss re
turn
to e
qual
-wei
ghte
d Ru
ssel
l 100
0 st
ocks
(%)
High Active Degree Stocks vs. High Active Weight Stocks
Top decile by active weightTop decile by active degree
-5
0
5
10
15
20
25
30
2010 2011 2012 2013 2014 2015Cu
mul
ativ
e ex
cess
retu
rn to
equ
al-w
eigh
ted
Russ
ell 1
000
stoc
ks (%
)
High Active Degree Stocks vs. High Active Weight Stocks
Top decile by active weightTop decile by active degree
13
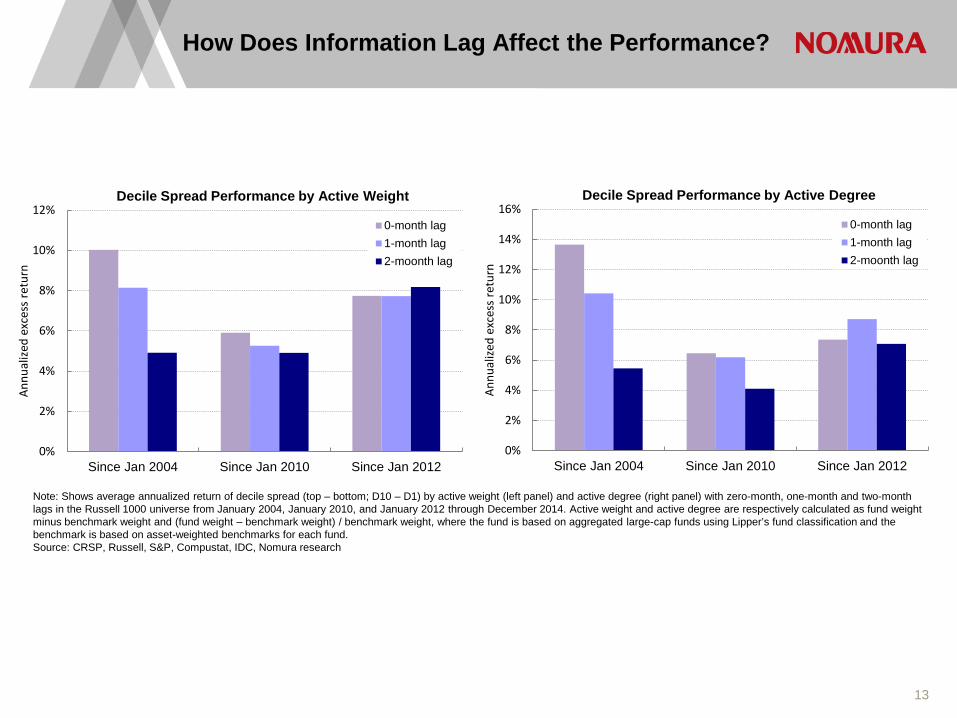
How Does Information Lag Affect the Performance?
Note: Shows average annualized return of decile spread (top – bottom; D10 – D1) by active weight (left panel) and active degree (right panel) with zero-month, one-month and two-month lags in the Russell 1000 universe from January 2004, January 2010, and January 2012 through December 2014. Active weight and active degree are respectively calculated as fund weight minus benchmark weight and (fund weight – benchmark weight) / benchmark weight, where the fund is based on aggregated large-cap funds using Lipper’s fund classification and the benchmark is based on asset-weighted benchmarks for each fund. Source: CRSP, Russell, S&P, Compustat, IDC, Nomura research
0%
2%
4%
6%
8%
10%
12%
Since Jan 2004 Since Jan 2010 Since Jan 2012
Annu
alize
d ex
cess
retu
rn
Decile Spread Performance by Active Weight
0-month lag1-month lag2-moonth lag
0%
2%
4%
6%
8%
10%
12%
14%
16%
Since Jan 2004 Since Jan 2010 Since Jan 2012
Annu
alize
d ex
cess
retu
rn
Decile Spread Performance by Active Degree
0-month lag1-month lag2-moonth lag
14
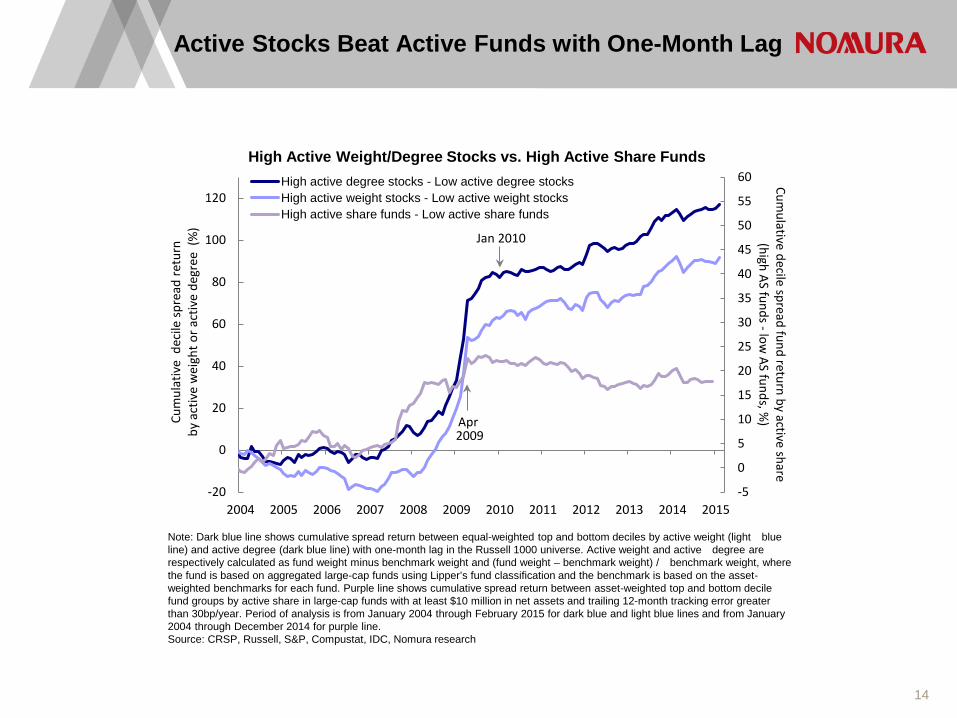
Note: Dark blue line shows cumulative spread return between equal-weighted top and bottom deciles by active weight (light blue line) and active degree (dark blue line) with one-month lag in the Russell 1000 universe. Active weight and active degree are respectively calculated as fund weight minus benchmark weight and (fund weight – benchmark weight) / benchmark weight, where the fund is based on aggregated large-cap funds using Lipper’s fund classification and the benchmark is based on the asset-weighted benchmarks for each fund. Purple line shows cumulative spread return between asset-weighted top and bottom decile fund groups by active share in large-cap funds with at least $10 million in net assets and trailing 12-month tracking error greater than 30bp/year. Period of analysis is from January 2004 through February 2015 for dark blue and light blue lines and from January 2004 through December 2014 for purple line. Source: CRSP, Russell, S&P, Compustat, IDC, Nomura research
Active Stocks Beat Active Funds with One-Month Lag
-5
0
5
10
15
20
25
30
35
40
45
50
55
60
-20
0
20
40
60
80
100
120
2004 2005 2006 2007 2008 2009 2010 2011 2012 2013 2014 2015
Cumulative decile spread fund return by active share
(high AS funds -low AS funds, %
)Cum
ulat
ive
dec
ile sp
read
retu
rn
by a
ctiv
e w
eigh
t or a
ctiv
e de
gree
(%
)
High Active Weight/Degree Stocks vs. High Active Share FundsHigh active degree stocks - Low active degree stocksHigh active weight stocks - Low active weight stocksHigh active share funds - Low active share funds
Apr 2009
Jan 2010
15
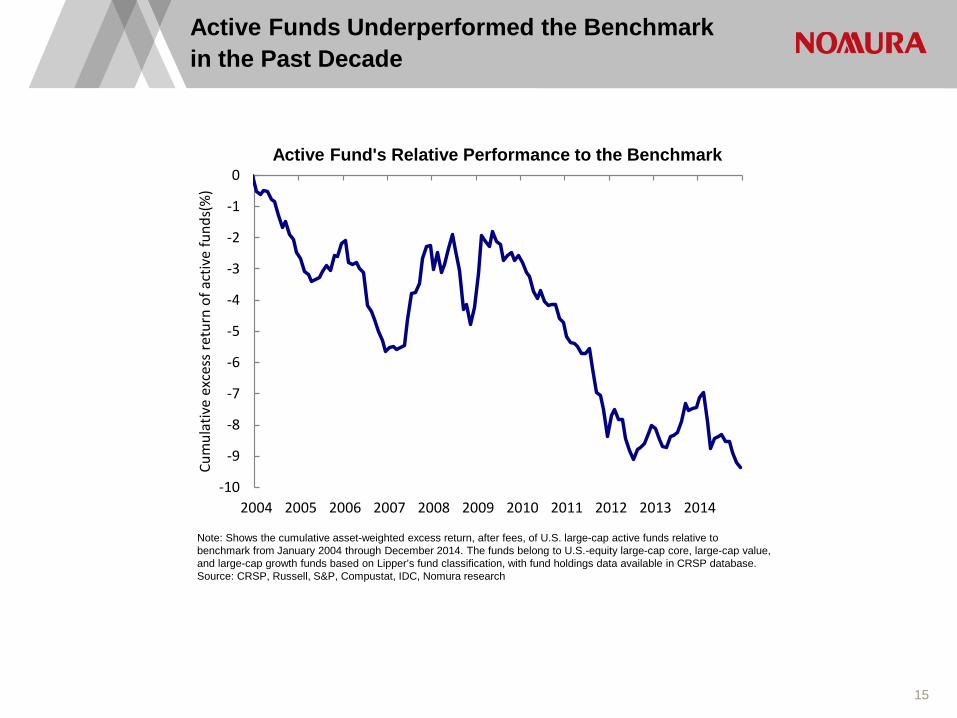
Active Funds Underperformed the Benchmark in the Past Decade
Note: Shows the cumulative asset-weighted excess return, after fees, of U.S. large-cap active funds relative to benchmark from January 2004 through December 2014. The funds belong to U.S.-equity large-cap core, large-cap value, and large-cap growth funds based on Lipper’s fund classification, with fund holdings data available in CRSP database. Source: CRSP, Russell, S&P, Compustat, IDC, Nomura research
-10
-9
-8
-7
-6
-5
-4
-3
-2
-1
0
2004 2005 2006 2007 2008 2009 2010 2011 2012 2013 2014
Cum
ulat
ive
exce
ss re
turn
of a
ctiv
e fu
nds(
%)
Active Fund's Relative Performance to the Benchmark

16
Asset-Weighted Active Fund Holdings Outperform Asset-Weighted Active Funds
Note: Left panel shows cumulative returns of U.S. large-cap active funds (asset-weighted, light blue line), the benchmarks (asset-weighted, purple line), and aggregated fund holdings in the Russell 1000 universe (dark blue line). Right panel shows cumulative excess returns of aggregated fund holdings in the Russell 1000 universe relative to asset-weighted active funds (dark blue line) and asset-weighted benchmark (red line) from January 2004 through December 2014. The funds belong to U.S.-equity large-cap core, large-cap value, and large-cap growth funds based on Lipper’s fund classification, with fund holdings data available in CRSP database. Source: CRSP, Russell, S&P, Compustat, IDC, Nomura research
-40
-20
0
20
40
60
80
100
120
140
2004 2005 2006 2007 2008 2009 2010 2011 2012 2013 2014
Cum
ulat
ive
retu
rn (%
)
Benchmarks (asset-weighted)Active funds (asset-weighted)Active fund holdings (asset-weighted)
Active Funds, Active Fund Holdings and Benchmarks
-5
0
5
10
15
20
25
30
35
2004 2005 2006 2007 2008 2009 2010 2011 2012 2013 2014
Cum
ulat
ive
exce
ss re
turn
(%)
Active fund holdings - Active funds (asset-weighted)Active fund holdings - Benchmarks (asset-weighted)
Active Funds, Active Fund Holdings and Benchmarks
17
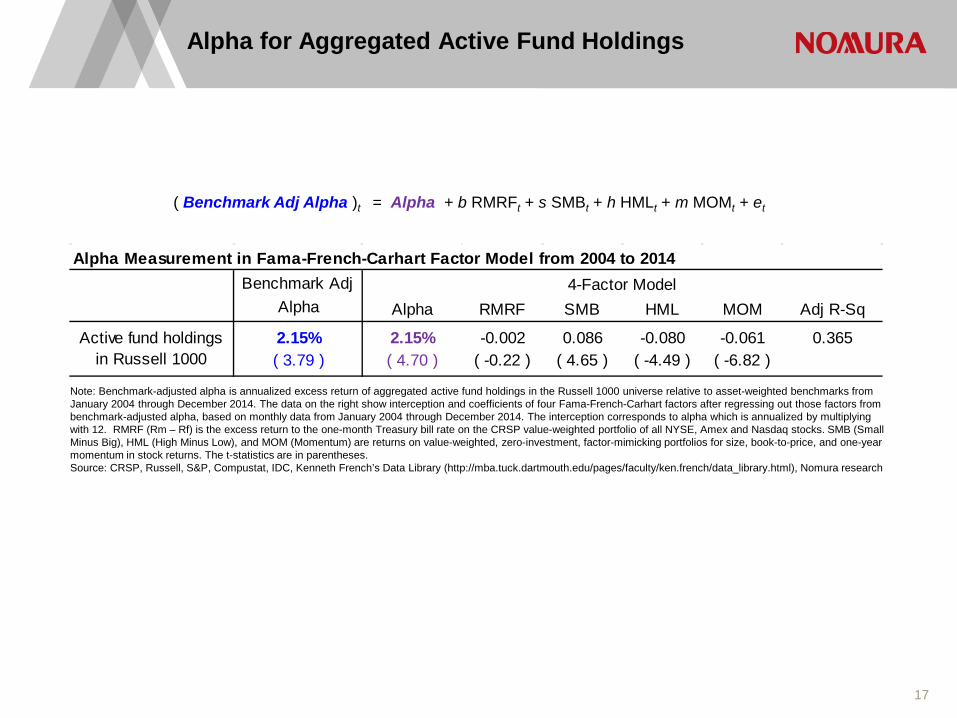
Alpha for Aggregated Active Fund Holdings
Note: Benchmark-adjusted alpha is annualized excess return of aggregated active fund holdings in the Russell 1000 universe relative to asset-weighted benchmarks from January 2004 through December 2014. The data on the right show interception and coefficients of four Fama-French-Carhart factors after regressing out those factors from benchmark-adjusted alpha, based on monthly data from January 2004 through December 2014. The interception corresponds to alpha which is annualized by multiplying with 12. RMRF (Rm – Rf) is the excess return to the one-month Treasury bill rate on the CRSP value-weighted portfolio of all NYSE, Amex and Nasdaq stocks. SMB (Small Minus Big), HML (High Minus Low), and MOM (Momentum) are returns on value-weighted, zero-investment, factor-mimicking portfolios for size, book-to-price, and one-year momentum in stock returns. The t-statistics are in parentheses. Source: CRSP, Russell, S&P, Compustat, IDC, Kenneth French’s Data Library (http://mba.tuck.dartmouth.edu/pages/faculty/ken.french/data_library.html), Nomura research
( Benchmark Adj Alpha )t = Alpha + b RMRFt + s SMBt + h HMLt + m MOMt + et
Alpha Measurement in Fama-French-Carhart Factor Model from 2004 to 2014Benchmark Adj
Alpha Alpha RMRF SMB HML MOM Adj R-Sq
2.15% 2.15% -0.002 0.086 -0.080 -0.061 0.365( 3.79 ) ( 4.70 ) ( -0.22 ) ( 4.65 ) ( -4.49 ) ( -6.82 )
Active fund holdings in Russell 1000
4-Factor Model
18
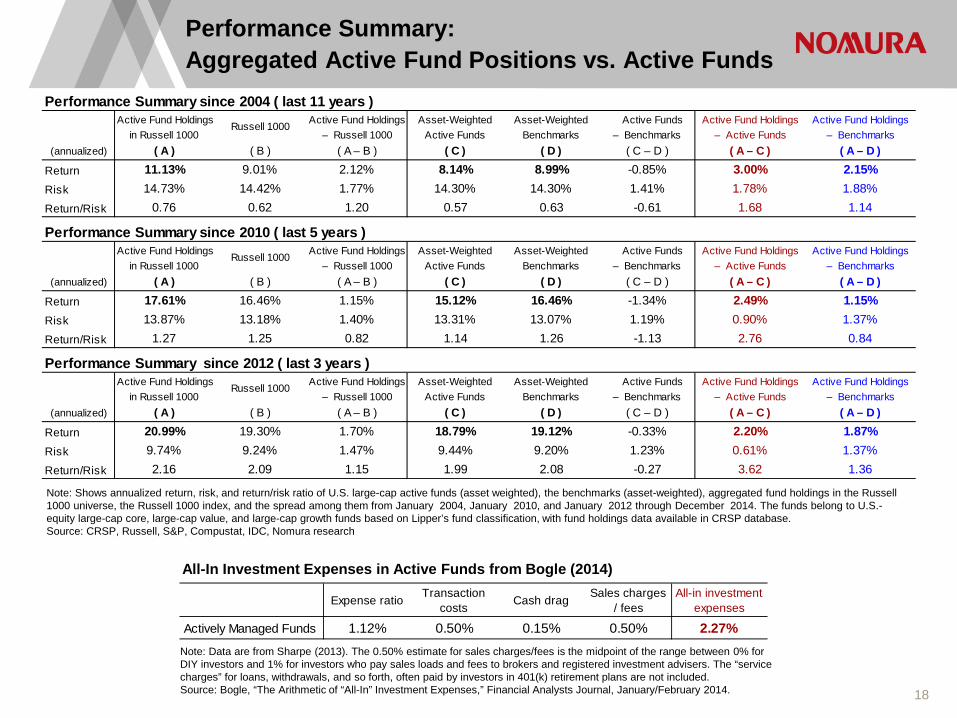
Performance Summary: Aggregated Active Fund Positions vs. Active Funds
Note: Shows annualized return, risk, and return/risk ratio of U.S. large-cap active funds (asset weighted), the benchmarks (asset-weighted), aggregated fund holdings in the Russell 1000 universe, the Russell 1000 index, and the spread among them from January 2004, January 2010, and January 2012 through December 2014. The funds belong to U.S.-equity large-cap core, large-cap value, and large-cap growth funds based on Lipper’s fund classification, with fund holdings data available in CRSP database. Source: CRSP, Russell, S&P, Compustat, IDC, Nomura research
Expense ratio Transaction costs Cash drag Sales charges
/ feesAll-in investment
expenses
Actively Managed Funds 1.12% 0.50% 0.15% 0.50% 2.27%
All-In Investment Expenses in Active Funds from Bogle (2014)
Note: Data are from Sharpe (2013). The 0.50% estimate for sales charges/fees is the midpoint of the range between 0% for DIY investors and 1% for investors who pay sales loads and fees to brokers and registered investment advisers. The “service charges” for loans, withdrawals, and so forth, often paid by investors in 401(k) retirement plans are not included. Source: Bogle, “The Arithmetic of “All-In” Investment Expenses,” Financial Analysts Journal, January/February 2014.
Performance Summary since 2004 ( last 11 years )Active Fund Holdings Active Fund Holdings Asset-Weighted Asset-Weighted Active Funds Active Fund Holdings Active Fund Holdings
in Russell 1000 – Russell 1000 Active Funds Benchmarks – Benchmarks – Active Funds – Benchmarks(annualized) ( A ) ( B ) ( A – B ) ( C ) ( D ) ( C – D ) ( A – C ) ( A – D )
Return 11.13% 9.01% 2.12% 8.14% 8.99% -0.85% 3.00% 2.15%Risk 14.73% 14.42% 1.77% 14.30% 14.30% 1.41% 1.78% 1.88%Return/Risk 0.76 0.62 1.20 0.57 0.63 -0.61 1.68 1.14
Performance Summary since 2010 ( last 5 years )Active Fund Holdings Active Fund Holdings Asset-Weighted Asset-Weighted Active Funds Active Fund Holdings Active Fund Holdings
in Russell 1000 – Russell 1000 Active Funds Benchmarks – Benchmarks – Active Funds – Benchmarks(annualized) ( A ) ( B ) ( A – B ) ( C ) ( D ) ( C – D ) ( A – C ) ( A – D )
Return 17.61% 16.46% 1.15% 15.12% 16.46% -1.34% 2.49% 1.15%Risk 13.87% 13.18% 1.40% 13.31% 13.07% 1.19% 0.90% 1.37%Return/Risk 1.27 1.25 0.82 1.14 1.26 -1.13 2.76 0.84
Performance Summary since 2012 ( last 3 years )Active Fund Holdings Active Fund Holdings Asset-Weighted Asset-Weighted Active Funds Active Fund Holdings Active Fund Holdings
in Russell 1000 – Russell 1000 Active Funds Benchmarks – Benchmarks – Active Funds – Benchmarks(annualized) ( A ) ( B ) ( A – B ) ( C ) ( D ) ( C – D ) ( A – C ) ( A – D )
Return 20.99% 19.30% 1.70% 18.79% 19.12% -0.33% 2.20% 1.87%Risk 9.74% 9.24% 1.47% 9.44% 9.20% 1.23% 0.61% 1.37%Return/Risk 2.16 2.09 1.15 1.99 2.08 -0.27 3.62 1.36
Russell 1000
Russell 1000
Russell 1000
19
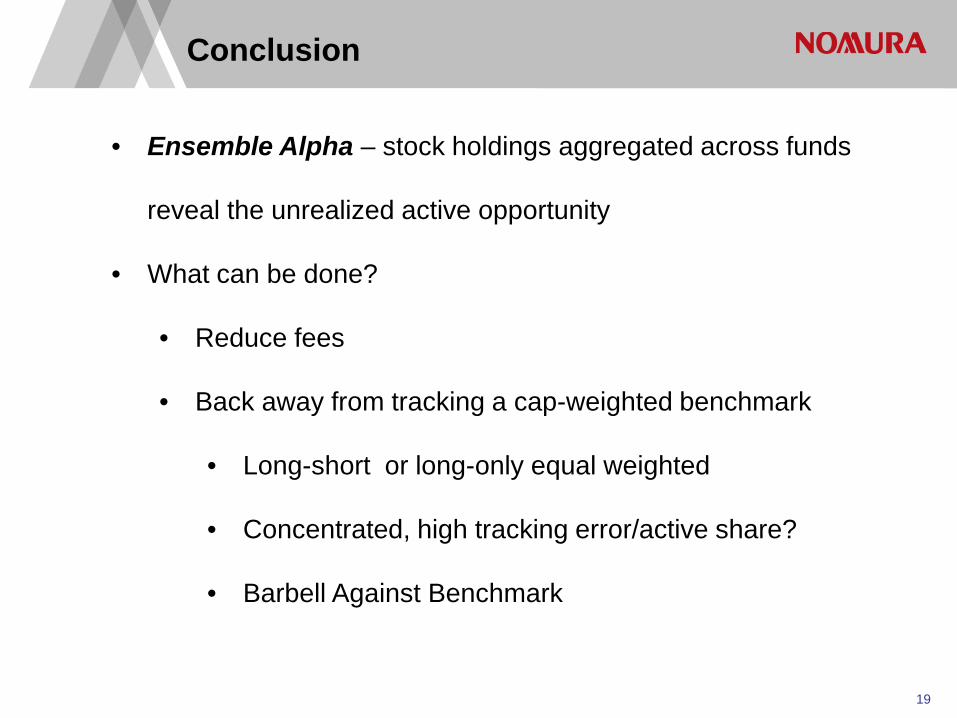
Conclusion
• Ensemble Alpha – stock holdings aggregated across funds
reveal the unrealized active opportunity
• What can be done?
• Reduce fees
• Back away from tracking a cap-weighted benchmark
• Long-short or long-only equal weighted
• Concentrated, high tracking error/active share?
• Barbell Against Benchmark
Appendix A-1 Analyst Certification I, Joseph Mezrich, hereby certify (1) that the views expressed in this Research report accurately reflect my personal views about any or all of the subject securities or issuers referred to in this Research report, (2) no part of my compensation was, is or will be directly or indirectly related to the specific recommendations or views expressed in this Research report and (3) no part of my compensation is tied to any specific investment banking transactions performed by Nomura Securities International, Inc., Nomura International plc or any other Nomura Group company.
Important Disclosures Online availability of research and conflict-of-interest disclosures Nomura research is available on www.nomuranow.com/research, Bloomberg, Capital IQ, Factset, MarkitHub, Reuters and ThomsonOne. Important disclosures may be read at http://go.nomuranow.com/research/globalresearchportal/pages/disclosures/disclosures.aspx or requested from Nomura Securities International, Inc., on 1-877-865-5752. If you have any difficulties with the website, please email [email protected] for help. The analysts responsible for preparing this report have received compensation based upon various factors including the firm's total revenues, a portion of which is generated by Investment Banking activities. Unless otherwise noted, the non-US analysts listed at the front of this report are not registered/qualified as research analysts under FINRA/NYSE rules, may not be associated persons of NSI, and may not be subject to FINRA Rule 2711 and NYSE Rule 472 restrictions on communications with covered companies, public appearances, and trading securities held by a research analyst account. Nomura Global Financial Products Inc. (“NGFP”) Nomura Derivative Products Inc. (“NDPI”) and Nomura International plc. (“NIplc”) are registered with the Commodities Futures Trading Commission and the National Futures Association (NFA) as swap dealers. NGFP, NDPI, and NIplc are generally engaged in the trading of swaps and other derivative products, any of which may be the subject of this report. Any authors named in this report are research analysts unless otherwise indicated. Industry Specialists identified in some Nomura International plc research reports are employees within the Firm who are responsible for the sales and trading effort in the sector for which they have coverage. Industry Specialists do not contribute in any manner to the content of research reports in which their names appear. Distribution of ratings (Global) The distribution of all ratings published by Nomura Global Equity Research is as follows: 48% have been assigned a Buy rating which, for purposes of mandatory disclosures, are classified as a Buy rating; 43% of companies with this rating are investment banking clients of the Nomura Group*. 44% have been assigned a Neutral rating which, for purposes of mandatory disclosures, is classified as a Hold rating; 53% of companies with this rating are investment banking clients of the Nomura Group*. 8% have been assigned a Reduce rating which, for purposes of mandatory disclosures, are classified as a Sell rating; 25% of companies with this rating are investment banking clients of the Nomura Group*. As at 31 March 2015. *The Nomura Group as defined in the Disclaimer section at the end of this report. Explanation of Nomura's equity research rating system in Europe, Middle East and Africa, US and Latin America, and Japan and Asia ex-Japan from 21 October 2013 The rating system is a relative system, indicating expected performance against a specific benchmark identified for each individual stock, subject to limited management discretion. An analyst’s target price is an assessment of the current intrinsic fair value of the stock based on an appropriate valuation methodology determined by the analyst. Valuation methodologies include, but are not limited to, discounted cash flow analysis, expected return on equity and multiple analysis. Analysts may also indicate expected absolute upside/downside relative to the stated target price, defined as (target price - current price)/current price. STOCKS A rating of 'Buy', indicates that the analyst expects the stock to outperform the Benchmark over the next 12 months. A rating of 'Neutral', indicates that the analyst expects the stock to perform in line with the Benchmark over the next 12 months. A rating of 'Reduce', indicates that the analyst expects the stock to underperform the Benchmark over the next 12 months. A rating of
'Suspended', indicates that the rating, target price and estimates have been suspended temporarily to comply with applicable regulations and/or firm policies. Securities and/or companies that are labelled as 'Not rated' or shown as 'No rating' are not in regular research coverage. Investors should not expect continuing or additional information from Nomura relating to such securities and/or companies. Benchmarks are as follows: United States/Europe/Asia ex-Japan: please see valuation methodologies for explanations of relevant benchmarks for stocks, which can be accessed at: http://go.nomuranow.com/research/globalresearchportal/pages/disclosures/disclosures.aspx; Global Emerging Markets (ex-Asia): MSCI Emerging Markets ex-Asia, unless otherwise stated in the valuation methodology; Japan: Russell/Nomura Large Cap. SECTORS A 'Bullish' stance, indicates that the analyst expects the sector to outperform the Benchmark during the next 12 months. A 'Neutral' stance, indicates that the analyst expects the sector to perform in line with the Benchmark during the next 12 months. A 'Bearish' stance, indicates that the analyst expects the sector to underperform the Benchmark during the next 12 months. Sectors that are labelled as 'Not rated' or shown as 'N/A' are not assigned ratings. Benchmarks are as follows: United States: S&P 500; Europe: Dow Jones STOXX 600; Global Emerging Markets (ex-Asia): MSCI Emerging Markets ex-Asia. Japan/Asia ex-Japan: Sector ratings are not assigned. Explanation of Nomura's equity research rating system in Japan and Asia ex-Japan prior to 21 October 2013 STOCKS Stock recommendations are based on absolute valuation upside (downside), which is defined as (Target Price - Current Price) / Current Price, subject to limited management discretion. In most cases, the Target Price will equal the analyst's 12-month intrinsic valuation of the stock, based on an appropriate valuation methodology such as discounted cash flow, multiple analysis, etc. A 'Buy' recommendation indicates that potential upside is 15% or more. A 'Neutral' recommendation indicates that potential upside is less than 15% or downside is less than 5%. A 'Reduce' recommendation indicates that potential downside is 5% or more. A rating of 'Suspended' indicates that the rating and target price have been suspended temporarily to comply with applicable regulations and/or firm policies in certain circumstances including when Nomura is acting in an advisory capacity in a merger or strategic transaction involving the subject company. Securities and/or companies that are labelled as 'Not rated' or shown as 'No rating' are not in regular research coverage of the Nomura entity identified in the top banner. Investors should not expect continuing or additional information from Nomura relating to such securities and/or companies. SECTORS A 'Bullish' rating means most stocks in the sector have (or the weighted average recommendation of the stocks under coverage is) a positive absolute recommendation. A 'Neutral' rating means most stocks in the sector have (or the weighted average recommendation of the stocks under coverage is) a neutral absolute recommendation. A 'Bearish' rating means most stocks in the sector have (or the weighted average recommendation of the stocks under coverage is) a negative absolute recommendation. Target Price A Target Price, if discussed, reflects in part the analyst's estimates for the company's earnings. The achievement of any target price may be impeded by general market and macroeconomic trends, and by other risks related to the company or the market, and may not occur if the company's earnings differ from estimates. Disclaimers This document contains material that has been prepared by the Nomura entity identified on page 1 and/or with the sole or joint contributions of one or more Nomura entities whose employees and their respective affiliations are also specified on page 1 or identified elsewhere in the document. The term "Nomura Group" used herein refers to Nomura Holdings, Inc. or any of its affiliates or subsidiaries and may refer to one or more Nomura Group companies including: Nomura Securities Co., Ltd. ('NSC') Tokyo, Japan; Nomura International plc ('NIplc'), UK; Nomura Securities International, Inc. ('NSI'), New York, US; Nomura International (Hong Kong) Ltd. (‘NIHK’), Hong Kong; Nomura Financial Investment (Korea) Co., Ltd. (‘NFIK’), Korea (Information on Nomura analysts registered with the Korea Financial Investment Association ('KOFIA') can be found on the KOFIA Intranet at http://dis.kofia.or.kr); Nomura Singapore Ltd. (‘NSL’), Singapore (Registration number 197201440E, regulated by the Monetary Authority of Singapore); Nomura Australia Ltd. (‘NAL’), Australia (ABN 48 003 032 513), regulated by the Australian Securities and Investment Commission ('ASIC') and holder of an Australian financial services licence number 246412; P.T. Nomura Indonesia (‘PTNI’), Indonesia; Nomura Securities Malaysia Sdn. Bhd. (‘NSM’), Malaysia; NIHK, Taipei Branch (‘NITB’), Taiwan; Nomura Financial Advisory and Securities (India) Private Limited (‘NFASL’), Mumbai, India (Registered Address: Ceejay House, Level 11, Plot F, Shivsagar Estate, Dr. Annie Besant Road, Worli, Mumbai- 400 018, India; Tel: +91 22 4037 4037, Fax: +91 22 4037 4111; CIN No : U74140MH2007PTC169116, SEBI Registration No: BSE INB011299030, NSE INB231299034, INF231299034, INE 231299034, MCX: INE261299034) and NIplc, Madrid Branch (‘NIplc, Madrid’). ‘CNS Thailand’ next to an analyst’s name on the front page of a research report indicates that the analyst is employed by Capital Nomura Securities Public Company Limited (‘CNS’) to provide research assistance services to NSL under a Research Assistance Agreement. ‘NSFSPL’ next to an employee’s name on the front page of a research report indicates that the individual is employed by Nomura Structured Finance Services Private Limited to provide assistance to certain Nomura entities under inter-company agreements.
Appendix A-1 (cont’d)
THIS MATERIAL IS: (I) FOR YOUR PRIVATE INFORMATION, AND WE ARE NOT SOLICITING ANY ACTION BASED UPON IT; (II) NOT TO BE CONSTRUED AS AN OFFER TO SELL OR A SOLICITATION OF AN OFFER TO BUY ANY SECURITY IN ANY JURISDICTION WHERE SUCH OFFER OR SOLICITATION WOULD BE ILLEGAL; AND (III) BASED UPON INFORMATION FROM SOURCES THAT WE CONSIDER RELIABLE, BUT HAS NOT BEEN INDEPENDENTLY VERIFIED BY NOMURA GROUP. Nomura Group does not warrant or represent that the document is accurate, complete, reliable, fit for any particular purpose or merchantable and does not accept liability for any act (or decision not to act) resulting from use of this document and related data. To the maximum extent permissible all warranties and other assurances by Nomura group are hereby excluded and Nomura Group shall have no liability for the use, misuse, or distribution of this information. Opinions or estimates expressed are current opinions as of the original publication date appearing on this material and the information, including the opinions and estimates contained herein, are subject to change without notice. Nomura Group is under no duty to update this document. Any comments or statements made herein are those of the author(s) and may differ from views held by other parties within Nomura Group. Clients should consider whether any advice or recommendation in this report is suitable for their particular circumstances and, if appropriate, seek professional advice, including tax advice. Nomura Group does not provide tax advice. Nomura Group, and/or its officers, directors and employees, may, to the extent permitted by applicable law and/or regulation, deal as principal, agent, or otherwise, or have long or short positions in, or buy or sell, the securities, commodities or instruments, or options or other derivative instruments based thereon, of issuers or securities mentioned herein. Nomura Group companies may also act as market maker or liquidity provider (within the meaning of applicable regulations in the UK) in the financial instruments of the issuer. Where the activity of market maker is carried out in accordance with the definition given to it by specific laws and regulations of the US or other jurisdictions, this will be separately disclosed within the specific issuer disclosures. This document may contain information obtained from third parties, including ratings from credit ratings agencies such as Standard & Poor’s. Reproduction and distribution of third-party content in any form is prohibited except with the prior written permission of the related third-party. Third-party content providers do not guarantee the accuracy, completeness, timeliness or availability of any information, including ratings, and are not responsible for any errors or omissions (negligent or otherwise), regardless of the cause, or for the results obtained from the use of such content. Third-party content providers give no express or implied warranties, including, but not limited to, any warranties of merchantability or fitness for a particular purpose or use. Third-party content providers shall not be liable for any direct, indirect, incidental, exemplary, compensatory, punitive, special or consequential damages, costs, expenses, legal fees, or losses (including lost income or profits and opportunity costs) in connection with any use of their content, including ratings. Credit ratings are statements of opinions and are not statements of fact or recommendations to purchase hold or sell securities. They do not address the suitability of securities or the suitability of securities for investment purposes, and should not be relied on as investment advice. Any MSCI sourced information in this document is the exclusive property of MSCI Inc. (‘MSCI’). Without prior written permission of MSCI, this information and any other MSCI intellectual property may not be reproduced, re-disseminated or used to create any financial products, including any indices. This information is provided on an "as is" basis. The user assumes the entire risk of any use made of this information. MSCI, its affiliates and any third party involved in, or related to, computing or compiling the information hereby expressly disclaim all warranties of originality, accuracy, completeness, merchantability or fitness for a particular purpose with respect to any of this information. Without limiting any of the foregoing, in no event shall MSCI, any of its affiliates or any third party involved in, or related to, computing or compiling the information have any liability for any damages of any kind. MSCI and the MSCI indexes are services marks of MSCI and its affiliates. Russell/Nomura Japan Equity Indexes are protected by certain intellectual property rights of Nomura Securities Co., Ltd. and Russell Investments. Nomura Securities Co., Ltd. and Russell Investments do not guarantee the accuracy, completeness, reliability, or usefulness thereof and do not account for business activities and services that any index user and its affiliates undertake with the use of the Indexes. Investors should consider this document as only a single factor in making their investment decision and, as such, the report should not be viewed as identifying or suggesting all risks, direct or indirect, that may be associated with any investment decision. Nomura Group produces a number of different types of research product including, among others, fundamental analysis and quantitative analysis; recommendations contained in one type of research product may differ from recommendations contained in other types of research product, whether as a result of differing time horizons, methodologies or otherwise. Nomura Group publishes research product in a number of different ways including the posting of product on Nomura Group portals and/or distribution directly to clients. Different groups of clients may receive different products and services from the research department depending on their individual requirements. Figures presented herein may refer to past performance or simulations based on past performance which are not reliable indicators of future performance. Where the information contains an indication of future performance, such forecasts may not be a reliable indicator of future performance. Moreover, simulations are based on models and simplifying assumptions which may oversimplify and not reflect the future distribution of returns. Certain securities are subject to fluctuations in exchange rates that could have an adverse effect on the value or price of, or income derived from, the investment. The securities described herein may not have been registered under the US Securities Act of 1933 (the ‘1933 Act’), and, in such case, may not be offered or sold in the US or to US persons unless they have been registered under the 1933 Act, or except in compliance with an exemption from the registration requirements of the 1933 Act. Unless governing law permits otherwise, any transaction should be executed via a Nomura entity in your home jurisdiction.
Appendix A-1 (cont’d)

This document has been approved for distribution in the UK and European Economic Area as investment research by NIplc. NIplc is authorised by the Prudential Regulation Authority and regulated by the Financial Conduct Authority and the Prudential Regulation Authority. NIplc is a member of the London Stock Exchange. This document does not constitute a personal recommendation within the meaning of applicable regulations in the UK, or take into account the particular investment objectives, financial situations, or needs of individual investors. This document is intended only for investors who are 'eligible counterparties' or 'professional clients' for the purposes of applicable regulations in the UK, and may not, therefore, be redistributed to persons who are 'retail clients' for such purposes. This document has been approved by NIHK, which is regulated by the Hong Kong Securities and Futures Commission, for distribution in Hong Kong by NIHK. This document has been approved for distribution in Australia by NAL, which is authorized and regulated in Australia by the ASIC. This document has also been approved for distribution in Malaysia by NSM. In Singapore, this document has been distributed by NSL. NSL accepts legal responsibility for the content of this document, where it concerns securities, futures and foreign exchange, issued by their foreign affiliates in respect of recipients who are not accredited, expert or institutional investors as defined by the Securities and Futures Act (Chapter 289). Recipients of this document in Singapore should contact NSL in respect of matters arising from, or in connection with, this document. Unless prohibited by the provisions of Regulation S of the 1933 Act, this material is distributed in the US, by NSI, a US-registered broker-dealer, which accepts responsibility for its contents in accordance with the provisions of Rule 15a-6, under the US Securities Exchange Act of 1934. The entity that prepared this document permits its separately operated affiliates within the Nomura Group to make copies of such documents available to their clients. This document has not been approved for distribution to persons other than ‘Authorised Persons’, ‘Exempt Persons’ or ‘Institutions’ (as defined by the Capital Markets Authority) in the Kingdom of Saudi Arabia (‘Saudi Arabia’) or 'professional clients' (as defined by the Dubai Financial Services Authority) in the United Arab Emirates (‘UAE’) or a ‘Market Counterparty’ or ‘Business Customers’ (as defined by the Qatar Financial Centre Regulatory Authority) in the State of Qatar (‘Qatar’) by Nomura Saudi Arabia, NIplc or any other member of Nomura Group, as the case may be. Neither this document nor any copy thereof may be taken or transmitted or distributed, directly or indirectly, by any person other than those authorised to do so into Saudi Arabia or in the UAE or in Qatar or to any person other than ‘Authorised Persons’, ‘Exempt Persons’ or ‘Institutions’ located in Saudi Arabia or 'professional clients' in the UAE or a ‘Market Counterparty’ or ‘Business Customers’ in Qatar . By accepting to receive this document, you represent that you are not located in Saudi Arabia or that you are an ‘Authorised Person’, an ‘Exempt Person’ or an ‘Institution’ in Saudi Arabia or that you are a 'professional client' in the UAE or a ‘Market Counterparty’ or ‘Business Customers’ in Qatar and agree to comply with these restrictions. Any failure to comply with these restrictions may constitute a violation of the laws of the UAE or Saudi Arabia or Qatar. NO PART OF THIS MATERIAL MAY BE (I) COPIED, PHOTOCOPIED, OR DUPLICATED IN ANY FORM, BY ANY MEANS; OR (II) REDISTRIBUTED WITHOUT THE PRIOR WRITTEN CONSENT OF A MEMBER OF NOMURA GROUP. If this document has been distributed by electronic transmission, such as e-mail, then such transmission cannot be guaranteed to be secure or error-free as information could be intercepted, corrupted, lost, destroyed, arrive late or incomplete, or contain viruses. The sender therefore does not accept liability for any errors or omissions in the contents of this document, which may arise as a result of electronic transmission. If verification is required, please request a hard-copy version. Nomura Group manages conflicts with respect to the production of research through its compliance policies and procedures (including, but not limited to, Conflicts of Interest, Chinese Wall and Confidentiality policies) as well as through the maintenance of Chinese walls and employee training. Additional information is available upon request and disclosure information is available at the Nomura Disclosure web page: http://go.nomuranow.com/research/globalresearchportal/pages/disclosures/disclosures.aspx Copyright © 2015 Nomura Securities International, Inc. All rights reserved. Disclosures as of 07-May-2015.
Appendix A-1 (cont’d)