environment and its influence on health and demographics
TRANSCRIPT
Purdue UniversityPurdue e-PubsWeldon School of Biomedical Engineering FacultyPublications Weldon School of Biomedical Engineering
2-4-2016
Environment and Its Influence on Health andDemographics in South KoreaRamiro D. Bravo SantistebanDepartment of Biomedical Engineering, Kyung Hee University, Gyeonggi-do 17104, Korea
Young L. KimWeldon School of Biomedical Engineering, Purdue University, [email protected]
Umar FarooqDepartment of Biomedical Engineering, Kyung Hee University, Gyeonggi-do 17104, Korea
Tae-Seong KimDepartment of Biomedical Engineering, Kyung Hee University, Gyeonggi-do 17104, Korea
Sekyoung YoumDepartment of Industrial and System Engineering, Dongguk University, Seoul 04620, Korea
See next page for additional authors
Follow this and additional works at: https://docs.lib.purdue.edu/bmepubs
This document has been made available through Purdue e-Pubs, a service of the Purdue University Libraries. Please contact [email protected] foradditional information.
Recommended CitationBravo Santisteban, R.D.; Kim, Y.L.; Farooq, U.; Kim, T.-S.; Youm, S.; Park, S.-H. Environment and Its Influence on Health andDemographics in South Korea. Int. J. Environ. Res. Public Health 2016, 13, 183.

AuthorsRamiro D. Bravo Santisteban, Young L. Kim, Umar Farooq, Tae-Seong Kim, Sekyoung Youm, and Seung-HunPark
This article is available at Purdue e-Pubs: https://docs.lib.purdue.edu/bmepubs/142

International Journal of
Environmental Research
and Public Health
Article
Environment and Its Influence on Health andDemographics in South Korea
Ramiro D. Bravo Santisteban 1, Young L. Kim 2,3, Umar Farooq 1, Tae-Seong Kim 1,Sekyoung Youm 4,* and Seung-Hun Park 5
1 Department of Biomedical Engineering, Kyung Hee University, Gyeonggi-do 17104, Korea;[email protected] (R.D.B.S); [email protected] (U.F); [email protected] (T.-S.K)
2 Weldon School of Biomedical Engineering, Purdue University, West Lafayette, IN 47907, USA;[email protected]
3 Department of Computer Science and Engineering, Kyung Hee University, Gyeonggi-do 17104, Korea4 Department of Industrial and System Engineering, Dongguk University, Seoul 04620, Korea5 The HIMS Inc., Gyeonggi-do 16702, Korea; [email protected]* Correspondence: [email protected]; Tel.: +82-2-2290-1733; Fax: +82-2-2290-1731
Academic Editors: Harry Timmermans, Astrid Kemperman and Pauline van den BergReceived: 20 September 2015; Accepted: 27 January 2016; Published: 4 February 2016
Abstract: As the prevalence of overweight and obesity has been increasing in South Korea, it is criticalto better understand possible associations between environmental surroundings and general healthstatus. We characterize key health test readings and basic demographic information from 10,816South Koreans, obtained from two Ubiquitous Healthcare (U-Healthcare) centers that have distinctsurrounding neighborhood characteristics. One is located in a rural area in Busan, the other is locatedin an urban area in Daegu surrounded by a highly crowded residential and commercial business area.We analyze comprehensive health data sets, including blood pressure, body mass index, pulse rate,and body fat percentage from December 2013 to December 2014 to study differences in overall healthtest measurements between users of rural and urban U-Healthcare centers. We conduct multipleregression analyses to evaluate differences in general health status between the two centers, adjustingfor confounding factors. We report statistical evidence of differences in blood pressure at the twolocations. As local residents are major users, the result indicates that the environmental surroundingsof the centers can influence the demographics of the users, the type of health tests in demand, andthe users’ health status. We further envision that U-Healthcare centers will provide public users withan opportunity for enhancing their current health, which could potentially be used to prevent themfrom developing chronic diseases, while providing surveillance healthcare data.
Keywords: self-healthcare; physical activity; U-Healthcare; neighborhood and health; environment;health promotion
1. Introduction
Chronic diseases, such as high blood pressure and obesity, are major causes of death worldwide.Rates of obesity (body mass index ě 25 kg/m2) have increased since 2005. It is estimated that suchchronic diseases affect more than 1.5 billion people over their lifetime [1]. The trend is similar in SouthKorea. In 2010, the Korean Center for Disease Control and Prevention (KCDC) presented the resultsof the Korea National Health and Nutrition Examination Survey (KNHANES), a nationwide surveyaiming to understand the health and nutrition of South Koreans [2]. The KCDC reported that SouthKorean men were more obese than women, particularly men between the ages of 30 and 39. However,they concluded that females in their 60s had a higher rate of obesity than men in the same age category.
Int. J. Environ. Res. Public Health 2016, 13, 183; doi:10.3390/ijerph13020183 www.mdpi.com/journal/ijerph
Int. J. Environ. Res. Public Health 2016, 13, 183 2 of 10
Further, they found that rates of hypertension were higher in males than in females until the age of 50,at which age females had a higher rate of hypertension [3].
In 2012, another study examined the results of KNHANES and assessed the prevalence ofmetabolic syndrome in South Koreans. This report noted that one of five risks of metabolic syndromewas hypertension, which appeared in about 36% of South Koreans. The study found that, in general,men were at higher risk for developing metabolic syndrome than women; however, women aged60 and above were prone to developing metabolic syndrome as well [4]. In 2013, researchers in TheKorean Heart Study (KHS) investigated cardiovascular diseases across eight regions of South Korea,including Daegu and Busan, and determined that males and elderly people were more prone tocardiovascular diseases. The same study found that approximately 33% of South Korean men and 25%of women were classified as overweight or obese, and demonstrated that men in their 70s were threetimes more likely to develop hypertension than those in their 30s [5].
Interestingly, such a high obesity rate in South Korea may be attributable to environmental factors.One study concluded that obesity among South Koreans increased by 11% between 1998 and 2007 andstate that this increase is due primarily to extensive workweeks of 60 h or more but may also be dueto genetics, sleep deprivation, and the surrounding environment [6]. The impact of the environmenton obesity is well known. For example, researchers in the U.S. analyzed the relationship betweenchronic diseases in adults (55 years or older) and these adults’ economic, social, and neighborhoodenvironments. They found that the latter environmental factors significantly affected whether or notthe adults were at risk of developing chronic diseases. Furthermore, the same study discovered thatwomen living in economically disadvantaged areas were at greater risk of developing heart disease,high blood pressure, and diabetes [7]. In 2008, another study in the U.S. examined how neighborhoodsaffect obesity in elderly individuals. Neighborhood’s characteristics were important in predictingobesity by observing that those living in economically advantaged areas were less likely to be obese.In contrast, those who lived in disadvantaged neighborhoods were at a higher risk for developingobesity [8]. Also, people who lived in disadvantaged neighborhoods were more likely to developcoronary heart disease compared to those who lived in neighborhoods that had sidewalks, bicyclelanes, and green spaces, among others. Other studies documented the link between residential areasand the inhabitants’ physical activity. These studies found that inhabitants of neighborhoods with noparks or recreational facilities exercised less and were at a higher risk for heart disease compared tothose living in residential areas with such facilities [9–12].
Over the past several years, to combat rising rates of obesity and other chronic diseases, healthcareprofessionals have shifted from making diagnoses and treating diseases to promoting healthy lifestylesand preventing maladies. To make this change, healthcare professionals utilize new services to helppatients take more responsibility and monitor their health. Such a service is referred to as UbiquitousHealthcare (U-Healthcare), “a new medical service paradigm which uses internet, mobile, among otherinformation communication technology (ICT) in the existing medical system” to provide “medicalhealth information, knowledge, service and products to consumers” [13].
In South Korea, the government has implemented different programs to motivate the populationto increase their physical activity. The government’s investment in information communicationstechnology has played a crucial role in providing people with access to health information that waspreviously unavailable to them [14]. In 2011, researchers in South Korea conducted a survey in twohospitals to evaluate awareness of U-Healthcare services among diabetic patients. More than 70% of thesurveyed participants indicated their interest in using U-Healthcare services or the Internet as a meansof obtaining materials that could provide them with individualized health information [15]. In anothersurvey, researchers found that only 25.4% of surveyed participants were aware of U-Healthcare services;however, after the surveyed participants used U-Healthcare services, 96.4% found the service helpfulfor managing their health [16]. Another study in South Korea analyzed patients with one or moreindicators of metabolic syndrome and had the patients use a U-Healthcare service. The researchersfound that the number of indicators decreased during six months of using the U-Healthcare service
Int. J. Environ. Res. Public Health 2016, 13, 183 3 of 10
leading the researchers to conclude that U-Healthcare services were effective in helping patients tomanage health conditions [17].
In this respect, we focus on comparative empirical analyses of user’s health test status from twoU-Healthcare centers located in Busan and Daegu, which have distinct surrounding neighborhoodcharacteristics. In this study, 10,816 users visited the U-Healthcare centers and underwent several easilymeasurable health tests over a course of one year. First, we demonstrate that both U-Healthcare centerscan provide a valuable data set to study differences in overall health test measurements betweenusers of Busan and Daegu U-Healthcare centers. Our analyses from the data set suggest that SouthKoreans are interested in using U-Healthcare services to evaluate their health. Second, we investigatedifferences in health conditions of users, in particular blood pressure between the two centers and tocompare them with relevant national health reports. Since the U-Healthcare centers were establishedfor local residents to use on a regular basis, this cross-sectional analysis of blood pressure in the twocenters may provide the idea on the influence of the environment characteristics over health outcomes.We expect this information will be highly valuable to the public and the government, because the SouthKorean government has allocated funds to local governments to build U-Healthcare centers which aredesigned to provide free health services to users, to promote wellness, and to prevent diseases.
2. Materials and Methods
From December 2013 to December 2014, health status data, consisting of body mass index (BMI),pulse rate (PR), body fat percentage (BF), and blood pressure (BP) were measured from 10,816 userswho visited the two U-Healthcare centers. Health test evaluations were performed using HIMS Healthdevices. All users agreed to provide demographic information, such as age and gender, in addition totaking the health test measurements.
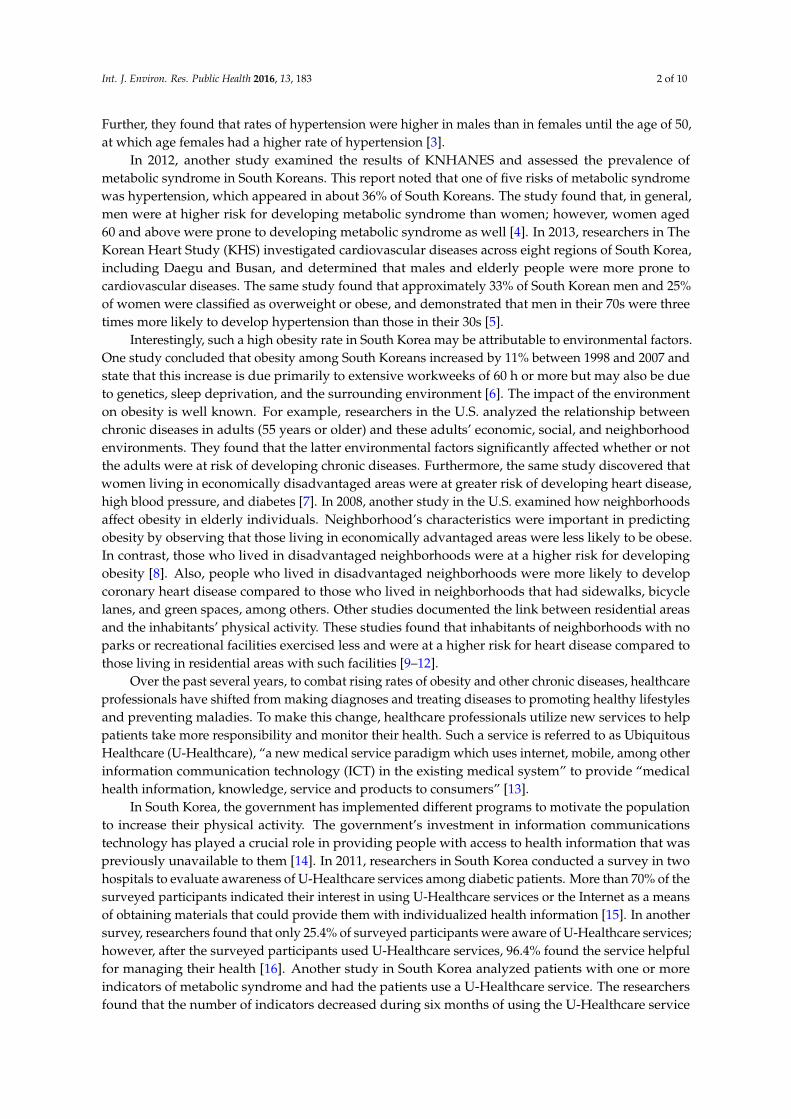
Figure 1 shows the locations of both U-Healthcare centers and their surrounding environmentcharacteristics. The U-Healthcare center in Busan collected data from 5450 users’ health information.This center was located in Seongjigok Park (4,980,530 m2) in Choeup-dong, Jin-gu, Busan city [18,19].Users needed to walk up a hill for approximately 1.2 km or about twenty minutes inside the parkto access the center. The other U-Healthcare center in Daegu collected data from 5366 users’ healthinformation. It was located in Hamji Park (46,910 m2) in Guam-dong, Buk-gu, Daegu city [20]. ThisU-Healthcare center, in contrast with the Busan U-Healthcare center, was within a few minutes walkingdistance from residential apartment buildings.
Figure 1. The locations of two U-Healthcare centers with photographs and their surroundingenvironment characteristics.
Int. J. Environ. Res. Public Health 2016, 13, 183 4 of 10
The U-Healthcare centers were equipped with four devices: (1) Kiosk; (2) Physical FitnessAssessment (Health Information and Management Systems [HIMS] Fitness); (3) Physical HealthAssessment (HIMS Health); and (4) Mental Health Assessment (HIMS Mental). Each device processedand electronically transmitted the user’s information to the central cloud database. At each center,the kiosks were responsible for user management and synchronizing all the data with the centralcloud database. Only users who chose to register with the center by using the kiosk received aradio frequency identification (RFID) card (Daegu) or barcode card (Busan) were able to access theirhealth history through the U-Healthcare center web portal. The second and third devices, the HIMSFitness and HIMS Health, were used to evaluate the user’s health condition. Together, these devicesassessed the individual’s physical wellness. HIMS Health evaluated the most frequently used readingssuch as BP, PR, body weight, BMI, and BF. In addition to these readings, HIMS Fitness conducted acardiorespiratory test and tests muscular strength, muscular endurance, and agility. The fourth device,HIMS Mental, allowed users to play digital Serious Games to evaluate the mental health of users. Allthese health readings were based on the American College of Sports Medicine (ACSM) [21].
To operate the devices, these two U-Healthcare centers employed Healthcare Managers (HCM)who were trained in healthcare fields such as Physical Education, Nursing, etc. The HCM instructedusers in the appropriate use of equipment, provided education, and interpreted user’s test results.Consent from users was given verbally to the HCM.
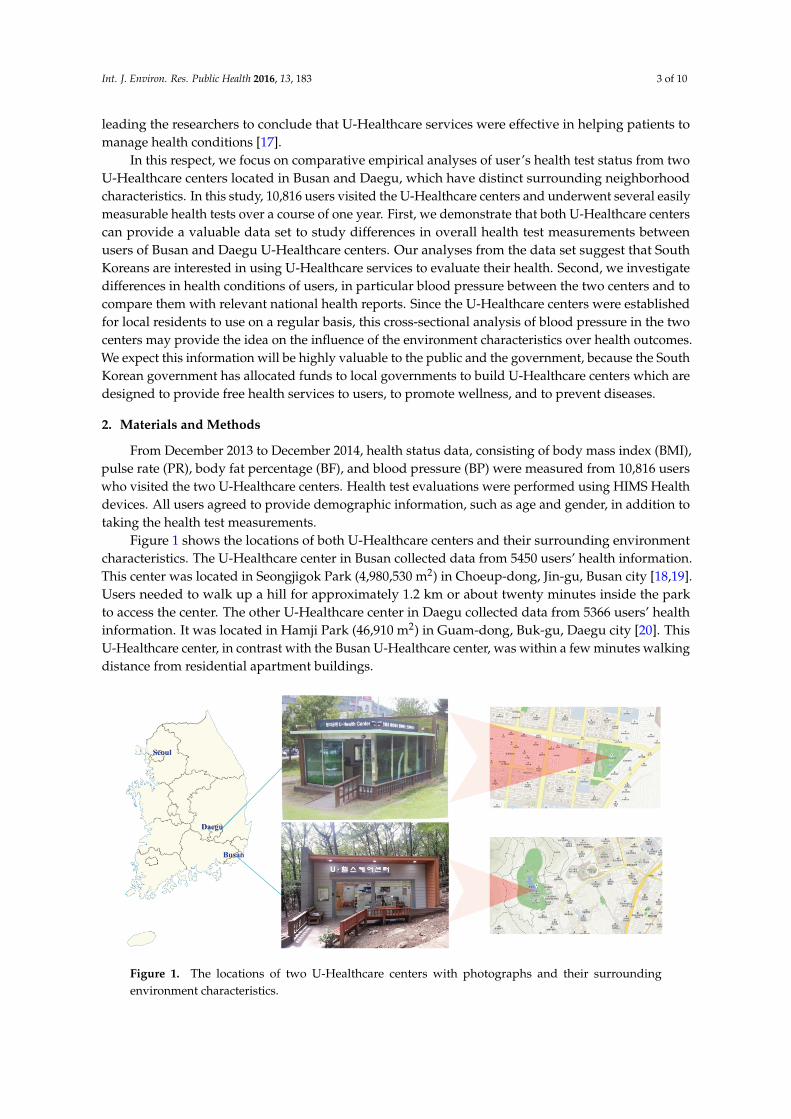
When a user visited the center, the user could choose which tests to perform as shown in Figure 2.New users could register their age, gender, and password at the kiosk and received a card. If userschose not to register their information, they could still perform a test, but they must have input theirage and gender at each device every time they performed a test. After the test was completed, theHCM discussed, interpreted, and educated users on how to improve their health based on their results.
Int. J. Environ. Res. Public Health 2016, 13, 183 4 of 10
The U‐Healthcare centers were equipped with four devices: (1) Kiosk; (2) Physical Fitness
Assessment (Health Information and Management Systems [HIMS] Fitness); (3) Physical Health
Assessment (HIMS Health); and (4) Mental Health Assessment (HIMS Mental). Each device
processed and electronically transmitted the user’s information to the central cloud database. At
each center, the kiosks were responsible for user management and synchronizing all the data with
the central cloud database. Only users who chose to register with the center by using the kiosk
received a radio frequency identification (RFID) card (Daegu) or barcode card (Busan) were able to
access their health history through the U‐Healthcare center web portal. The second and third
devices, the HIMS Fitness and HIMS Health, were used to evaluate the user’s health condition.
Together, these devices assessed the individual’s physical wellness. HIMS Health evaluated the
most frequently used readings such as BP, PR, body weight, BMI, and BF. In addition to these
readings, HIMS Fitness conducted a cardiorespiratory test and tests muscular strength, muscular
endurance, and agility. The fourth device, HIMS Mental, allowed users to play digital Serious
Games to evaluate the mental health of users. All these health readings were based on the American
College of Sports Medicine (ACSM) [21].
To operate the devices, these two U‐Healthcare centers employed Healthcare Managers (HCM)
who were trained in healthcare fields such as Physical Education, Nursing, etc. The HCM instructed
users in the appropriate use of equipment, provided education, and interpreted user’s test results.
Consent from users was given verbally to the HCM.
When a user visited the center, the user could choose which tests to perform as shown in Figure
2. New users could register their age, gender, and password at the kiosk and received a card. If users
chose not to register their information, they could still perform a test, but they must have input their
age and gender at each device every time they performed a test. After the test was completed, the
HCM discussed, interpreted, and educated users on how to improve their health based on their
results.
Figure 2. Typical flow of user accessibility to a U‐Healthcare center. RFID: radio frequency
identification.
Both U‐Health centers were equipped to evaluate many health measurements. BP readings
followed the reference categorization from the National Heart, Lung, and Blood Institute [22]. BMI
readings followed the reference categorization from the American College of Sports Medicine [21].
BF readings followed the reference categorization from the American Council on Exercise [23]. PR
readings were followed the reference categorization from the American Heart Association [24].
Figure 2. Typical flow of user accessibility to a U-Healthcare center. RFID: radio frequency identification.
Both U-Health centers were equipped to evaluate many health measurements. BP readingsfollowed the reference categorization from the National Heart, Lung, and Blood Institute [22]. BMIreadings followed the reference categorization from the American College of Sports Medicine [21].BF readings followed the reference categorization from the American Council on Exercise [23]. PRreadings were followed the reference categorization from the American Heart Association [24].
Multiple linear regression analyses were used to evaluate blood pressure as a general healthindictor in the two different centers, adjusting for potential confounding factors, because the difference
Int. J. Environ. Res. Public Health 2016, 13, 183 5 of 10
in blood pressure in the two centers can be distorted by other multiple variables of health tests, suchas BMI, PR, BF, age, and gender. After constructing regression models, the key assumptions forlinear regression, such as normality and homoscedasticity (i.e., equal variances), were validated. Inparticular, residual analyses were conducted to validate the key assumptions. Multicollinearity wasalso assessed by using variance inflation factors. It should be noted that repeated measures from thesame participants would be rare and unlikely to be included because the two U-Healthcare centershave recently opened. Statistical analyses were carried out using Stata (version 14, Stata Corp., CollegeStation, TX, USA) and SPSS (version 15.0, SSPS Inc., Pompano Beach, FL, USA)).
3. Results
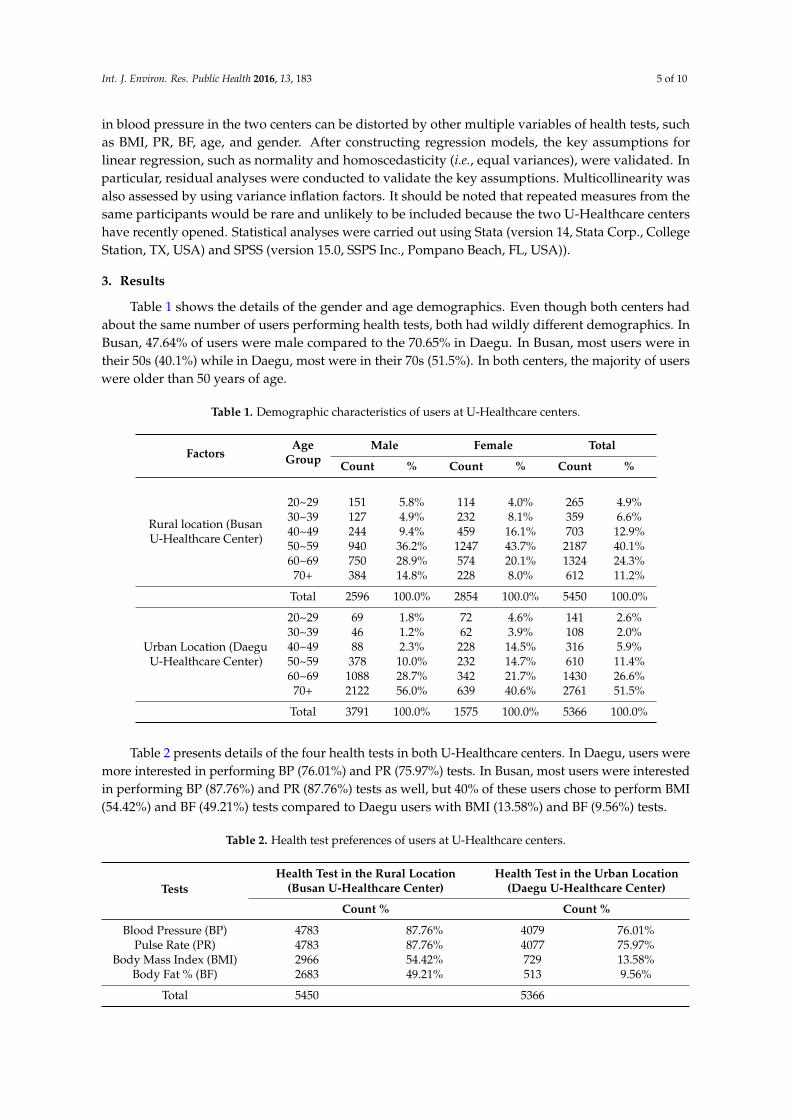
Table 1 shows the details of the gender and age demographics. Even though both centers hadabout the same number of users performing health tests, both had wildly different demographics. InBusan, 47.64% of users were male compared to the 70.65% in Daegu. In Busan, most users were intheir 50s (40.1%) while in Daegu, most were in their 70s (51.5%). In both centers, the majority of userswere older than 50 years of age.
Table 1. Demographic characteristics of users at U-Healthcare centers.
FactorsAge
GroupMale Female Total
Count % Count % Count %
Rural location (BusanU-Healthcare Center)
20~29 151 5.8% 114 4.0% 265 4.9%30~39 127 4.9% 232 8.1% 359 6.6%40~49 244 9.4% 459 16.1% 703 12.9%50~59 940 36.2% 1247 43.7% 2187 40.1%60~69 750 28.9% 574 20.1% 1324 24.3%
70+ 384 14.8% 228 8.0% 612 11.2%
Total 2596 100.0% 2854 100.0% 5450 100.0%
Urban Location (DaeguU-Healthcare Center)
20~29 69 1.8% 72 4.6% 141 2.6%30~39 46 1.2% 62 3.9% 108 2.0%40~49 88 2.3% 228 14.5% 316 5.9%50~59 378 10.0% 232 14.7% 610 11.4%60~69 1088 28.7% 342 21.7% 1430 26.6%
70+ 2122 56.0% 639 40.6% 2761 51.5%
Total 3791 100.0% 1575 100.0% 5366 100.0%
Table 2 presents details of the four health tests in both U-Healthcare centers. In Daegu, users weremore interested in performing BP (76.01%) and PR (75.97%) tests. In Busan, most users were interestedin performing BP (87.76%) and PR (87.76%) tests as well, but 40% of these users chose to perform BMI(54.42%) and BF (49.21%) tests compared to Daegu users with BMI (13.58%) and BF (9.56%) tests.
Table 2. Health test preferences of users at U-Healthcare centers.
TestsHealth Test in the Rural Location
(Busan U-Healthcare Center)Health Test in the Urban Location
(Daegu U-Healthcare Center)
Count % Count %
Blood Pressure (BP) 4783 87.76% 4079 76.01%Pulse Rate (PR) 4783 87.76% 4077 75.97%
Body Mass Index (BMI) 2966 54.42% 729 13.58%Body Fat % (BF) 2683 49.21% 513 9.56%
Total 5450 5366
Int. J. Environ. Res. Public Health 2016, 13, 183 6 of 10
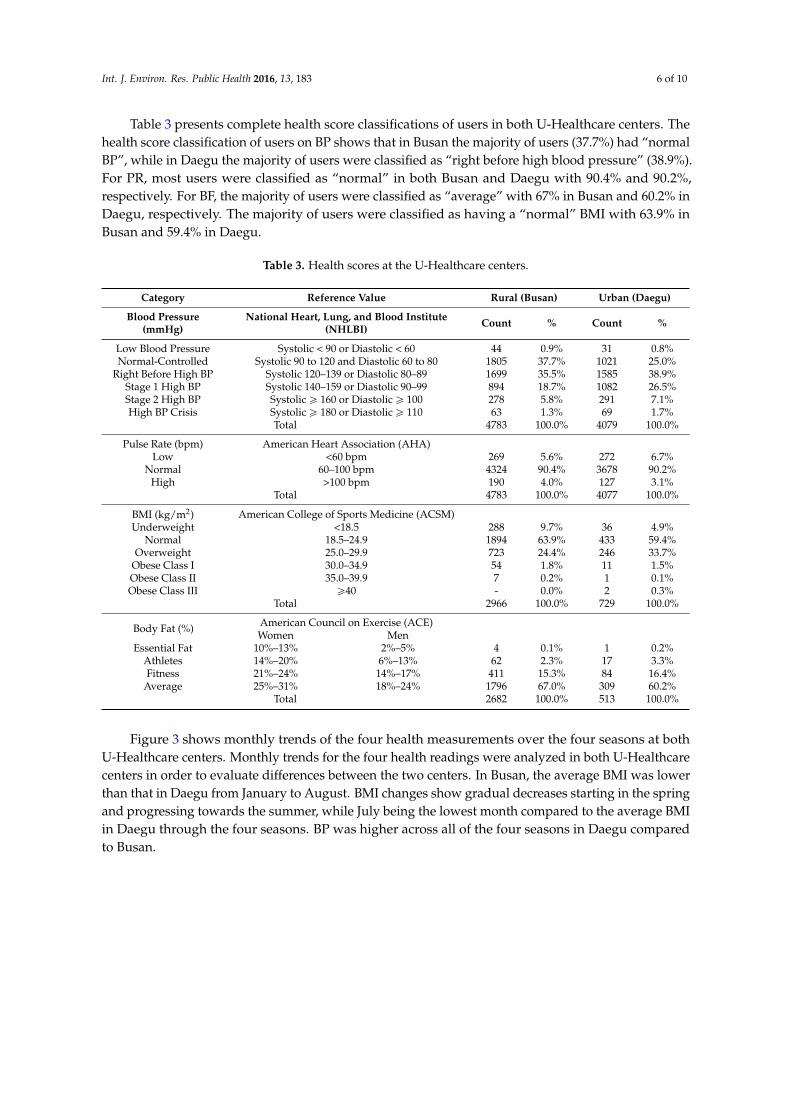
Table 3 presents complete health score classifications of users in both U-Healthcare centers. Thehealth score classification of users on BP shows that in Busan the majority of users (37.7%) had “normalBP”, while in Daegu the majority of users were classified as “right before high blood pressure” (38.9%).For PR, most users were classified as “normal” in both Busan and Daegu with 90.4% and 90.2%,respectively. For BF, the majority of users were classified as “average” with 67% in Busan and 60.2% inDaegu, respectively. The majority of users were classified as having a “normal” BMI with 63.9% inBusan and 59.4% in Daegu.
Table 3. Health scores at the U-Healthcare centers.
Category Reference Value Rural (Busan) Urban (Daegu)
Blood Pressure(mmHg)
National Heart, Lung, and Blood Institute(NHLBI) Count % Count %
Low Blood Pressure Systolic < 90 or Diastolic < 60 44 0.9% 31 0.8%Normal-Controlled Systolic 90 to 120 and Diastolic 60 to 80 1805 37.7% 1021 25.0%
Right Before High BP Systolic 120–139 or Diastolic 80–89 1699 35.5% 1585 38.9%Stage 1 High BP Systolic 140–159 or Diastolic 90–99 894 18.7% 1082 26.5%Stage 2 High BP Systolic ě 160 or Diastolic ě 100 278 5.8% 291 7.1%High BP Crisis Systolic ě 180 or Diastolic ě 110 63 1.3% 69 1.7%
Total 4783 100.0% 4079 100.0%
Pulse Rate (bpm) American Heart Association (AHA)Low <60 bpm 269 5.6% 272 6.7%
Normal 60–100 bpm 4324 90.4% 3678 90.2%High >100 bpm 190 4.0% 127 3.1%
Total 4783 100.0% 4077 100.0%
BMI (kg/m2) American College of Sports Medicine (ACSM)Underweight <18.5 288 9.7% 36 4.9%
Normal 18.5–24.9 1894 63.9% 433 59.4%Overweight 25.0–29.9 723 24.4% 246 33.7%
Obese Class I 30.0–34.9 54 1.8% 11 1.5%Obese Class II 35.0–39.9 7 0.2% 1 0.1%Obese Class III ě40 - 0.0% 2 0.3%
Total 2966 100.0% 729 100.0%
Body Fat (%) American Council on Exercise (ACE)Women Men
Essential Fat 10%–13% 2%–5% 4 0.1% 1 0.2%Athletes 14%–20% 6%–13% 62 2.3% 17 3.3%Fitness 21%–24% 14%–17% 411 15.3% 84 16.4%
Average 25%–31% 18%–24% 1796 67.0% 309 60.2%Total 2682 100.0% 513 100.0%
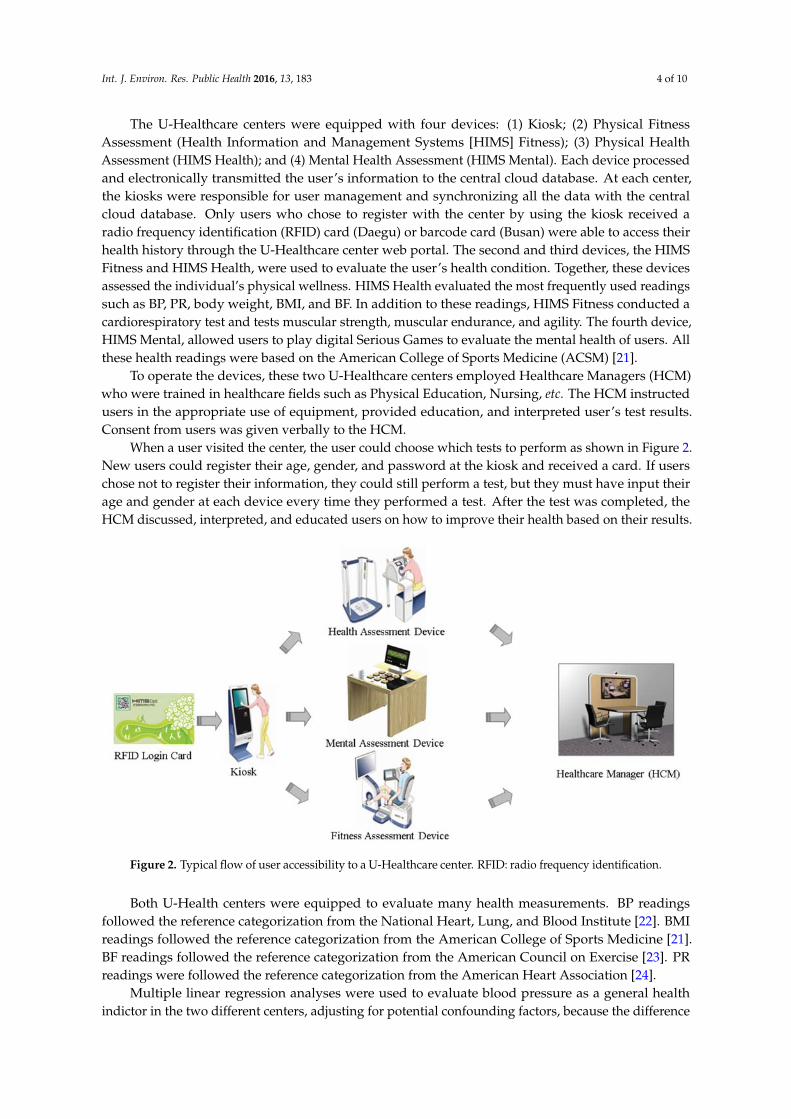
Figure 3 shows monthly trends of the four health measurements over the four seasons at bothU-Healthcare centers. Monthly trends for the four health readings were analyzed in both U-Healthcarecenters in order to evaluate differences between the two centers. In Busan, the average BMI was lowerthan that in Daegu from January to August. BMI changes show gradual decreases starting in the springand progressing towards the summer, while July being the lowest month compared to the average BMIin Daegu through the four seasons. BP was higher across all of the four seasons in Daegu comparedto Busan.

Int. J. Environ. Res. Public Health 2016, 13, 183 7 of 10Int. J. Environ. Res. Public Health 2016, 13, 183 7 of 10
Figure 3. Monthly trends of health test readings.
Table 4 shows the result of multiple regression with coefficients and p‐values. Multiple
regression analyses were conducted to evaluate differences in BP between users of Busan and Daegu
U‐Healthcare centers, adjusting for confounding variables. The centers were coded as a binary
variable (Busan center = 0 and Daegu center = 1). BP was compared in the two centers, age, gender,
PR, BMI, and BFP were controlled. After adjusting for the confounding factors, BP was statistically
significant difference between the two centers, which had unique environmental characteristics.
Indeed, the Busan U‐Healthcare center located in the rural area with the park was associated with
healthier test readings than the Daegu U‐Healthcare center surrounded by the highly‐populated
residential area with apartment buildings.
Table 4. Multiple regression analysis of blood pressure between two centers, controlling other
variables.
Factors Blood Pressure (BP)
Coef. p‐Value
Center 4.29 0.000
Age 0.18 0.000
PR 0.11 0.000
BMI 1.22 0.001
BF −0.18 0.473
Gender −1.29 0.591
4. Discussion
Although it would be impossible to rule out potential participant bias in the two different
centers, this study provides valuable information on the association of surrounding characteristics
with overall health and wellbeing. The Busan U‐Healthcare center is located on a hill in a forested
park. This means that users must have walked approximately 1200 meters inside the park to access
Figure 3. Monthly trends of health test readings.
Table 4 shows the result of multiple regression with coefficients and p-values. Multiple regressionanalyses were conducted to evaluate differences in BP between users of Busan and Daegu U-Healthcarecenters, adjusting for confounding variables. The centers were coded as a binary variable (Busancenter = 0 and Daegu center = 1). BP was compared in the two centers, age, gender, PR, BMI, andBFP were controlled. After adjusting for the confounding factors, BP was statistically significantdifference between the two centers, which had unique environmental characteristics. Indeed, theBusan U-Healthcare center located in the rural area with the park was associated with healthier testreadings than the Daegu U-Healthcare center surrounded by the highly-populated residential areawith apartment buildings.
Table 4. Multiple regression analysis of blood pressure between two centers, controlling other variables.
FactorsBlood Pressure (BP)
Coef. p-Value
Center 4.29 0.000Age 0.18 0.000PR 0.11 0.000
BMI 1.22 0.001BF ´0.18 0.473
Gender ´1.29 0.591
4. Discussion
Although it would be impossible to rule out potential participant bias in the two different centers,this study provides valuable information on the association of surrounding characteristics with overallhealth and wellbeing. The Busan U-Healthcare center is located on a hill in a forested park. This

Int. J. Environ. Res. Public Health 2016, 13, 183 8 of 10
means that users must have walked approximately 1200 meters inside the park to access the center andmany of these users pass by the center on their way to a more rugged hiking trail. These types of parkvisitors exhibit a more active lifestyle, as evidenced by their test results. For example, the majority ofthe users were in their 50s and 60s, with very few users over the age of 70. Regarding BP of the Busanusers, the majority was categorized as “normal-controlled” (37.7%) and “right before high BP” (35.5%),showing that few users were at risk for developing high BP. Only 26.2% of users were classified as“overweight” or “obese” and more than 60% of users had a normal BMI, meaning that the majority ofusers were not at risk for developing chronic diseases.
In contrast to the Busan center, the Daegu U-Healthcare center was located near residentialbuildings and commercial business areas. The users walked a short distance to the center on a flatterterrain. It took longer for users to reach the Busan center. Perhaps the demographics of the center’susers were influenced by those living and/or working around the center. Because of the location ofthis center, the users of Daegu may or may not be seeking an active lifestyle as evidenced by the user’shealth test, a major contrast to the results of the Busan center. The health tests of Daegu center showthat almost 78% of users were 60 years or older and were more interested in testing their BP and PRcompared to Busan, where users wished to evaluate their BMI, BP, PR, and BF. In Daegu, the resultsshow that the user’s BP was classified as “normal-controlled” (25%), “right before high BP” (38.9%),and “stage 1 high BP” (26.5%). Thus, 65.4% of users struggled with either developing or sufferingfrom high BP. The preference of the BP test by Daegu’s older users can be attributed to the high rate ofhypertension among South Koreans above the age of 70, as reported by the KHS [6].
While the results show that users in Daegu were older and had a tendency toward higher BPthan users in Busan, the results reveal that the age of users and their environmental surroundings mayplay a more crucial role in determining the results of user’s health tests. In Daegu, the majority ofusers were males, and the data shows that these users suffered from problems with BP. In contrast, inBusan, the ratio of males to females was similar and their BP was relatively normal. This differencebetween the centers is not attributed to the gender discrepancy between the two centers and is morelikely to attribute to the age of users, the accessibility and environmental surrounding of the center,and, perhaps, the physical activeness of users.
While other studies have proven that South Koreans are interested in using U-Healthcare serviceslocated in hospitals [16], this study indicates that they are also interested in using similar servicesavailable in recreational areas. Unlike other studies that analyzed less than 500 people [18], this studyexamines the data of 10,816 South Koreans who performed health tests at U-Healthcare centers. Asshown in the analysis of 10,816 user’s health tests, both U-Healthcare centers would be of interestto the general population. Thus, it is expected that both U-Healthcare centers can serve as an easilyaccessible resource for free health check-ups supported by local South Korean governments. Amongthose who visited the centers, the majority of users were 50 years old and above. Interestingly, theseasons did not play a large role in determining when these users visited the facilities.
Future implementations of devices and services for targeting specific health conditions will bebeneficial. In Busan, an additional service for users can include an exercise band that collects data asusers walk to the top of the park’s hill. When the user returns to the center, the user’s data can beevaluated in order to provide the user with their current fitness level and help them to target theirfuture fitness goals. For the center in Daegu, further research is needed to determine other devices andservices that can be offered for users 70 years and older.
In addition, the results show that the users in Busan had less prevalence of hypertension thanthe users in Daegu. According to the study presented by KNHANES in 2012, the prevalence ofhypertension was in about 36% of the populations. The results presented in this study show that theusers in Busan had 9.6% less prevalence of hypertension than the results reported by KNHANES,while the users in Daegu had almost similar prevalence of hypertension with only 0.4% less than theresults reported by KNHANES.
Int. J. Environ. Res. Public Health 2016, 13, 183 9 of 10
5. Conclusions
First, the study shows that South Koreans would be interested in using U-Healthcare servicesavailable in their neighborhoods. Both U-Healthcare centers in Busan and Daegu were also successfulin educating South Koreans about U-Healthcare services. Using the health tests and the basicdemographic information, both U-Healthcare centers provided a valuable dataset to study differencesin health test measurements between users of rural and urban U-Healthcare centers, which haveunique surrounding characteristics. Second, adjusting for confounding variables in multiple regressionanalyses, the key health variables (i.e., BP) are shown to be different at the two centers. In particular,the users of the Busan U-Healthcare center in the rural area had healthier test readings than those of theDaegu U-Healthcare center, which was surrounded by apartment buildings and commercial businessareas. Overall, future development of these centers will play a vital role in helping users to maintaintheir health and to prevent them from developing chronic diseases, while providing surveillancehealthcare data.
Acknowledgments: This research was supported by Basic Science Research Program through the NationalResearch Foundation of Korea (NRF) funded by the Ministry of Science, ICT & Future Planning(2015R1C1A2A01053157).
Author Contributions: Ramiro Bravo and Sekyoung Youm designed the study and analyzed the data.Ramiro Bravo interpreted the results and drafted the manuscript with input from Umar Farroq underthe supervision of Tae-Seong Kim. Young Kim conducted statistical analyses and revised the manuscript.Seung-Hun Park who provided comments and revised the manuscript.
Conflicts of Interest: The authors declare no conflict of interest.
References
1. World Health Organization. Preventing Chronic Diseases: A Vital Investment. Available online:http://www.who.int/chp/chronic_disease_report/en (accessed on 20 September 2015).
2. Kweon, S.; Kim, Y.; Jang, M.J.; Kim, Y.; Kim, K.; Choi, S.; Chun, C.; Khang, Y.H.; Oh, K. Data resource profile:The korea national health and nutrition examination survey (knhanes). Int. J. Epidemiol. 2014, 43, 69–77.[CrossRef] [PubMed]
3. Kim, Y.A.; Kwon, S.H. Hypertension and Diabetes Can Be Prevented by Maintaining Proper Weight. 2010.Available online: http://download.mw.go.kr/front_new/modules/download.jsp?BOARD_ID=1365&CONT_SEQ=260481&FILE_SEQ=77521&FILE_NAME=%5BENG%5D%202010%20National%20Health%20and%20Nutrition%20Survey%20result%20announced.docx (accessed on 11 March 2015).
4. Im, M.; Seomun, G. Gender disparity in the prevalence of metabolic syndrome in korea: Results from thekorea national health and nutrition examination survey, 2012. J. Diabetes Metab. 2015, 6, 2.
5. Jee, S.H.; Batty, G.D.; Jang, Y.; Oh, D.J.; Oh, B.-H.; Lee, S.H.; Park, S.-W.; Seung, K.-B.; Kimm, H.; Kim, S.Y.The Korean heart study: Rationale, objectives, protocol, and preliminary results for a new prospective cohortstudy of 430,920 men and women. Eur. J. Prev. Cardiol. 2013. [CrossRef] [PubMed]
6. Jang, T.-W.; Kim, H.-R.; Lee, H.-E.; Myong, J.-P.; Koo, J.-W. Long work hours and obesity in korean adultworkers. J. Occup. Health 2013, 55, 359–366. [CrossRef] [PubMed]
7. Freedman, V.A.; Grafova, I.B.; Rogowski, J. Neighborhoods and chronic disease onset in later life. Am. J.Public Health 2011, 101, 79–86. [CrossRef] [PubMed]
8. Grafova, I.B.; Freedman, V.A.; Kumar, R.; Rogowski, J. Neighborhoods and obesity in later life. Am. J. PublicHealth 2008, 98, 2065–2071. [CrossRef] [PubMed]
9. Roux, A.V.D. Residential environments and cardiovascular risk. J. Urban. Health 2003, 80, 569–589. [CrossRef][PubMed]
10. Kaczynski, A.T.; Besenyi, G.M.; Stanis, S.A.W.; Koohsari, M.J.; Oestman, K.B.; Bergstrom, R.; Potwarka, L.R.;Reis, R.S. Are park proximity and park features related to park use and park-based physical activity amongadults? Variations by multiple socio-demographic characteristics. Int. J. Behav. Nutr. Phys. Act. 2014, 11,146–144. [PubMed]
11. Yen, I.H.; Kaplan, G.A. Poverty area residence and changes in physical activity level: Evidence from thealameda county study. Am. J. Public Health 1998, 88, 1709–1712. [CrossRef] [PubMed]
Int. J. Environ. Res. Public Health 2016, 13, 183 10 of 10
12. Roux, A.V.D.; Merkin, S.S.; Arnett, D.; Chambless, L.; Massing, M.; Nieto, F.J.; Sorlie, P.; Szklo, M.;Tyroler, H.A.; Watson, R.L. Neighborhood of residence and incidence of coronary heart disease. N. Engl. J.Med. 2001, 345, 99–106. [CrossRef] [PubMed]
13. Toyib, W.; Lee, E.-S.; Park, M.-G. An integrative method on the remote monitoring of walking activity usingubiquitous healthcare system. Int. J. Electr. Eng. Inform. 2011, 3, 453–463. [CrossRef]
14. Shin, D.-H. Ubiquitous city: Urban technologies, urban infrastructure and urban informatics. J. Inf. Sci. 2009,35, 515–526. [CrossRef]
15. Lim, S.; Kim, S.-Y.; Kim, J.I.; Kwon, M.K.; Min, S.J.; Yoo, S.Y.; Kang, S.M.; Kim, H.I.; Jung, H.S.; Park, K.S. Asurvey on ubiquitous healthcare service demand among diabetic patients. Diabetes Metab. J. 2011, 35, 50–57.[CrossRef] [PubMed]
16. Youm, S.; Park, S.-H. How the awareness of u-healthcare service and health conditions affect healthy lifestyle:An empirical analysis based on a U-Healthcare service experience. Telemed. E-Health 2015, 21, 286–295.[CrossRef] [PubMed]
17. Song, T.-M.; Ryu, S.; Lee, S.H. U-health service for managing chronic disease: A case study on managingmetabolic syndrome in a health center in south korea. Healthc. Inform. Res. 2011, 17, 260–266. [CrossRef][PubMed]
18. Busan City. Busan U-Healthcare Center Web Portal. Available online: http://u-Healthcare.busan.go.kr(accessed on 20 May 2015).
19. Busan City. Busan Children’s Grand Park. Available online: http://bschildpark.bisco.or.kr/about/about01/about01_02 (accessed on 20 May 2015).
20. Daegu City. Daegu U-Healthcare Center Web Portal. Available online: http://u-health.buk.daegu.kr(accessed on 20 May 2015).
21. Thompson, W.R.; Gordon, N.F.; Pescatello, L.S. Acsm’s Guidelines for Exercise Testing and Prescription; LippincottWilliams & Wilkins: Philadelphia, PA, USA, 2010.
22. The National Heart, Lung, and Blood Institute (NHLBI). Classification of Blood Pressure for Adults. Availableonline: http://www.nhlbi.nih.gov (accessed on 20 May 2015).
23. American Council on Exercise ACE Fitness. General Body-fat Percentage Categories. Available online:http://www.acefitness.org (accessed on 20 May 2015).
24. American heart association. Heart Rate (pulse) Categories. Available online: http://www.heart.org (accessedon 20 May 2015).
© 2016 by the authors; licensee MDPI, Basel, Switzerland. This article is an open accessarticle distributed under the terms and conditions of the Creative Commons by Attribution(CC-BY) license (http://creativecommons.org/licenses/by/4.0/).