essays on the empirical analysis of u.s. home video game market
TRANSCRIPT

SSStttooonnnyyy BBBrrrooooookkk UUUnnniiivvveeerrrsssiiitttyyy
The official electronic file of this thesis or dissertation is maintained by the University Libraries on behalf of The Graduate School at Stony Brook University.
©©© AAAllllll RRRiiiggghhhtttsss RRReeessseeerrrvvveeeddd bbbyyy AAAuuuttthhhooorrr...

Essays on the Empirical Analysis of
U.S. Home Video Game Market
A Dissertation Presented
by
Qi Sun
to
The Graduate School
in Partial Fulfillment of the Requirements
for the Degree of
Doctor of Philosophy
in
Economics
Stony Brook University
August 2010

Stony Brook University
The Graduate School
Qi Sun
We, the dissertation committee for the above candidate for the Doctor ofPhilosophy degree, hereby recommend acceptance of this dissertation.
Wei Tan – Dissertation AdvisorAssistant Professor, Department of Economics
Hugo Benıtez-Silva – Chairperson of DefenseAssociate Professor, Department of Economics
Sandro BruscoAssociate Professor, Department of Economics
Guofu TanProfessor of Economics
University of Southern California
This dissertation is accepted by the Graduate School.
Lawrence MartinDean of the Graduate School
ii

Abstract of the Dissertation
Essays on the Empirical Analysis of U.S.Home Video Game Market
by
Qi Sun
Doctor of Philosophy
in
Economics
Stony Brook University
2010
This dissertation focuses on the empirical analysis of U.S. home
video game market and contains three essays.
The first essay investigates one aspect of competition among the
console manufacturers. SONY launched its latest PlayStation 3
game console in 2006 and integrated Blue-ray DVD playback func-
tion in it. This feature is believed to contribute to PlayStation 3’s
high price and weak sales performance. At the same time, differ-
entiations in hardware attributes among the latest-generation con-
soles also contribute to consoles’ different prices and therefore their
different sales performances. In this essay, I present a structural
model to quantify the effect of Blue-ray DVD as well as the effect
of product differentiation on console manufacturers’ profitability.
The estimation and simulation results show that (1) consumers
iii

are willing to pay an extra premium to SONY’s Blue-ray DVD
function, but they are also sensitive to console prices; (2) Blue-ray
DVD function adds significant costs to PlayStation 3; (3) in terms
of profitability to SONY, the value of Blue-ray DVD is mostly off-
set by its added costs; (4) PlayStation 3’s weak sales performance
is partially caused by the competition from the same-generation,
less-advanced but low-priced competitors.
The second essay studies the complementary good side in the U.S.
video game market. The central question it studies is that whether
exclusive game titles have higher sales than non-exclusive game ti-
tles. This question is important for us to better understand the in-
centives for both platform (game consoles) and complements (video
games) to adopt strategies about exclusion, multi-homing, and ver-
tical integration. I use a unique and rich dataset to compare the
sales number of exclusive and non-exclusive video game titles sold
in U.S. between Nov. 2006 to Dec. 2008. I also adopt various
approaches to deal with possible selection biases in the estimation
caused by unobservable product characteristics and potential game
developer selections into platforms. The estimation results show
that exclusive titles do have higher sales per platform after con-
trolling various observed and unobserved game attributes. And
further analysis show that such premium on exclusivity has differ-
ent implications in terms of platform location choice for top-selling
and average-selling game titles, respectively. This is mainly due to
the presence of “porting” costs for non-exclusive titles.
In the third essay, using the data set of home video game con-
sole sales in U.S. between 2005 and 2008, we estimate the demand
for game consoles using a regression discontinuity design (RDD)
method. Our method exploits a unique feature of the price changes
in the industry during our sample period, i.e. prices are cut period-
ically but remain generally unchanged between the two consecutive
cuts. This discontinuity in the price changes allows us to obtain
iv

a reliable estimate of the effect of the prices on consumers console
demand semiparametrically and without using instrumental vari-
ables. We find that consumers demand for video consoles is elastic,
and the elasticities are between -1.11 and -5.40. In addition, we
compare our results to other’s using the standard IV approach,
and find that our estimated elasticities are similar to the existing
works.
v

To my wife and my parents.

Contents
List of Figures ix
List of Tables x
Acknowledgements xii
1 Product Differentiation and Competition 1
1.1 Introduction . . . . . . . . . . . . . . . . . . . . . . . . . . . . 1
1.2 Related Literature . . . . . . . . . . . . . . . . . . . . . . . . 4
1.3 The Home Video Game Console Industry . . . . . . . . . . . . 6
1.4 The Model . . . . . . . . . . . . . . . . . . . . . . . . . . . . . 9
1.4.1 Demand for Consoles . . . . . . . . . . . . . . . . . . . 9
1.4.2 Game Provision . . . . . . . . . . . . . . . . . . . . . . 11
1.4.3 Supply of Consoles . . . . . . . . . . . . . . . . . . . . 11
1.5 Data . . . . . . . . . . . . . . . . . . . . . . . . . . . . . . . . 15
1.6 Identification and Estimation . . . . . . . . . . . . . . . . . . 16
1.6.1 Identification . . . . . . . . . . . . . . . . . . . . . . . 16
1.6.2 Estimation . . . . . . . . . . . . . . . . . . . . . . . . . 18
1.6.3 Estimation Results . . . . . . . . . . . . . . . . . . . . 20
1.7 Counterfactual Analysis . . . . . . . . . . . . . . . . . . . . . 25
1.7.1 Value of Blue-ray DVD . . . . . . . . . . . . . . . . . . 25
1.7.2 Effects of Product Differentiation . . . . . . . . . . . . 27
1.8 Conclusion . . . . . . . . . . . . . . . . . . . . . . . . . . . . . 29
vii

2 Exclusive Title and Platform Sales 31
2.1 Introduction . . . . . . . . . . . . . . . . . . . . . . . . . . . . 31
2.2 Related Literature . . . . . . . . . . . . . . . . . . . . . . . . 34
2.3 Home Video Game Market . . . . . . . . . . . . . . . . . . . . 34
2.4 Data . . . . . . . . . . . . . . . . . . . . . . . . . . . . . . . . 35
2.5 Results . . . . . . . . . . . . . . . . . . . . . . . . . . . . . . . 37
2.5.1 Sales of Exclusive and Non-exclusive Titles . . . . . . . 37
2.5.2 Selection . . . . . . . . . . . . . . . . . . . . . . . . . . 39
2.5.3 Selection of Game Publishers . . . . . . . . . . . . . . 41
2.6 Discussion of the Results . . . . . . . . . . . . . . . . . . . . . 44
3 RDD Method in Estimation Demand 46
3.1 Introduction . . . . . . . . . . . . . . . . . . . . . . . . . . . . 46
3.2 The Market Background and Data . . . . . . . . . . . . . . . 49
3.3 Model and Estimation . . . . . . . . . . . . . . . . . . . . . . 52
3.3.1 Model of Demand for Video Game Consoles . . . . . . 52
3.3.2 IV Estimation . . . . . . . . . . . . . . . . . . . . . . . 54
3.3.3 Regression Discontinuity Design Method . . . . . . . . 55
3.4 Estimation Result . . . . . . . . . . . . . . . . . . . . . . . . . 58
3.5 Conclusion . . . . . . . . . . . . . . . . . . . . . . . . . . . . . 62
Bibliography 66
viii

List of Figures
1.1 Desktop Market . . . . . . . . . . . . . . . . . . . . . . . . . . 8
3.1 Market Share and Price Trend . . . . . . . . . . . . . . . . . . 56
ix

List of Tables
1.1 Major Desktop Console Characteristics . . . . . . . . . . . . . 7
1.2 Descriptive Statistics of the Sample . . . . . . . . . . . . . . . 16
1.3 Parameters in Mean Utility Function . . . . . . . . . . . . . . 21
1.4 Parameters for Random Coefficients . . . . . . . . . . . . . . . 22
1.5 Parameters for Software Provision Equation . . . . . . . . . . 23
1.6 Parameters for Marginal Cost Function . . . . . . . . . . . . . 23
1.7 Average Own- and Cross-Price Elasticities of Desktop Consoles 24
1.8 Changes in Prices and Sales of Desktop Consoles (Since 2006.11) 26
1.9 Changes in Variable Profits of Console Manufacturers (Since
2006.11) . . . . . . . . . . . . . . . . . . . . . . . . . . . . . . 26
1.10 Changes in Prices and Sales of Desktop Consoles without PS2
(Since 2006.11) . . . . . . . . . . . . . . . . . . . . . . . . . . 27
1.11 Changes in Variable Profits of Console Manufacturers without
PS2(Since 2006.11) . . . . . . . . . . . . . . . . . . . . . . . . 28
2.1 Descriptive Statistics . . . . . . . . . . . . . . . . . . . . . . . 36
2.2 Sample Properties Comparison . . . . . . . . . . . . . . . . . 37
2.3 Effects of Exclusivity on Sales . . . . . . . . . . . . . . . . . . 38
2.4 Effects of Exclusivity on Sales: Unobserved Characteristics . . 41
2.5 Effects of Exclusivity on Sales: First- and Third-party Exclusive
Titles . . . . . . . . . . . . . . . . . . . . . . . . . . . . . . . . 43
2.6 Effects of Exclusivity on Sales: Developer Fixed Effect . . . . 44
3.1 Overview of Home Video Game Console Market . . . . . . . . 51
3.2 Specification of Selected Consoles . . . . . . . . . . . . . . . . 51
x

3.3 Estimation Result . . . . . . . . . . . . . . . . . . . . . . . . . 59
3.4 Implied Own Price Elasticity of Demand . . . . . . . . . . . . 61
xi

Acknowledgements
I am deeply grateful to my advisor, Professor Wei Tan, for his inspiration and
invaluable guidance for the research, and his warm encouragements during
my research. I also want to express my sincere gratitude to Professor San-
dro Brusco and Professor Hugo Benitez-Silva, who have provided insightful
suggestions to my research and have served on my dissertation committee. I
also thank Professor Guofu Tan for taking the time to serve as the external
member of my dissertation committee.
I want to thank Professor Alexis Anagnostopoulos, Professor Erem Ate-
sagaoglu, Professor Eva Carceles-Poveda, and Professor Silvio Rendon for their
tremendous help to my study and research. I want to thank Junyi Zhu and
Irina Kisina, for their helpful suggestions to my research. I extend my grati-
tude to the faculty, staff and students in the Economics department at Stony
Brook University, who have helped me in various ways during the five years
of my PhD study.
I also thank my parents for their understanding and constant support of
my academia pursuit. I want to especially thank my wife, Miao He, for her
endless love, cheerful encouragement, and deep trust in myself and my work.
I would not be finishing my PhD study without the support from my wife and
my parents, and to them I dedicate this dissertation.
Chapter 3 of this dissertation is a reprint of the materials as it appears
in “Demand for Video Game Consoles: A Regression Discontinuity Design
Approach”, co-authored with Professor Wei Tan.

Chapter 1
Blue-ray DVD, Product
Differentiation and Competition
in the Video Game Console
Market
1.1 Introduction
The home video game console market has long been a perfect example of
indirect network effect, whereby the consumer valuation of the primary prod-
uct (consoles) increases with the size of a complementary good market (video
games), and consoles themselves do not have any value apart from facilitat-
ing the use of compatible games. Therefore, for decades, consoles compete
to win over consumers mainly through the variety of compatible game titles
(Clements and Ohashi, 2005). Between 2005 to 2006, the console manufac-
turers launched their latest, so-called 7th-generation consoles. Among them,
SONY integrated Blue-ray DVD1 playback function into its PlayStation 3 con-
sole. This unique feature makes PlayStation 3 the first console ever that has
practical functions besides playing video games. On the other hand, PlaySta-
1Blue-ray DVD is a format of “high-definition” DVD which means that the formatshould support up to 1920×1080 resolution (compared to standard DVD’s 720× 480), and8 channels of sounds (compared to standard DVD’s 6 channels).
1

tion 3 is much more expensive than its same-generation competitors, and it
was widely believed by the public due to the costs of its Blue-ray DVD func-
tion. In addition, PlayStation 3 has been outsold in every month since it was
launched, and such weak sales performance incurred much debate and analy-
sis among video game fans and mass media about the worthiness of SONY’s
decision of integrating Blue-ray DVD function.
Traditionally, video game consoles did not carry any unnecessary function
for several reasons. First of all, video game consoles have much longer life
cycles compared to other home electronic products, such as PC2. Therefore,
console manufacturers usually adopt the most advanced but also expensive
technology so that consoles can meet rapidly increasing computational de-
mand from gaming industry in the future of their life cycles. At the same
time, console manufacturers often use penetrating pricing for their products
(Shapiro and Varian, 1999), whereby they offer low introductory prices in or-
der to quickly build up the installed base in consumers, which will lead to more
software provision and, in return, a higher willingness to pay later in the prod-
uct cycle. As a result, console manufacturers usually remove any unnecessary
function in order to keep the production cost, especially the initial production
cost, at a low level to allow them to sell consoles in large quantities quickly at
a lower price. However, extra “unnecessary” but appealing functions, such as
SONY’s Blue-ray DVD, can indeed attract “marginal” customers and there-
fore boost consoles sales, even if such functions may add additional costs to
the consoles. For example, a casual game player might choose to purchase
PlayStation 3 over other consoles because he or she wants to watch Blue-ray
DVD movies and does not want to buy the player separately.
At the same time, the product structure in the console market also gives
ambiguous indications. First, SONY is the only manufacturer that is able to
keep two desktop consoles, PlayStation 3 and the less advanced, last-generation
PlayStation 23. Such advantage potentially allows SONY to market PlaySta-
2For example, the major components (like CPU and GPU) and structure design ofconsoles are updated, on average, every 5 to 7 years, compared to 1 to 2 years in PCindustry.
3SONY is the only manufacturer that makes major parts of its consoles, such as CPUand GPU, by its own. In contrast, Microsoft, for example, sources the design and production
2

tion 3 as the high-end product while keeping its low-price PlayStation 2 on
the market aiming at the price-sensitive consumers. Second, in contrast to
the previous generations, prices and hardware specifications vary significantly
among the latest-generation consoles. For example, Nintendo’s latest console,
Wii, is much less advanced in terms of hardware capability, but it is also priced
as half expensive as PlayStation 3. Therefore, PlayStation 3’s advanced hard-
ware design, which leads to higher price even if without the Blue-ray DVD
function, could be another reason for its weak sales performances.
In this paper, I empirically separate and quantify the effects of Blue-ray
DVD function and the effect of the product differentiation on SONY and other
console manufactures’ profitability. My empirical strategy includes two steps.
First, a structural model of console demand and supply is set up and estimated
using market and individual level data to obtain parameters in the consumers
utility function and manufacturers’s cost functions. Consumer demand for con-
soles is modeled using the random coefficient discrete choice model by Berry,
Levinsohn, and Pakes (1995) (henceforth BLP). In the consumer’s utility func-
tion, I explicitly incorporate the measure of game availability, which accounts
for the indirect network effect of compatible games on console demand. There-
fore, consumers derive utilities not only from console’s attributes, but also from
the size of compatible games. As the network effect is mutual, the effect of
console sales on game provision is modeled by a reduced-form supply function
derived from the free-entry equilibrium in the video game industry. In the
supply side, each console manufacturer takes into account the own and cross
price effects as well as the indirect network effects on the profits, and sets
prices according to the Betrand-Nash equilibrium. Second, using the parame-
ters estimated from the empirical model, I conduct the counterfactual analysis
in two scenarios. In the first scenario, I artificially drop the Blue-ray DVD
function from PlayStation 3 and recalculate market equilibrium. It allows
me to assess the direct effect of such function on the SONY and its competi-
tors’ profitability. In the second scenario, I drop the older PlayStation 2 from
of its CPU to Intel, while Nintendo sources it to IBM. Therefore, the supply of Microsoftand Nintendo’s consoles is constrained by the capacity of upstream firm, i.e. Intel and IBM,whose priority in business is PC industry. Therefore, neither Microsoft nor Nintendo hasenough capacity to support two consoles.
3

SONY’s product line after the introduction of PlayStation 3 and recalculate
the market equilibrium. In this scenario, I allow manufacturers to compete
with each other only with their latest-generation consoles so that I can assess
the effects of product differentiation among the latest-generation consoles on
manufacturers’ profitability.
The estimation shows that consumers are willing to pay extra premium
to SONY’s Blue-ray DVD function, but at the same time, such function adds
significant costs to the system. Counterfactual analysis shows that, in terms of
profitability to SONY, the attractiveness of such feature to consumers is largely
offset by its own extra cost. In addition, PlayStation 2 is vital for SONY’s
profitability since its lower price attracts the price-sensitive consumers, and
therefore it enables SONY to better compete with same-generation but low-
priced competitors, especially Nintendo’s Wii. This suggests that the weak
sale performance of PlayStation 3 is partly caused by the competition from
same-generation, less-advanced, but also cheaper consoles.
The remainder of this paper is organized as follows. Section 2 reviews the
related literature. Section 3 presents an overview of U.S. home video game
console industry. Section 4 presents the empirical model. Section 5 discusses
the data set. Section 6 discusses the identification strategy and presents the
estimation results. Section 7 presents the results of counterfactual analysis.
Section 8 concludes.
1.2 Related Literature
First of all, this paper is related to the literature of theoretical and empirical
analysis of indirect network effects in two-sided markets. The utility function
for consoles and software provision equation are derived from the theoretical
works by Chou and Shy (1990), Church and Gandal (1992, 1993), and Nair,
Chintagunta, and Dube (2004). In addition, this paper uses the results from
recent works that study the platform manufacturer’s strategy about license fees
charged to complementary suppliers when the platforms are proprietary and
therefore mutually incompatible. In particular, Economides and Katsamakas
(2006) study the pricing decision of platform manufacturers in several scenarios
4

in the market of indirect network effect. Lin and Kulatilaka (2007) compare
three kinds of license fee scheme: fixed royalties, linear licence fee, and hybrid
contract, in the context of indirect network effect. They show that if the
network effect is large, it is optimal for the platform manufacturer to set the
fixed royalties.
Among the empirical analysis about industries with indirect network ef-
fect, some early works measure network effects only by the installed base of
consumers. These include Bayus and Shankar (2003), which study the home
video game console industry, Ohashi (2003), and Park (2002), both of which
study the format war between Beta-Max and VHS VCRs in late 1970s. These
papers essentially model indirect network effects as though they were direct,
i.e., consumers benefit directly from the size of other consumers who use the
same product4, rather than indirectly through the market for a complementary
good. Empirical studies of markets in which indirect network effects are in-
troduced through the demand of complementary good include Gandal, Kende
and Rob (2000), which explains the diffusion process of a single technology
with network effects in the CD market; Dranove and Gandal (2003), which es-
timates indirect network effects of DVD and Divx players; Nair, Chintagunta,
and Dube (2004), which studies indirect network effect in personal digital as-
sistants (PDA) industry; and Clements, Ohashi (2005), and Prieger and Hu
(2007), which all study the indirect network effect in home video game con-
sole industry. In particular, Nair, Chintagunta, and Dube (2004) formulates a
model of joint determination of platform (PDAs) sales and software availabil-
ity in the market. They show that under certain assumptions, the demand of
platforms can be estimated by the discrete choice model, and the supply of
softwares can be estimated by a simple linear function.
This paper is also related to the literatures that use discrete choice model
to study the effects of various industry activities. Among them are Nevo
(2000) who studies the effects of mergers in the ready-to-eat cereal industry,
Petrin (2001) who studies the value of new product (minivan) in the automo-
4The model of direct network effect is most appropriate for products like a telephonenetwork. As more consumers use telephones, the value of the telephone to an individualconsumer increases because it is possible to call more people. It is as if the quality of thetelephone is increasing in the number of consumers.
5

bile industry, Armentier and Richard (2008) who study the effects of airline
alliances agreements on consumer welfare in U.S. domestic airline market, and
Villas-Boas (2009) who studies the welfare effects of banning wholesale price
discrimination in German retailer market.
1.3 The Home Video Game Console Industry
Video games play a large role in the American entertainment market. In 2004,
the total sales of video game industry in U.S. is nearly $10 billion, greater
than the Hollywoods total global box-office revenue5. At the same time, the
development of the new game consoles has become increasingly expensive since
1990s so that many once significant firms, such as Panasonic and Sega, have
exited the industry. Now, the industry is highly concentrated and there are
only three firms, SONY, Microsoft, and Nintendo, competing in the market.
There are two kinds of consoles. Desktop consoles are the full-featured, ad-
vanced system, and use optical-drive as game storage media. Portable consoles
are PDA-size, less advanced, but portable system using cartridges as storage
media. Consoles from different manufacturers are mutually incompatible, and
desktop and portable consoles from same manufacturers are also incompatible
because of the difference in storage media. Currently, SONY and Nintendo
have both desktop and portable consoles on the market, while Microsoft has
only desktop consoles on the market. Consoles manufacturers typically with-
draw the old consoles when the successors became available. SONY, however,
has been able to keep both old and new consoles on the market due to its
advantages in production capacity.
Table 1.1 summarizes the major characteristics of desktop consoles avail-
able in U.S. since 2000s. PlayStation 3’s price is much higher than its same-
generation competitors. Its introductory price is about 100% higher than
Nintendo’s less advanced Wii, and 25% higher than the Microsoft’s Xbox360
which is comparable in terms of hardware specification. The added cost of
5Entertainment Software Association, Essential facts about the computer and video gameindustry, May, 18, 2005.
6

Console Introduction Manufacturer Price Hardware Characteristics(Month Year) CPU GPU RAM
Sixth Generation
PS 2 Oct. 2000 - SONY 149.99 (2005.3) 294 150 32Present 129.99 (2006.5)
Xbox Nov. 2001 - Microsoft 149.99 (2005.3) 733 233 64Nov. 2005
GameCube Sept. 2001 - Nintendo 149.99 (2005.3) 486 162 43Nov. 2006
Seventh Generation
PS 3 Nov. 2006 - SONY 499.99 (2006.11) 3200 550 512Present 399.99 (2007.7)
Xbox360 Nov. 2005 - Microsoft 399.99 (2005.11) 3200 500 512Present 349.99 (2007.8)
Wii Nov. 2006 - Nintendo 249.99 (2006.11) 729 243 88Present
Table 1.1: Major Desktop Console Characteristics
its Blue-ray DVD function is believed to be the major reason6. On the other
hand, 6th-generation consoles (PlayStation 2, Xbox, and GameCube) have
relatively similar hardware specifications and prices, while 7th-generation con-
soles (PlayStation 3, Xbox 360, and Wii) have quite wide range in hardware
configurations and prices. Among the latest generation, PlayStation 3 and
Xbox 360 are “high-end” consoles while Wii is a less-advanced platform. As a
result, PlayStation 3 and Xbox 360 are more expensive than Wii. This fact il-
lustrates different strategies the console manufacturers designed and promoted
their latest products, and therefore indicates that the competition between the
latest-generation consoles might be quite different from the previous genera-
tions.
Since launching, both PlayStation 3 and its compatible games have been
outsold by the competitors (Xbox 360 and Wii) in every month (Figure 1.1).
6CNET: “PlayStation 3 Cost Analysis”, Nov. 13th, 2006
7

On the other hand, combined average monthly sales of SONY’s old (PlaySta-
tion 2) and new desktop consoles (PlayStation 3) are higher than Microsoft
and are comparable to Nintendo (Figure refDesktop Market).2
15M
onth
ly S
ales
Num
ber
06.11 07.02 07.05 07.08 07.11 08.02 08.06Month
PS3 Xb360 Wii
(a) Figure5
16
500
Mon
thly
Sal
es N
umbe
r of
Com
patib
le
06.11 07.02 07.05 07.08 07.11 08.02 0.806Month
PS3 Xb360 Wii
(b) Figure6
02
46
Ave
rage
Mon
thly
Sal
es N
umbe
r
SONY MICROSOFT NINTENDO
PS2 PS3 XB360 Wii
(c) Figure4
02
46
8A
vera
ge M
onth
ly S
ales
Num
ber
SONY MICROSOFT NINTENDO
PSP PS2 PS3 XB360 DS Wii
(d) Figure3
Figure 1.1: Desktop Market
At the same time, there has been intensive discussion and debate among the
mass media about the worthiness of SONY’s strategy of integrating Blue-ray
DVD into PlayStation 3. Some believed the integration would be a success
since the consumers would be attracted and like to pay a premium for the
feature, especially when DVD player is now a “must-have” for most families
and SONY’s Blue-ray DVD is the winning format of future high-definition
DVD system. In addition, since SONY has PlayStation 2 to serve price-
sensitive consumers, the high price should not be a major problem for SONY7.
In contrast, some analysis suggests that such function would not be valued
very much since consumers mainly, if not only, use consoles to play games,
7For example, see “Strategy Analytic: Sony Will Win 61% Market Share In The WarOf Next Generation Consoles, Business Wire, July.19th, 2005”
8

and therefore the added costs of any extra function would drive price sensitive
consumers away8. Furthermore, the popularity of Wii suggests that Nintendo’s
low price strategy and family oriented game inventories are the key to success,
and SONY and Microsoft’s high-end, but high-price strategy is the major
reason to the weak sales. However, such analysis mainly uses basic data and
trend description and does not allow us to draw any conclusion on the discussed
hypothetical scenarios. In the present paper, I adopt a structural model to
quantify the effects.
1.4 The Model
In this section, I describe the empirical model in the paper capturing the main
feature of demand and supply in the video game console market.
1.4.1 Demand for Consoles
Demand for consoles is modeled by a random coefficient discrete choice model.
Let i denote a household and j denote a console. A household chooses one
console from the total J models available on the market at time t or an outside
alternative j = 0. The utility of household i from purchasing console j in the
period (month) t is defined as
Uijt = αiPjt + βi ln(Njt) + Y ′jtψi + Z ′
jtδ + ξjt + εijt (1.1)
where Pjt is the price of console j at period t; Njt is a measure of the avail-
ability of game titles compatible to console j at the beginning of period t;
(Y, Z) are vectors of the observable product characteristics; ξjt represents the
product characteristics that are observable to households but unobservable to
econometricians (e.g. effect of advertisement, reputation, popularity of games,
etc); (αi, βi, ψi) are random coefficients specific to household i; δ is a vector
of deterministic parameters; finally, εijt is an error term independently and
8See, for example, “Playing the Fool: How Sony inadvertently helped a competitor andlost position in the video game market.”, Wall Street Journal, Dec. 31, 2008
9

identically distributed from a type-I extreme value distribution, representing
the unobserved idiosyncratic preference of household i for console j in period
t, and it is assumed to be independent of all other random variables.
The random coefficients (αi, βi, ψi) are characterized by
(αi, βi, ψi)′ = (α, β, ψ)′ +ΠDi + Σνi (1.2)
where Di is a vector of demographic variables of households, which includes
the variable of household income and a dummy variable that is equal to 1 if
any of the household member is younger than 35 years old (who are the major
population of video game players). νi is the error term which is assumed
to have standard normal distribution and independent of all other random
variables.
Each household i purchases the console (or chooses to purchase the outside
alternative) that maximizes the indirect utility defined in (1), i.e.
Uijt > Uiht, for all h ∈ J, j = h
then the probability that household i purchases console j is
πijt =exp[αiPjt + βi ln(Njt) + Y ′
jtψi + Z ′jtδ + ξjt]∑
h∈J exp[αiPjt + βi ln(Njt) + Y ′jtψi + Z ′
jtδ + ξjt](1.3)
Therefore, the market share of console j implied by the model can be written
as the average purchase probability across all households in the market:
sjt = Eexp[αiPjt + βi ln(Njt) + Y ′
jtψi + Z ′jtδ + ξjt]∑
h∈J exp[αiPjt + βi ln(Njt) + Y ′jtψi + Z ′
jtδ + ξjt]
=
∫ ∫ ∫πijtdF (α)dF (β)dF (ψ)
(1.4)
In the paper, the total market size in each period t is defined by the number
of households in U.S. who own a television but do not have a video game
console until the previous period. Therefore, the potential market for consoles
is allowed to be decreasing over time.
10

1.4.2 Game Provision
In this section, I describe the determination of game availability. When more
households buy a particular console, the corresponding compatible games will
face increasing demand due to the network effects. To derive the empirical
model on game provision, I follow Church and Gandal (1992, 1993), Chou and
Shy (1990), Nair, Chintagunta, and Dube (2004) and Ohashi and Clements
(2005), and assume that there are many firms in the game developing industry
and each firm develops a single game to a particular console j ∈ J in each
period t, and such game production exhibits increasing return to scale and
free entry. Furthermore, each household has a CES demand for games. Under
the above assumptions, the symmetric Bertrand equilibrium determines the
game supply as9
Njt = Ajt(Qjt)γ
where Ajt is the constant for console j at period t, and Qjt is the console j’s
installment base at period t. I thus use the following reduced-form equation
to estimate the game provision:
ln(Njt) = κjt + γ ln(Qjt) + υjt (1.5)
where υjt is a mean-zero error, κjt includes the console fixed effects and time
fixed effects.
1.4.3 Supply of Consoles
Suppose that there are F firms manufacturing game consoles, 1, 2, · · · , F , eachof which produces some subsets, Ff , of the j = 1, 2, · · · , J consoles. The
marginal cost of console j at period t is assumed to take the form of
MCjt = W ′jtη + ωjt (1.6)
9Park (2001), Nair, Chintagunta, and Dube (2004), and Ohashi and Clements (2005) givethe detailed derivation of the following game provision function under the same assumptionsmade in this paper.
11

whereWjt is a vector of product characteristics that affect the marginal cost of
the console, ωjt is the supply side shock that is unobserved by econometricians,
and η is the vector of cost parameters to be estimated.
In the video game industry, it is the common practice that console manu-
facturers charge game developers license fees to allow them to access to their
proprietary systems. Therefore, in a comprehensive model, console manufac-
turers need to determine both the optimal license fees and the optimal console
prices. In the theoretical literatures, such decision is modeled through a two-
stage game, in which platform (console) manufacturers set license fees in the
first stage, and both platform manufacturers and application suppliers (game
developers) set their product prices simultaneously in the second stage. To
model the entire game in the video game console industry, we need to model
demand for games as well as the demand for consoles. This requires, in partic-
ular, detailed data on game prices, which is very difficult to obtain. Instead,
in this paper, I only model the pricing decision of console manufacturers in
the second-stage of the model, leaving the license fee as given for both console
manufacturers and game developers.
The profits of firm f at time t, Πft, therefore, are
Πft =∑f∈Ff
[(Pft −MCft)Mftsft] + Lft − Cft (1.7)
where the first term is the profit from selling the console itself, the second
term Lft is the profit earned from license fees charged on the compatible game
titles, and Cft is the fixed cost of production10.
Lin and Kulatilaka (2007) shows that fixed royalty is optimal for platform
(console) manufacturers when the network effect is large. Therefore, under
such assumption on network effect, console manufacturers’ profits from license
10It is helpful pointing out the effects of differences between economic costs and account-ing costs on the model. The research and development (R&D) expenditures and initialproduction costs are very high in the console industry. These expenditures and costs are al-located through several years by the accounting rules, therefore, console manufacturers mayincur losses in the console manufacturing business. However, by the concept of economiccost, such costs are treated as sunk costs. Therefore, console manufacturers make positiveeconomic profit in the console manufacturing business in the economic models.
12

fees Lft are a constant term in (7). Assuming that the observed structure of
game titles is the the only equilibrium game developers play, the existence of a
pure-strategy Bertrand-Nash equilibrium in console prices, and that the prices
that support the equilibrium are strictly positive, the profit maximizing price
level Pjt for manufacturer f at period t must satisfy the following first-order
condition
sjt +∑r∈Ff
(Prt −MCrt)[∂srt∂Pjt
+∂srt
∂ ln(Nrt)
∂ ln(Nrt)
∂ ln(Qrt)
ln(Msrt)
∂Pjt
] = 0 (1.8)
This equation illustrates the sources of price sensitivity for console demand.
The effect of price changes on demand not only comes directly from the price
changes (∂srt/∂Pjt), but also from the fact that direct price effect is amplified
through the mutual network effects between consoles and compatible games
([∂srt/∂ ln(Nrt)]×[∂ ln(Nrt)/∂ ln(Qrt)][∂ ln(Msrt)/∂Pjt]).
In the matrix notation, the markup at the equilibrium prices is defined as:
P −MC = Ω−1s(P ) (1.9)
where s(·), P , andMC are J×1 vectors of market shares, prices, and marginal
cost, respectively, and the element of Ω is
Ω =
− ∂srt
∂Pjt+ ∂srt
∂ ln(Nrt)∂ ln(Nrt)∂ ln(Qrt)
ln(Msrt)∂Pjt
if ∃f : r, j ⊂ Ff
0 otherwise(1.10)
Using estimates of the demand parameters, I can estimate price-cost margin
without observing actual costs.
Before going to the discuss the estimation of the model, I discuss some
limitations of the model. First, the model presented in this section is a static
model. Since a game console is durable, it may be more appropriate to use
a dynamic model, such as the one in Gowrisankaran and Rysman (2009), to
describe the market. The major issue of dynamics in the video game market
concerns the timing of hardware adoption. In particular, consumers decide to
13

purchase a console based on their expectations of the future popularity of the
console. We can think of two types of console buyers: (1) those who did not
purchase a console before; and (2) those who has already owned older consoles.
At each period, the first type of buyers compare the net benefit of purchasing
a game system to the value of outside option, and the second type of buyers
compare it to the net benefit of keeping the older system. While the frame-
work adopted in this paper is static, I try to capture such dynamic features of
the market in the empirical implementation. I include in the demand equation
console-time interaction dummies that proxy for console-specific events affect-
ing expectations. To account for the second type of consumers, I allow for
the installment base to depreciate11, so that the outside market share changes
with the flow of returning consumers.
There are also assumptions made in order to simplify the modeling supply
side of consoles. First, I make the assumption of fixed royalties on game
titles from the fact that it is supported by the theoretical works. Nair (2007)
conducts interviews with video game studio managers and confirms that such
license fee scheme is popular in the market. However, different license fee
schemes (e.g. linear license fees) may be present in the market. Second, the
supply side is modeled as license fees are given, and more broadly that the
production decision, are set. This does not allow us to consider the effects
of fixed costs, such as research and development costs, on the manufacturer’s
profits. Therefore, the results are only valid given the assumption that such
costs are independent of changes in product attributes or structure12. Last,
the assumption of fixed royalties does not allow it changes with the changes
11The annual depreciation rate of 6th generation consoles (PlayStation 2, Xbox, andGameCube) is set to be 15%, which is estimated by IGN entertainment. It is higher thanthe one used in Clements and Ohashi (2005), who set it at 5%, since the sample used inmy paper is in the transition period between two generations. Therefore, the depreciationrate of older consoles should be higher. The depreciation rate of 7th generation consoles(PlayStation 3, Xbox 360, and Wii) is set to be 5%.
12To be more specific, this requires the assumptions that development decision of PlaySta-tion 3 is uncorrelated with PlayStation 2, and that the development of Blue-ray DVD tech-nology is uncorrelated with the decision of PlayStation 3’s adoption. The first assumptionis validated since PlayStation 3 has little in common with PlayStation 2. The second isvalidated by the fact that SONY and other firms (e.g. LG, Samsung, etc) also producestand alone Blue-ray DVD players.
14

in the availability of game titles, and therefore, it is implicitly assumed that
the license fee revenue is fixed in the counterfactual analysis. As a result, the
calculated changes in profits are the lower bound (upper bound) when the
console sales increase (decrease).
1.5 Data
There are several sources of the data used in the paper. The console sales data
is obtained from NPD group, a consultant firm specialized in consumer prod-
ucts. It consists of SKU-level monthly sales of all console models sold through
the retail channel in the U.S. market from March 2005 to December 2008.
These data were collected using point-of-sale scanners linked to over 80% of
the consumer-electronic retail ACV in the U.S. After removing model-month
observations with insignificant overall market shares in each period (less than
1%), the data contained 342 model-month observations of 8 different mod-
els across 46 months. These represents all the console models, desktop and
portable, that are available in the market during the period. Detailed hardware
attribute data for each model is manually collected from online sources and
trade publications, and is cross-checked with manufacturer model descriptions
for consistency. Because I conduct counterfactual analysis on products struc-
tures and firm’s profits, I include all the models (both desktop and portable
consoles) sold in the U.S. to achieve more accurate estimates.
Because of the presence of network effect, the measure of the benefit pro-
vided by compatible games to the console owners is needed. The ideal measure
would be an index of utility that households obtain from the use of compatible
games in each period. To estimate such an index, I would need data on sales,
prices, and “quality” of games. These data are unavailable to me. Therefore,
I instead collect data on game availability from vgchartz.com, a membership
sponsored website, which maintains an extensive database on game titles. The
availability of a particular game title at period t is defined as the sales of the
title is above a certain threshold, typically about 1500 copies per week. If there
is no accurate sales data, I assume that the life span of a particular game title
15

is 12 month or until the successor title is available13, whichever is shorter. In
addition, same titles but available on different consoles are counted separately.
A comprehensive analysis of firm entry and pricing decision in the game
provision side would require additional data such as the fixed costs of develop-
ment and prices in each period. The former is typically unavailable. Manually
collecting game title price data is not feasible due to the large number of titles
in the market, and to the fact that comprehensive historical price data is ex-
tremely difficult to obtain. These limitations on data of software side require
much simplifying assumptions for the underlying model of game developer’s
entry and pricing decisions.
Finally, the household sample used to model random coefficients is sampled
from Current Population Survey (CPS) and sample size is set to be 500.
Variable Mean Standard Max MinPrice (in 1982-1984 dollars) 101.34 55.99 248.13 39.23Memory (MB) 141.35 190.97 512 0.375CPU (MHz) 952.64 1241.29 3276.8 16.8GPU (MHz) 261.18 355.96 1331.2 16.8Game Titles 288.80 373.93 475 23Holiday 0.083 0.28 1 0DVD 0.17 0.37 1 0
Table 1.2: Descriptive Statistics of the Sample
1.6 Identification and Estimation
1.6.1 Identification
The first identification problem arises from the correlation between the console
prices Pjt, availability of game titles Njt and unobserved console attributes ξ in
the console demand function. Console prices (Pjt) may be endogenous, because
if ξjt is correctly perceived by households, a console with a better reputation
or better marketing effort may induce higher willingness to pay, and thus the
13Many game titles are updated every certain period. For example, Electronic Art’s FIFAsoccer game series are updated every year.
16

manufacturer may be able to charge higher prices in an oligopolistic market.
The endogeneity of the availability of compatible games (Njt) comes from the
interaction with the software provision equation (5), and the autocorrelation
on ξjt. An increase in console demand at period t− 1, because of the change
in the unobserved error, would increase the installed base at the beginning of
period t, leading to an expansion of the game sales trough network effects.
Thus ξjt and Njt are positively correlated with each other in the presence of
the autocorrelation in ξjt.
One common strategy to identify the endogenous coefficients is to exploit
the rival product attributes and the competitiveness of the market environ-
ment. All else being equal, products with closer substitutes have lower prices
because of the tougher competition. As suggested by Berry (1994) and BLP
(1995), the observed attributes of other products are valid instruments. The
instruments include the rivals’ memory size, CPU speed, and GPU speed. The
second identification strategy is to search for variables that affect manufactur-
ing costs but not demand, known as “cost shifters”. These variables correlate
with console demand through marginal costs, but not ξ since ξ captures the
effects outside the production process. The first set of the instruments of this
kind includes the exchange rates of Japanese Yen, Korea Won, and Taiwanese
Dollar. These three countries are the host countries of major producers of
console CPU, memory, and GPU. Change in these exchange rates will affect
the costs of consoles in terms of US dollar, but not on unobserved product
attributes in U.S. market since console attributes and manufacturers’s mar-
keting effort are independent of such exchanges, and also independent of other
market conditions. However, these instruments are an industry aggregate and
do not vary by console model, the use of instruments thus only helps iden-
tify the demand through the variation of the instruments over time, but not
within products in the same period. The second set of the instruments of such
“cost shifters” is the technology of semiconductor production adopted by each
console manufacturer (or its suppliers), which is measured by the minimum
distance between two elements on the circuit of major console components (e.g.
CPU and GPU) in terms of micrometer (µm). The closer this distance can
be achieved, the less the costs of production of console components, therefore
17

these instruments are correlated with demand through marginal costs, but not
with ξ.
The second identification problem is that the correlation between the υjt,
the unobserved shock on the video game market, and Qjt, the console install-
ment, in the software provision equation (5). If software sales associated with
console j increases due to υj,t, an unobserved shock in the software market at t,
this shock would induce new console adoption and boost the share of the con-
sole j, sjt, and hence the installed base in the period, Qjt. Thus endogeneity
in Qjt arises. I use as an instrument the total number of console j’s compati-
ble game titles that are among the top 50 best-selling games published every
month by GameStop Inc. GameStop is the largest U.S. video game retailer
and it publishes its top selling list every month. I collected the data manually
from its website www.gamestop.com. The titles in top 50 games correlate with
console installment Q through network effect. However, there still are certain
cases where the average software sales correlates with the error term υjt. If
potential entrants perceive the presence of large number of best-selling titles
as sign of profitable opportunity due to the potential popularity of the console,
the instrument would be positively correlated with υjt. On the other hand,
if the potential entrants see it as a sign of tough competition, the instrument
would be negatively correlated with υjt. Thus the direction of the bias by use
of this instrument, if it exists, could go either way. I therefore rely on the
statistical test of overidentifying restrictions to check if the instruments are
orthogonal to the error.
1.6.2 Estimation
In general, the estimation of this model is essentially a two step procedure of
a contraction mapping in the first and GMM in the second. First of all, the
indirect utility function (1) can be written as
uijt = ϕjt + µijt + εijt (1.11)
18
where ϕjt, the mean utility of console j in period t, is the same for all the
households in period t. The mean utility from the outside alternative is nor-
malized to zero. µijt is the household specific utility. The mean utility is
specified as follows
ϕjt = αPjt + β ln(Njt) + (ψ, δ)(Yjt, Zjt) + ξjt (1.12)
and household specific utility µijt is
µijt = [Pjt, ln(Njt), Yjt](ΠDi + Σνi) (1.13)
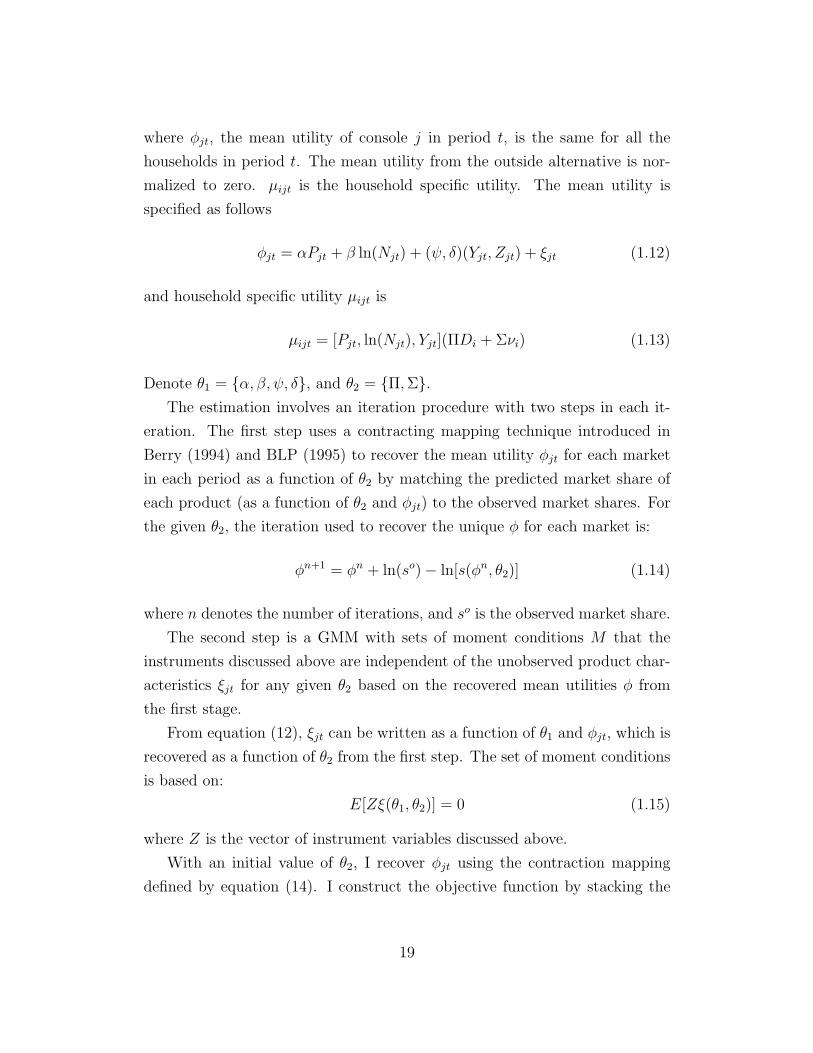
Denote θ1 = α, β, ψ, δ, and θ2 = Π,Σ.The estimation involves an iteration procedure with two steps in each it-
eration. The first step uses a contracting mapping technique introduced in
Berry (1994) and BLP (1995) to recover the mean utility ϕjt for each market
in each period as a function of θ2 by matching the predicted market share of
each product (as a function of θ2 and ϕjt) to the observed market shares. For
the given θ2, the iteration used to recover the unique ϕ for each market is:
ϕn+1 = ϕn + ln(so)− ln[s(ϕn, θ2)] (1.14)
where n denotes the number of iterations, and so is the observed market share.
The second step is a GMM with sets of moment conditions M that the
instruments discussed above are independent of the unobserved product char-
acteristics ξjt for any given θ2 based on the recovered mean utilities ϕ from
the first stage.
From equation (12), ξjt can be written as a function of θ1 and ϕjt, which is
recovered as a function of θ2 from the first step. The set of moment conditions
is based on:
E[Zξ(θ1, θ2)] = 0 (1.15)
where Z is the vector of instrument variables discussed above.
With an initial value of θ2, I recover ϕjt using the contraction mapping
defined by equation (14). I construct the objective function by stacking the
19

set of moment conditions, which is the function of the initial value of θ2 and
the recovered ϕ2 as a function of θ2. Then, the GMM estimators θ1 and θ2
minimize the objective function
J = ξ(θ1, θ2)′ZW−1Z−1ξ(θ1, θ2)
where W is a consistent estimate of E(Z ′ξξ′Z). The procedure then involves
iteratively updating θ2 and then ϕjt to minimize the above objective function.
I start with using Z ′Z as the starting point of W to obtain consistent initial
estimates of the parameters and optimal weighting matrix. I then estimate
the model using the new weighting matrix.
The game provision equation (5) is estimated by standard 2SLS. With the
estimation of the demand side and game provision, I can recover the marginal
cost for each model based on manufacturers first order condition for profit
maximization in equation (9). The first order condition can also be used to
simulate new equilibrium prices in the counterfactual scenarios. Marginal cost
function (6) is estimated by standard OLS.
1.6.3 Estimation Results
Console Demand
The last two columns in Table 1.3 present parameter estimates in the mean
utility function ϕ defined by equation (12). The first 2 columns report estima-
tion results of a standard logit model for the purpose of comparison 14.
The key parameters of interest are price, log(game availability) and Blue-
ray DVD dummy. The estimation result shows that consumers are sensitive to
prices but are willing to pay extra premium for the Blue-ray DVD function in
both specifications. In addition, the market exhibits intensive network effects.
In addition, the coefficients for memory and GPU are insignificant, while coeffi-
cient for CPU is barely significant. This may illustrate the fact that, especially
for the latest-generation consoles, the hardware specifications of different con-
14As in Berry (1994), the dependent variable in the logit model is ln(sjt)− ln(s0t), wheresjt and s0t are the market share of console j and outside choice in the period t, respectively.
20

Logit Random CoefficientVariable Para Std Err Para Std ErrPrice -0.294 0.160 -0.430 0.143
Log(Game Availability) 0.235 0.036 0.584 0.039Blue-ray DVD dummy 0.711 0.295 0.963 0.388
Memory 0.086 0.013 0.048 0.958CPU 0.016 0.006 0.034 0.016GPU 0.008 0.004 0.021 0.012
Portable dummy 1.534 0.346 1.832 0.843Microsoft dummy -3.561 0.732 0.483 0.224Nintendo dummy 1.077 0.216 1.712 0.704Holiday dummy 0.995 0.079 1.213 0.157
Table 1.3: Parameters in Mean Utility Function
soles are not directly comparable due to the different system structures. At the
same time, consumer observe advantages of advanced hardware configuration
mainly through the capability of running computationally demanding games
(e.g. action games, sports games, etc.), which is also captured partially by the
game availability effect β and by the unobservable product attributes term ξjt.
The dummy variable for Nintendo is positive and significant in both models.
This reflects the fact that Nintendo, although its consoles are less advanced
in hardware capabilities, enjoys its legendary game titles, such as the “Mario”
series, and its exclusive movement detection technology15. Dummy variable
for Microsoft is positive and marginally significant in the random coefficient
model. This may be due to the fact that most of Microsoft game titles are
developed by U.S. studios and are more appealing to U.S. customers than
SONY’s16.
Table 1.4 presents the estimates of the random parameters (αi, βi, ψi) and
σi. Most estimates have expected signs. For instance, high income consumers
15Nintendo’s motion detection technology allows players to play games not only by usingbuttons on the remote controls, but also using their body movement. This feature is greatlyvalued by U.S. consumers and largely offset Nintendo’s less advanced technology in hardwareconfiguration.
16Some of SONY’s legendry titles are developed by Japanese studios and are aimedprimarily for Asian customers, whose preferences are significantly different from Americancustomers’.
21

Variable σ Income TeenPrice 0.298 0.148 -0.215
(2.382) (0.0989) (1.427)Blue-ray DVD Dummy 0.679 -1.544 0.389
(0.159) (1.122) (0.130)Log(Game Availability) 0.220 0.0294 0.142
(0.0412) (0.0316) (0.0726)
Table 1.4: Parameters for Random Coefficients
are less sensitive to prices since the coefficient of income for price (0.148) is
positive. The income effect on Blue-ray DVD function is negative but insignif-
icant. The negative sign may be due to the fact that wealthy households may
choose to buy stand-alone Blue-ray DVD players to get better function, while
insignificance may be due to heterogeneity among consumer’s preferences. In
addition, the households with young members value Blue-ray DVD function
positively (0.389), and it may be due to the fact that young people are gen-
erally more willing to pay extra money to the latest technology. Households
with young members also value more about game variety (0.142) since they
are the main population of “hardcore” video game players.
Software Provision
Table 1.5 presents the estimates of software provision equation (5). I present
the result from both IV estimation and standard OLS estimation. The J-
statistic shows that the model fits moderately well with the instruments, and
the F -statistic indicates that the instruments are not weak. The coefficient of
software sales variable increases from 1.063 in OLS to 2.165 under IV model.
The estimate then shows that 1% increase in sales of compatible games leads
to approximately 2.17% increase in console sales.
Marginal Cost Function
Table 1.6 presents the estimates of console’s marginal cost function. We see
that Blue-ray DVD function is expensive in that the estimated cost is about
25 dollars in real 1982-84 term, which accounts for about 20% of PlayStation
22

2SLS OLSVariable Para Std Err Para Std Err
Log(Console Sales) 2.165 0.227 1.063 0.044Constant Yes Yes
Manufacturer Dummy Yes YesPeriod Dummy Yes YesNo. Observation 342 342
R2 - 0.881st stage F stats 6.24E+04 -J Statistics (D.F.) 0.29(1) -
Table 1.5: Parameters for Software Provision Equation
3’s marginal cost.
Variable Parameter Standard ErrorDVD dummy 0.258 0.049
Memory 0.019 0.009CPU 0.073 0.010GPU 0.034 0.023
Portable dummy 0.723 0.329Microsoft dummy 0.010 0.003Nintendo dummy -0.023 0.015
Table 1.6: Parameters for Marginal Cost Function
Estimated Price Elasticity
The price elasticities of the market shares, sjt, defined by equation (4) are
ηjkt =∂sjtpkt∂pktsjt
=
−pjt
sjt
∫ ∫ ∫αi(1 +
βiγMsjt
)πijt(1− πijt)dF (α)dF (β)dF (ψ) if j = k,pktsjt
∫ ∫ ∫αi(1 +
βiγMskt
)πijtπiktdF (α)dF (β)dF (ψ) otherwise,
where πijt is the probability of consumer i purchasing console j at period t.
Again, the elasticities are amplified through the presence of network effects,
which is measured by the term (βiγ)/(Msjt).
23

Table 1.7 presents selected own and cross-price elasticities across major
desktop consoles considered in this paper. We see that own-price elasticities
of all consoles are greater than 1 (in absolute terms). In addition, the cross-
price elasticity between PlayStation 2 and other consoles is relatively lower
since PlayStation 2 is last-generation console and therefore not very much
comparable to others. Meanwhile, PlayStation 3 and Xbox 360 are closer
substitutes to each other, while Wii is placed farther from the above two
consoles because of the hardware capability and gaming styles.
PlayStation 2 PlayStation 3 Xbox 360 WiiPlayStation 2 -4.47 0.117 0.267 0.242PlayStation 3 0.063 -5.93 1.168 0.167Xbox 360 0.100 0.840 -4.84 0.105
Wii 0.655 0.399 0.145 -3.47
Table 1.7: Average Own- and Cross-Price Elasticities of Desktop Consoles
To check the robustness of my estimates, I compare my estimated elastic-
ities with existing literatures. Clements and Ohashi (2005) estimate that the
range of average own-price elasticities of major consoles sold during 1994 to
2002 is U.S. market are between -2.47 to -1.06. In particular, they estimate
the average own-price elasticity of PlayStation 2 during 2000 and 2002 is at
-2.20. Prieger and Hu (2006), using a data of major desktop consoles sold in
U.S. during 2002 and 2004, estimate that the average own-price elasticities
range from -2.29 to -1.80. My estimates are higher in absolute terms. There
are mainly three reasons for the difference. First of all, papers cited above
only account for the direct price effect on the console demand, while I take
into account both direct price effect and indirect price effect through network
effect. Therefore, the estimates of elasticities are inherently larger (in absolute
term) in my models. Second, in the data used by previous papers, consoles are
very similar to each other in hardware specification and therefore in prices. As
a result, there is relatively little price variation over periods and, more impor-
tantly, between consoles. Therefore, the estimates in the previous literature
explain the differences in market shares mainly by differences in game variety.
In contrast, my sample exhibits price variety between products due to different
24

hardware designs (for example, the “high-end” consoles, such as PlayStation
3 and Xbox 360, and “low-end” consoles, such as Wii) and different price
cutting strategies from different manufactures over time. My estimates, as a
result, explain bigger part of demand variation through differences in prices.
Lastly, papers above use either nested-logit (Clements and Ohashi) or logit
(Prieger and Hu) model, which imposes restricted substitution patterns on
the products, while I use random coefficient logit model to allow more flexible
substitution patterns17.
1.7 Counterfactual Analysis
This section quantifies the effects of console manufacturers’ different strategies
on their profitabilities. There are mainly two factors. The first factor is the
trade-off between the extra attraction and added costs of such function, and
the second factor is the effects of product differentiation among the latest-
generation consoles on console manufacturers’ profitability.
1.7.1 Value of Blue-ray DVD
To quantify the first factor, I artificially drop the Blue-ray DVD function off
from PlayStation 3 and recalculate market shares and prices in the new equi-
librium. The changes to the market equilibrium are through three channels.
First, PlayStation 3’s marginal cost is lowered because of the drop of Blue-ray
DVD function. The second is through the changes in consumers’ utility about
the characteristics of “new” consoles. The last one is through the network
effects since changes in market shares of consoles will affect the sales of com-
patible games, which in turn affect the console market shares. Specifically, I
calculate the new marginal cost of “new” PlayStation 3 console without Blue-
ray DVD using estimates of marginal cost function. Then, I solve equation
(4) and (5) simultaneously to find the new equilibrium given the new set of
17It is well known that the own elasticities in standard logit model is proportional to ownprices, therefore, own-elasticities of consoles will fall significantly along with the significantfalling of console prices.
25

console characteristics. The base period is set to be October 2006, which is
the month ahead of the launch of PlayStation 3.
Console Price Change (%) Sales Change (%)PlayStation 2 -7.47 4.12PlayStation 3 -15.93% 4.76Xbox 360 -9.35 -6.13
Wii -2.47 2.26
Table 1.8: Changes in Prices and Sales of Desktop Consoles (Since 2006.11)
Manufacture Profit Change (%)SONY 0.32
Microsoft -11.63Nintendo -6.93
The profit change includes profits from all consoles, desktop and portable.
Table 1.9: Changes in Variable Profits of Console Manufacturers (Since2006.11)
As seen from Table 1.8 and Table 1.9, by dropping the Blue-ray DVD
function, the marginal cost of PlayStation 3 is lowered and therefore, SONY is
able to lower PlayStation 3’s price. In turn, such move triggers price cuts from
other manufacturers. In terms of sales, Microsoft’s Xbox 360 decreases more
significantly because of the elimination of PlayStation 3’s DVD function. It is
mainly due to the fact that Xbox 360 is the closer substitute for PlayStation
3 in terms of hardware specification, and therefore some of its buyers would
be attracted by PlayStation 3’s “new” lower price. At the same time, Wii’s
sales increases after the price cuts. It illustrates the fact that Wii is farther
positioned in the product attributes space than its rivals. Taking into account
both desktop and portable consoles, SONY’s profits increase very slightly by
0.32% if Blue-ray DVD function is removed from PlayStation 3. These results
show that the almost all the benefits of cost reduction by removing Blue-ray
DVD function from PlayStation 3 is offset by the decrease in the product
value to the consumers and diminished margin of PlayStation 3. At the same
time, Microsoft’s profits decrease by 11.63%, and Nintendo’s profits decrease
26

by 6.93%. Microsoft has higher loss partially because, unlike SONY and Nin-
tendo, it does not have portable consoles on the market and therefore relies
solely on the desktop console business. In addition, PlayStation 3 without
Blue-ray DVD feature would be able to capture more market share from Xbox
360 than from Wii due to the similarity in the product attributes.
1.7.2 Effects of Product Differentiation
The second counterfactual analysis is to quantify the effects of product differ-
entiation among the latest-generation (7th generation) consoles on manufac-
turers’ profitability. To do this, I drop PlayStation 2 from SONY’s product
line immediately after it launched PlayStation 3, and recalculate the market
equilibrium since then. This examines the effects of much more differenti-
ated product attributes among the 7th generation consoles on manufacturers’
profitability. I consider two cases in this scenario. In the first case, I keep
PlayStation 3 with its Blue-ray DVD function, and in the second case, I re-
move Blue-ray DVD function from it. Table 1.10 and Table 1.11 summarize
the counterfactual results under these two cases.
Without Blue-ray DVD With Blue-ray DVDManufacture Price Change Sales Change Price Change Sales Change
(%) (%) (%) (%)
PlayStation 3 -14.25 10.25 -4.93 -15.76Xbox 360 -10.17 7.27 -8.35 11.98
Wii -9.26 19.15 -5.47 28.26
Table 1.10: Changes in Prices and Sales of Desktop Consoles without PS2(Since 2006.11)
As presented in Table 1.10 and 1.11, PlayStation 2 plays a vital role for
SONY since it attracts price-sensitive buyers. Either with or without Blue-
ray DVD function in PlayStation 3, SONY’s profits decrease significantly if
PlayStation 2 is dropped. At the same time, Nintendo’s Wii benefits the most
from the retraction of PlayStation 2 in terms of sales and profits increase. The
main reason is that most buyers of PlayStation 2 are price-sensitive consumers
so that, without PlayStation 2, more of them turn to Wii, which is less ad-
27

Manufacture Profit Change (%) Profit Change (%)(without Blue-ray DVD) (with Blue-ray DVD)
SONY -32.68 -57.45Microsoft -2.57 9.82Nintendo 22.36 30.02
The profit change includes profits from all consoles, desktop and portable.
Table 1.11: Changes in Variable Profits of Console Manufacturers withoutPS2(Since 2006.11)
vanced but also much less expensive. On the other hand, PlayStation 3 can
attract a relative larger number of former PlayStation 2 buyers compared to
specification-comparable Xbox 360 only if its Blue-ray DVD function is re-
moved. This is because that, by dosing so, SONY is able to lower PlayStation
3’s price further to make it more appealing to former PlayStation 2 buyers.
However, with Blue-ray DVD on it, PlayStation 3 cannot compete with its
competitors in prices because of the added costs, and therefore it loses market
share more significantly.
The simulation result also illustrates the effects of different system designs
among the latest-generation consoles on profitability. Until the latest gen-
eration, video game consoles has been designed very similarly to each other
in hardware designs. In addition, similar hardware specifications make in-
troductory prices and the later price-cutting strategies similar among console
manufacturers. As a result, manufacturers compete mainly through game va-
riety18. Therefore, network effects play the dominant role in deciding console
sales during their life cycles (Clements and Ohashi, 2005). In contrast, hard-
ware specifications are much more differentiated among the latest-generation
consoles, and therefore their prices also vary significantly. As a result, ex-
pensive high-end consoles, such as PlayStation 3, face much more intensive
competitions from less expensive consoles, such as Wii, and are less attractive
to price-sensitive consumers. Consequently, retail prices are therefore more
important in the determination of console sales, and PlayStation 3’s higher
price due to its advanced hardware even if without Blue-ray DVD function is
18See Chou and Shy (1990), Church and Gandal (1992, 1993), Clements and Ohashi(2005), and Prieger and Hu (2006) for detailed analysis.
28

partially the reason to its weak sales performances.
Finally, I conclude this section by noting the consequences of integrating
Blue-ray DVD function into PlayStation 3 may not be confined in the context
of console market alone. In fact, by the help of such integration, SONY is
able to quickly build up the installment base of Blue-ray DVD player in the
consumers, and such strategy is important for SONY to win the format war
of next-generation DVD media over Microsoft and Toshiba’s HD-DVD tech-
nology19. Furthermore, as showed in the section 7.1, such integration does
not hurt SONY’s profits in console business very much, and therefore, such
strategy may be favorable to SONY in a broader context.
1.8 Conclusion
SONY’s latest video game console PlayStation 3 entered into the market with
integrated Blue-ray DVD function. This feature can, on one hand, contribute
to PlayStation 3’s sales through its extra value to consumers, while, on the
other hand, it can also have negative impacts on the sales of PlayStation 3 be-
cause of its added cost. In addition, differentiation in hardware specifications
among the latest-generation consoles is another important reasons of PlaySta-
tion 3’s relatively weak sales. The objective of the paper is to quantify the
consequences of above two effects on console manufacturers’ profitability. To
address this problem adequately, I set up and estimate a random coefficient
discrete choice model based on console attributes as well as the measure of
game variety to account for the network effects in the market. At the same
time, the model incorporates the software provision equation to reflect the mu-
19Blue-DVD (SONY) and HD-DVD (Microsoft and Toshiba) are two competing for-mats of next-generation high-definition DVD media. In February 2008, Toshiba abandonedthe format, announcing it would no longer develop or manufacture HD-DVD players ordrives.The HD-DVD Promotion Group (a group of manufacturers and media studios formedto exchange thoughts and ideas to help promote the format worldwide) was dissolved onMarch 28, 2008. For various reasons, Microsoft never integrated HD-DVD drives into itsXbox consoles. In contrast, Microsoft did offer stand-alone HD DVD players for Xbox 360at the end of November 2006 with MSRP $199.99. However, the attach ratio of this playerto Xbox consoles has been consistently less than 1%. On February 23, 2008 Microsoftdiscontinued the Xbox 360 HD-DVD player
29

tual network effects of consoles on game variety. The supply side of the model
is constructed based on the assumption of fixed license fees and Bertrand com-
petition.
I find that (1) consumers do value the integrated Blue-ray DVD function in
PlayStation 3 and are willing to pay an extra premium for it; (2) at the same
time, such function adds significant cost to the PlayStation 3 console. The
simulation results show that, in terms of profitability, the benefit of the Blue-
ray DVD function for SONY is largely offset by its added cost. At the same
time, traditionally, consoles have similar hardware designs and prices. Yet,
latest-generation consoles have much different hardware designs and therefore
prices. In the absence of PlayStation 2, price-sensitive consumers, who are
the majority of PlayStation 2’s buyers, would turn to less expensive consoles,
such as Nintendo’s Wii, while PlayStation 3 could not attract enough of those
consumers because of its higher price. This illustrates that SONY’s high-end
but high-priced PlayStation 3 may not be as successful as Nintendo’s less ad-
vanced, but cheaper and family-oriented Wii in terms of sales and profitability
even if Blue-ray DVD function is dropped.
More generally, my paper highlights some key features in the market with
network effects. The platform (consoles) price has direct effects on platform
demand as in the regular market, but at the same time it also has indirect
effects through network effects, and thus it plays a larger role in the deter-
mination of platform sales in this market. Therefore, the platform attributes
can contribute to the demand only if they do not add too much costs to the
system. In fact, less advanced platforms in terms of product attributes can
also be successful if their low prices can boost sales of complementary good
and, in return, the sales of platform itself. This paper then suggests that
price differentiations stemmed from different platform attributes and design
philosophy may be a significant factor in the competition in the market with
network effects.
30

Chapter 2
Exclusive Titles and Sales
Performance in the Home Video
Game Market
2.1 Introduction
The home video game industry is a perfect example of two-sided market, where
consumers must associate with a platform (video game consoles) in order to uti-
lize the complements (video games) and consoles from different manufacturers
are mutually incompatible to each other. Therefore, the issue of video games’
compatibility arises: some games are compatible with multiple consoles, while
others are exclusively available one one particular console. In addition, Such
exclusivity has two folds: first, independent game developers develop exclusive
titles on a particular console through the exclusive contract with the console
manufacturers1; second, console manufacturers also have game titles exclusive
to their own video game consoles (first-party titles).
Such exclusive game titles have significant effects on home video game in-
dustry’s competitive landscape. First of all, although the number of exclusive
titles may not be large, they are dominant on the best-selling game lists for all
1A very similar example is that, to purchase the Apple iPhone, consumers must subscribeto AT&T Wireless, since there is a exclusive contract between Apple and AT&T
31

the consoles. Second, they are important for the console manufacturers since
the latter can reduce competition and increase attractiveness of their own plat-
forms by developing first-party titles or by rewarding such exclusive contract
to the third-party independent game developers. Exclusive game titles can
add extra appeal to consumers through its uniqueness, and, at the same time,
it can eliminate potential multi-platform availability of the title (Church and
Gandal, 2000). This practice further increases console manufactures’ market
power because of the network effects in this market.
The existing literatures are mainly focused on the effects of the comple-
ment’s exclusivity and integration on the competition among platforms. In
this paper, I study the effect of exclusivity on the sales of complementary
good directly. More specific, I quantify the effects of exclusivity on the sales
performance in the seventh-generation home video game market. I compare
the sales of exclusive (including first-party and third-party) and non-exclusive
game titles.
I focus on the video games for the 7th generation video game consoles,
which include three competing platforms: PlayStation 3 from SONY, Xbox
360 from Microsoft, and Wii from Nintendo. With the help of vgchartz.com,
a website dedicated to maintain a comprehensive dataset of video game indus-
try, I gathered the information of all game titles that are available on these
three consoles in US from November 2006 to October 2009. The dataset has
974 observations and it contains the information of launch date (by month),
platform availability, sales performance, launch prices, genres, ratings from the
Entertainment Software Rating Board (ESRB) and other aspects of games. In
addition, the vgchatz.com also contains review scores from major entertain-
ment magazines and websites for a large number of games. I manually collect
those scores and I have a sample of 643 titles with review scores.
After controlling for title and developer heterogeneity, I find that the ex-
clusive game titles do have higher sales. At the same time, such premium in
sales suggests the possible platform (in terms of exclusivity) selection, and I
take three approaches to deal with selection issues, and all the results support
the conclusion that exclusive titles have higher sales.
There are two concerns due to platform selection. First, there might be
32

unobserved game characteristics that affects the decision on console platform
adoption and the sales outcome. For example, since consoles are different
in their hardware capabilities, exclusive game titles on a particular platform
may have specially designed features to better take advantage of the console’s
capability, and such features may not be captured by the game characteristics
and controls. To deal with possible unobserved game heterogeneity I follow
Hendel, Nevo, and Ortalo-Magne (2009) to examine that game series that have
multiple titles2. The inclusion of a game fixed effect is essentially insignificant,
which suggests that unobserved game heterogeneity is not a problem.
The second concern is the selection of game developers into console plat-
forms. Console manufacturers may offer financial or marketing assistance to
exclusive game titles.For example, console manufacturers may bundle their
consoles and exclusive game titles at a discounted price to promote the sales.
At the same time, the differences in functions and consumer base of each con-
sole also potentially cause the selection problem. For example, most of Wii’s
players are children or casual players and Wii’s unique motion detection func-
tion is the biggest attraction for those players. Therefore, developers which
design family oriented games would tend to make titles exclusive on Wii in or-
der to better exploit the motion-detection technology and to attract targeted
consumers. These practices thus affect both the platform choice and the sales
performances. I use two approaches to deal with unobserved developer het-
erogeneity. The first approach is related to Levitt and Syverson (2006), and
Hendel, Nevo, and Ortalo-Magne (2009). I compare the sales of first-party
exclusive titles to the sales of third-party exclusive titles. After controlling for
time, game and platform characteristics, I find nonsignificant third-party sales
premiums.
The second approach for controlling developer selection is to include devel-
oper fixed effects. I then use a sample which contains titles from developers
who design both exclusive and non-exclusive games. After including developer
fixed effect into the regression, I find marginally nonsignificant sales premium
2For example, EA updates its FIFA series every year. Each year, EA released a newtitle in the series, e.g. FIFA 06, FIFA 07, etc. Titles in the series are very similar in theeffects, control, and other aspects, since they use the same gaming engine.
33

on exclusive titles.
2.2 Related Literature
This paper first is related to the empirical analysis of effects exclusivity and
vertical integration in the two-sided markets. The existing literatures are
mainly focused on the impacts on the side of platform competitions. For
example, Hastings (2004) and Hastings and Gilbert (2005) both investigate
the impact of vertical integration in the retail gasoline market. Hortacsu and
Syverson (2007) analyze vertical integration among the cement and ready-
mixed concrete industries. In particular, Hu and Prieger (2008), Derdenger
(2009) and Lee (2009) both study the effects of exclusive game titles on the
competition among game console manufacturers. In contrast to them, in this
paper, I answer the question that whether third-party exclusive titles process
sales premium.
In terms of empirical framework, this paper is closely related to Hen-
del, Nevo, and Ortalo-Magne (2009). They compare outcomes on transaction
prices and time by property sellers using real estate agents and using For-Sale-
By-Owner web site, and control for the potential seller selection problems.
I follow their framework to compare the sales performances of exclusive and
non-exclusive video games.
2.3 Home Video Game Market
Starting as a fringe industry in the early 1970’s with the introduction of a home
version of Pong, the U.S. video game industry has since grown to reach $21.3
billion in revenues in 2008.5. Increasingly, as evidenced by the widespread
adoption of the new generation of consoles introduced in 2006, video games
have broadened their appeal and user base from a child’s hobby to something
more mainstream: 69% of American heads of households engage in computer
and video games, with the average age of a player being 35 years old,6 and
market penetration of video game consoles reached 41% of U.S. television
34

households (45 million) in 2006.
A video game system consists of a hardware platform (the “console”) and
software (video games). In the current and most recent generations, each con-
sole is and has been provided by one firm - the console manufacturer - as a
tightly integrated and standardized device that is required in order to utilize
any software provided for the system. Video game software, on the other hand,
is brought to market by two vertically related entities: developers, who under-
take the programming and creative execution of each title; and publishers, who
market and distribute each game. Publishers may be integrated into software
development; although independent software development studios exist, as the
costs of developing games have increased over time (average costs reached $6
million during the late 1990’s) these studios often turn to software publishers
for financing in exchange for distribution and publishing rights.
Consoles from different manufacturers are mutually incompatible, there-
fore, the issue of exclusivity on the software side arises. Exclusive game titles
can only run on one particular console, while non-exclusive titles can run on
multiple platforms. Any title produced by the console manufacturer’s own
studios or distributed by its own publisher, known as the “first-party” title,
is exclusive to that console platform. All other games are “third-party” titles
and are published by other independent firms. Within the same generation of
consoles, games developed for one console are not compatible with others; in
order to be played on another console, the game must explicitly be “ported” by
a software developer and another version of the game created. These porting
costs for supporting an additional console, which includes additional develop-
ment and distribution costs, are non-negligible, and range from a few hundred
thousand to a few million dollars. Because of such significant porting costs,
the same non-exclusive games on different consoles are counted as different
game titles although they may share many common characteristics.
2.4 Data
The data is collected from the website www.vgchartz.com. The website main-
tains a comprehensive dataset about video game consoles and video games. In
35

this paper, I focus on the games for the three seventh-generation video game
consoles: SONY’s PlayStation 3, Microsoft’s Xbox 360, and Nintendo’s Wii.
The dataset contains the information about release date, sales number, genre3,
console availability and publishers of each game title from November 2005 to
December 2008. In particular, Xbox 360 was launched one year earlier than the
other two consoles, as a result, data for PlayStation 3 and Wii’s game starts
from November 2006. In addition, the website also provides review scores for
634 game titles from various website and print magazines. I normalize all re-
view scores on the scale of 10, and take average as the quality index. Because
of the “porting” cost discussed above, same games on different consoles are
counted as different titles although they have the same game characteristics.
In total, there are 974 game titles in the dataset.
Table 2.1 summarizes the general descriptive statistics about the data.
Platform PlayStation 3 Xbox 360 WiiTotal Number of Titles 229 371 378Number of Exclusive Titles 38 (16.6%) 92 (24.8%) 123 (32.5%)Number of First Party Titles 17 (7.4%) 29 (7.8%) 24 (6.3%)
Total Quantity Sold (Million)Average 0.16 0.18 0.26Standard Deviation 0.10 0.07 0.07Median 0.28 0.30 0.58Max 3.69 4.82 6.96Min 0.02 0.01 0.01
Starting PriceAverage 40.83 39.72 39.63Standard Deviation 11.22 10.69 9.83
Number of Exclusive Titles 11 9 15in Top 15 GamesExclusive Titles Sales Percentage 27.8% 39.4% 67.2%
Table 2.1: Descriptive Statistics
3The genre of the game includes action, family, fighting, platform, racing, RPG, shoot-ing, sports, and other.
36

There is significant variation in game exclusivity across platforms: although
30% of all game titles are exclusive to one console, the majority are located on
the Wii, while the majority of PlayStation 3 tiles are available on all systems.
On the other hand, the exclusive titles dominate the best selling lists for all
three consoles. Xbox 360 and PlayStation 3 has 9 and 11 titles among their top
15 best-selling games, respectively, while Wii’s top 15 titles are all exclusive.
In addition, exclusive titles have much stronger sales than non-exclusive titles
in general. They account for 27.8%, 39.4%, and 67.2% of the total game sales
for PlayStation 3, Xbox 360, and Wii, respectively.
The Table 2.2 presents the comparison between exclusive and non-exclusive
game titles across console platforms. The table suggests that there is some
difference in the observed characteristics of exclusive and non-exclusive game
titles. Especially, exclusive game titles have higher review score, implying that
they may have higher quality perceived by the consumers.
Exclusive Titles Non-exclusive TitlesVariables Mean Std. Dev. Mean Std. Dev. Diff t-statSales (in Million) 0.37 0.12 0.15 0.10 0.22 4.84Review Scores 6.92 1.24 6.28 2.58 0.64 3.73Launch Price 41.22 10.83 40.01 11.22 1.21 0.60Movie Adaptation 0.03 0.17 0.09 0.29 -0.06 -0.96
Table 2.2: Sample Properties Comparison
2.5 Results
2.5.1 Sales of Exclusive and Non-exclusive Titles
I now explorer the differences in sales of exclusive and non-exclusive game
titles across different console platforms. Table 2.3 presents the results from
regressing logarithm of sales number of game titles on a dummy variable for
exclusive title and various controls.
The result in column (i) suggests that there is a large sales premium on
exclusive titles on average, roughly 20 percent. However, because of the pres-
ence of indirect network effects, the sales of consoles have large impact on the
37

(i) (ii) (iii) (iv)Dependent variable: logarithm of game sales
Exclusive 19.78 12.25 8.32 7.76(2.92) (1.85) (1.24) (1.17)
Review Scores - - 4.06 4.57(0.62) (0.53)
ln(Platform Sales) - 2.43 2.59 2.32(0.17) (0.40) (0.56)
Launch Price - - 1.02 0.87(1.43) (1.10)
R2 0.015 0.131 0.663 0.714Platform Controls No Yes Yes YesAdditional Game Characteristics No No Yes YesTime Controls No No No YesN 974 974 643 643
Table 2.3: Effects of Exclusivity on Sales
sales of compatible games. For example, the popularity of Wii’s games may
largely be the result of the consoles’s own popularity. Therefore, in column
(ii), I include console characteristics into the regression. As expected, console
sales is a significant factor contributing to the game sales and the magnitude
of sales premium of exclusive titles then goes down to about 12 percent, but
is still statistically significant. Furthermore, Table 2 suggests that there is
difference in the observed characteristics of exclusive and non-exclusive game
titles. In particular, exclusive titles on average have higher review scores than
non-exclusive titles, suggesting that the exclusive game titles may have higher
quality. If such difference is not controlled for, then the dummy variable for
exclusivity will be biased since it will also capture the effects of these features.
Thus, in column (iii), I further include additional game characteristics into the
regression. The review scores have significant and positive impact on sales as
expected, and the effect of exclusivity on sales further goes down to about 8
percent, but is still highly significant. Finally, the sales of both consoles and
games are highly seasonal, with much higher volume occurs during summer
(July and August) and the holiday season (November and December) since
38

the majority of the consumers in the video game market are teenagers. At
the same time, developers generally choose the same time to launch their “big
hit” titles in order to achieve maximum sales. Consequently, such observation
indicates that time effects may be another factor that potentially affects the
sales performance. In order to control for such impact, I include dummies for
the month of the launch date into the regression, and the result is showed in
column (iv). The effect of exclusivity slightly goes down to approximately 7.7
percent.
Overall, the results in Table 2.3 provides the evidence that exclusive video
game titles have higher sales relative to non-exclusive titles after controlling
for various factors that affects sales. The casual interpretation of the results
relies on random assignment to console conditional on time, console and game
characteristics. However, random assignment is a strong assumption in the
context, and there is reasonable doubt that such assignment may not be held
in the data used in this paper. Therefore, we need to deal with selection
problem.
2.5.2 Selection
The previous section documents the difference in sales outcomes for exclusive
and non-exclusive game titles. A major concern for the results is the possible
platform selection issue. First, although I have controlled for a rich set of
observed game characteristics, it is still possible that there are unobserved
characteristics that are correlated with the choice regarding exclusivity. If this
is the case, the estimates of the effect of exclusivity will be biased without
correction. Second, it is also possible that attributes of game publishers may
affect their choice in terms of console availability, which, in turn, may affect
the sales performance of games. Now, I will discuss these two issues in detail.
Unobserved Game Title Characteristics
As shown in Table 2.2, there are differences in the observed characteristics
between exclusive and non-exclusive titles. These different observed charac-
teristics might suggest that the unobserved game characteristics are different
39

between the two types of game titles as well. To account for this issue, I ex-
amine a sample of game titles in series in the dataset. The game titles in one
series share the same game engine, architecture, genre and controls, with only
minor modifications. For example, EA’s FIFA series publish a new game title
every year (e.g. FIFA 06 for 2006, 07 for 2007), and these titles are essentially
same games with updated team squads each year. As a result, as long as
the unobserved characteristics in the same series are constant over time, then
including a series fixed effect will control for the unobserved characteristics.
However, there are series whose titles are different at least in one major as-
pects. For example, game titles in Final Fantasy series are vastly different in
terms of story, game architecture, and genres. Therefore, I exclude such series
from the sample used in this section. In the sample, there are 15 exclusive
series with 40 titles, 13 non-exclusive series with 98 titles, and 5 mixed series
(series with both exclusive and non-exclusive titles in different years) with 21
titles. In total, there are 33 series and 159 titles.
In Table 2.4, I present the result using this sample. The first column shows
the results with game series fixed effects. At the same time, for comparison,
I also run the regression using the same sample as in the previous section
by dropping the fixed effects and controlling for differences using game title
characteristics alone. The results are presented in the second column. In all
regressions I include month, year and holiday dummy variables, a linear time
trend, and console platform characteristics.
The results with series fixed effects and with characteristics controls are
very similar. The exclusive titles on average have around 6 percent higher
sales. In addition, the estimates are also very close to the results from the
full sample in magnitude. There are two folds of implications from the result.
First, the result suggests that there is virtually no bias in the estimates due
to the possible fixed unobserved game effect over time. Second, since the
estimates using the full and sub-sample are very close, it highlights that the
sample of series game titles is representative. Therefore, the unobserved game
characteristics do not play a significant role in determining the sales.
40

(i) (ii)Dependent variable: logarithm of game sales
Exclusive 6.22 6.56(1.44) (1.69)
Review Scores 5.06 4.77(1.22) (0.66)
ln(Platform Sales) 2.47 3.02(0.29) (0.36)
Launch Price 1.82 1.07(2.43) (0.88)
R2 0.763 0.684Game Series Fixed Effect Yes NoGame Characteristics No YesConsole Characteristics Yes YesTime Controls Yes YesN 159 159
Table 2.4: Effects of Exclusivity on Sales: Unobserved Characteristics
2.5.3 Selection of Game Publishers
Video games are designed by game developers and publishers. Therefore, the
unobserved developer/publisher characteristics may affect both the sales and
console platform choice. In this case, the estimates will be biased. If a game
developer are more capable or even specialized to develop a certain types of
games (shooting, family, etc), it may choose to make the games exclusive on
a particular console since the consumer base of each console is differentiated.
For example, most of Nintendo’s Wii buyers are children and casual players,
who mostly play family oriented games. Therefore, game developers who are
developing family games may choose to make the game on Wii exclusively
and adopt specialized effects accordingly to better attract the consumers. At
the same time, such games would potentially have higher sales due to its
developer’s capability and specialization. Without appropriate controls for
such selection, the effect of exclusivity on sales would be overestimated. I
adopt two ways to deal with such selection issues.
41

First-party and Third-party Exclusive Titles
The first approach to quantify the effect of possible unobserved developer
characteristics is to compare the sales of first-party titles and the sales of
third-party, but exclusive titles. First-party titles are developed or published
by console manufacturers, and are naturally exclusive. Such comparison is
inspired by Hendel, Nevo and Ortalo-Magne (2009), who compare the trans-
action prices of houses sold by owners to the transactions of realtors’ own
houses. They use such method to quantify the effect of possible selection
problem that more patient sellers tend to sell their houses by their own and
they are also able to have higher sale prices due to their patience. In the
context of video games, I assume that, on average, console manufacturers are
no worse at developing games on their own consoles than the independent de-
veloper. Therefore, the effect of console manufacturers developing or selling
the first-party titles represents an upper bound on the impact of developer
selection.
The results are shown in Table 2.5. “Exclusive” is a dummy variable that
equals one for all exclusive titles, which include both first-party and third-
party titles. “Third-party Exclusive” is a dummy variable that equals one for
third-party exclusive titles, so its coefficient measures directly the difference
between the sales performance of third-party exclusive titles and the first-party
console manufacturer titles.
I find that exclusive titles do have the premium in sales. However, there
is no statistically significant difference between first-party and third-party ex-
clusive game titles.
Developer Fixed Effects
Another approach to deal with possible selection issue is to include fixed effects
for developers. Therefore, I use a sample in which every game developer have
supplied both exclusive and non-exclusive titles, and use the observed multiple
titles to control for unobserved developer heterogeneity. The sample contains
53 developers and 371 game titles. The results are presents in Table 2.6, in
which I compare the results with and without developer fixed effects. All the
42
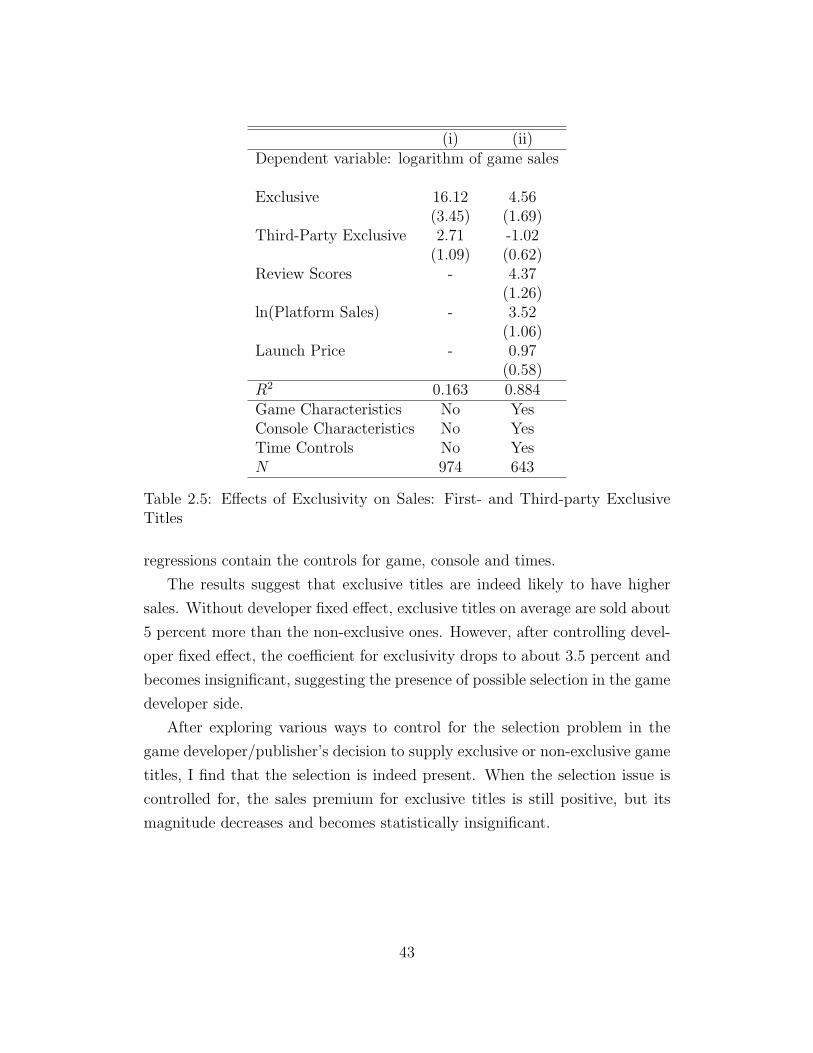
(i) (ii)Dependent variable: logarithm of game sales
Exclusive 16.12 4.56(3.45) (1.69)
Third-Party Exclusive 2.71 -1.02(1.09) (0.62)
Review Scores - 4.37(1.26)
ln(Platform Sales) - 3.52(1.06)
Launch Price - 0.97(0.58)
R2 0.163 0.884Game Characteristics No YesConsole Characteristics No YesTime Controls No YesN 974 643
Table 2.5: Effects of Exclusivity on Sales: First- and Third-party ExclusiveTitles
regressions contain the controls for game, console and times.
The results suggest that exclusive titles are indeed likely to have higher
sales. Without developer fixed effect, exclusive titles on average are sold about
5 percent more than the non-exclusive ones. However, after controlling devel-
oper fixed effect, the coefficient for exclusivity drops to about 3.5 percent and
becomes insignificant, suggesting the presence of possible selection in the game
developer side.
After exploring various ways to control for the selection problem in the
game developer/publisher’s decision to supply exclusive or non-exclusive game
titles, I find that the selection is indeed present. When the selection issue is
controlled for, the sales premium for exclusive titles is still positive, but its
magnitude decreases and becomes statistically insignificant.
43
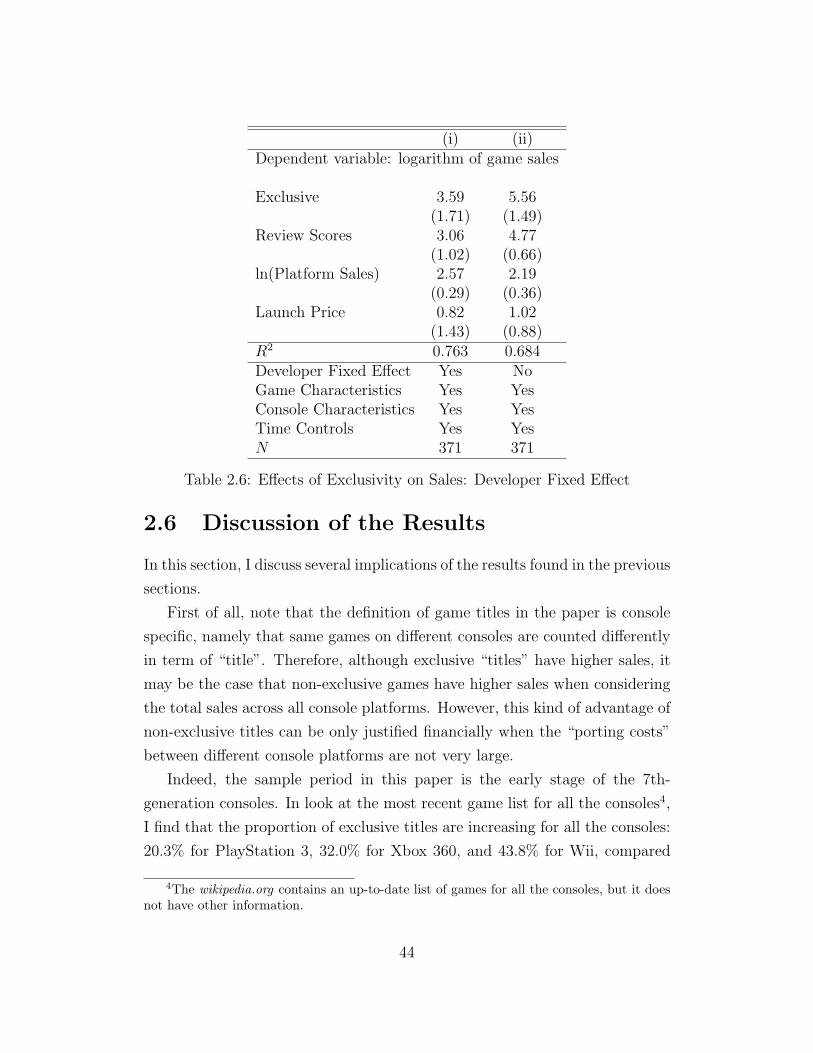
(i) (ii)Dependent variable: logarithm of game sales
Exclusive 3.59 5.56(1.71) (1.49)
Review Scores 3.06 4.77(1.02) (0.66)
ln(Platform Sales) 2.57 2.19(0.29) (0.36)
Launch Price 0.82 1.02(1.43) (0.88)
R2 0.763 0.684Developer Fixed Effect Yes NoGame Characteristics Yes YesConsole Characteristics Yes YesTime Controls Yes YesN 371 371
Table 2.6: Effects of Exclusivity on Sales: Developer Fixed Effect
2.6 Discussion of the Results
In this section, I discuss several implications of the results found in the previous
sections.
First of all, note that the definition of game titles in the paper is console
specific, namely that same games on different consoles are counted differently
in term of “title”. Therefore, although exclusive “titles” have higher sales, it
may be the case that non-exclusive games have higher sales when considering
the total sales across all console platforms. However, this kind of advantage of
non-exclusive titles can be only justified financially when the “porting costs”
between different console platforms are not very large.
Indeed, the sample period in this paper is the early stage of the 7th-
generation consoles. In look at the most recent game list for all the consoles4,
I find that the proportion of exclusive titles are increasing for all the consoles:
20.3% for PlayStation 3, 32.0% for Xbox 360, and 43.8% for Wii, compared
4The wikipedia.org contains an up-to-date list of games for all the consoles, but it doesnot have other information.
44

to 16.6%, 24.8%, and 32.5%, respectively. It suggests that there is indeed
an increasing incentive for game developers or publishers to supply exclusive
titles.
Second, the regression results suggest that there is selection of game devel-
opers into console platforms. Such selection indicates that there is difference
in the characteristics between developers who supply exclusive titles and those
who supply non-exclusive titles. Therefore, the further analysis is needed to
address the strategies behind the platform adoption decisions.
Finally, the results have different implications for different types of game
titles. The sales premium and “porting” costs are the incentives for game
developers to develop exclusive titles. However, the sales premium alone is
not high enough to attract independent developers or publishers to publish
“blockbuster” titles exclusively on one particular platforms. Therefore, con-
sole manufacturers have to give extra incentives to them to have independent,
high quality game titles. Another way to tackle this problem for console man-
ufacturers is to develop high quality titles by their own, and it is supported
by the fact that the proportion of first-party titles have been increasing over
time for all platforms.
45

Chapter 3
The Demand for Home Video
Game Console: The Regression
Discontinuity Approach
3.1 Introduction
The standard framework of demand estimation now is the discrete-choice mod-
els of demand by Berry (1994) and Berry, Levinsohn and Pakes (1995). The
major attraction of such discrete-choice models of demand is that they treat
products as the set of characteristics, and therefore solves the problem of di-
mensionality of linear expenditure model (Stone, 1954). At the same time,
however, since some product characteristics are observed only by consumers,
but not by econometrician (e.g. product reputation, brand images, etc), and
they are summarized into the error term, which is correlated with the product
prices, the problem of price endogenity arises. Therefore, the discrete-choice
models rely on proper exogenous instrumental variables to deal with the en-
dogenity of prices to obtain the correct price coefficients.
The standard, textbook instruments are variables that shift costs but are
uncorrelated with demand shocks, known as cost shifters. The problem with
this kind of instruments is that it is rarely the case that econometricians can
observe cost data fine enough so that the cost shifters will vary by brand.
46

Therefore, such instruments usually can only identify parameters through time
variation but not variations within brands. The most popular identifying as-
sumption made to deal with the endogeneity problem is to assume that the
location of products in the characteristics space is exogenous or at least deter-
mined prior to the revelation of the consumers’ valuation of the unobserved
product characteristics. BLP (1995) derive an explicit set of instrumental
variables built on these assumptions. They use the observed product charac-
teristics (excluding price and other potentially endogenous variables), the sums
of the values of the same characteristics of other products offered by that firm,
and the sums of the values of the same characteristics of the products offered
by other firms. However, there are some plausible situations in which such as-
sumption will not hold. For example, as in our paper, video game consoles are
better characterized by the observed attributes, such as memory size and CPU
speed, since bigger memory size and higher CPU speed usually mean higher
overall performances, and therefore are more appealing to consumers. Finally,
in case of time series data in which same markets are observed repeatedly for
some periods, unless the products offered in different periods are different or
products are updated frequently, there is little or no variation between periods
in these instruments.
The last set of instrumental variables are obtained from the idea that, after
controlling brand-specific effects and market characteristics, the unobserved
market-specific valuations of the product are independent across markets but
are allowed to be correlated within a market over time (Hauman 1996, Nevo
2000). Under this assumption, the prices of the brand in other markets are
valid instruments since prices in different markets are correlated due to the
common costs, but are uncorrelated with the unobserved market-specific val-
uations of the product. Still, there are situations in which such assumptions
do not hold. For example, in the video game console market, a worldwide
popular game on one console will increase the unobserved valuation of that
particular console in all market, and therefore the independent assumption
will be violated.
Since instrumental variable method has such limitations, in this paper, we
propose an alternative method to identify the price coefficient without using
47

instrumental variables in the discrete choice models. Instead, we exploit the
unique pattern of price adjustment of products, home video game consoles,
in our sample and identify the price coefficient nonparametrically. The main
idea comes from the fact that, unlike other home electronic devices, such as
PC and digital camera, the video game consoles have much longer life span,
in average over five years, and the retail prices are primarily in line with
the manufacturer suggested retail prices (MSRP). At the same time, console
manufacturers reduce the console’s prices periodically during its life span. As
a result, the console prices exhibit the kinky, down-ward trend with very little
dispersion. Since the periodical price cut creates discontinuity in the price the
consumers face around the cutoff point, consumers who purchased a particular
console just before and after the price cut should have very similar underlined
demand for it after controlling other observable characteristics, such as indirect
network effect (i.e. effects of variety of compatible games on the demand for
consoles), as the specification of the console remains the same throughout its
life cycle. Yet these consumers faced different prices. Therefore, the differences
in demand, reflected by the changes in the market share, should be driven
primarily by the change in prices after controlling other observable.
Our method is in essence a regression discontinuity design (RDD) method.
The recent development in the program evaluation literature shows that RDD
method can be used to obtain reliable estimate of the causal effects (Hann,
Todd and Van Der Klaauw (2001), Imbens and Lemieux (2007)). The main
advantage of RDD method in this context is that it could identify the causal
effects (in this paper, the effects of prices on demand) under much weaker
assumptions and does not require instrumental variables.
The RDD method has recently become a standard evaluation framework
for estimating the causal effects with non-experimental data. The key feature
of RDD method is that treatment is given if and only if an observed covari-
ant crosses a known threshold. Thus under weak smoothness conditions, the
probability of receiving treatment near the cut-off behaves as if random. This
feature helps to identify the causal effect without imposing arbitrary exclusion
restrictions, functional forms, or distributional assumptions on error terms.
Hahn, Todd, and van der Klauuw (2001) and Porter (2003) link RD design
48

to the program evaluation literature and formally establish weaker conditions
for identification. In addition, RD design method has been used in a number
of empirical applications to successfully estimate the causal effect using non
randomized data, such as the effects of class size on students’ performance
(Angrist and Lavy 1999) and the effects of financial aid on college enrollment
(Van der Klauuw 2003). In addition, Lee (2003), Lemieux and Milligan (2004),
and Chen and Van der Klauuw (2004), exploit randomized variation near the
point of discontinuity to solve selection bias.
Our paper is also related to the small but growing literatures about the
application of RDD method in industrial organization and marketing science.
Huang and Tan (2009) use RDD method to estimate the demand for credit
using a unique dataset from a credit card issuer, who gives consumers different
interest rates based on the cutoff points of consumers’ credit scores. Hartman,
Nair and Nayarana (2009) use RDD method to estimate the effects of target
marketing, in which observed discreteness and kinks in the heuristics are used
for distinguish consumers. They present two empirical applications. The first
application is to measure the effects of casino’s email promotions based on
consumers’ average daily won; the second is to quantify the effects of a B2C
company’s direct mail promotion based on thresholds of expected response
rate.
3.2 The Market Background and Data
Our data on console sales and the number of available game titles come from
the NPD Group, a market research firm. NPD Group collects data from ap-
proximately two dozen of the largest game retailers in the United States. These
retailers account for approximately 65% of the U.S. market; from this data,
NPD formulates estimates of figures for the entire U.S. market. However, these
estimates do not take into account sales to rental outlets such as Blockbuster.
We have monthly data for the period from March 2005 to June 2008. Since
our alternative identification strategy relies on the presence of “discontinuity”
in the console prices, we include 4 consoles, PlayStation Portable, PlayStation
2, and PlayStation 3 from SONY and Xbox 360 from Microsoft, because they
49

have major price cut during out sample period. We exclude consoles from
Nintendo, since their prices stayed the same throughout our sample period.
We define the potential video game market as the number of people who
had a TV but did not have a video game system prior to their purchase.
The number of U.S. households with at least one television set in the study
period comes from the Census Bureaus 2003 Statistical Abstract of the United
States. The size of the installed base by console and by month is obtained by
the cumulative console sales up to the previous month. The installed base at
the beginning of 2003 is obtained from Clements and Ohashi (2004), which
reports the installed base of all major consoles in 2003.
We use manufacturer suggested retail prices (MSRP) as our price variable
and adjust it using CPI. Although the real transaction prices are more desir-
able, it is very difficult to obtain and, in fact, the real transaction prices of the
consoles are very close to the MSRP1.
The Table 3.2 summarizes the consoles that are used in the paper. SONY,
the legendary Japanese firm, maintains the full product line producing both
desktop and portable consoles, while Microsoft, who just entered into the
market in 2002, only has desktop console on the market. At the same time,
SONY, which had been the dominant firm for many years in 1990s, keeps two
desktop consoles, the older PlayStation 2 and the latest PlayStation 3, on the
market due to its advantages in production2.
As can be seen in the Table 3.2, Microsoft and SONY, as manufacturers
of other electronic devices, lowered their console prices periodically since the
production costs fell across time. At the same time, prices affect the sales of
the consoles significantly. PlayStation 3, although most advanced, is the most
1Clements and Ohashi (2003) divide total revenue from console sales by total unit ofsales to calculate the unit prices, and find that the calculated prices are very close to MSRP.Prieger and Hu (2007) argue that retailers, even as powerful as Walmart, nearly never cutprices of consoles under MSRP, instead, the most frequently used promotion method byretailers is to bundle selected games to the sales of consoles. Such effects can be capturedby the error term ξjt
2SONY is the only manufacture that make its own production of major parts of itsconsoles, such as CPU and GPU. In contrast, Microsoft, for example, sources the designand production of its CPU to Intel, while Nintendo sources the work to IBM. Therefore,the supply of Microsoft and Nintendo’s consoles is constrained by the capacity of upstreamfirm, like Intel and IBM, whose business is mainly in PC industry.
50
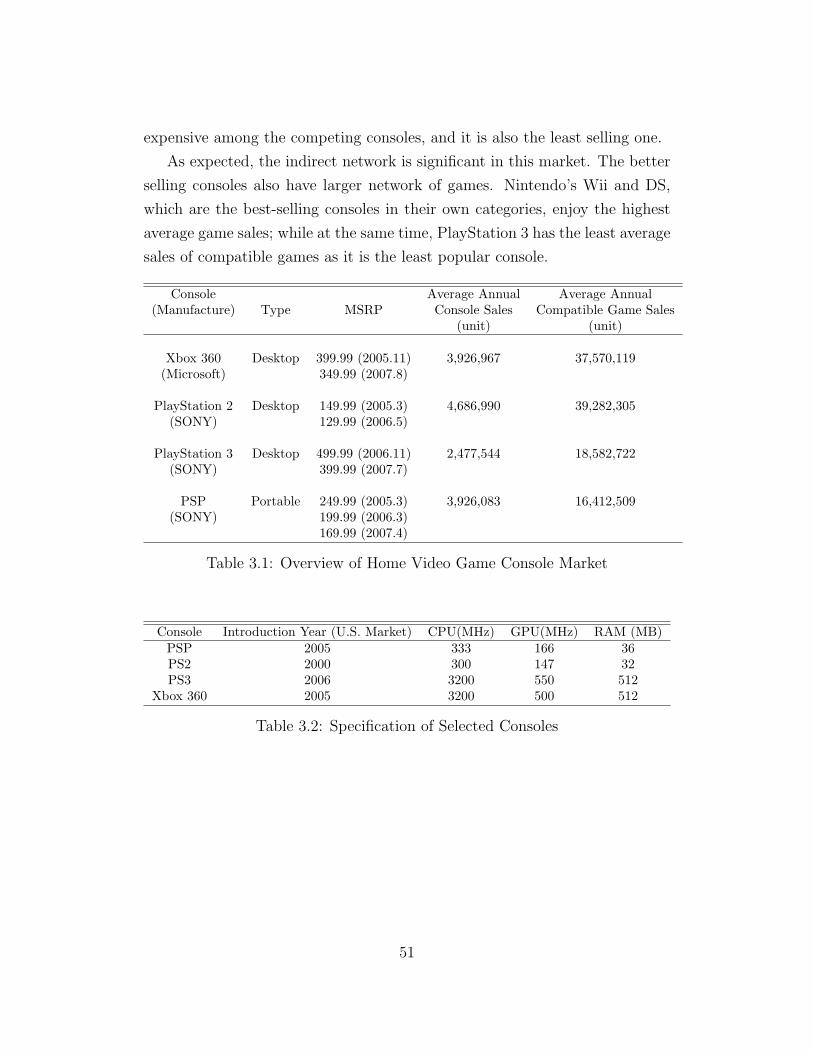
expensive among the competing consoles, and it is also the least selling one.
As expected, the indirect network is significant in this market. The better
selling consoles also have larger network of games. Nintendo’s Wii and DS,
which are the best-selling consoles in their own categories, enjoy the highest
average game sales; while at the same time, PlayStation 3 has the least average
sales of compatible games as it is the least popular console.
Console Average Annual Average Annual(Manufacture) Type MSRP Console Sales Compatible Game Sales
(unit) (unit)
Xbox 360 Desktop 399.99 (2005.11) 3,926,967 37,570,119(Microsoft) 349.99 (2007.8)
PlayStation 2 Desktop 149.99 (2005.3) 4,686,990 39,282,305(SONY) 129.99 (2006.5)
PlayStation 3 Desktop 499.99 (2006.11) 2,477,544 18,582,722(SONY) 399.99 (2007.7)
PSP Portable 249.99 (2005.3) 3,926,083 16,412,509(SONY) 199.99 (2006.3)
169.99 (2007.4)
Table 3.1: Overview of Home Video Game Console Market
Console Introduction Year (U.S. Market) CPU(MHz) GPU(MHz) RAM (MB)PSP 2005 333 166 36PS2 2000 300 147 32PS3 2006 3200 550 512
Xbox 360 2005 3200 500 512
Table 3.2: Specification of Selected Consoles
51

3.3 Model and Estimation
3.3.1 Model of Demand for Video Game Consoles
We assume that a representative household maximizes the following utility
function at time t by choosing console j among Jt + 1 alternatives, one of
which is the option of not purchasing a console:
ujt = β0 +∑k
xjtkβk + αxjt + ω ln(Njt) + ξjt + εjt (3.1)
where ujt is a representative households utility from choosing console j at
time t. pjt is the price of console j at time t (adjusted by the CPI), xjtk is
the console characteristic that consumers value, and β0 is the constant term.
The term ln(Njt) captures the indirect network effect, and Njt is the number
of compatible game titles available on console j up to time t. We estimate
only an indirect network effect, not a direct effect. There might be a direct
network effect in the video game market if consumer utility, and thus console
demand, depended on the number of consumers who own the same console.
As pointed out by Clements and Ohashi (2005), this would be the case if, for
example, console users derived value from borrowing games from other users
of the same console. However, with the country-level data as in our paper, the
indirect effect should be of more significance since the direct effects are mainly
confined into the region level. ξjt is the unobserved (by the econometrician,
but observed by consumers) product characteristic. Such unobserved error
also reflects other factors that lead consumers to purchase a particular console
that are not present in the data. A process of building console image, perhaps
partly stimulated by advertising, may be one example of such a factor. εjt is
a mean-zero error term.
Logit Demand Model
If εjt is a mean-zero error term and is assumed to be i.i.d and distributed
according to Type I extreme-value distribution. The model is then the (ag-
gregate) logit model. Therefore, the market share of console j in period t can
52
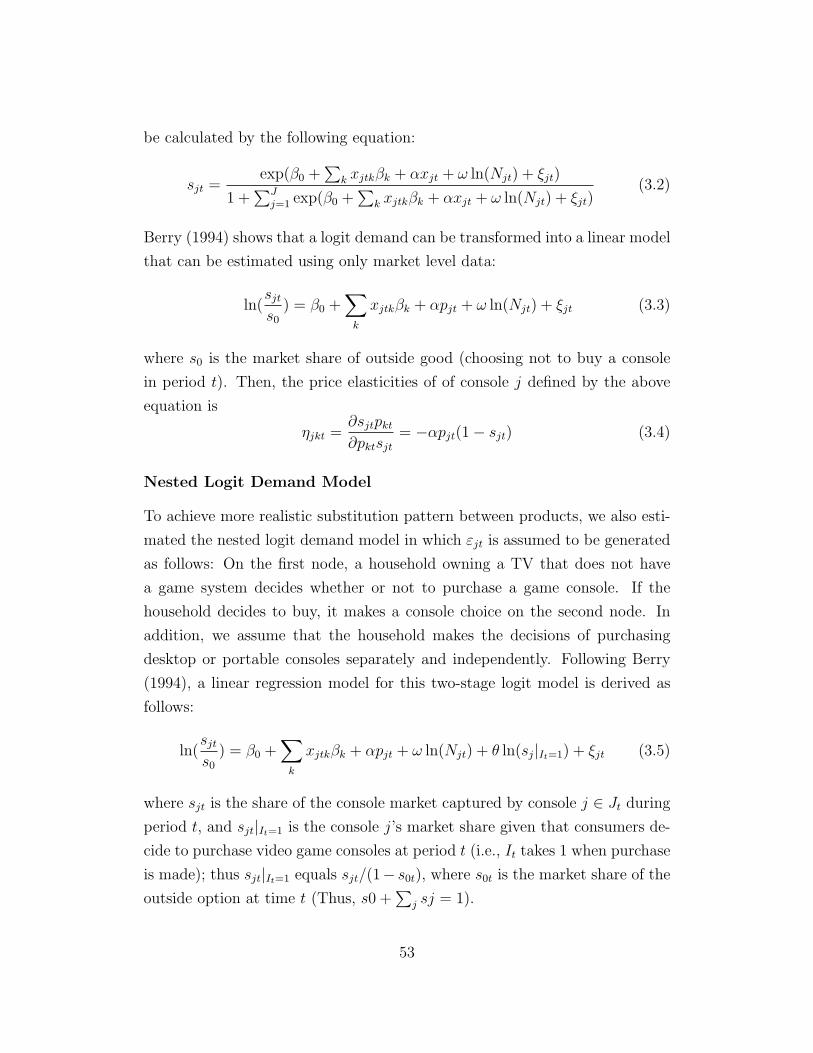
be calculated by the following equation:
sjt =exp(β0 +
∑k xjtkβk + αxjt + ω ln(Njt) + ξjt)
1 +∑J
j=1 exp(β0 +∑
k xjtkβk + αxjt + ω ln(Njt) + ξjt)(3.2)
Berry (1994) shows that a logit demand can be transformed into a linear model
that can be estimated using only market level data:
ln(sjts0
) = β0 +∑k
xjtkβk + αpjt + ω ln(Njt) + ξjt (3.3)
where s0 is the market share of outside good (choosing not to buy a console
in period t). Then, the price elasticities of of console j defined by the above
equation is
ηjkt =∂sjtpkt∂pktsjt
= −αpjt(1− sjt) (3.4)
Nested Logit Demand Model
To achieve more realistic substitution pattern between products, we also esti-
mated the nested logit demand model in which εjt is assumed to be generated
as follows: On the first node, a household owning a TV that does not have
a game system decides whether or not to purchase a game console. If the
household decides to buy, it makes a console choice on the second node. In
addition, we assume that the household makes the decisions of purchasing
desktop or portable consoles separately and independently. Following Berry
(1994), a linear regression model for this two-stage logit model is derived as
follows:
ln(sjts0
) = β0 +∑k
xjtkβk + αpjt + ω ln(Njt) + θ ln(sj|It=1) + ξjt (3.5)
where sjt is the share of the console market captured by console j ∈ Jt during
period t, and sjt|It=1 is the console j’s market share given that consumers de-
cide to purchase video game consoles at period t (i.e., It takes 1 when purchase
is made); thus sjt|It=1 equals sjt/(1− s0t), where s0t is the market share of the
outside option at time t (Thus, s0 +∑
j sj = 1).
53

The price elasticities of console j defined by the nested logit demand model
is then
ηjt =∂sjt∂pjt
=α
1− θpjt[1− θ(sjt|It=1)− (1− θ)sjt] (3.6)
3.3.2 IV Estimation
The endogeneity problem in equation (3) and (5) arises since the unobserved
product characteristic ξjt is correlated with price pjt, which, if uncorrected,
would lead to inconsistence of the price coefficient α. One common strategy
to identify the price coefficients is to exploit the rival product attributes and
the competitiveness of the market. All other things being equal, products with
closer substitutes tend to have relatively lower prices. As suggested by Berry
(1994) and BLP (1995), the observed attributes of other products are valid
instruments for prices. However, since we estimate the demand of consoles
separately by brand, this kind of instrument does not have variation across
the sample periods. Therefore, we use another kind of instruments known
as “cost shifters”. The first set of the instruments of this kind includes the
exchange rates of Japanese Yen, Korea Won, and Taiwanese Dollar. These
three countries are the biggest producer of console CPU, memory, graphic
card/GPU, and hard drives, respectively. The variation of the exchange rates
will affect the cost of console, but not on the demand since the prices of the
console in dollar have been very stable. However, these instruments are an
industry aggregate and do not vary by console model, the use of instruments
thus only helps identify the demand through the variation of the instruments
over time. The second set of the instruments of “cost shifters” is the technology
of semiconductor production adopted by each console manufacture, which is
measured by the minimum distance between two elements on the circuit in
terms of micrometer(µm). The closer the distance can achieve, the less the
cost of production of CPU and GPU is, and CPU and GPU account for a large
part of the production cost of the console.
The equations (3) and (5) then are estimated by the 2SLS method.
54
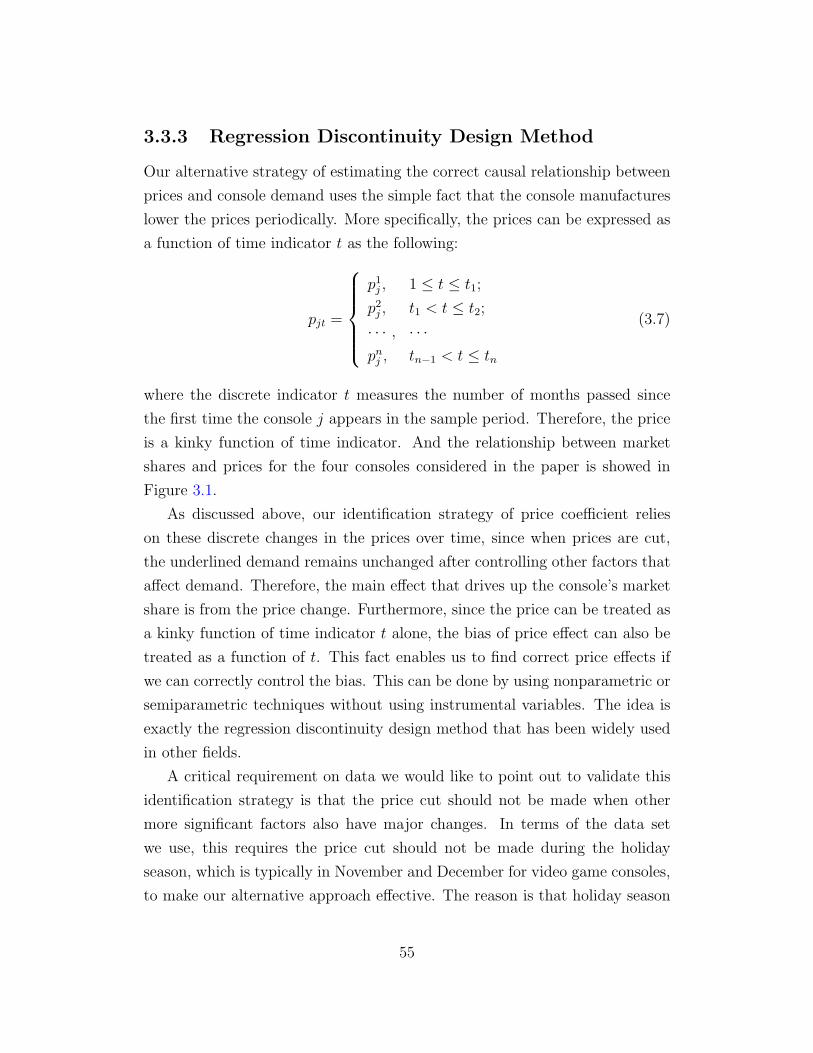
3.3.3 Regression Discontinuity Design Method
Our alternative strategy of estimating the correct causal relationship between
prices and console demand uses the simple fact that the console manufactures
lower the prices periodically. More specifically, the prices can be expressed as
a function of time indicator t as the following:
pjt =
p1j , 1 ≤ t ≤ t1;
p2j , t1 < t ≤ t2;
· · · , · · ·pnj , tn−1 < t ≤ tn
(3.7)
where the discrete indicator t measures the number of months passed since
the first time the console j appears in the sample period. Therefore, the price
is a kinky function of time indicator. And the relationship between market
shares and prices for the four consoles considered in the paper is showed in
Figure 3.1.
As discussed above, our identification strategy of price coefficient relies
on these discrete changes in the prices over time, since when prices are cut,
the underlined demand remains unchanged after controlling other factors that
affect demand. Therefore, the main effect that drives up the console’s market
share is from the price change. Furthermore, since the price can be treated as
a kinky function of time indicator t alone, the bias of price effect can also be
treated as a function of t. This fact enables us to find correct price effects if
we can correctly control the bias. This can be done by using nonparametric or
semiparametric techniques without using instrumental variables. The idea is
exactly the regression discontinuity design method that has been widely used
in other fields.
A critical requirement on data we would like to point out to validate this
identification strategy is that the price cut should not be made when other
more significant factors also have major changes. In terms of the data set
we use, this requires the price cut should not be made during the holiday
season, which is typically in November and December for video game consoles,
to make our alternative approach effective. The reason is that holiday season
55

7013
510
0P
rice
−7
−5.
5−
4ln
(sha
re)
0 10 20 30 40Month
ln(share) Price
PSP
(a) PlayStation Portable
5580
Pric
e
−7
−5.
5−
4ln
(sha
re)
0 10 20 30 40Month
ln(share) Price
PlayStation 2
(b) PlayStation 2
180
215
250
Pric
e
−7
−5.
5−
4ln
(sha
re)
0 5 10 15 20Month
ln(share) Price
PlayStation 3
(c) PlayStation 3
160
185
210
Pric
e
−7
−5.
5−
4ln
(sha
re)
0 10 20 30Month
ln(share) Price
Xbox 360
(d) Xbox 360
Figure 3.1: Market Share and Price Trend
itself is a far more significant factor to boost demand and price cut during
the holiday season would have much weaker impact on sales. Since the price
effects are identified only by the changes in the market share around price
cut points in our alternative approach, such scenario would undermine the its
effectiveness seriously. Fortunately, all console manufacturers choose to cut
console prices not on the holiday seasons. Some choose to do it in the spring
or summer, while others choose to cut prices several months before the holiday
seasons. As reflected in figure 1, the most significant jump in market share
is corresponding to holiday seasons. However, for most consoles (PlayStation
Portable, PlayStation 3, and Xbox360), the demand, measured by the market
share, also increases significantly after the price cut, although the scale is much
less than the effect of holidays.
The type of regression discontinuity model in our paper is commonly re-
ferred to as Sharp Design, in which whether consumers purchase consoles be-
56

fore or after any the price cut solely depends on the time indicator t. As argued
in Kahn, Todd and Van der Klauuw (2001) and Van der Klauuw (2003), under
the local continuity assumptions, the local average treatment effect (the price
coefficient α) at each cut off points of time indicator t can be identified by:
α =limt↓ti E(S|t)− limt↑ti E(S|t)
Et↓ti(p|t)− Es↑ti(p|t)(3.8)
where ti is one cut-off point for the price changes.
An advantage of using regression discontinuity design method is that the
effect of prices can be identified under much weaker assumptions and no in-
strumental variables are needed. The only identification assumption needed
is the local continuity assumption. A limitation of regression discontinuity
design method is that only the effect at the cut off point can be identified.
We use the control function approach (Van der Klaauw (2003)) to control
for the biases. Namely, we add the correct specification of the control function
kj(t), which is console specific, to the equation (3) and (5):
ln(sjts0
) = β0 +∑k
xjtkβk + αxjt + ω ln(Njt) + kj(t) + υjt (3.9)
and
ln(sjts0
) = β0 +∑k
xjtkβk + αxjt + ω ln(Njt) + θ(sjt|It=1) + kj(t) + υjt (3.10)
where kj(t) is the conditional mean function E(ξjt|t) and υjt = E(ln(sjts0)|E, t]
. If the control function kj(t) is correctly specified, the estimate of α gives us
the correct causal effect of prices on the market shares.
This control function method requires a specification of the control function
kj(t). Incorrect specification of kj(t) leads to inconsistency, and hence the
control function should be as flexible as possible. In practice, most studies use
a semi parametric specification of the control function. For example, Van der
Klaauw (2002) uses a power series approximation for k(t) =∑J
j=1 ηjtj, where
the number of power function J is estimated by generalized cross validation
method. In our study, we use the approach described in Huang and Tan (2009)
57

to estimate the equation.
3.4 Estimation Result
The following tables present the estimation result and implied price elasticities
from IV estimation and regression discontinuity method.
58

Variable
Param
eter
Std
Error
Param
eter
Std
Error
Param
eter
Std
Error
Param
eter
Std
Error
Log
itModel
NestedLog
itModel
IVEstim
ation
RegressionDiscontinuity
IVEstim
ation
RegressionDiscontinuity
PSP
Price
-0.014
10.00
27-0.011
0.00
44-0.010
90.00
22-0.014
50.00
336
ln(G
ame)
0.62
20.15
00.64
50.09
50.38
30.08
920.42
20.07
78Holiday
0.49
30.20
50.60
40.12
60.90
30.12
50.82
60.10
4W
ithin
Share
6.79
0.72
85.74
60.62
7Con
stan
t-9.438
0.84
8-7.608
0.68
5-7.88
0.51
2-9.10
0.52
9PS2
Price
-0.021
10.00
60-0.010
40.01
17-0.017
80.01
33-0.005
030.00
909
ln(G
ame)
0.54
10.11
60.68
00.10
30.29
40.12
80.51
50.08
9Holiday
0.59
70.17
90.47
30.15
90.92
50.18
70.66
40.13
1W
ithin
Share
3.82
1.20
5.04
71.04
9Con
stan
t-10.39
80.69
3-8.730
1.20
3-7.16
1.19
-9.79
0.95
1PS3
Price
-0.002
60.00
50-0.006
10.00
36-0.000
988
0.00
185
-0.001
860.00
175
ln(G
ame)
0.54
00.17
00.69
30.14
70.26
90.06
800.43
00.07
9Holiday
0.78
80.17
10.39
50.16
40.98
40.06
650.78
80.08
5W
ithin
Share
8.83
0.78
97.56
0.85
7Con
stan
t-9.562
1.80
9-7.694
1.06
3-8.87
0.67
4-8.46
0.52
7Xbox360
Price
-0.018
0.00
80-0.029
0.00
60-0.017
0.00
54-0.009
0.00
4ln(G
ame)
0.64
10.17
90.66
50.13
60.39
10.09
000.26
50.11
8Holiday
0.61
00.18
50.81
30.14
70.88
80.09
560.98
00.13
1W
ithin
Share
4.24
0.50
63.84
0.68
6Con
stan
t-12.81
82.40
0-10.78
31.45
7-9.44
1.20
0-6.20
1.10
Tab
le3.3:
Estim
ationResult
59

First of all, observe that the coefficients of within share variable in the
nested logit specification are all greater than 1 for all consoles. This leads to
the fact that the own-price elasticity implied by equation (6) is positive. Other
research also reported similar result. For example, Prieger and Hu (2006) used
a very similar sample during 2002 and 2004 to estimate the demand for three
major desktop consoles in U.S. market (PlayStation 2, Xbox, GameCube),
and they also suggested that the nested logit model did not fit well for the
console demand equation. Instead they estimated the standard logit model.
On contrast, the earlier work by Clements and Ohashi (2005), which used a
sample of home video game console in U.S. market during 1994 and 2002,
set up and estimated a nested logit model. In their estimation, the nested
model fits the demand quite well. Since the main focus of this paper is the
comparison between instrumental variable and regression discontinuity design
approach, we now turn our pocus in the standard logit model, but keep in
mind that the restricted substitution pattern it implies.
The price coefficients from IV estimation are all significant, while the price
coefficients of PlayStation 2 and PlayStation 3 in the RD design regression
are not significant. This is probably due to the identification approach of
RD design approach. Since RD design approach relies on the variation of
market share around the point of price cut to identify the correct price effect,
it requires that the changes in market share before and after price cut should
be significant. However, the market share of PlayStation 2, as can be seen
from figure 1, remains flat during the whole sample periods, while the holiday
effect is the dominant factor that drives the sales up. Therefore, the price
coefficient under RD design approach is insignificant. At the same time, the
market share of PlayStation does increase after the price cut, however, the
increase is moderate, and actually, it decreases right after the increase. As a
result, the price effect also cannot be identified clearly under the RD design
approach.
Next, we calculate the own price elasticity implied by the standard logit
demand specification using estimated parameters from both IV and RD design
approach, and the results are shown in Table 3.4.
60

Logit ModelIV Estimation Regression Discontinuity
PSP -1.41 -1.11PS2 -1.15 -0.70PS3 -1.60 -3.75Xbox 360 -3.35 -5.40
Table 3.4: Implied Own Price Elasticity of Demand
The implied elasticities for all consoles are in the elastic region except the
one of PlayStation 2 under RD design approach. This is predictable since its
price coefficient under RD design approach is not significant. We compare the
result with other works to see whether our estimation result is reasonable, and
the work discussed above by Clements and Ohashi (2005), and Prieger and Hu
(2006) are natural benchmarks. Clements and Ohashi (2005) used a sample of
home video game console in U.S. market during 1994 and 2002 and estimated
the price elasticities of demand between -1.07 to -2.20. Prieger and Hu (2006)
used a sample during 2002 and 2004 to estimate the demand for three major
desktop consoles in U.S. market (PlayStation 2, Xbox, GameCube), and find
the implied elasticities are between -1.789 and -2.289. In particular, the esti-
mated price elasticity of PlayStation 2 in their sample is -2.20. Our estimated
elasticities of PlayStation 2 in the IV estimations are smaller in absolute value.
The difference is mainly due to the different sample period in our analysis. The
price of PlayStation 2 is lower in our sample than in Prieger and Hu’s since
we use a later sample. As the price elasticities implied by (4) are propor-
tional to prices, the elasticities estimated from our sample are smaller. Our
estimation of the price elasticity of Xbox 360 (-3.35 under IV and -5.40 under
RD design approach) is out of the range in the existed literatures (between -1
and -3). The reason for that is probably the much stronger reaction of Xbox
360’s market share to the price cut. After the price cut, the market share al-
most doubled, which is far more than other consoles. Therefore, such response
between market share and price cut leads to the higher price elasticity.
61

3.5 Conclusion
In this paper, we propose an alternative method to estimate the standard
discrete choice demand function to have correct price coefficient without us-
ing instrument variable. This method is essentially a regression discontinuity
design method. Using a data set of video game console sales in U.S. during
2005 to 2008, we estimate the demand function using both IV and RD design
approach. The estimation result is similar between two approaches, and the
calculated price elasticities are comparable to result in other similar works.
We show that the regression discontinuity method could be a very useful
tool to estimate the demand function. In many applications in empirical IO
and marketing, dealing with the endogeneity problem is usually one of the
most important parts of the analysis. Instrumental variable methods are the
most commonly used method. However, in many applications, it is very dif-
ficult to find good instruments. In this case, regression discontinuity design
method could provide an alternative way to solve the endogeneity problem.
Comparing with the IV method, RD design method has several advantages.
First, RD design method relies on much weaker assumptions about the under-
lining data generating process. The only assumption that RD design method
uses is the continuity assumption. In contrast, the IV method usually relies
on exclusion restriction assumptions. Second, many applications in empirical
IO and marketing could use the RD design method. Similar to the applica-
tion in this paper, in many cases, firms make decisions based on some cut off
rules. As long as the researchers have knowledge of the decision process, this
information could be used in RD design as illustrated in this paper.
62

Bibliography
Angrist, J. and Lavy, V. (1999): “Using Maimonides Rule toEstimate the Effect of Class Size on Scholastic Achievement”, QuarterlyJournal of Economics, 114: 533-575.
Armantier, O. and Richard, O. (2008): “Domestic AirlineAlliances and Consumer Welfare,” RAND Journal of Economics, 39,875-904.
Bayus, B. and Shankar, V. (2003): “Network Effects and Com-petition: An empirical Analysis of the Home Video Game Industry,”Strategic Management Journal, 24, 375-384.
Berry, S. (1994): “Estimating Discrete-Choice Models of ProductDifferentiation,” Rand Journal of Economics, 25, 242-262.
Berry, S. Levinsohn, J. and Pakes, A. (1998): “AutomobilePrices in Market Equilibrium,” Econometrica, 63, 841-890.
Chou, C. and Shy, O. (1990): “Network Effects without Net-work Externalities,” International Journal of Industrial Organization, 8,259-270.
Church, J. and Gandal, N. (1992): “Network Effects, Software Pro-vision and Standardization,” Journal of Industrial Economics, 40, 85-103.
Church, J. and Gandal, N. (1993): “Complementary NetworkExternalities and Technological Adoption,” International Journal ofIndustrial Organization, 11, 239-260.
Clements, M. and Ohashi, H. (2005): “Indirect Network Ef-
63

fects and the Product Cycle: Video Games in the U.S., 1994-2002,”Journal of Industrial Economics, 53, 515-542.
Derdenger, T. (2009): “Vertical Integration and Foreclosure ofComplementary Products,” Working Paper, Tepper School of Business,Carnegie Mellon University
Dranove, D. and Gandal, N. (2003): “The DVD vs. DIVXStandard War: Empirical Evidence of Network Effects and Preannounce-ment Effects,” Journal of Economics and Management Strategy, 11,239-260.
Economides, N. and Katsamakas, E. (2006): “Two-SidedCompetition of Proprietary vs. Open Source Technology Platforms andthe Implications for the Software Industry,” Management Science, 52,1057-1071.
Gowrisankaran, G. and Rysman, M. (2009): “Dynamics ofConsumer Demand for New Durable Good,” Working Paper, Depart-ment of Economics, Boston University.
Hahn, J., Todd, P and Van der Klaauw, W. (2001): “Identifica-tion and Estimation of Treatment Effects with a Regression DiscontinuityDesign,” Econometrica, 69: 201-209.
Hendel, I., Nevo, A and Ortalo-Magne, F. (2009): “TheRelative Performance of Real Estate Marketing Platforms: MLS versusFSBOMadison.com,” American Economic Review, 99: 1878-1898.
Huang, D and Tan, W. (2009): “Estimating the Demand forCredit Card: A Regression Discontinuity Approach,” Working Paper,Department of Economics, Stony Brook University.
Imbens, G., and Lemieux, T (2008): “Regression DiscontinuityDesigns: A Guide to Practice,” Journal of Econometrics, 142: 615-635.
Lee, R. (2009): “Vertical Integration and Exclusivity in Platformand Two-Sided Markets,” Working Paper, Stern School of Business, NewYork University.
64

Lin, L. and Kulatilaka, N. (2006): “Network Effects and TechnologyLicensing with Fixed Fee, Royalty, and Hybrid Contracts,” Journal ofManagement Information Systems, 23, 91-118.
Nair, H (2007): “Intertemporal Price Discrimination with Forward-looking Consumers: Application to the US Market for ConsoleVideo-games,” Quantitative Market Economics, 5, 239-292.
Nair, H. Chintagunta, P. and Dube, J. (2004): “EmpiricalAnalysis of Indirect Network Effects in the Market for Personal DigitalAssistants,” Quantitative Marketing and Economics, 12, 363-386.
Nevo, A. (2000a): “Measuring Market Power in the Ready-to-EatCereal Industry,” Econometrica, 69, 307-342.
Nevo, A. (2000b): “Mergers with Differentiated Products: TheCase of the Ready-to-Eat Cereal Industry,” Rand Journal of Economics,31, 395-421.
Ohashi, H. (2003): “The Role of Network Effects in the US VCRMarket, 1978 to 1986” Journal of Economics and Management Strategy,12 (4), 447C494.
Park, S. (2004): “Quantitative Analysis of Network Externalitiesin Competing Technologies: The VCR Case” Review of Economics andStatistics, 86(4) 937-945.
Petrin, A. (2002): “Quantifying the Benefit of New Products:the Case of Minivan,” Journal of Political Economy, 110, 705-729.
Prieger, J. and Hu, W.M. (2006): “An Empirical Analysis ofIndirect Network Effects in the Home Video Game Market” NETInstitute Working Paper 06-25.
Shapiro, C. and Varian, H. R. (1999): “Information Rules: AStrategic Guide to the Network Economy”, Harvard Business SchoolPress, 1999.
Van Der Klaauw, W. (2002): “Estimating the Effect of Finan-cial Aid Offers on College Enrollment: A Regression discontinuity
65

Approach,” International Economic Review, 43: 1249-1287.
Villas-Boas (2009): “An Empirical Investigation of the WelfareEffects of Banning Wholesale Price Discrimination,” Rand Journal ofEconomics, 40, 20-46.
66