estimating fire program management cost savings and risk reduction for the us forest
TRANSCRIPT
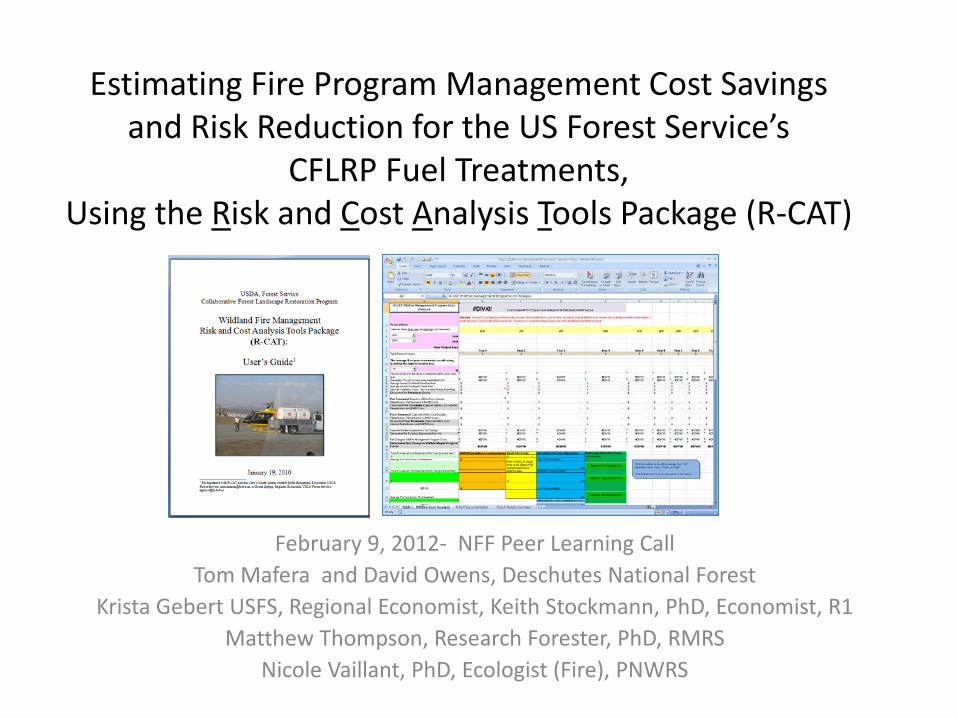
Estimating Fire Program Management Cost Savings and Risk Reduction for the US Forest Service’s
CFLRP Fuel Treatments, Using the Risk and Cost Analysis Tools Package (R-CAT)
February 9, 2012- NFF Peer Learning Call Tom Mafera and David Owens, Deschutes National Forest
Krista Gebert USFS, Regional Economist, Keith Stockmann, PhD, Economist, R1 Matthew Thompson, Research Forester, PhD, RMRS
Nicole Vaillant, PhD, Ecologist (Fire), PNWRS

Presentation Outline
• Why was RCAT developed, what is the point of the analysis? • Overview of pieces to the R-CAT analysis and who does them (Keith
Stockmann) • Brief description of FSIM and what is needed and lessons learned thus far
as to what works best (as far as getting information from the field) (Nicole Vaillant)
• Explanation of the work that needs to be done by the CFLR team (Deschutes)
• Description of FSIM results and how they are currently used in the analysis to compute suppression cost savings (Matt Thompson)
• Filling in the R-CAT spreadsheet (Keith Stockmann) • What to do with the analysis – exploring options (Krista Gebert) • Thinking about the "R" in R-CAT - how to include a risk component (Matt)-
using the work that Matt did on the Deschutes HVR • Conclusions (Keith Stockmann)

Why attempt to quantify impacts of fuel treatments on suppression costs?
• Background • Strategic Placement of Treatments • National pressure to contain wildfire costs • Needs based on comments • 2011 Cohesive Strategy
• Review of Act Language • Competition for limited funds • National Indicator?
• Demonstrating the value of fuel treatment investments at the landscape scale, does it affect fire management costs.

Title IV Language
• Highlighted excerpts relevant to economic analysis:
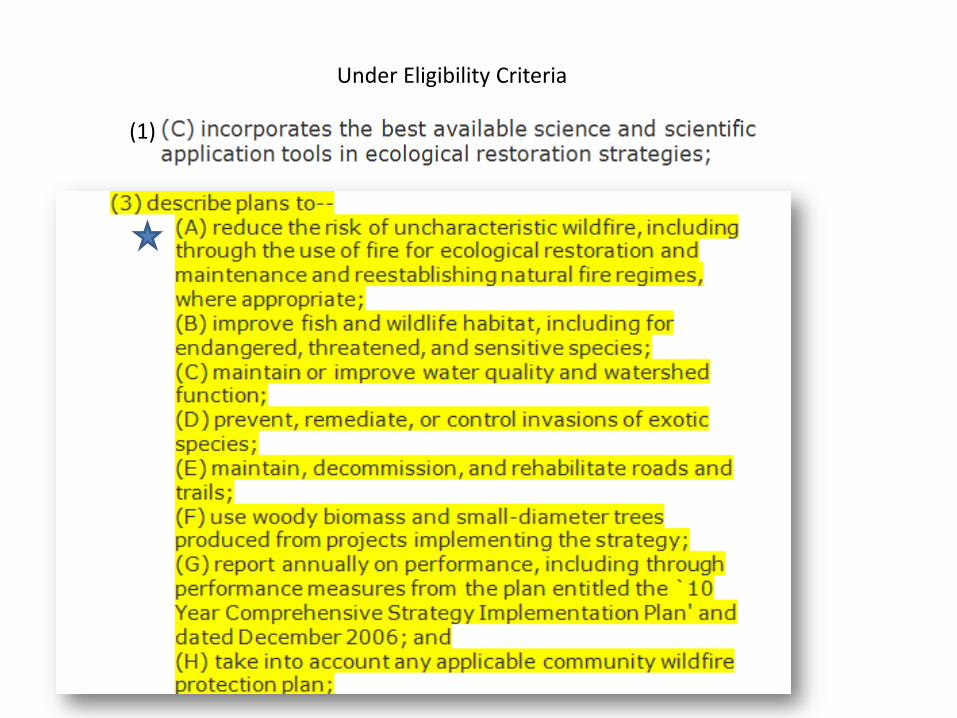
Under Eligibility Criteria
(1)
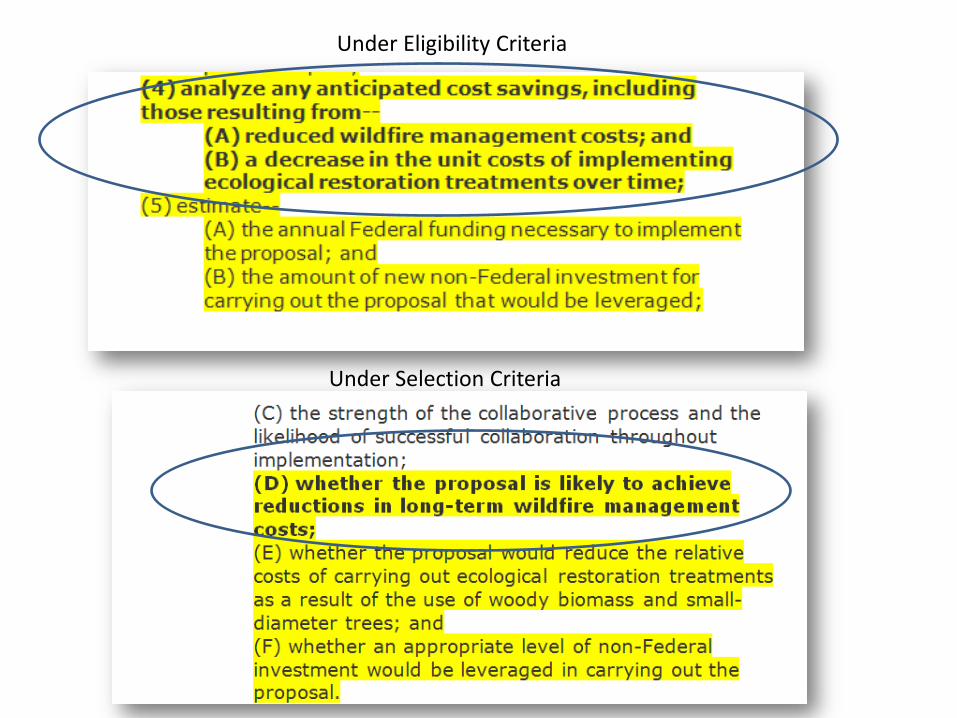
Under Eligibility Criteria
Under Selection Criteria
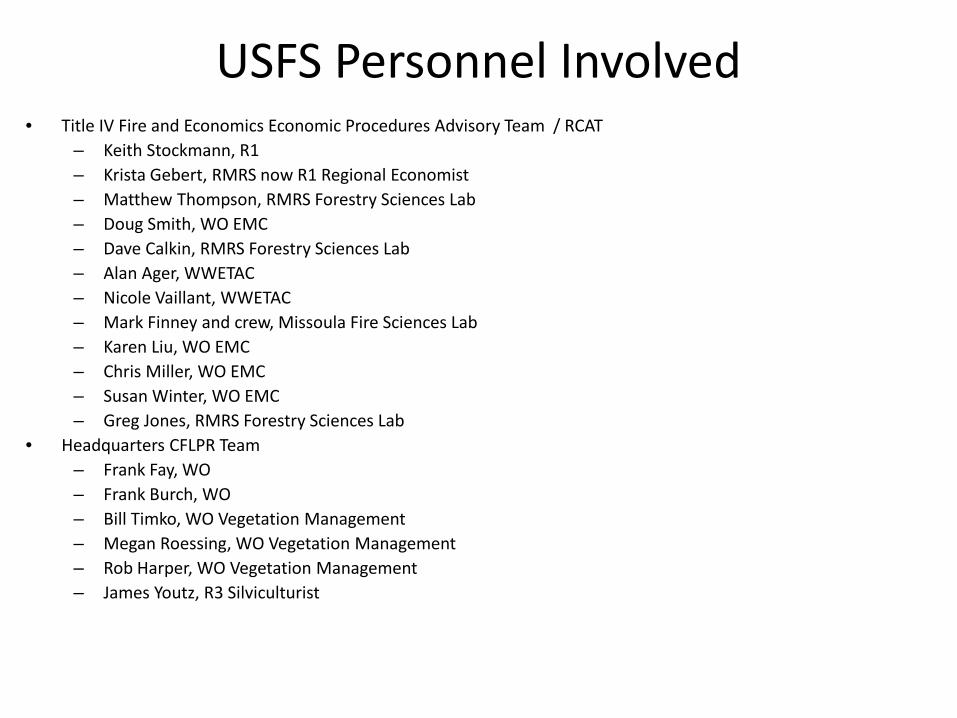
USFS Personnel Involved • Title IV Fire and Economics Economic Procedures Advisory Team / RCAT
– Keith Stockmann, R1 – Krista Gebert, RMRS now R1 Regional Economist – Matthew Thompson, RMRS Forestry Sciences Lab – Doug Smith, WO EMC – Dave Calkin, RMRS Forestry Sciences Lab – Alan Ager, WWETAC – Nicole Vaillant, WWETAC – Mark Finney and crew, Missoula Fire Sciences Lab – Karen Liu, WO EMC – Chris Miller, WO EMC – Susan Winter, WO EMC – Greg Jones, RMRS Forestry Sciences Lab
• Headquarters CFLPR Team – Frank Fay, WO – Frank Burch, WO – Bill Timko, WO Vegetation Management – Megan Roessing, WO Vegetation Management – Rob Harper, WO Vegetation Management – James Youtz, R3 Silviculturist
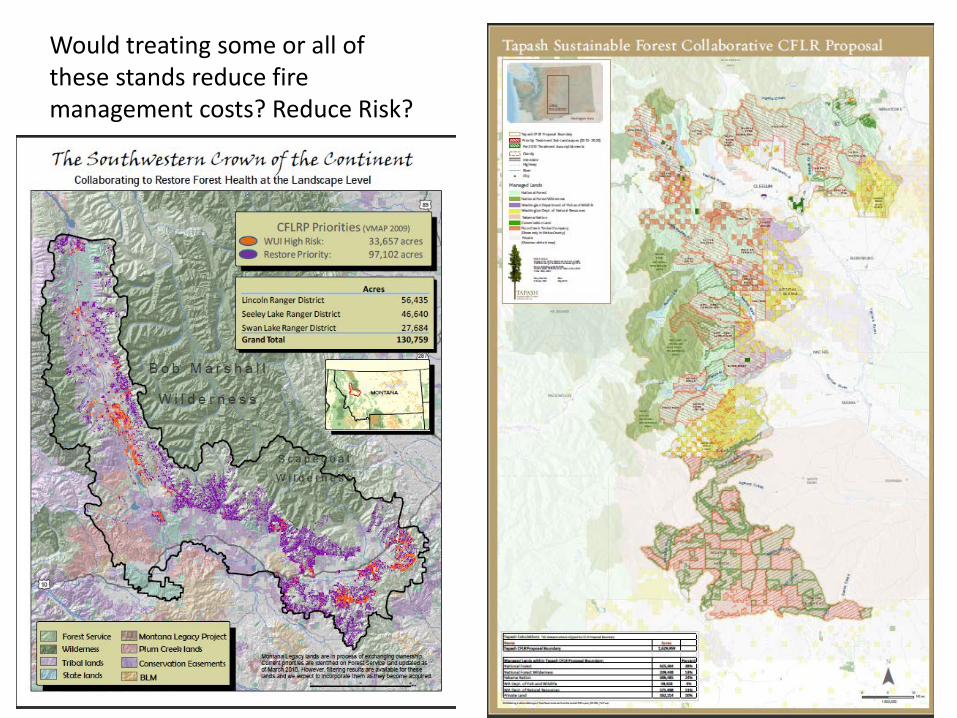
Would treating some or all of these stands reduce fire management costs? Reduce Risk?


Here’s what they are claiming when they ask for money
SW Crown: Wildfire will continue to be managed commensurate with seasonal fire activity, resource availability, and cost of suppression actions versus the potential environmental losses. Wildfire caused by natural ignitions will be actively managed where resource management objectives can be met. Fire managers will establish a strategy based on topography, weather, fuels, and seasonal conditions under which the fire will be managed…. Fire managers, due to reduced fire intensity, will have a greater array of tactical responses so that individual fires can be man-aged with variable levels of resources, potentially reducing costs.
Tapash: On the Tapash landscape 401,202 acres are in the dry forest type, making up 25% of the total landscape. Our proposal plans on returning 50% of these acres back into ecological balance where fire plays its natural role. The estimated cost of all proposed treatments is $50 million. Compare this to a 10 year average of 226,000 acres burned, at a cost of $206 million to suppress. When these projects are completed the estimated suppression costs will be 50% of current expenditures, based on the ability of line officers to take advantage of fire playing a more natural role in the ecosystem.
4FRI: The 4FRI mission to treat fuels strategically across the 2.4 million acre planning area would not only maximize restoration effectiveness, but enhance the ability to manage fires for restoration objectives, while simultaneously protecting values-at-risk and minimizing fire management costs.

Cost Category Category Mechanism Recommended R-CAT Evaluation Approach
Alternate Methods
Fuel treatment Net unit costs
decrease
Processing demand increases as volume offered spurs
processing infrastructure, byproduct value increases, net costs per acre decrease
Show increases in annual net treatment revenues through time in R-CAT
Spreadsheet tool
Fuel Treatment Unit costs decrease
Maintenance slashing and burning replace thinning, net
costs per acre decrease
Show reductions in annual net treatment costs
through time in R-CAT Spreadsheet tool
Suppression Small fire costs
Reduced initial attack costs as small fires become easier
to extinguish*
Adjust small fire costs in R-CAT Spreadsheet Tool
Suppression Large fires costs
New fuel patterns lead to changes in fire behavior and
fires sizes are reduced following treatment
Changes in FSim outputs to SCI, captured in R-CAT Spreadsheet Tool
Changes in large fire costs based on expert
opinion.
Suppression Large fires costs
New fuel patterns lead to changes in fire behavior near
WUI / communities, and fires are less costly to fight
Changes in FSim outputs to SCI, captured in R-CAT Spreadsheet Tool
Changes in large fire costs based on expert
opinion.
Resource Protection
Large fires costs
New fuel patterns lead to changes in fire behavior near
WUI / communities, and fires cause less damage to
VAR
Use ArcFuels to demonstrate changes in
burn probability and reduced risk, where risk = probability of threat times
value at risk.
Use another approach to demonstrate changes in burn probability and
reduced risk, where risk = probability of threat times value at
risk. Suppression Large fire
costs New fuel patterns lead to
more fire for beneficial use Use FSim fire intensity information and a GIS
exercise with Fire Management Plans to
estimate Low, Moderate, and High rate reductions to adjust SCI estimates based on estimates of contiguous area and
monitoring: full suppression cost
relationships.
Use expert opinion to estimate low, moderate and high percentages
and the portion of monitoring costs compared to full suppression in
contiguous areas where this will now be
possible.
Post-fire Post fire costs
New fuel patterns lead to reduced fire intensity, and
create less need for post-fire expenditures
Change the BAER, Rehab and Reforestation Costs in R-CAT Spreadsheet Tool
R-CAT Cost Savings Mechanisms

Suggested Modeling Approach • Fire Management Program Costs Analysis
Design Treatments for 10 Years
• ArcFuels or other treatment planner, such as the Landscape Treatment Designer (LTD)
Model Large Fires
• Large Fire Simulator (FSIM) • Model with and without treatments
Estimate Large Fire Costs
• Stratified Cost Index (SCI) • Estimate Large Fire Costs with and without treatment
Complete the Analysis
• Risk and Cost Analysis Tools Package Spreadsheet • Select Proposal Timing, Add Treatment Acres, Costs, and Revenues • Insert SCI results, Annual Small Fire , BAER, and Rehabilitation Cost
Estimates •Add Beneficial Use Cost Savings
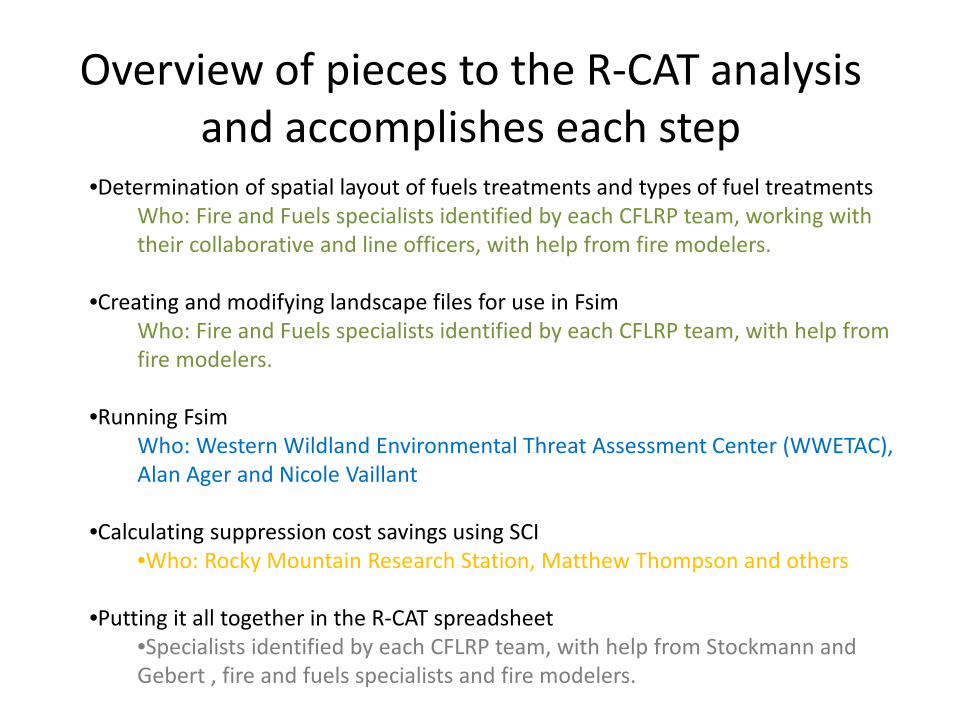
Overview of pieces to the R-CAT analysis and accomplishes each step
•Determination of spatial layout of fuels treatments and types of fuel treatments Who: Fire and Fuels specialists identified by each CFLRP team, working with their collaborative and line officers, with help from fire modelers.
•Creating and modifying landscape files for use in Fsim Who: Fire and Fuels specialists identified by each CFLRP team, with help from fire modelers.
•Running Fsim Who: Western Wildland Environmental Threat Assessment Center (WWETAC), Alan Ager and Nicole Vaillant
•Calculating suppression cost savings using SCI •Who: Rocky Mountain Research Station, Matthew Thompson and others
•Putting it all together in the R-CAT spreadsheet •Specialists identified by each CFLRP team, with help from Stockmann and Gebert , fire and fuels specialists and fire modelers.
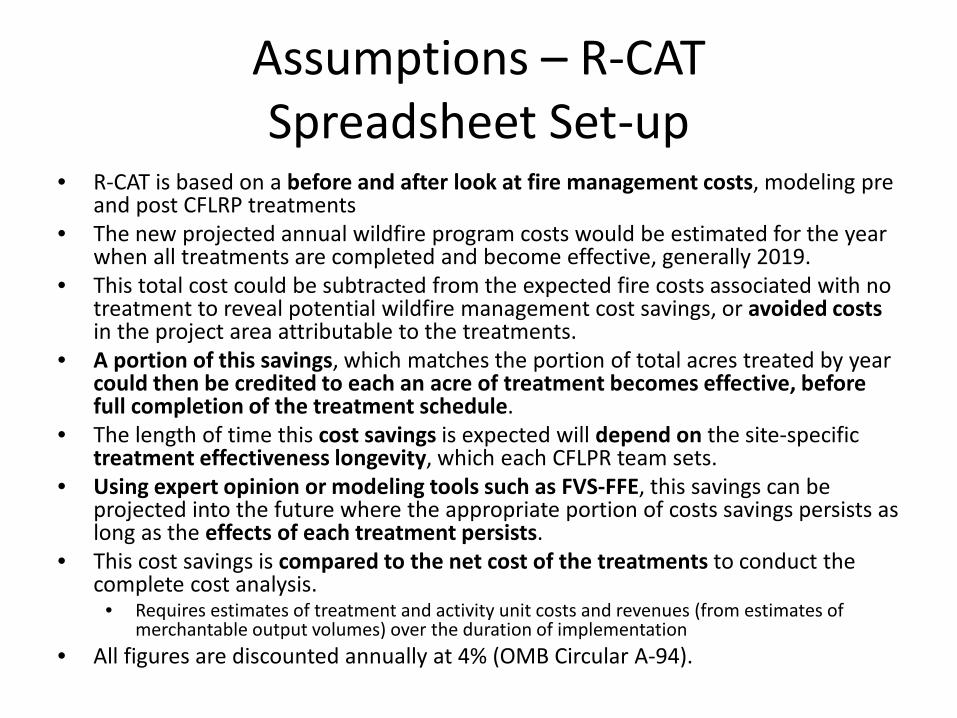
Assumptions – R-CAT Spreadsheet Set-up
• R-CAT is based on a before and after look at fire management costs, modeling pre and post CFLRP treatments
• The new projected annual wildfire program costs would be estimated for the year when all treatments are completed and become effective, generally 2019.
• This total cost could be subtracted from the expected fire costs associated with no treatment to reveal potential wildfire management cost savings, or avoided costs in the project area attributable to the treatments.
• A portion of this savings, which matches the portion of total acres treated by year could then be credited to each an acre of treatment becomes effective, before full completion of the treatment schedule.
• The length of time this cost savings is expected will depend on the site-specific treatment effectiveness longevity, which each CFLPR team sets.
• Using expert opinion or modeling tools such as FVS-FFE, this savings can be projected into the future where the appropriate portion of costs savings persists as long as the effects of each treatment persists.
• This cost savings is compared to the net cost of the treatments to conduct the complete cost analysis.
• Requires estimates of treatment and activity unit costs and revenues (from estimates of merchantable output volumes) over the duration of implementation
• All figures are discounted annually at 4% (OMB Circular A-94).

FSIM – What is it? • FSIM is the large fire simulation system and is
used by Fire Program Analysis (FPA) System
Fire Growth Model (Minimum Travel Time Algorithm)
Fire Suppression
Fire Behavior (Spread Rate,
Fireline Intensity)
Large Fire Occurrence (Historical Statistics)
Fire Weather: Time Series Analysis For Synthetic Data
Spatial Fuels Data
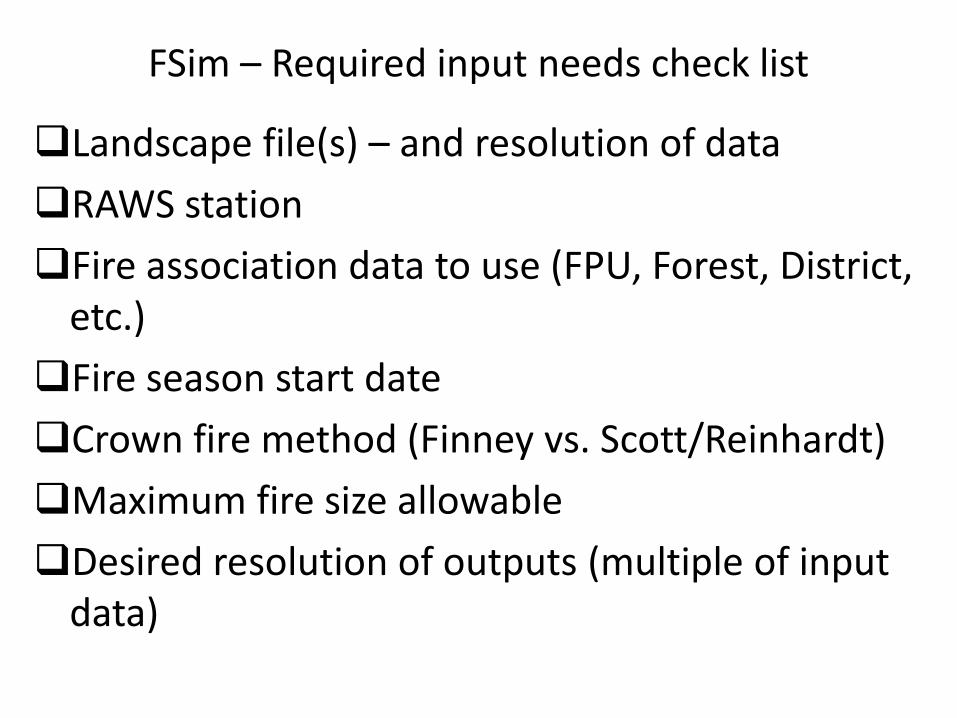
FSim – Required input needs check list
Landscape file(s) – and resolution of data RAWS station Fire association data to use (FPU, Forest, District,
etc.) Fire season start date Crown fire method (Finney vs. Scott/Reinhardt) Maximum fire size allowable Desired resolution of outputs (multiple of input
data)
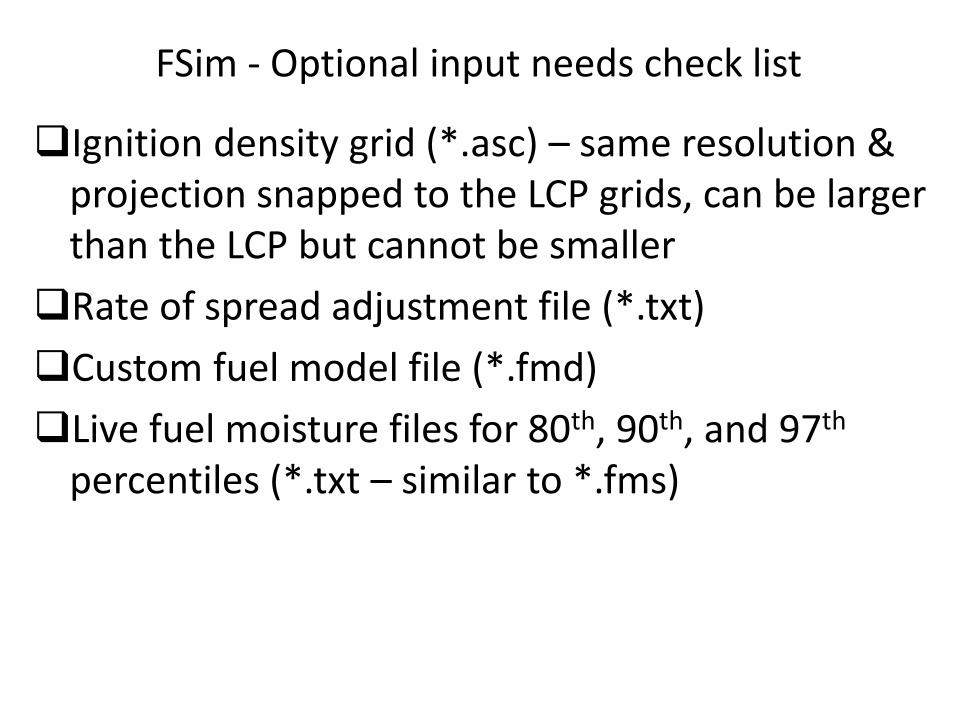
FSim - Optional input needs check list
Ignition density grid (*.asc) – same resolution & projection snapped to the LCP grids, can be larger than the LCP but cannot be smaller Rate of spread adjustment file (*.txt) Custom fuel model file (*.fmd) Live fuel moisture files for 80th, 90th, and 97th
percentiles (*.txt – similar to *.fms)
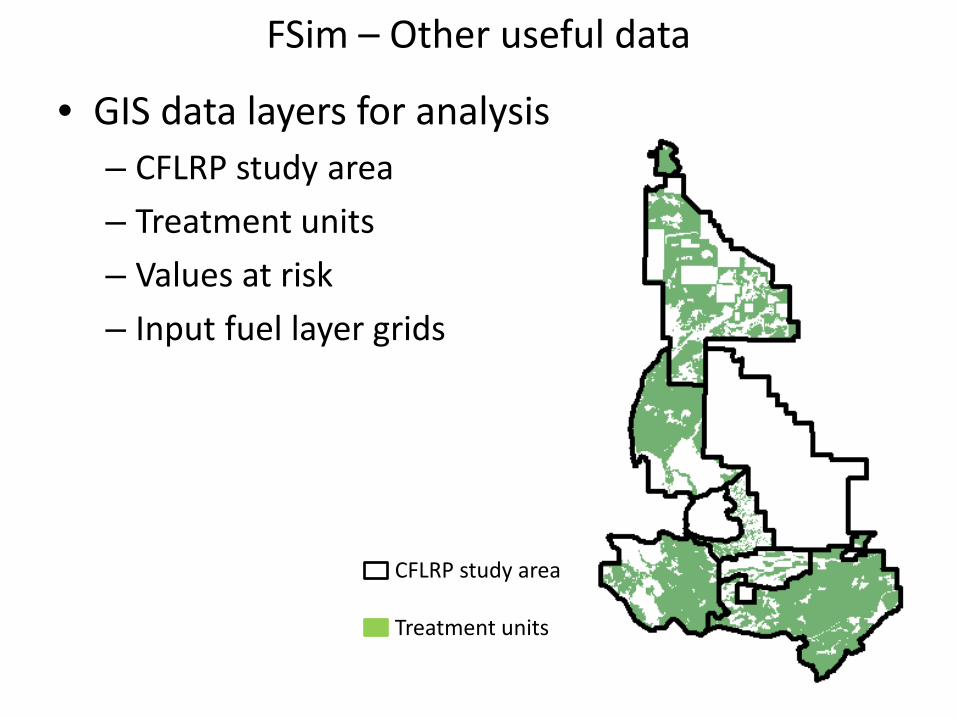
FSim – Other useful data
• GIS data layers for analysis – CFLRP study area – Treatment units – Values at risk – Input fuel layer grids
CFLRP study area Treatment units
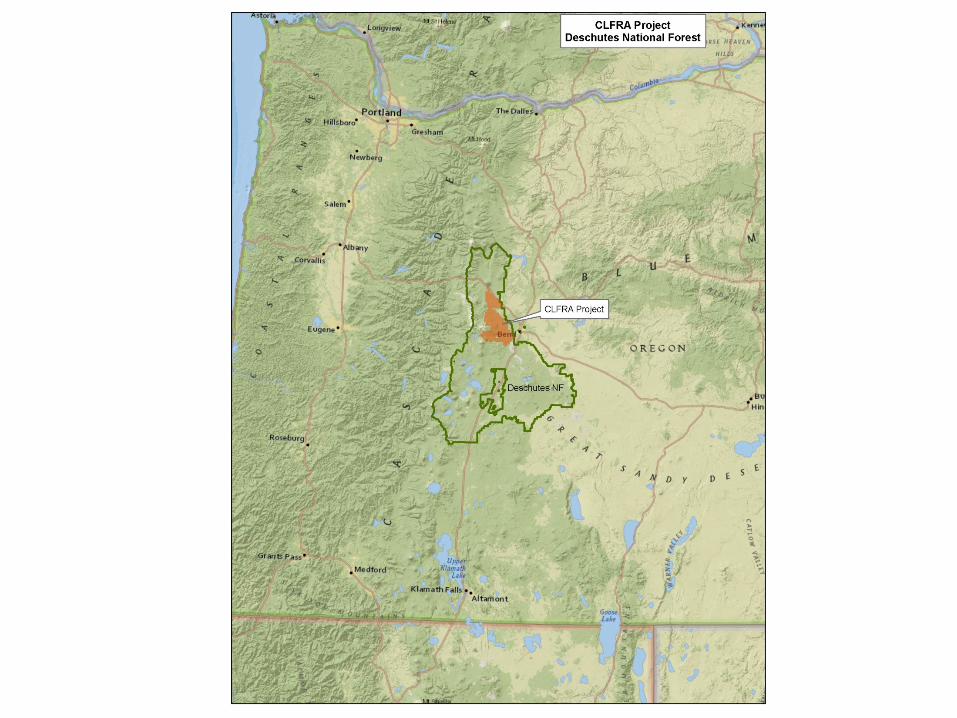


Deschutes Forest Collaborative Project -DFCP
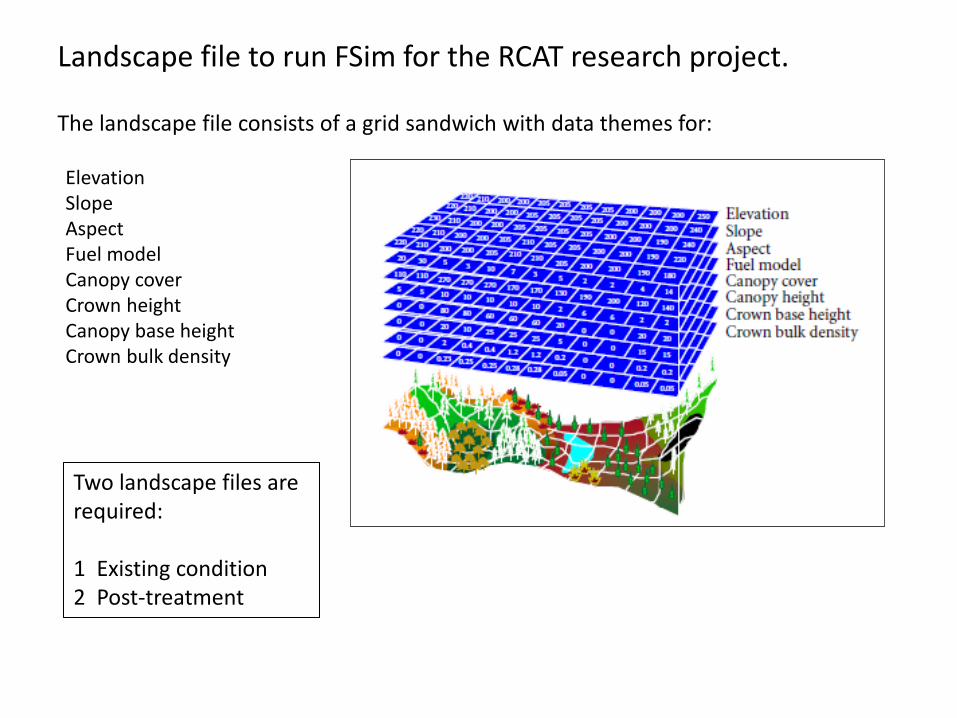
Landscape file to run FSim for the RCAT research project.
Elevation Slope Aspect Fuel model Canopy cover Crown height Canopy base height Crown bulk density
The landscape file consists of a grid sandwich with data themes for:
Two landscape files are required: 1 Existing condition 2 Post-treatment

Landscape file to run FSim for the RCAT research project. Skills/Knowledge Needed:
•GIS •Fire Behavior •Treatment effects to vegetation and fuel conditions
Working knowledge of fire models such as Farsite or FlamMap would be helpful with creation of the landscape file. Knowledge of local weather and fire conditions would also aid in selection of the appropriate RAWS data.
Time Needed: Creation of Existing Condition Landscape File: 10-15 days Post-Treatment Landscape: 5 – 10 days
Total: 15 – 25 days
Landscape file to run FSim for the RCAT research project.
For the Deschutes Project
•Fire Planner coordinated and created the existing and post-treatment landscape files.
•A combination of lidar and gnn data was used to create the forest canopy data. The Area Ecologist and silviculture staff developed this data.
•Treatment data was collected from the ranger district vegetation and fuels staff.
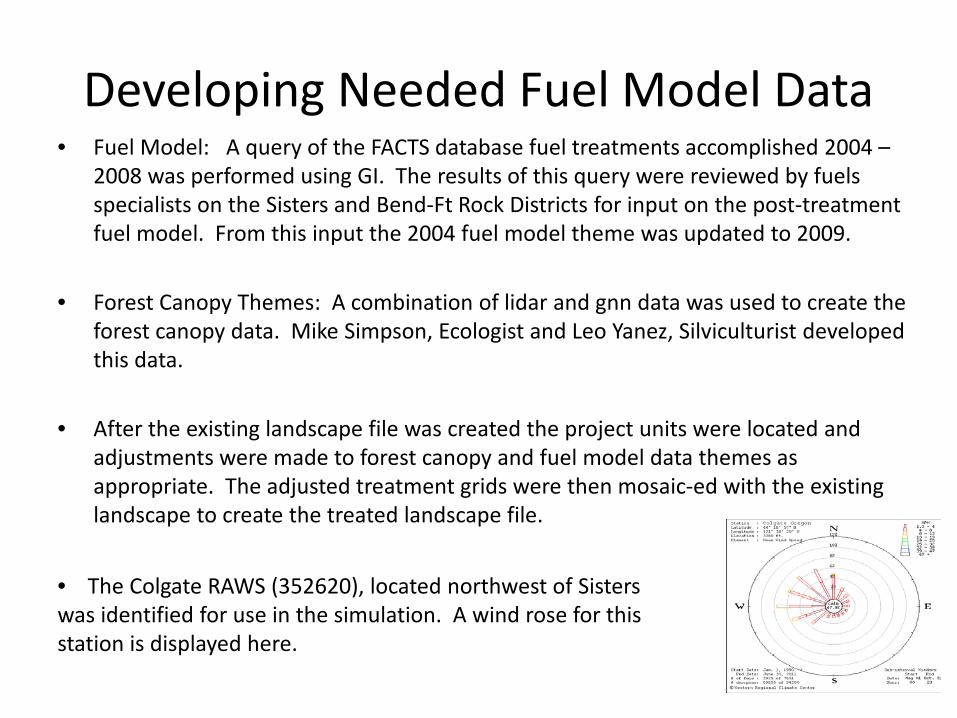
Developing Needed Fuel Model Data • Fuel Model: A query of the FACTS database fuel treatments accomplished 2004 –
2008 was performed using GI. The results of this query were reviewed by fuels specialists on the Sisters and Bend-Ft Rock Districts for input on the post-treatment fuel model. From this input the 2004 fuel model theme was updated to 2009.
• Forest Canopy Themes: A combination of lidar and gnn data was used to create the forest canopy data. Mike Simpson, Ecologist and Leo Yanez, Silviculturist developed this data.
• After the existing landscape file was created the project units were located and adjustments were made to forest canopy and fuel model data themes as appropriate. The adjusted treatment grids were then mosaic-ed with the existing landscape to create the treated landscape file.
• The Colgate RAWS (352620), located northwest of Sisters was identified for use in the simulation. A wind rose for this station is displayed here.
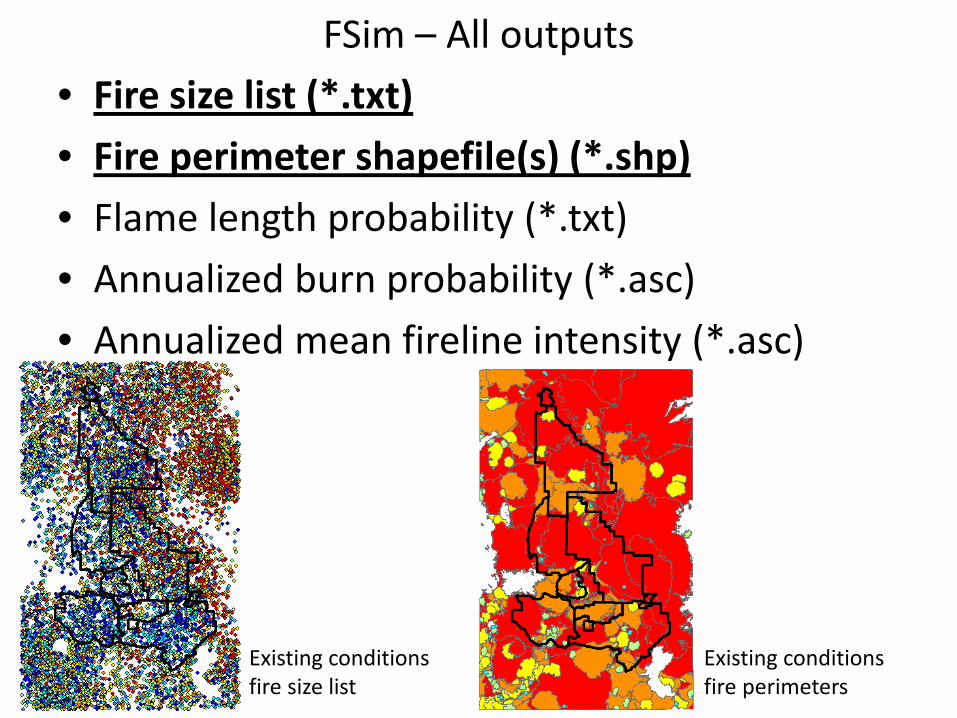
FSim – All outputs • Fire size list (*.txt) • Fire perimeter shapefile(s) (*.shp) • Flame length probability (*.txt) • Annualized burn probability (*.asc) • Annualized mean fireline intensity (*.asc)
Existing conditions fire size list
Existing conditions fire perimeters

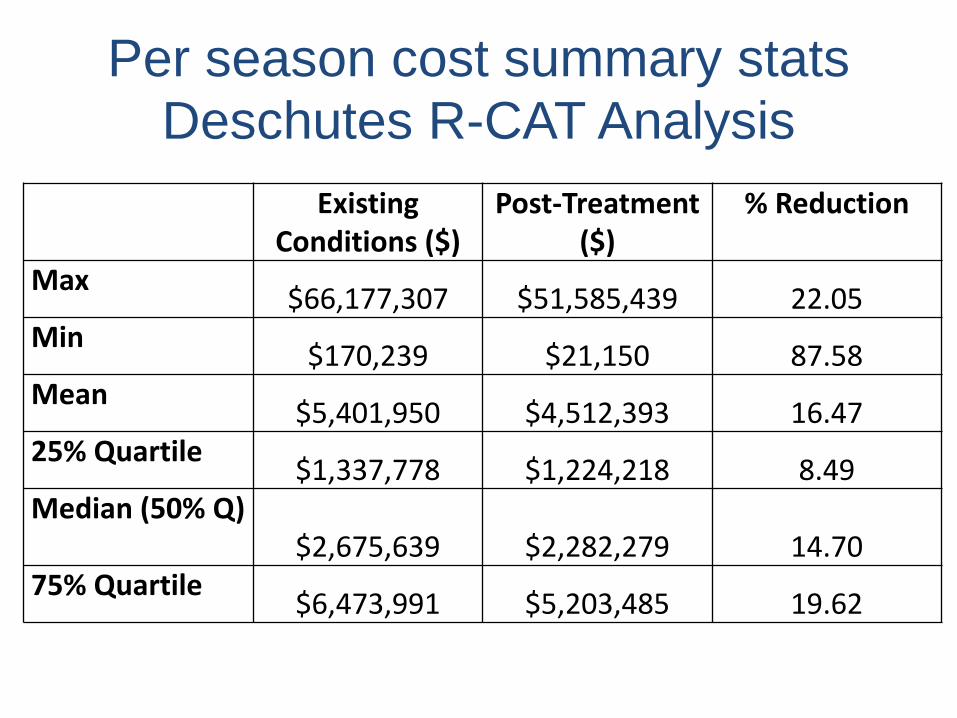
Existing Conditions ($)
Post-Treatment ($)
% Reduction
Max $66,177,307 $51,585,439 22.05 Min $170,239 $21,150 87.58 Mean $5,401,950 $4,512,393 16.47 25% Quartile $1,337,778 $1,224,218 8.49 Median (50% Q)
$2,675,639 $2,282,279 14.70 75% Quartile $6,473,991 $5,203,485 19.62
Per season cost summary stats Deschutes R-CAT Analysis
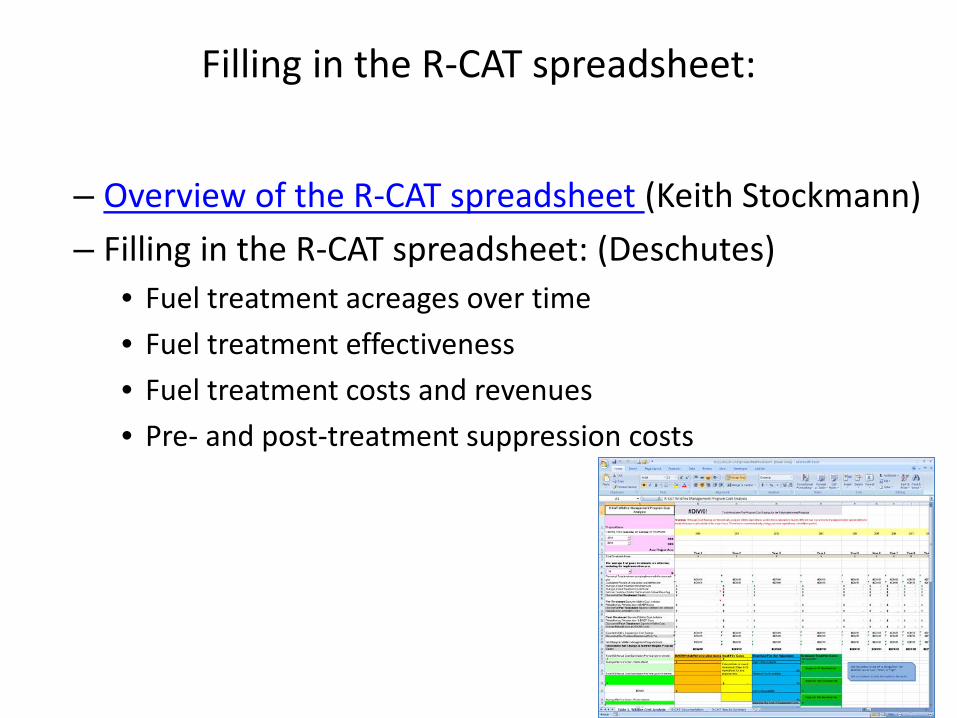
Filling in the R-CAT spreadsheet:
– Overview of the R-CAT spreadsheet (Keith Stockmann) – Filling in the R-CAT spreadsheet: (Deschutes)
• Fuel treatment acreages over time • Fuel treatment effectiveness • Fuel treatment costs and revenues • Pre- and post-treatment suppression costs
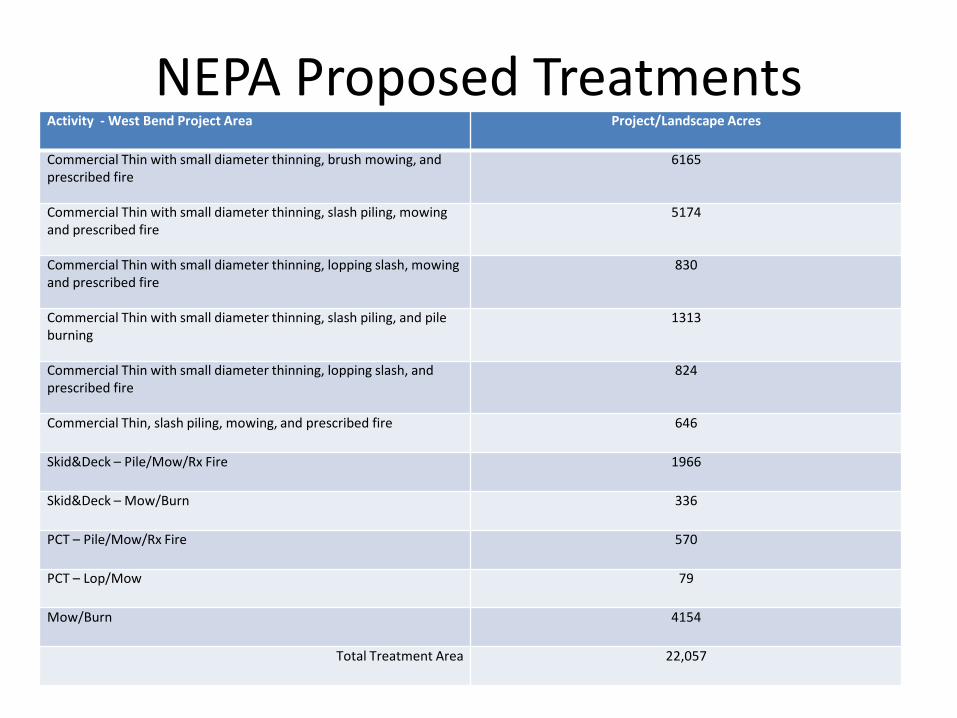
NEPA Proposed Treatments Activity - West Bend Project Area Project/Landscape Acres
Commercial Thin with small diameter thinning, brush mowing, and prescribed fire
6165
Commercial Thin with small diameter thinning, slash piling, mowing and prescribed fire
5174
Commercial Thin with small diameter thinning, lopping slash, mowing and prescribed fire
830
Commercial Thin with small diameter thinning, slash piling, and pile burning
1313
Commercial Thin with small diameter thinning, lopping slash, and prescribed fire
824
Commercial Thin, slash piling, mowing, and prescribed fire 646
Skid&Deck – Pile/Mow/Rx Fire 1966
Skid&Deck – Mow/Burn 336
PCT – Pile/Mow/Rx Fire 570
PCT – Lop/Mow 79
Mow/Burn 4154
Total Treatment Area 22,057
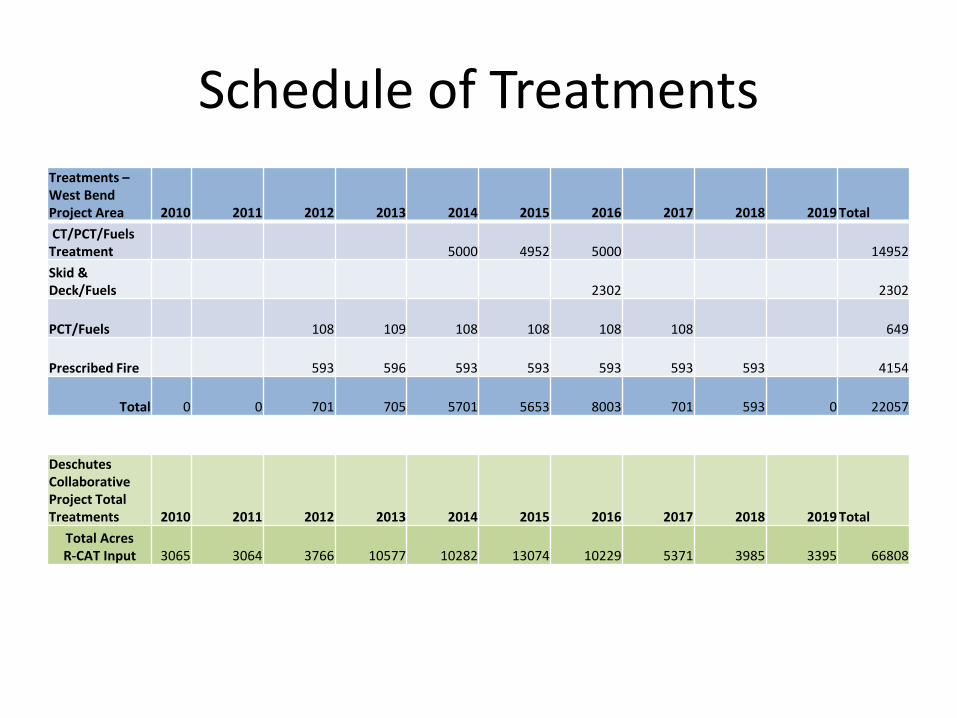
Schedule of Treatments Treatments – West Bend Project Area 2010 2011 2012 2013 2014 2015 2016 2017 2018 2019 Total CT/PCT/Fuels Treatment 5000 4952 5000 14952 Skid & Deck/Fuels 2302 2302
PCT/Fuels 108 109 108 108 108 108 649
Prescribed Fire 593 596 593 593 593 593 593 4154
Total 0 0 701 705 5701 5653 8003 701 593 0 22057
Deschutes Collaborative Project Total Treatments 2010 2011 2012 2013 2014 2015 2016 2017 2018 2019 Total
Total Acres R-CAT Input 3065 3064 3766 10577 10282 13074 10229 5371 3985 3395 66808

Costs and Revenues
• Used actual costs associated with vegetation/fuels treatments from 2010 and 2011.
• Estimated costs associated with vegetation/fuels treatments for 2012 through 2019 based on our CFLR proposal. (% of total request, adjusted for actual allocation).
• Revenue - based on actual timber receipts received for products removed.
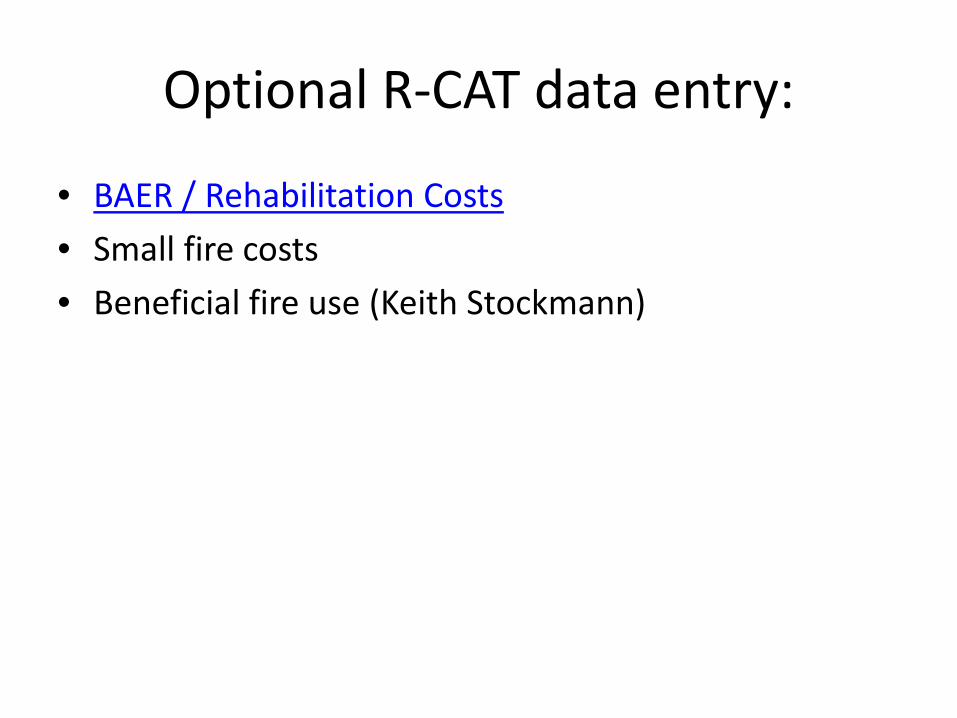
Optional R-CAT data entry:
• BAER / Rehabilitation Costs • Small fire costs • Beneficial fire use (Keith Stockmann)
Existing Conditions ($)
Post-Treatment ($)
% Reduction
Max $66,177,307 $51,585,439 22.05 Min $170,239 $21,150 87.58 Mean $5,401,950 $4,512,393 16.47 25% Quartile $1,337,778 $1,224,218 8.49 Median (50% Q)
$2,675,639 $2,282,279 14.70 75% Quartile $6,473,991 $5,203,485 19.62
Per season cost summary stats Deschutes R-CAT Analysis

What to do with the results – exploring options
– Sensitivity analysis of results to suppression cost savings • How do the results change if you use percentiles other than the
median? • What if you have one really bad year? • Calibrating to your actual average suppression costs
– RCAT does not capture all of the benefits of fuel treatments. Other benefits could include:
• Protection of values at risk • Greater ability to capture fires in initial attack • Greater ability to use less aggressive (less costly) suppression
strategies • How do you tell your story, especially if analysis shows negative
cost savings?

Thinking about the "R" in R-CAT - how to include a risk component (Matt)
• Optional FSIM Analysis

Evaluating changes in Burn Probability
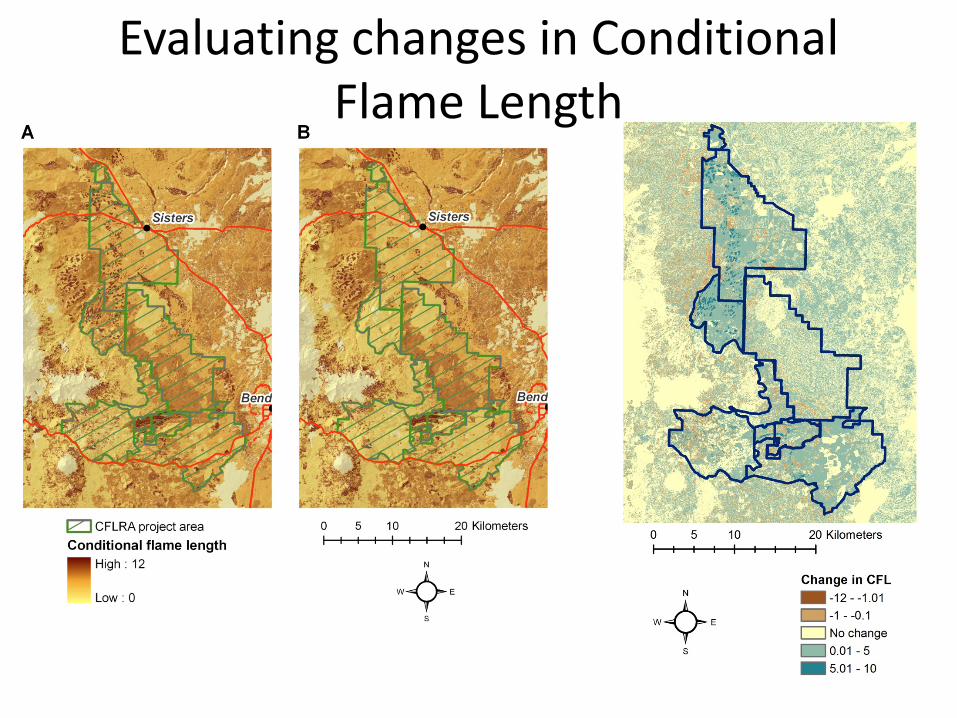
Evaluating changes in Conditional Flame Length
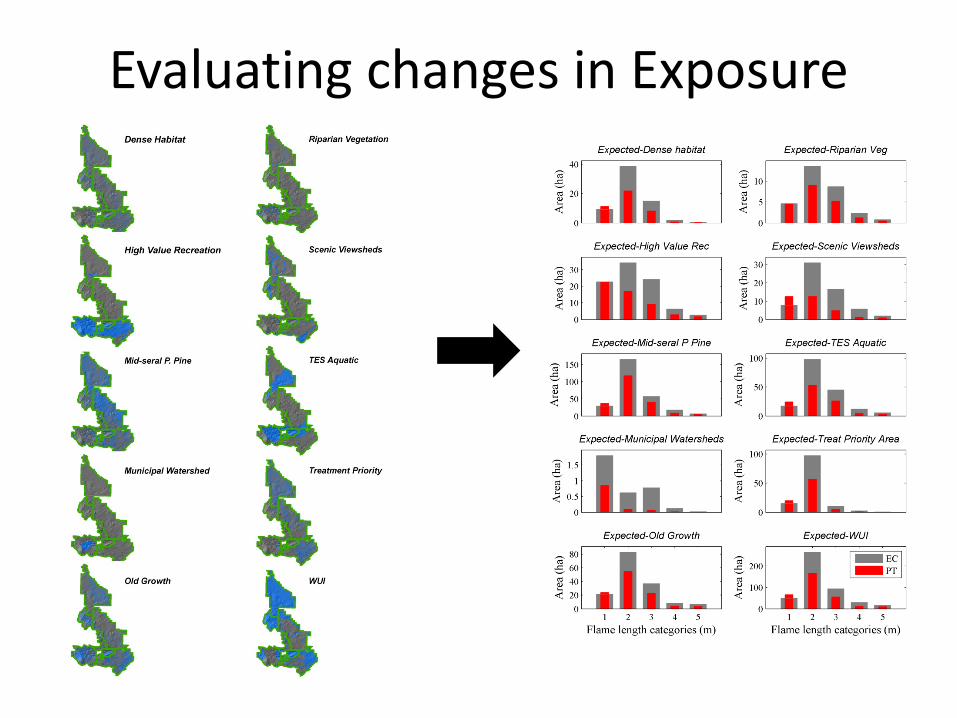
Evaluating changes in Exposure
Taking lessons from the pilot to create a template for upward reporting
• Identify potential suppression cost savings • Show fire program costs savings (increase) • Describe suppression tactic options not shown
in the tool • Describe risk reduction expectations
Conclusions
• Convergence of reasons to do this analysis • Challenges of modeling properly are exacerbated by
budget and NEPA uncertainty, but analysis must proceed • Help is available throughout the process • We aim to use the results to help justify or redesign
treatments – Fire program cost savings, and/or – Risk reduction
• This tool can help keep funding coming to teams • We will post a new version to the CFLRP website soon
Contact Information Keith Stockmann
406-329-3549 Desk [email protected]
Krista Gebert 406-329-3696 Desk [email protected]