estimations of generic drug entry in...
TRANSCRIPT
186
ESTIMATIONS OF GENERIC DRUG ENTRY IN BRAZIL USING COUNT VERSUS ORDERED MODELS
Eduardo P. S. FiuzaBarbara Caballero
Originally published by Ipea in October 2010 as number 1511a of the series Texto para Discussão.

DISCUSSION PAPER
186B r a s í l i a , J a n u a r y 2 0 1 5
Originally published by Ipea in October 2010 as number 1511a of the series Texto para Discussão.
ESTIMATIONS OF GENERIC DRUG ENTRY IN BRAZIL USING COUNT VERSUS ORDERED MODELS1
Eduardo P. S. Fiuza2
Barbara Caballero3
1. We thank Carla Marigo, Leticia Klotz, Guilherme Lima, Felipe Ruperti and Fernando Moura for valuable help, andAnvisa’s staff, Brazilian Ministries of Finance and Justice, Leandro Safatle and his team, Grupemef, and ABCFarma for dataand advice. Financial and material supports were provided by CNPq (Grants PQ 311766/2006-4 and IC 503122/2007-6), Ciee, Ipea’s Program for Development Studies (PNPD) and Ministry of Justice (Convenio MJ 01/2006), all of themgratefully acknowledged. We thank attendants at the EARIE Conference and seminars at PUC-Rio and EPGE-FGV for usefulcomments. The usual disclaimer applies.2. Researcher of the Directorate of Industrial Studies and Policies, Innovation and Infrastructure – DISET/Ipea.3. PNPD fellow.

DISCUSSION PAPER
A publication to disseminate the findings of research
directly or indirectly conducted by the Institute for
Applied Economic Research (Ipea). Due to their
relevance, they provide information to specialists and
encourage contributions.
© Institute for Applied Economic Research – ipea 2015
Discussion paper / Institute for Applied Economic
Research.- Brasília : Rio de Janeiro : Ipea, 1990-
ISSN 1415-4765
1. Brazil. 2. Economic Aspects. 3. Social Aspects.
I. Institute for Applied Economic Research.
CDD 330.908
The authors are exclusively and entirely responsible for the
opinions expressed in this volume. These do not necessarily
reflect the views of the Institute for Applied Economic
Research or of the Secretariat of Strategic Affairs of the
Presidency of the Republic.
Reproduction of this text and the data it contains is
allowed as long as the source is cited. Reproductions for
commercial purposes are prohibited.
Federal Government of Brazil
Secretariat of Strategic Affairs of the Presidency of the Republic Minister Roberto Mangabeira Unger
A public foundation affiliated to the Secretariat of Strategic Affairs of the Presidency of the Republic, Ipea provides technical and institutional support to government actions – enabling the formulation of numerous public policies and programs for Brazilian development – and makes research and studies conducted by its staff available to society.
PresidentSergei Suarez Dillon Soares
Director of Institutional DevelopmentLuiz Cezar Loureiro de Azeredo
Director of Studies and Policies of the State,Institutions and DemocracyDaniel Ricardo de Castro Cerqueira
Director of Macroeconomic Studies and PoliciesCláudio Hamilton Matos dos Santos
Director of Regional, Urban and EnvironmentalStudies and PoliciesRogério Boueri Miranda
Director of Sectoral Studies and Policies,Innovation, Regulation and InfrastructureFernanda De Negri
Director of Social Studies and Policies, DeputyCarlos Henrique Leite Corseuil
Director of International Studies, Political and Economic RelationsRenato Coelho Baumann das Neves
Chief of StaffRuy Silva Pessoa
Chief Press and Communications OfficerJoão Cláudio Garcia Rodrigues Lima
URL: http://www.ipea.gov.brOmbudsman: http://www.ipea.gov.br/ouvidoria
DISCUSSION PAPER
A publication to disseminate the findings of research
directly or indirectly conducted by the Institute for
Applied Economic Research (Ipea). Due to their
relevance, they provide information to specialists and
encourage contributions.
© Institute for Applied Economic Research – ipea 2015
Discussion paper / Institute for Applied Economic
Research.- Brasília : Rio de Janeiro : Ipea, 1990-
ISSN 1415-4765
1. Brazil. 2. Economic Aspects. 3. Social Aspects.
I. Institute for Applied Economic Research.
CDD 330.908
The authors are exclusively and entirely responsible for the
opinions expressed in this volume. These do not necessarily
reflect the views of the Institute for Applied Economic
Research or of the Secretariat of Strategic Affairs of the
Presidency of the Republic.
Reproduction of this text and the data it contains is
allowed as long as the source is cited. Reproductions for
commercial purposes are prohibited.
JEL: L65, C25, L13.
CONTENTS
SINOPSE
ABSTRACT
1 INTRODUCTION .....................................................................................................7
2 THE BRAZILIAN MARKET ........................................................................................7
3 LITERATURE ON PHARMACEUTICAL ENTRY: A SURVEY ..........................................13
4 THE MODEL ...........................................................................................................18
5 DATA AND RESULTS ...............................................................................................24
6 CONCLUSIONS......................................................................................................43
REFERENCES .............................................................................................................45

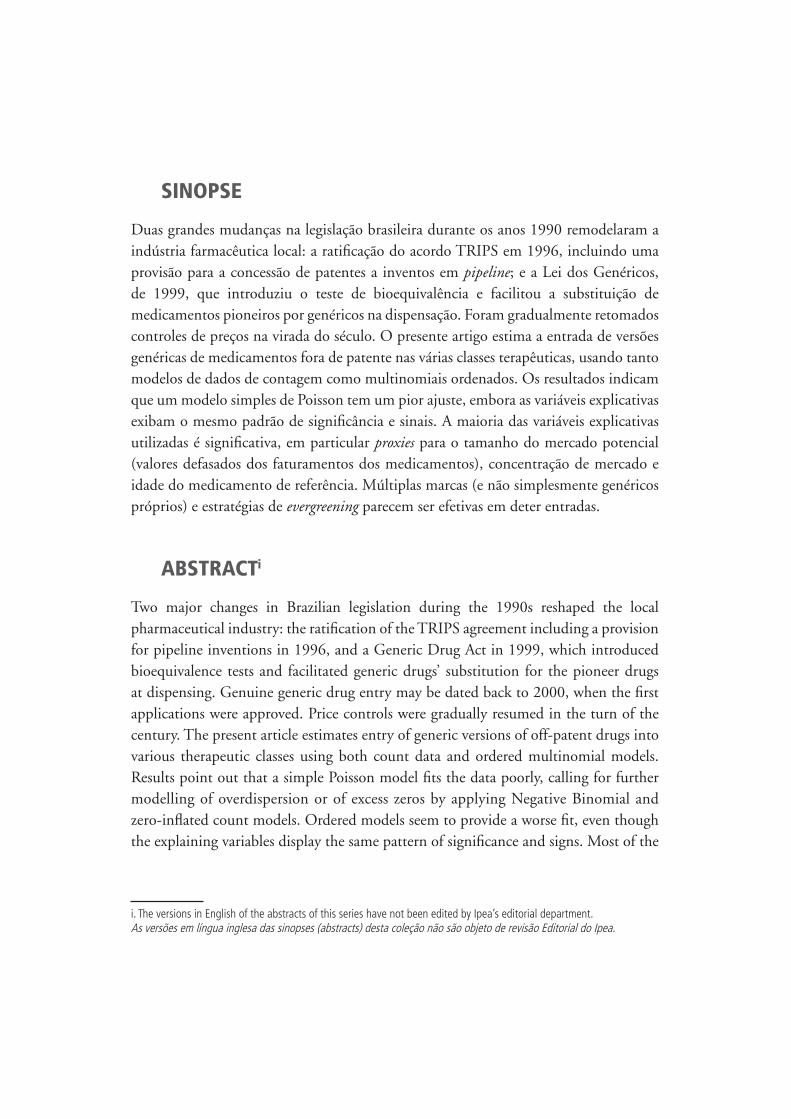
SINOPSE
Duas grandes mudanças na legislação brasileira durante os anos 1990 remodelaram a
indústria farmacêutica local: a ratificação do acordo TRIPS em 1996, incluindo uma
provisão para a concessão de patentes a inventos em pipeline; e a Lei dos Genéricos,
de 1999, que introduziu o teste de bioequivalência e facilitou a substituição de
medicamentos pioneiros por genéricos na dispensação. Foram gradualmente retomados
controles de preços na virada do século. O presente artigo estima a entrada de versões
genéricas de medicamentos fora de patente nas várias classes terapêuticas, usando tanto
modelos de dados de contagem como multinomiais ordenados. Os resultados indicam
que um modelo simples de Poisson tem um pior ajuste, embora as variáveis explicativas
exibam o mesmo padrão de significância e sinais. A maioria das variáveis explicativas
utilizadas é significativa, em particular proxies para o tamanho do mercado potencial
(valores defasados dos faturamentos dos medicamentos), concentração de mercado e
idade do medicamento de referência. Múltiplas marcas (e não simplesmente genéricos
próprios) e estratégias de evergreening parecem ser efetivas em deter entradas.
ABSTRACTi
Two major changes in Brazilian legislation during the 1990s reshaped the local
pharmaceutical industry: the ratification of the TRIPS agreement including a provision
for pipeline inventions in 1996, and a Generic Drug Act in 1999, which introduced
bioequivalence tests and facilitated generic drugs’ substitution for the pioneer drugs
at dispensing. Genuine generic drug entry may be dated back to 2000, when the first
applications were approved. Price controls were gradually resumed in the turn of the
century. The present article estimates entry of generic versions of off-patent drugs into
various therapeutic classes using both count data and ordered multinomial models.
Results point out that a simple Poisson model fits the data poorly, calling for further
modelling of overdispersion or of excess zeros by applying Negative Binomial and
zero-inflated count models. Ordered models seem to provide a worse fit, even though
the explaining variables display the same pattern of significance and signs. Most of the
i. The versions in English of the abstracts of this series have not been edited by Ipea’s editorial department.As versões em língua inglesa das sinopses (abstracts) desta coleção não são objeto de revisão Editorial do Ipea.

explaining variables utilized are significant, in particular a proxy for potential market
(lagged revenues of the drug), market concentration, and age of the pioneer drug.
Multiple brands (rather than simply own-generics) and evergreening strategies seem to
be effective in deterring entry.
7
Estimations of generic drug entry in Brazil using count versus ordered models
1 INTRODUCTION
The present work is the first estimation of generic drug entry models in Brazil. The Brazilian market is of interest because of its size (tenth largest in the world) and because of two major changes in Brazilian legislation during the 1990s that reshaped the local pharmaceutical industry. The first one was the ratification of the Trade-Related Aspects of Intellectual Property Rights (TRIPS) agreement passed by the Congress in 1996, which included a provision for pipeline inventions. The second one was the Generic Drug Act in 1999, which introduced bioequivalence tests and facilitated generic drugs’ substitution for the pioneer drugs at dispensing. Price controls were gradually resumed in the turn of the century following exchange rate steep depreciation. Genuine generic drug entry may therefore be dated back to 2000, when the first applications were approved.
The present article estimates entry of generic versions of off-patent drugs into the various therapeutic classes using both count data and ordered multinomial models. Results point out that a simple Poisson model fits the data poorly, calling for further modelling of overdispersion or of excess zeros by applying Negative Binomial and zero-inflated count models. Most of the explaining variables utilized are significant, in particular the lagged values of the revenues of the drug (proxy for potential market), of the number of own generics and other brands of the originator’s group, and of the market concentration, and the age of the pioneer drug. In the ordered models significance and signs are similar to the count models. Marginal effects of the explaining variables are dampened as the number of entries increases.
The present article features four more sections. Next one brings a short description of the Brazilian pharmaceutical market and of its regulation. The following section surveys previous attempts to estimate empirically drug entry, with emphasis on generics, and introduces the model. The fourth section presents the results, performs diagnostic tests and discusses the results. The last section concludes.
2 THE BRAZILIAN MARKET
Brazil is at present the tenth largest market for pharmaceuticals in the world. Even though sales in units (1.8 billion in 2008) do not display a clear time trend–they are 2.5 percent below 1997 level, but twenty percent above 2003 level (Febrafarma/
Discussion Paper186 (1511a)

8
TABLE 1
Generic drug market share in selected countries (In %)
Country Revenue Volume
USA 13 60
Germany 26 60
United Kingdom 26 60
Canada 22 45
France 14 35
Spain 13 30
Brazil 13,8 16,9
Source: Associação Brasileira das Indústrias de Medicamentos Genéricos (Pró-Genéricos).
Grupemef )–revenues in dollars (deflated by US and Brazilian price indexes) increased 2.35 percent a year during the same elapsed time. Revenues in local currency (deflated by Brazilian general price index) have also been steadily increasing: average 9.9 percent p.a. during 1997-2008 (Febrafarma/Grupemef ), but the ratio sales/Total Brazilian GDP in nominal values has been oscilating in the percentual range [0.9, 1.11], an average 1.05 percent during the same period.
As in developed countries, sales in value increase more than units because of differences in the mix of drugs consumed. As more expensive drugs are launched, prices go up. On the other hand, two forces have kept prices down. For one, a severe price control was gradually resumed in the first years of the century, more ingenious and comprehensive than its counterpart adopted during the 1970s and 1980s. Second, a new strategy of promoting nonproprietary names has successfully been pursued since 2000. In fact, generic drugs achieved in 2008 a 13.8 percent market share in value, 16.9 percent in volume–Intercontinental Marketing Services (IMS Health apud Pro-Genérico). It is not a bad record if one takes into account generic drugs’ infancy in the country. Table 1 provides for comparison with other selected countries with tradition in generic drugs.
To better understand how the Brazilian market functions, a brief historical summary is useful. Price controls and absence of patent enforcement were the main strategies of the military government since the beginning of the 1970s. On the one hand, an import substitution attempt required that foreign patents were not recognized by Brazilian law. In fact, chemical-pharmaceutical product patents were not enforced
B r a s í l i a , J a n u a r y 2 0 1 5

9
Estimations of generic drug entry in Brazil using count versus ordered models
since 1945, and process patents were also revoked in 1969. On the other hand, macroeconomic policy in Brazil fostered inflation and led authorities to adopt price controls countervailing measures. Price controls, however, were in part circumvented by the pharmaceutical firms by introducing new packages, whose prices were not subject to scrutiny.
The 1990s were a time of major transformations in the Brazilian market. Price controls as a whole were replaced by a modern Antitrust legislation. A new Antitrust Act was passed in 1993, and subsequently reformed in 1994 (Lei no 8.884). Pharmaceutical drug price controls were phased out in 1992, and a series of price hikes followed. Antitrust investigations for “abusive price increases” were at that time filed at the Antitrust Tribunal (Cade)–a terrible public misunderstanding of the spirit of the new Antitrust legislation. As regards import substitution, the process was also reversed. Import tariffs had already been lowered, and non-tariff barriers dismantled, beginning in 1989. Local content in drugs marketed in Brazil consequently tumbled.
In 1996 a radical turn in intellectual property protection came out: the World Trade Organization (WTO)–TRIPS agreement from the Uruguay Round was finally ratified by the Congress (Lei no 9.279). This ratification brought back patent enforcement as from 1997. The maximum patent lifetime allowed was 20 years, but no extension was provisioned (in particular, none of the extensions provisioned by the US Patent Restoration Act of 1984). On the other hand, a controversial provision for pipeline
inventions was introduced in the legislation: patents deposited under former rules (Lei no 5.772, from 1971) and not marketed yet were eligible to require convalidation by the Brazilian Patents’ Office–Instituto Nacional de Propriedade Industrial (Inpi); the patent lifetime was subject to the same expiration date of the first patent lifetime abroad, and not exceeding 20 years (upper limit of the Brazilian patent law). Other products already marketed or whose patents had already expired did not benefit from this.
The Brazilian legislation went much further that what was required by TRIPS and included a
pipeline provision, where patents claims could be filed in the country between 1996 and 1997,
allowing the protection of pharmaceutical patents that were already filed in at least one other
country, without any national examination and even if the patent was prior to TRIPS signature,
as long as the product was not yet commercialized anywhere or nobody had done efforts in the
country for exploration at the time of the request (CHAVES; REIS, 2007).
Discussion Paper186 (1511a)

10
Another feature of the Brazilian law worth mentioning is that pharmaceutical patents are granted only after registration at Agência Nacional de Vigilância Sanitária (Anvisa)–the Brazilian equivalent to United States Food and Drug Administration (FDA)–is cleared (Lei no 10.196 from 2001; in force since 1999). As such, new drugs’ patents are never scrutinized by Anvisa during registration for safety and effectiveness.
The other major transformation in the 1990s was the enactment of the first Generic Drug Act in 1999. The farthest the previous legislation had reached was requiring an outstanding disclosure of the Active Pharmaceutical Ingredient (API) description below the brand name in the package, so as to allow for comparison of brands. But prescribing doctors had reason to concern that drugs of same API were not substitutible for each other.
In fact, until 1999 the registration of new drugs only required safety tests, and absolute effectiveness; no comparisons were undertaken between drugs based on the same API. Generic names were utilized by pharmaceutical companies without demonstrating bioequivalence. They were actually similar drugs. In sum, Brazil had only pioneer (not necessarily originator’s) and/or similar (branded or non-branded) versions of a same drug. The Generic Drug Act (Lei no 9.787) introduced bioequivalence tests and the generic drug as bioequivalent. Similar drugs were then mandated to adopt brand if they had none. Generic names (either Brazilian or International Non-proprietary Names) have since then been allowed only to drugs bioequivalent to the pioneer. On the other hand, branded drugs may be pioneer (reference) or similar.2
Because of the TRIPS ratification, both similar and generic drugs are now only permitted if the original drug is off-patent (i.e. either the patent has already expired or it has never been enforced). But it is worth mentioning that no exclusiveness period is granted for the first generic, as it happens in the U.S.
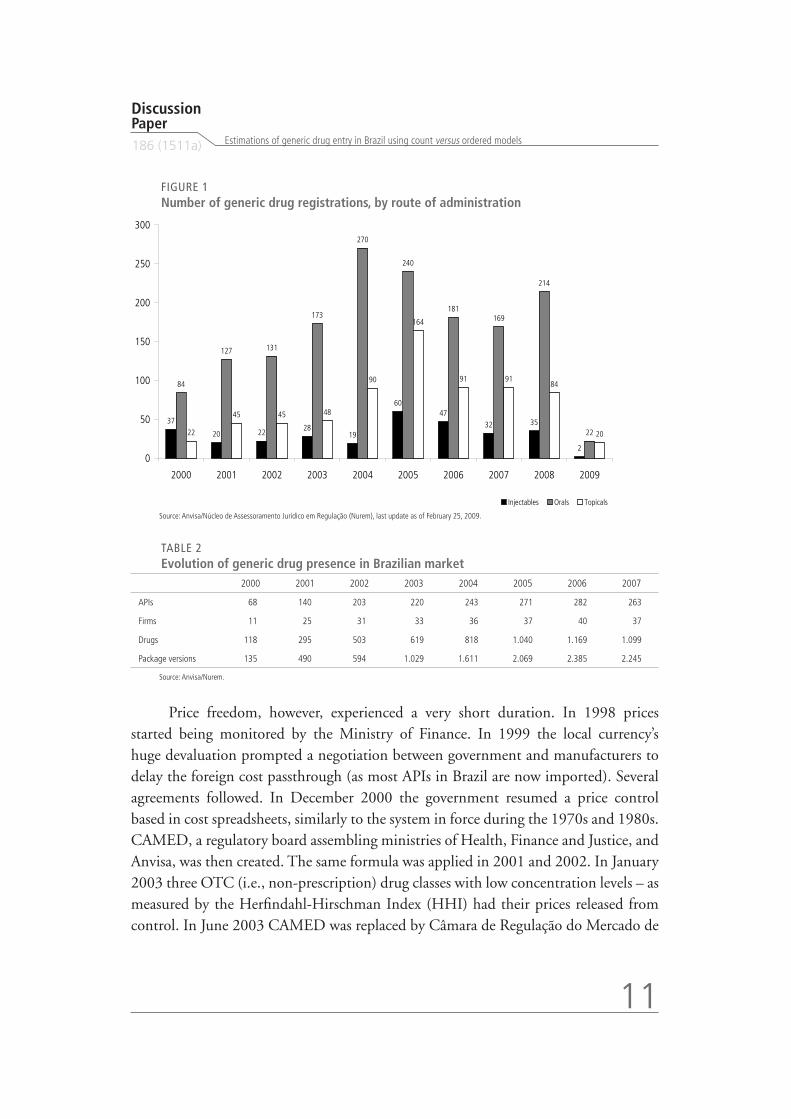
The first generic drugs were launched in 2000. Figure 1 shows the evolution of generic drug registrations. Table 2 displays the evolution of drugs, firms and package versions.
2. Homedes, Linares and Ugalde (2005) report that in most Latin American countries (Bolivia, Chile, Colombia, Costa Rica, Ecuador, Nicaragua, Peru and Uruguay) pharmaceuticals are classified under two categories only: Branded (comprising branded originals, branded generics and branded similar) versus Generics (original or own generics, copy generics and unbranded similars). Argentina features three categories: innovative (branded original or copy), similar (non-bioequivalent), while generic applies to bioequivalent drugs, both branded and unbranded.
B r a s í l i a , J a n u a r y 2 0 1 5
11
Estimations of generic drug entry in Brazil using count versus ordered models
FIGURE 1
Number of generic drug registrations, by route of administration
Source: Anvisa/Núcleo de Assessoramento Jurídico em Regulação (Nurem), last update as of February 25, 2009.
Price freedom, however, experienced a very short duration. In 1998 prices started being monitored by the Ministry of Finance. In 1999 the local currency’s huge devaluation prompted a negotiation between government and manufacturers to delay the foreign cost passthrough (as most APIs in Brazil are now imported). Several agreements followed. In December 2000 the government resumed a price control based in cost spreadsheets, similarly to the system in force during the 1970s and 1980s. CAMED, a regulatory board assembling ministries of Health, Finance and Justice, and Anvisa, was then created. The same formula was applied in 2001 and 2002. In January 2003 three OTC (i.e., non-prescription) drug classes with low concentration levels – as measured by the Herfindahl-Hirschman Index (HHI) had their prices released from control. In June 2003 CAMED was replaced by Câmara de Regulação do Mercado de
TABLE 2
Evolution of generic drug presence in Brazilian market
2000 2001 2002 2003 2004 2005 2006 2007
APIs 68 140 203 220 243 271 282 263
Firms 11 25 31 33 36 37 40 37
Drugs 118 295 503 619 818 1.040 1.169 1.099
Package versions 135 490 594 1.029 1.611 2.069 2.385 2.245
Source: Anvisa/Nurem.
37
20 2228
19
60
47
32 35
2
84
127 131
173
270
240
181169
214
2222
45 45 48
90
164
91 9184
20
0
50
100
150
200
250
300
2000 2001 2002 2003 2004 2005 2006 2007 2008 2009
Injectables Orals Topicals
Discussion Paper186 (1511a)

12
Medicamentos da Anvisa (CMED) (assembling the same government bodies, plus the Secretariat of Government and the Ministry of Industry and Trade) and a unique price cap was introduced, based on the following formula:
p IPCA X Y Z
where CPI stands for the Consumer Price Index; X is a (prospective) productivity factor; Y is a credit for non-manageable (past) cost raises; and Z allows for different price raises according to competition level in each therapeutic class market (raise rate is equal for all drugs in the same class).
More importantly, generic prices had been following an unpublished rule of thumb that entrants should price 35% below the reference drug prices; this rule was then officially adopted in 2004 by CMED.
Since patents are not subject to so many extensions as in the United States3 and since generics are not granted exclusiveness, the main entry-deterrence strategies left in Brazil for the incumbents (reference drug sellers) are to launch follow-on drugs (life-cycle strategies, also known as evergreening), to launch own generics and/or to cross-license their generics. Additional strategies available are the ones already surveyed by the European Commission [EU]: strategic patenting (especially patent clustering); patent litigation; patent settlements; and questioning safety of generics. The first three strategies are more likely to occur and to be effective in the upcoming years, when a large wave of patents–in particular, many blockbusters–will expire locally. As a matter of fact, the Inpi estimated that foreign firms had seventy patent extensions applied for in July 2009, and that the wave of patent extension applications was started in 2004 by firms benefited from pipelines (DCI, July 20, 2009). Many of them simply claimed to be validating locally patent extensions obtained in the countries of origin (IstoÉ Dinheiro, June 26, 2006). We will turn back to this issue when commenting the data utilized.
In our sample, follow on drugs are already of concern: we counted 93 single-API drugs containing at least one extended-release version, with a distribution ranging from 1 to 23 brands per drug. As the European Comission puts it:
3. The U.S. patent legislation, including the 1984 Hatch-Waxman Act, provided for several entry-deterrence strategies. Auseful source about these strategies is the Federal Trade Commission 2002 special report (FTC, 2002).
B r a s í l i a , J a n u a r y 2 0 1 5
13
Estimations of generic drug entry in Brazil using count versus ordered models
“In a number of cases, originator companies tried to switch patients of their medicine facing
imminent loss of exclusivity to a so-called second generation, or follow-on, medicine. (...) In some
cases, the first medicine was withdrawn from the market some months after the launch of the
second generation medicine. If originator companies succeed in switching patients by that point,
the probability that generic companies will be able to gain a significant share of the market
decreases significantly. If, on the other hand, generic companies enter the market before the
patients are switched, originator companies have difficulties in convincing doctors to prescribe
their second generation medicine and/or obtain a high price for it” (European Comission).
It is also worth noting that in Brazil the regulator has to elect a new reference drug when the original one is discontinued, and this may affect the bioequivalence status of existing generics.
Regarding own generics, we detected in our sample 37 generics belonging to their respective reference drug seller groups (in 34 single-API drugs, as some sellers market generics under different umbrella brands). Moreover, many unnotified co-marketing agreements have been discovered by antitrust authorities, but the registration department at Anvisa has not been able to keep track of them. This is an important antitrust issue, because firms may divide their markets among them. An attempt to measure market division should be undertaken in future extensions of this paper, by exploring in greater depth the data base with respect to concentration and diversification of the firms.
The use of lobbying before the regulatory and competition agencies, however, has not been an important practice in Brazil. On the contrary, the antitrust agencies investigated the reference drug makers’ association for coordinated pressure (agreed during a documented meeting) on wholesalers to prevent them from distributing generic drugs, for deceitful advertisement questioning generics’ safety, right after the enactment of the Generic Drug Act, and for distributing to doctors stickers labeled “I do not authorize the substitution of the prescription at dispensing” (without this order, any reference drug may be legally replaced by the pharmacist at dispensing). The attempt investigated was punished by the Brazilian antitrust tribunal (CADE) in 2005, when the firms taking part in the meeting were fined in one percent of their previous year’s revenues, except the agreement leader, Janssen-Cilag, whose fine was doubled.
Discussion Paper186 (1511a)
14
3 LITERATURE ON PHARMACEUTICAL ENTRY: A SURVEY
To the best of our knowledge, only two econometric estimations have been applied to the pharmaceutical in Brazil, all of them trying to measure the impact of generic drug entry on prices. Fiuza and Lisboa (2003) pointed out that branded drug prices would go up in face of similar drugs´ market power increase, a result similar to Frank and Salkever’s (FRANK; SALKEVER, 1997), but the data base utilized was previous to the Generic Dug Act.
Nishijima (2008) used a different sample (covering both before and after the Generic Drug Act) and a different model from Fiuza and Lisboa’s (difference-in-differences) and got different results, namely that reference drug prices would go down as they faced greater numbers of generic copies. Lopes (2009) recently replicated Fiuza and Lisboa’s model with more drugs in a more recent period and reached the same conclusions as the latter.
A better understanding of the process that generates generic drug entry is therefore of extreme interest for Brazilian policymakers, for the industry and for the academia in general. A few models in the international literature may then become a starting point for our work.
As Reiffen and Ward (2005) point out, the generic drug industry is a useful field for studying empirically how competition evolves within a market: i) each chemical represents a distinct experiment; ii) information about the market for each drug is observable to researchers; e.g. date of opening of the market (the patent expiration date); iii) firms must sink significant costs to apply for the authorities’ approval prior to knowing when, or how many, rivals will enter the market.
Papers by Danzon and Chao (2000) and Lanjouw (2005) indicate that price regulation undermines competition in off-patent markets because they discourage generic drug entry. In the same direction–even though looking for industrial policy, scale economies, and safety regulation explanations–Thomas (1996) also finds that the same countries with weaker or non-existent price control–and consequently higher prices (United States, United Kingdom, Germany and Switzerland)–have stronger competitive performance, and account for most of the global drugs launched (drugs sold in more countries, and with greater market shares), while other developed countries tend to launch more often local drugs.
B r a s í l i a , J a n u a r y 2 0 1 5
15
Estimations of generic drug entry in Brazil using count versus ordered models
The main empirical references in generic drug entry are Scott-Morton (1999, 2000) and Reiffen and Ward (2005). The three papers studied the US market.
Scott-Morton (1999) used individual data on Abbreviated New Drug Applications (ANDAs) from the FDA during the 1984-1994 period to estimate entry. Firm characteristics were combined with market characteristics to produce novel explaining variables. She explored all ANDAs of the period, totaling 1,233 unique combinations of applicant, drug, dosage form, and patent expiration, in 363 markets. The FDA provided the submission date, approval date, applicant name, API, dosage form, route, and strength. She merged these data with IMS revenue datas from hospital and drugstore audits, and classified them into therapeutic classes using a standard pharmaceutical reference. Her approach uses observations at firm and drug (API, route, strength) level. Following Berry (1992), she creates a set of potential entrants, who then decide to enter or not, a discrete choice (probit) decision. Thereby she is able to include as explaining variables a range of firm characteristics, such as proxies of firm’s experience with the ingredient, form, therapy and/or drug family–(KYLE, 2006) also uses firm’s experience proxies (including country-class experience) along with geographical proximity and cultural and regulatory likeness measures for estimating entry of New Chemical Entities (NCEs) into the G7 countries as from 1980. The main indications of the drugs are also classified into chronic or acute conditions.4
Scott-Morton (2000) adopted a Poisson count data modelling for testing whether pre-expiration brand advertising deters generic entry. Her sample covered drugs that lost patents from 1986 to 1991. She observed revenues and quantity from two years before patent expiration to one year after expiration, and advertising data from three years before to one year after the same event. She found characteristics of a drug market before patent expiration to be significant predictors of generic entry. Entry was more likely in markets featuring higher market revenues, high share of sales to hospitals, drugs in topical form and for treating chronic conditions. The author also got a very small estimate of the effect of advertising on entry, and noted that its sign varied with the type of advertising.
4. We shall pursue this approach in a near future extension, after learning with the present research, merging registrationdata from Anvisa (important for testing hypotheses about firms’ behaviors following entry authorization), and constructing the relevant proxies.
Discussion Paper186 (1511a)

16
Reiffen and Ward (2005) developed a system of equations to explain generic entry, generic post-entry market share, and entry price. For entry, an expected profit was assumed to be zero for the last entrant; from this condition, and assuming that entry decisions are taken independently and simultaneously; the resulting mixed strategy Nash equilibrium number of entrants followed a binomial distribution, approximated by a Poisson distribution, yielding in turn a hazard rate regression; an iterative procedure was undertaken to account for the endogeneity of the (unobserved) rent variable present in the three equations. The post-patent-expiration price when there are i generic drugs of type k, relative to the price of the pre-entry branded version of the same drug was regressed on cost and demand shifters and on dummies for each possible number of generics. The total log-revenue of the generic drugs was then regressed on the average pre-patent-expiration branded version revenue and on other explaining variables (some of them present in the previous regression equation). The results indicate that the flow of generic industry rents in the United States increases for the initial 5 to 10 months following patent expiration but then falls as more entrants compete away price-cost margins. For markets of sufficient size entry will ultimately lead to near-competitive levels, while prices remain above marginal cost in small markets without inducing entry. The authors used a data set covering 31 drugs that went off patent in the late 1980s and early 1990s in the United States.
Bae (1997) used a proportional hazard regression model to estimate time of delay (in days) to entry after patent expiration in the United States for a list of 77 single-API drugs that lost patent during the period 1987-1994. Again, entry is faster in markets of greater revenue, with fewer branded competitors, and for chronic-use drugs. The Medicaid Drug Rebate Program, which imposed mandatory rebates off the private sector wholesale prices for the Medicaid (public) purchases, had a positive impact on the entry delay.
Hudson (2000) studied entry in four developed countries: United States, United Kingdom, Germany and Japan. United States and Japan are the greatest pharmaceutical markets in the world, as measured by revenues. He analyzed: i) the determinants of generic drug entry; ii) determinants of entry delay when entry does occur; iii) impact of entry on the original brand’s sales. His results also suggest that the greater the market, the more likely are entry and its impact on the original drug’s sales. His estimations are based on a sample of the 50 best-selling APIs present in at leas one of these countries.
B r a s í l i a , J a n u a r y 2 0 1 5

17
Estimations of generic drug entry in Brazil using count versus ordered models
Rudholm (2005) analyzed determinants of generic entry in Sweden, where a reference pricing system has been used for reimbursement purposes since 1993. Unfortunately his data (a panel of 22 APIs from 1972 to 1996) have a short overlap with the period after the introduction of this system. He ran an integer-valued autoregressive model by Non-Linear Least Squares, and found that expected profits affect positively the number of entries, but the longer the exclusivity period enjoyed by the branded pioneer drug, the lower the likelihood of generic entry.
Recent unpublished papers by Moreno-Torres and Borrell-Arqué (2007) and Iizuka (2008) analyze entry respectively in Spain and Japan, two heavily regulated markets, with tight price controls.
Spain is the 70th largest market in the world (50th in the EU), and price controls have been in force there since the 1920s. Reimbursement by the government has been subject to reference pricing since 2000. Following Berry (1992), and unlike Reiffen and Ward (2005), Moreno-Torres and Borrell-Arqué assume different entry costs and use a pure strategy equilibrium concept. Still they end up assuming a count data model: starting with a Poisson, and rejecting the hypothesis of equidispersion, they end up moving to a (zero-inflated) Fixed Effects Negative Binomial model. Their data set is an unbalanced panel covering 86 prescription drug APIs for a maximum number of 34 quarters, collected from the Spanish National Health System. They exclude OTCs, drugs for hospital consumption, non-oral drugs (thus excluding topicals and injectables), pediatric drug types, and drugs with more than one API. One singular feature of the Spanish price control system is that the drug maximum prices are fixed in a negotiation between the firm and the health authority and in particular new generic entrants have systematically been priced below the incumbent generic drugs. Moreover, as new generics enter, and due to the formula utilized, the reference price for reimbursement is recalculated downwards. Explaining variables include dummies for reference pricing and long duration treatment, age of the pioneer drug, number of generic firms in the market, and number of APIs in the therapeutic (ATC-4) subgroup. The first dummy and the last two variables are found significant and negatively signed, along with a (negatively signed) time trend and the (four-quarter) lagged market revenue level (found significantly negative). The results contrast with findings in the US market, but reinforce the thesis that regulations fostering generic substitution (the reference pricing system) deter entry.
Discussion Paper186 (1511a)

18
Japan is the second largest market in the world, and is severely regulated. Curiously, as Thomas (1996) note, a great share of drugs launched in Japan are local, i.e., they are marketed only there. Retail prices are set by the government, while wholesale prices are free. Prices are updated every other year, following a formula that combines the wholesale and the retail average prices. Generic drug introductory prices are set 30% below the comparable brand-name drugs’, and entry approvals are issued only once a year. Generic drugs’ shares are quite low in Japan, for several reasons, according to Iizuka (2008): i) difficulty to substitute generics at pharmacies (only allowed when prescription used the nonproprietary name, a provision reversed in April 2008); ii) widely believed perception of low quality for generics; iii) uncertainty in supply side, due to sudden exits of generic firms. A new reimbursement premium was created in 2002 that incentives generic prescription. Iizuka uses prescription data instead of market level data for 97 API-form-strength combinations (57 APIs) from Japan Medical Data Center from 2002 to 2006 and also uses a count data model (a negative binomial regression on pooled data) to estimate generic drug entry. He obtains some very interesting findings: i) fewer generic firms enter if there is a large number of brand names already in the market; ii) entry differs across therapeutic classes (for instance, they are lower in classes that treat cancer and the nervous system, where entry costs are higher and expeted revenues lower); iii) fewer generics enter a market with a high share of institutions where prescribingand dispensing are separated5–suggesting that integration take greater advantage of the generic drugs’ higher markup; and iv) fewer generics enter markets mainly used in large hospitals, whose physicians are strongly connected to medical schools, where in turn professors are often involved with the development of branded drugs.
4 THE MODEL
4.1 METHODOLOGY
Our observation is a count of entries of generic drugs for a single-API drug in a given route of administration and ATC-3 class, in a given year. There are three basic approaches for estimating regressions where the dependent variable is a non-negative integer: i) the usual linear regression, sometimes undertaking some monotonic transformation of the dependent variable to render it continuous; ii) a regression using a count data specification, from the Poisson family; iii) an ordered multinomial regression.
5. A unique feature of this industry in Japan is the integration of prescription and dispensation of drugs by doctors, especiallythe office-based.
B r a s í l i a , J a n u a r y 2 0 1 5

19
Estimations of generic drug entry in Brazil using count versus ordered models
Since linear regressions are more known, we attain ourselves to describe the other two model families. We then discuss the pros and cons of the three approaches, and in the next section their results are compared.
4.2 COUNT DATA MODELS
Poisson
The starting point for standard count data analysis is the Poisson regression model. In a cross-section, the basic model usually utilized for explaining an integer-valued variable y
i is:
( )!
yef y
y
such that:
´( | ) Var( | ) exp( )i i i i i iE y x y x x
The advantages of the Poisson regression, according to Hausman, Hall and Griliches (1984) are: i) it is analogous to the standard regressions in the sense that the one obtains a parametrized mean conditional on explaining variables, estimated by some weighted least squares (nowadays extended to the generalized method of moments) or maximum likelihood procedure, and thanks to its global concavity the optimization algorithms converge fast; ii) the zero problem y
i = 0 is a natural outcome
of the distribution, and the integer property as a whole is handled directly, in contrast to the usual logarithmic regression specification, where a continuous distribution needs to be truncated; and iii) the Poisson specification “allows for convenient time aggregation so long as its basic assumption of time independence holds true”, such that the summation of a Poisson-distributed variable over time also follows a Poisson whose mean equals the summation of the period means. However, the authors also point out, “the time independence property is also a potential weakness (...), given the often noted serial correlation of residuals in econometric specifications” (p. 911).
The Poisson distribution arises in two studies of generic drug entry: Scott-Morton (2000) and Reiffen and Ward (2005). The former very plainly assserts that a reasonable specification for regressing the number of entrants on the proposed explanatory variables is an exponential, thus yielding the Poisson family. The latter elaborate more the microfoundations for using a Poisson-type regression: they assume that the firms are
Discussion Paper186 (1511a)

20
homogeneous in regard to their ability to enter and produce a generic drug. They also assume that generic rents are sufficient to enable at least one entry, and that each firm’s profits from producing a drug are decreasing in the number of rival producers of the drug. Based on stylized facts that firms decide entry at a point usually 2 to 3 years prior to patent expiration, each firm’s choice in a given market is modeled as independent and simultaneous. A generic drug firm deciding whether to enter or not forms an expected market profit by considering issues of demand, supply (other entrants), and regulatory uncertainty. Then it enters if the expected markup (net of variable costs)–Scott-Morton (2000)–or the net present value–Reiffen and Ward (2000)–covers the fixed cost of entry (namely, the cost of filing the ANDA). Thus, the larger the expected profits, the greater the number of entrants, until expected profit is zero:
[ ] ( [ ])i iE N f E (1)
where N is the number of generic drug firms and Πi is firm i’s profit.
In the symmetric (mixed strategy) Nash equilibrium that comes out, each firm i chooses to enter market k with the same probability µ
k –reflecting the aforementioned
firms’ homogeneity–, which depends on the expected rents in the market. The resulting equilibrium distribution of the number of entrants is a binomial, which is then approximated by a Poisson.
For the Poisson Maximum Likelihood Estimator, it can be shown that (see CAMERON; TRIVEDI, 1998): i) consistency requires a correct specification of the conditional mean, but not that the dependent variable is actually Poisson distributed; ii) valid statistical inference using computed ML standard errors and t-statisticsrequires correct specification of both the conditional mean and variance. That requires equidispersion (i.e. the distribution’s property that the mean equals variance, or equation (1), but, again, not a Poisson distribution for y; iii) valid statistical inference using appropriately modified ML output is still possible when data are not equidispersed, as long as the conditional mean is correctly specified; in this case, it is necessary to adjust the standard error estimates, what yields a Pseudo-MLE; and iv) more efficient estimators than Poisson can be obtained if data are not equidispersed.
In fact, equidispersion in the Poisson model is a very severe restriction, analogous to homoskedasticity in OLS, and is often rejected by the data. To address this issue, a
B r a s í l i a , J a n u a r y 2 0 1 5
21
Estimations of generic drug entry in Brazil using count versus ordered models
number of alternatives have been proposed, departing in various extents from the basic Poisson model. We describe next the models we explored for the present study.
Negative binomial
A more flexible specification allows for the conditional variance to be:
Var( | ) ( , )i i i iy x
The most utilized specification for this function is the family:
. pi i i
In particular, the default Negative Binomial specification assumes p = 1 (NB1 model), so that the conditional variance becomes a constant multiple of the conditional mean:
Var( | ) (1 ) exp( ´ )i i iy x x
One derivation of the negative binomial is that the individual units follow a Poisson regression model, but there is an omitted variable v
i:
´exp( )i i ix v (2)
such that vi follows a Gamma distribution:
~ Gamma( / , )v j
ie
Another specification (NB2) is obtained when vi follows another Gamma
distribution:
~ Gamma(1/ , )v je
and therefore,
Discussion Paper186 (1511a)
22
Var( | ) (1 )i i i iy x
The distribution obtained can be interpreted as a parametric mixture of two distributions, the Poisson and a conjugate Gamma:
( | , ) ( | , ) ( ; )h y f y v g v dv
where f (y|µ, v) is the Poisson distribution referring to the conditional mean – equation (2) –, and g(v: α) in turn is another mixing distribution. In the NB1 case:
111 11
1
( )( ; ) , 0
( )vg v v e (3)
where:
1
0
( ) , 0t aa e t dt a
Substituting the Poisson and the mixed Gamma – equation (3) – back into h(y|µ, α), we obtain:
11 1
1 1 1
( )( | , )
( ) ( 1)
yy
h yy
and the log-likelihood to be maximized in the NB1 case is:
11 1
1 0
´ln ( , ) ln( ) ln ! ( ) ln(1 exp( ))
´ln
yn i
i i ii j
i i i
L j y y x
y y x
Zero-inflated models
Lambert (1992) introduced the Zero-Inflated Poisson in order to account for the excess number of zeros usually found in count regressions, which imply overdispersion. It can be interpreted as a mixture of the Poisson distribution
2( )f with a degenerate distribution whose mass is concentrated at zero. A binary process with density
1( )f sorts
B r a s í l i a , J a n u a r y 2 0 1 5

23
Estimations of generic drug entry in Brazil using count versus ordered models
the outcomes between the two distributions. Thus, a zero can be an outcome either of the degenerate distribution or of the Poisson distribution, and the resulting probabilities are:
1 1 2Pr[ 0] (0) (1 (0)) (0)iy f f f
1 2Pr[ ] (1 (0)) ( ), 1,2,...iy r f f r r
The binary distribution is ordinarily specified as a logit with regressors zi and
parameters γ. The log-likelihood then becomes:
1
1 1
´ ´ln ( ) 1( 0)ln(exp( ) exp( exp( )))
´ ´ ´(1 1( 0))( exp( exp( ))) ln(1 exp( ))
n
i i ii
n n
i i i i ii i
L y z x
y y x x z
The zero-inflated negative binomial follows the same reasoning, just substituting the negative binomial for 2( )f .
4.3 ORDERED MULTINOMIAL MODELS
In such models a fixed number of outcomes, say m, can be obtained, which can be then ordered into integer categories. Let the latent variable be:
* ´i i iy x u
Then define the observed outcome
*1ifi j i jy j y
where the aj are the thresholds, or cutoff points, to be estimated along with the β
parameters by MLE. It is conventioned that 0 and m . Then
*
1 1´ ´Pr[ ] Pr( ) ( ) ( )i j i j j i j iy j y F x F x
where ( )F is the cdf of ui. An ordered logit is such model where the cdf is a logistic
distribution, and an ordered probit where the cdf is a Normal. In the former case,
Discussion Paper186 (1511a)
24
there are K + m – 1 parameters to be estimated, where K is the dimension of β, while in the latter case, there are (m – 1)(K + 1) parameters. These models have been applied to count data that take very few values. In some cases, as in our present study, the frequency of higher values is low enough so that an upper censoring is undertaken (namely, entries above five are censored at that level).
5 DATA AND RESULTS
Our estimations are based on retail level market data. IMS Health is the main market audit company of the pharmaceutical industry worldwide. Pharmaceutical Market Brazil (PMB) surveys sales only through retail channel, so we are not able to include hospital sales as explaining variable. Only recently have hospital sales started being collected. We use then PMB data but exclude drugs sold typically or exclusively to hospitals, such as anesthesia, parenteral solutions, diagnostic agents, and blood derivatives. The data base had also to be cleaned up with the exclusion of functional food, shampoos, soaps and other cosmetics. But phytotherapics have not been excluded.
PMB records extracted comprised monthly sales in volume and value (local currency). Units are packages. Strength (amount of API content in the drug) is not available for all drugs in a separate field, but packaging description is not standardized; as a consequence, the field for equivalent dosages is also incomplete. We observe sales per brand and packaging. Descriptive variables include: seller´s name; API; type of drug (reference, similar or generic); launching date of the packaging; launch date of the brand or generic; form and route of administration (e.g., tablets, sprays, ampoles, etc.). Following Scott-Morton (1999, 2000) and advice from the industry,6 we grouped forms into: i) oral solids; ii) oral liquids; iii) semi-solids (topics and suppositories); iv) injectables; and v) sprays. Scott-Morton’s original papers groups orals together, and semi-solids and sprays into “topics”. We define then a drug as the triple API-class-form.
We have no reliable data on advertisement and promotion (detailing). Prescription data have not been explored yet.
6. We are extremely grateful to Mr. Jair Calixto, manager of good manufacturing practices and pharmaceutical audits of thePharmaceutical Industry Syndicate of São Paulo for graciously providing advice on the classification of production processes.
B r a s í l i a , J a n u a r y 2 0 1 5
25
Estimations of generic drug entry in Brazil using count versus ordered models
PMB has an unfortunate feature worldwide: the seller´s name is not tracked along the months; when a brand is transfered because of divestiture, licensing, partial or total merger or acquisition, the whole sales series are relabeled to the new seller. Depending on the date of the extraction, the whole series will be completely assigned to the current seller. We overcame this obstacle with an external data base, from ABCFarma, a monthly magazine containing all drug price lists. By consolidating all price lists throughout the period, we were able to identify each drug’s seller in each month. As the drug labels of IMS and ABCFarma were not completely comparable, we summarized the transition pairs of sellers and doublechecked them with merger dates from the Brazilian antitrust agencies and by searching the Web. Parent companies were also checked this way, and additionally by checking the addresses of the companies registered at CMED/Anvisa. The heavy workload at this stage of our research process could never be overstated. To the best of our knowledge, this is the first work in the international literature that complements IMS data with other pieces of information to overcome such a classical data limitation problem.
5.1 DESCRIPTIVE STATISTICS
We found 686 single-API drugs that were not under patent at least one year of our sampled period; in fact, 20 drugs had their patent expired during our sample; only three of them had generics launched. One of them was letrozole, expired in 2007, but with an (own-) generic launched in 2006. This was the only case of own-generic launched before expiration in our sample. We then obtained 1,023 drugs (triples API-class-form).
During a revision of the article, a number of APIs were found to be erroneously excluded. At the same time, we had access to a compilation–made by the Brazilian patent office Inpi–of patent litigations initiated by patent holders regarding the so-called pipeline inventions. The patent holders went to court alleging that the patent lifetimes should expire later than what had been granted by Inpi. Some cases were won by the patent holders, other were won by Inpi. We found therefore many divergences between the expiry dates of our original source IMS Life Cycle and the dates eventually settled or resolved in court.We summarize in Table 3 the divergences of expiry dates and the eventual expiry dates that we settled for.
Discussion Paper186 (1511a)
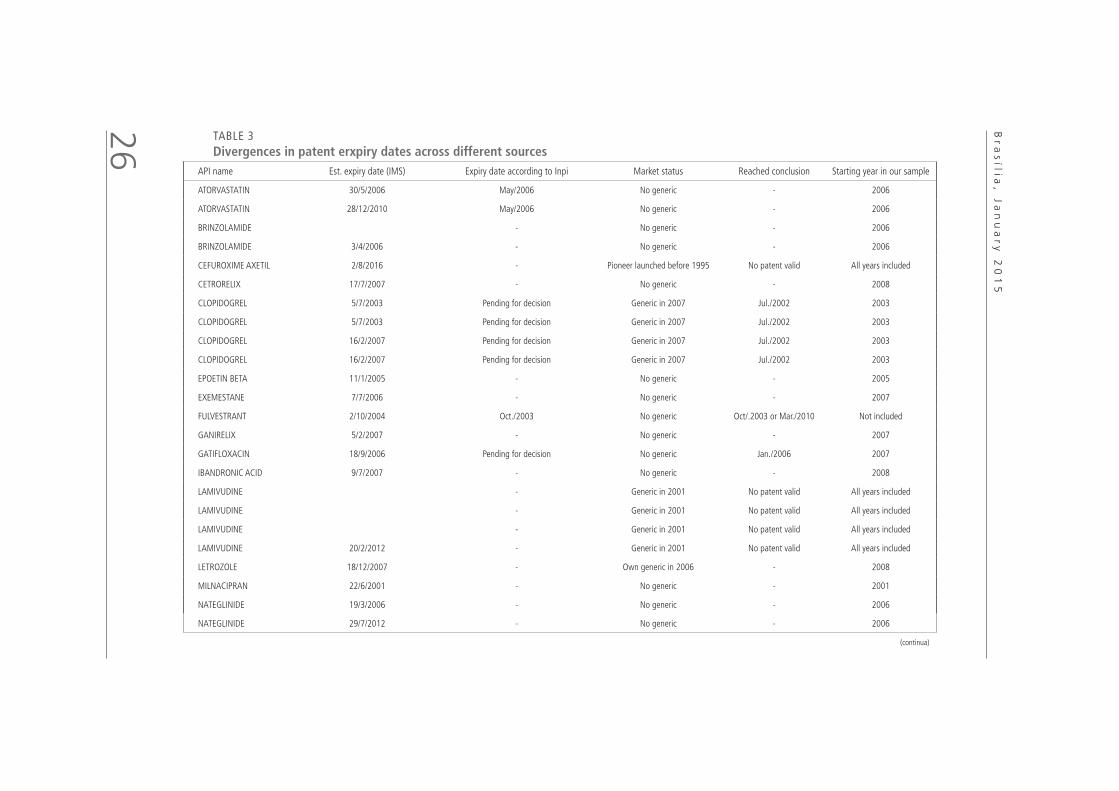
26 TABLE 3
Divergences in patent erxpiry dates across different sources
API name Est. expiry date (IMS) Expiry date according to Inpi Market status Reached conclusion Starting year in our sample
ATORVASTATIN 30/5/2006 May/2006 No generic - 2006
ATORVASTATIN 28/12/2010 May/2006 No generic - 2006
BRINZOLAMIDE - No generic - 2006
BRINZOLAMIDE 3/4/2006 - No generic - 2006
CEFUROXIME AXETIL 2/8/2016 - Pioneer launched before 1995 No patent valid All years included
CETRORELIX 17/7/2007 - No generic - 2008
CLOPIDOGREL 5/7/2003 Pending for decision Generic in 2007 Jul./2002 2003
CLOPIDOGREL 5/7/2003 Pending for decision Generic in 2007 Jul./2002 2003
CLOPIDOGREL 16/2/2007 Pending for decision Generic in 2007 Jul./2002 2003
CLOPIDOGREL 16/2/2007 Pending for decision Generic in 2007 Jul./2002 2003
EPOETIN BETA 11/1/2005 - No generic - 2005
EXEMESTANE 7/7/2006 - No generic - 2007
FULVESTRANT 2/10/2004 Oct./2003 No generic Oct/.2003 or Mar./2010 Not included
GANIRELIX 5/2/2007 - No generic - 2007
GATIFLOXACIN 18/9/2006 Pending for decision No generic Jan./2006 2007
IBANDRONIC ACID 9/7/2007 - No generic - 2008
LAMIVUDINE - Generic in 2001 No patent valid All years included
LAMIVUDINE - Generic in 2001 No patent valid All years included
LAMIVUDINE - Generic in 2001 No patent valid All years included
LAMIVUDINE 20/2/2012 - Generic in 2001 No patent valid All years included
LETROZOLE 18/12/2007 - Own generic in 2006 - 2008
MILNACIPRAN 22/6/2001 - No generic - 2001
NATEGLINIDE 19/3/2006 - No generic - 2006
NATEGLINIDE 29/7/2012 - No generic - 2006
(continua)
Br
as
ília, J
an
ua
ry
20
15

27
Estimations of generic drug entry in Brazil using count versus ordered m
odels (continued)
API name Est. expiry date (IMS) Expiry date according to INPI Market status Reached conclusion Starting year in our sample
OLOPATADINE 15/8/2006 - No generic - 2007
OMEPRAZOLE - Pioneer launched before 1995 No patent valid All years included
OMEPRAZOLE 11/6/2018 - Pioneer launched before 1995 No patent valid All years included
ORLISTAT 5/6/2004 June/2003 No generic Jun./2003 2004
PIOGLITAZONE 9/1/2006 Pending for decision No generic Jan./2005 or Jun./2015 Not included
PRAMIPEXOLE 16/12/2005 Pending for decision No generic - 2006
QUETIAPINE 24/3/2007 Pending for decision No generic Mar./2006 2007
RALOXIFENE 3/4/2001 Apr./2001 No generic Apr./2001 2001
RALOXIFENE 20/3/2017 Apr./2001 No generic Apr./2001 2001
ROPINIROLE 7/12/2002 Application filed No generic Dec./2002 2003
SAQUINAVIR 10/12/2005 - No generic - 2006
SIBUTRAMINE 31/3/2002 Pending for decision Generic in 2006 Apr./2001 or May/2006 2006
SIBUTRAMINE 31/3/2002 Pending for decision Generic in 2006 Apr./2001 or May/2006 2006
TIMOLOL - Pioneer launched before 1995 No patent valid All years included
TIMOLOL - Pioneer launched before 1995 No patent valid All years included
TIMOLOL 23/6/2013 - Pioneer launched before 1995 No patent valid All years included
TOLCAPONE 11/3/2007 Mar./2006 No generic Mar./2006 2007
VERTEPORFIN 24/4/2007 Jan./2007 No generic Jan./2007 2007
VORICONAZOLE 3/8/2009 Application filed No generic Jan./2011 or Aug./2008 Not included
VORICONAZOLE 1/2/2006 Application filed No generic Jan./2011 or Aug./2008 Not included
VORICONAZOLE 24/1/2011 Application filed No generic Jan./2011 or Aug./2008 Not included
ZIPRASIDONE 2/3/2007 Mar./2007 No generic Mar./2007 2007
ZOLMITRIPTAN Application denied No generic No patent valid All years included
ZOLMITRIPTAN 6/6/2011 Application denied No generic No patent valid All years included
Sources: IMF LifeCycle and Inpi.
Authors´ compilation.
Discussion
Paper186 (1511a)

28
Tables 4 and 5 summarize entry and generic penetration in the markets. Table 4 bring the shares of drugs containing generic versions in each year, both in number and in revenue. It also brings the shares of drugs where generic entry occurred in the same year, also in number and in revenue. One interesting feature to remark is that the revenue shares of drugs with entry and of drugs with generics moved in opposite directions. Table 5 counts drug market yearly observations according to the number of generic drug entrants recorded in the respective year.
TABLE 4
Drugs with entry and drugs with generics, versus total sample
YearShare of drugs with entry along the year, in number
Share of drugs with generics, in number
Share of drugs with entry along the year, in revenue
Share of drugs with generics, in revenue
2000 11,35 12,24 81,31 4,40
2001 13,95 17,95 79,37 11,08
2002 15,52 23,59 78,41 16,35
2003 12,81 25,00 65,34 19,70
2004 15,60 28,20 68,52 21,85
2005 15, 98 30,94 65.63 24,59
2006 13,14 32,85 50.91 29.28
2007 12,72 33,99 60,42 33,87
Source: IMS/PMB sample of single-API drugs.Authors´ compilation.
TABLE 5
Yearly generic entry across ATC-1 classes
ATC-1 class 0 1 2 3 4 5+ Total
A 609 51 25 12 3 4 704
B 249 5 2 0 0 0 256
C 827 89 26 17 8 3 970
D 561 49 28 7 9 10 664
G 615 27 13 6 2 0 663
H 185 10 11 4 5 2 217
J 744 94 56 13 13 12 932
L 264 9 0 0 0 0 273
M 506 42 21 6 6 11 592
N 1.104 106 36 15 11 10 1.282
P 242 7 10 2 6 5 272
R 667 58 22 11 11 7 776
S 425 16 9 0 2 1 453
Total 6.998 563 259 93 76 65 8.054
Source: IMS/PMB sample of single-API drugs.Authors´ compilation.
B r a s í l i a , J a n u a r y 2 0 1 5
29
Estimations of generic drug entry in Brazil using count versus ordered models
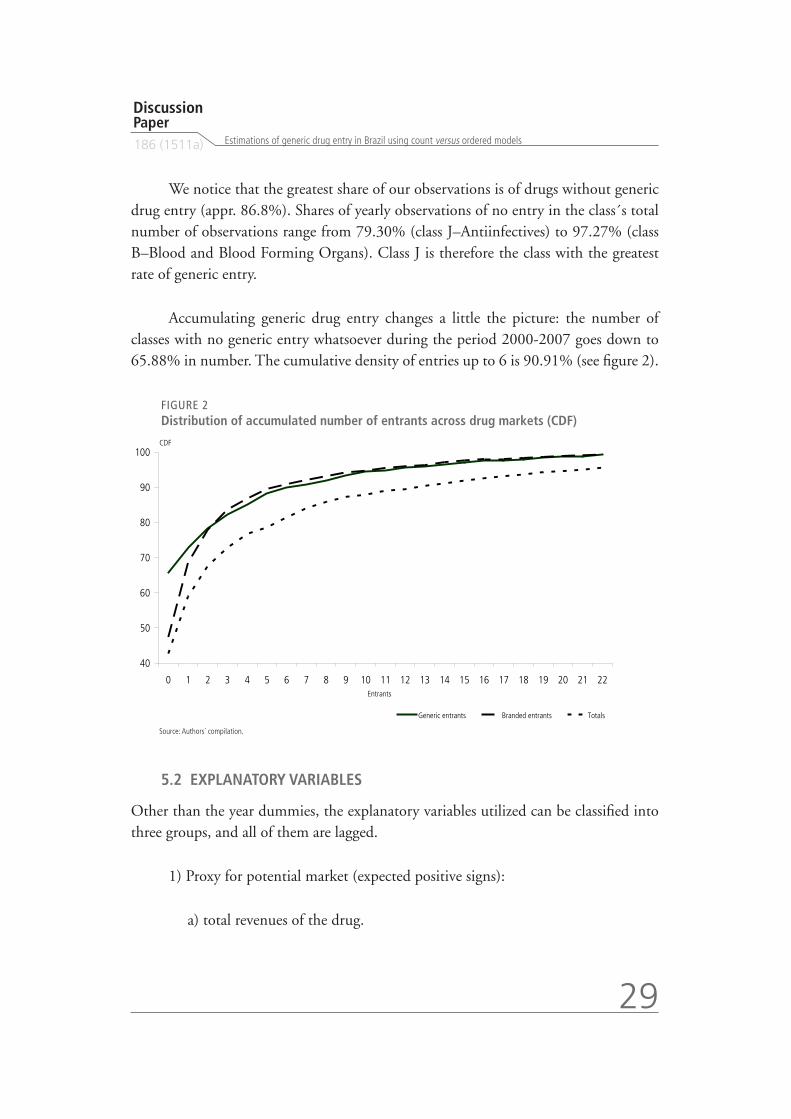
We notice that the greatest share of our observations is of drugs without generic drug entry (appr. 86.8%). Shares of yearly observations of no entry in the class´s total number of observations range from 79.30% (class J–Antiinfectives) to 97.27% (class B–Blood and Blood Forming Organs). Class J is therefore the class with the greatest rate of generic entry.
Accumulating generic drug entry changes a little the picture: the number of classes with no generic entry whatsoever during the period 2000-2007 goes down to 65.88% in number. The cumulative density of entries up to 6 is 90.91% (see figure 2).
FIGURE 2
Distribution of accumulated number of entrants across drug markets (CDF)
5.2 EXPLANATORY VARIABLES
Other than the year dummies, the explanatory variables utilized can be classified into three groups, and all of them are lagged.
1) Proxy for potential market (expected positive signs):
a) total revenues of the drug.
Source: Authors´ compilation.
40
50
60
70
80
90
100
0 1 2 3 4 5 6 7 8 9 10 11 12 13 14 15 16 17 18 19 20 21 22
Entrants
CDF
Generic entrants Branded entrants Totals
Discussion Paper186 (1511a)

30
2) Variables concerning market structure (expected mixed signs):
a) the log of the ratio of the total revenues of single-API drugs in thetherapeutic class (ATC-3) to the total revenues of the drug (so as to measure the importance of other single-API drugs in the class; a negative sign would signify that the particular drug faces harsh competition of therapeutic substitutes);
b) the log of the ratio of the total revenues of the therapeutic class (ATC-3)to the total revenues of single-API drugs in that class (so as to measure theimportance of multi-API drugs in the class; a negative sign would signifythat there are additional therapeutic substitutes, combining different APIs);
c) share of the pioneer drug’s seller (branded + generic) in the drug market;
d) number of firm groups in the therapeutic class (ATC-3);
e) Herfindahl-Hirschmann concentration index (HHI) of the drug;
f ) number of single-API drugs in the therapeutic class (ATC-3);
g) number of single-API drugs in the therapeutic class (ATC-3) and with thesame form;
h) number of non-generic brands of the drug;
i)share of phytotherapic drugs in the therapeutic class revenues.
3) Variables related to barriers to entry (expected negative signs):
a) number of extended release brands;
b) number of own-generics of the same drug;
c) number of brands and generics of the pioneer drug’s seller in the drugmarket;
B r a s í l i a , J a n u a r y 2 0 1 5

31
Estimations of generic drug entry in Brazil using count versus ordered models
d) share of the own-generic revenues in the drug’s total revenues; e
e) age of pioneer drug.7
5.3 RESULTS
The reader should bear in mind that, unlike in the linear regressions, marginal effects in count data regressions are nonlinear. In particular, the derivative of the expected count w.r.t. a particular regressor x
j in the Poisson and Negative Binomial family has
the following formula:
[ | ]´exp( )j i
j
E y xx
x
The K-vector of derivatives in an ordered multinomial model is calculated for each value of the dependent variable’s support:
1
Pr[ | ] ´´ ´[ '( ) ( )]i ij i j i
i
y j xF x F x
x
where ´( )F is the derivative of the respective cdf applying to the problem: in the logit case, ´( ) ( )(1 ( ))F , where ( ) is the logistic cdf; in the probit case, ( ) issimply the Normal pdf ´( )F .
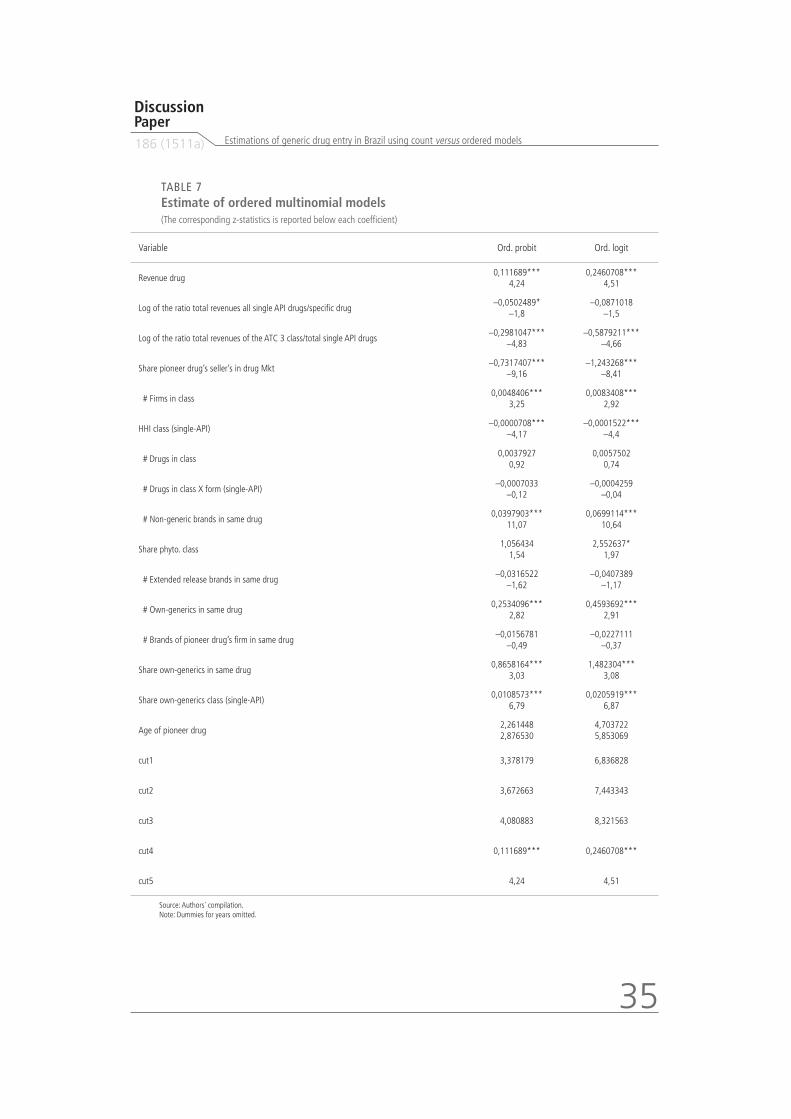
Tables 6 and 8 display the marginal effects of the count data models and of the ordered probit, respectively. Ordered Probit and Ordered Logit’s results are compared in Table 7. Results show that: as regards count models, we found that a simple Poisson regression provides a poor estimation of generic drug entry because of overdispersion; both the Negative Binomial family and the zero-inflated models improve considerably over Poisson. Most of the explaining variables utilized are significant throughout all or most of the regression specifications, in particular:
1) The proxy for potential market (the lagged revenues of the particular drug)has significant positive sign, as expected.
7. As a proxy for the drug’s maturity, this variable is the only one expected to be positively related to entry.
Discussion Paper186 (1511a)

32
2) Both the two log ratios (total ATC-3 class revenues to total revenues of single-APIdrugs, and the latter to revenues of the drug) have negative signs, thus indicating thatcompetition from other drugs is quite important in the decision whether to enter.
3) The share of the pioneer drug’s seller has an ambiguous sign; in somespecifications, has a dissuading (negative) significant effect on entry for most specifications, but is positive and non-significant for the zero-inflated models.
4) A higher number of firms selling in the ATC-3 class apparently attractsprospective entrants.
5) A lower drug market concentration as measured by the HHI attracts entry.
6) The coefficients of the number of single-API drugs in the therapeutic classhave mixed signs: the summation over the entire class has a positive sign (notsignificant in all specifications), while the summation within the same form inthe class has a negative sign (also not significant everywhere).
7) The lagged number of non-generic brands is positively correlated with entry;apparently the rules for entry pricing favor entry of branded drugs before generics,so the number of brands seem to work as leading indicators of generic entry.
8) The lagged number of own generics surprisingly affects positively entry(although not always significant), but their share has a significant (positive) coefficient only when measured in the restricted drug’s market, not in the whole single-API market (excluded from the regressions reported).
9) The number of extended release brands (except in the negative binomialspecification, where it is non-significant) and the number of brands belonging to the reference drug’s seller (barely, and not always significant) mostly seem to affect negatively entry, as expected (market preemption).
10) The share of phyotherapic revenues is not significant for explaining entry.
11) The significant coefficient for the age of the pioneer drug–a proxy for the ageof the molecule and therefore of the maturity of the drug’s market–points out that it attracts generic entry.
B r a s í l i a , J a n u a r y 2 0 1 5

33
Estimations of generic drug entry in Brazil using count versus ordered m
odels TABLE 6
Marginal effects in count data regressions and diagnostic tests
Poisson NB2 NB1 Generalized NB ZIP ZINB
Generic drug entrants dy/dx z dy/dx z dy/dx z dy/dx z dy/dx z dy/dx z
Revenue drug 0,2686935*** 7,58 0,2414827*** 5,23 0,2410283*** 5,29 0,253932*** 5,37 0,0956557** 2,36 0,1091837** 2,22
Log of the ratio total revenues all single API drugs/specific drug
–0,113694*** –2,90 –0,078291 –1,61 –0,1098209** –2,20 –0,1194399** –2,16 –0,0961941** –2,14 –0,0710171 –1,36
Log of the ratio total ver. of the ATC 3 class/total single API drugs
–0,4976481*** –5,67 –0,5547964*** –4,84 –0,5119915*** –4,73 –0,5139489*** –4,19 –0,3452434*** –3,54 –0,4433733*** –3,84
Share pioneer drug's seller's in drug Mkt
–0,9547895*** –10,45 –1,399753*** –10,20 –1,021175*** –8,81 –1,106961*** –6,51 0,4292445*** 3,24 0,2172213* 1,24
Firms in class 0,0086796*** 4,79 0,009248*** 3,74 0,0077471*** 3,29 0,0091379*** 3,44 0,0056652*** 2,70 0,0069579*** 2,75
HHI class (single-API) –0,0001808*** –7,45 –0,0001434*** –4,68 –0,0001708*** –5,67 –0,0001711*** –4,75 –0,0001188*** –4,21 –0,0001255*** –3,83
drugs in class 0,0132002*** 2,88 0,011185* 1,66 0,0084785 1,40 0,0169227** 2,27 0,0043895 0,87 0,0012977 0,19
Drugs in class X form (single-API) –0,0221893*** –3,28 –0,0150618* –1,52 –0,0107963 –1,22 –0,0208555** –1,88 –0,0031849 –0,43 0,0023195 0,23
Non-generic brands in same drug 0,0313574*** 10,24 0,0385368*** 6,78 0,0333255*** 8,12 0,0286894*** 6,17 0,0208239*** 5,58 0,0294583** 5,68
Share phyto. class 0,3203397 0,27 1,300434 0,98 1,88364 1,60 0,8711673 0,48 –3,148763** –2,13 –1,592521 –1,08
Extended release brands in same drug
–0,0340952* –1,89 –0,0779116** –2,54 –0,0219007 –0,91 –0,0179572 –0,72 –0,0261896 –1,56 –0,0520909** –2,11
Own-generics in same drug 0,2777355*** 3,27 0,2032483 1,47 0,3508542*** 3,16 0,2343427** 2,01 0,1895702** 2,27 0,296744** 2,56
Brands of pioneer drug's firm in same drug
–0,0818866*** –3,12 0,0897238 1,61 –0,1024544*** –2,95 –0,0956266*** –2,71 –0,0626598** –2,31 –0,0601817 –1,44
Share own-generics drug 1,344553*** 5,05 1,228538** 2,77 1,41561*** 4,26 1,405098*** 3,19 0,2732264 0,98 0,4255435 1,12
Share own-generics class (single-API)
0,0215445*** 11,41 0,0229559*** 8,37 0,0203999*** 8,55 0,0248361*** 7,25 0,0041921* 1,70 0,0060822** 2,03
(cont.)
Discussion
Paper186 (1511a)

34 (cont.)
Poisson NB2 NB1 Generalized NB ZIP ZINB
Generic drug entrants dy/dx z dy/dx z dy/dx z dy/dx z dy/dx z dy/dx z
Age of pioneer drug –0,3686243*** –4,17 –0,2065896 –1,57 –0,1536872 –1,25 –0,4433317*** –2,97 –0,5242426*** –5,34 –0,3425739*** –2,61
Year 2001 –0,3299441*** –3,92 –0,226676* –1,75 –0,0768004 –0,65 –0,3968278*** –2,93 –0,4540392*** –4,88 –0,3288457*** –2,60
Year 2002 –0,6735781*** –7,54 –0,5393067*** –4,02 –0,4485336*** –3,61 –0,7354167*** –5,02 –0,7211295*** –7,33 –0,5777767*** –4,42
Year 2003 –0,5373574*** –6,38 –0,3243467** –2,51 –0,3337966*** –2,80 –0,6606021*** –4,47 –0,562663*** –6,02 –0,3968393*** –3,14
Year 2004 –0,612224*** –7,28 –0,2425954* –1,88 –0,4904056*** –4,05 –0,6851734*** –4,69 –0,5496984*** –5,89 –0,3293807*** –2,60
Year 2005 –0,9354981*** –10,35 –0,7260876*** –5,32 –0,7829146*** –6,13 –1,003927*** –6,80 –0,7601198*** –7,58 –0,6227168*** –4,72
Year 2006 –1,311444*** –13,07 –1,134835*** –7,77 –0,9663534*** –7,34 –1,378103*** –8,98 –1,109099*** –10,02 –0,9791434*** –6,97
Year 2007 0,2686935*** 7,58 0,2414827*** 5,23 0,2410283*** 5,29 0,253932*** 5,37 0,0956557** 2,36 0,1091837** 2,22
Poisson NB2 NB1 Generalized NB ZIP ZINB
AIC 8029.605 7288.393 7175,554 7111.027 7142.346 6867.439
BIC 8188.28 7453.967 7341.128 7330.662 7342.414 7074.406
R2/Pseudo-R2 0.3173 0.1845 0.1972 0.1097
Test statistic P-value Test statistic P-value Test statistic P-value Test statistic P-value Test statistic P-value Test statistic P-value
Chi-Sq/F 3710.13 0 1637.91 0 1750.75 0 868.39 0 437.84 0 373.83 0
Vuong test 10.79 0 10.19 0
Log-likelihood –3991.8025 –3620.1964 –3563,7771 –3523.51 –3542.173 –3403.719
Auxiliary regressions NB2 NB1 Generalized NB (ln(alfa)) ZIP (inflate) ZINB (inflate)
Coef. P-value (Chi²) Coef. P-value (Chi²) Coef. z Coef. z Coef. z
Alpha 1,729914 0 , 7831715
Delta 1,078136 0
Share pioneer drug's seller's in drug Mkt 0,8574764** 2,51 0,1679181*** 5,30 1,758095*** 2,87
Share phyto. class –6,76732 –1,44 –8,258417*** –2,81 –7,516781** –2,56
Revenue drug –9,3130173*** –4,62 –0,2180403*** –4,02 –0,1628481** –2,42
Log of the ratio total revenues all single API drugs/ specific drug
–0,0553626 –0,80 –0,1698761*** –3,06 –0,107918 –1,57
No. de non-generic brands in same drug –6,856791** –2,47 –8,959656*** –3,73 –485,6201 –0,36
Participação de genéricos próprios na classe (só monodrogas) 11,5545** 2,29 20,45706*** 4,38 –454,4471 0,04
Número de não genéricos por medicamento –0,0613625*** –3,92 –0,4117045*** –6,89 –0,7783402*** –8,84
Source: Authors´ compilation.
Br
as
ília, J
an
ua
ry
20
15
35
Estimations of generic drug entry in Brazil using count versus ordered models
TABLE 7
Estimate of ordered multinomial models(The corresponding z-statistics is reported below each coefficient)
Variable Ord. probit Ord. logit
Revenue drug0,111689***
4,240,2460708***
4,51
Log of the ratio total revenues all single API drugs/specific drug–0,0502489*
–1,8–0,0871018
–1,5
Log of the ratio total revenues of the ATC 3 class/total single API drugs–0,2981047***
–4,83–0,5879211***
–4,66
Share pioneer drug’s seller’s in drug Mkt–0,7317407***
–9,16–1,243268***
–8,41
# Firms in class0,0048406***
3,250,0083408***
2,92
HHI class (single-API)–0,0000708***
–4,17–0,0001522***
–4,4
# Drugs in class0,0037927
0,920,0057502
0,74
# Drugs in class X form (single-API)–0,0007033
–0,12–0,0004259
–0,04
# Non-generic brands in same drug0,0397903***
11,070,0699114***
10,64
Share phyto. class1,056434
1,542,552637*
1,97
# Extended release brands in same drug–0,0316522
–1,62–0,0407389
–1,17
# Own-generics in same drug0,2534096***
2,820,4593692***
2,91
# Brands of pioneer drug’s firm in same drug–0,0156781
–0,49–0,0227111
–0,37
Share own-generics in same drug0,8658164***
3,031,482304***
3,08
Share own-generics class (single-API)0,0108573***
6,790,0205919***
6,87
Age of pioneer drug2,261448 2,876530
4,703722 5,853069
cut1 3,378179 6,836828
cut2 3,672663 7,443343
cut3 4,080883 8,321563
cut4 0,111689*** 0,2460708***
cut5 4,24 4,51
Source: Authors´ compilation.Note: Dummies for years omitted.
Discussion Paper186 (1511a)

36
TABLE 8
Marginal effects of ordered probit models for each count bracket
c1 c2 c3 c4 c5 c6
Revenue drug–0,01702378
–4,28 0,0110211
4,24 0,0040641
4,17 0,00105055
3,89 0,0006273
3,74 0,00026067
3,35
Log of the ratio total ver. all single API drugs/ specific drug
0,007659 1,8
–0,0049584 –1,8
–0,0018285 –1,79
–0,00047264 –1,77
–0,0002822 –1,75
–0,00011728 –1,71
Log of the ratio total rev. of the ATC 3 class/total single API drugs
0,04543749 4,87
–0,029416 –4,81
–0,0108474 –4,71
–0,00280398 –4,3
–0,0016743 –4,09
–0,0007297 –3,59
Share pioneer drug’s seller’s in drug Mkt 0,11153282
9,28–0,0722058
–8,95–0,0266265
–8,22–0,00688278
–6,46–0,0041099
–5,77–0,00170782
–4,52
# Firms in class–0,00073781
–3,25 0,0004777
3,24 0,0001761
3,2 0,00004553
3,05 2,719E–05
2,97 0,0000113
2,77
HHI Class (single-API) 0,0000108
4,22–6,99E–06
–4,18–2,58E–06
–4,12–6,66E–07
–3,85–3,98E–07
–3,69–1,65E–07
–3,32
# Drugs in class–0,00057809
–0,92 0,0003743
0,92 0,000138
0,92 0,00003567
0,91 0,0000213
0,91 8,85E–06
0,91
# Drugs in class X form (single-API) 0,0001072
0,12–0,0000694
–0,12–2,559E–05
–0,12–6,62E–06
–0,12–3,95E–06
–0,12–1,64E–06
–0,12
# Non-generic brands in same drug–0,00606489
–9,76 0,0039264
9,55 0,0014479
8,31 0,00037427
6,48 0,0002235
5,78 0,00009287
4,59
Share phyto. class–0,16102301
–1,54 0,1042455
1,54 0,0384415
1,54 0,00993685
1,52 0,0059336
1,51 0,00246563
1,48
# Extended release brands in same drug 0,00482447
1,62–0,0031233
–1,62–0,0011518
–1,61–0,00029772
–1,59–0,0001778
–1,58–0,00007387
–1,55
# Own-generics in same drug–0,03862501
–2,8 0,0250056
2,79 0,0092211
2,75 0,00238358
2,67 0,0014233
2,61 0,00059144
2,45
# Brands of Pioneer drug’s firm in same drug 0,00238967
0,49–0,00154706
–0,49–0,00057049
–0,49–0,00014747
–0,49–0,00008806
–0,49–0,00003659
–0,49
Share own-generics in same drug–0,13196881
–3,02 0,08543594
3,01 0,03150527
2,97 0,0081439
2,85 0,00486296
2,79 0,00202075
2,6
Share own-generics in class (single-API)–0,00165488
–6,92 0,00107136
6,76 0,00039507
6,45 0,00010212
5,5 0,00006098
5,07 0,00002534
4,18
Age of pioneer drug 0,0075718
0,64–0,00493286
–0,63–0,00179471
–0,64–0,00045964
–0,65–0,00027255
–0,65–0,00011204
–0,66
Year 2001 0,00170228
0,14–0,0011036
–0,14–0,00040575
–0,14–0,00010467
–0,14–0,0000624
–0,14–0,00002587
–0,14
Year 2002 0,03059214
3,08–0,02030278
–3–0,00708824
–3,12–0,00176587
–3,09–0,00102601
–3,08–0,00040923
–2,95
Year 2003 0,01528036
1,39–0,0100166
–1,37–0,00359543
–1,41–0,0009124
–1,42–0,00053732
–1,43–0,00021861
–1,44
Year 2004 0,01836707
1,71–0,01206952
–1,69–0,00430891
–1,73–0,00108947
–1,75–0,00063987
–1,76–0,00025928
–1,76
Year 2005 0,04534741
5,23–0,03044598
–5,01–0,01034468
–5,2–0,00253282
–4,82–0,00145383
–4,61–0,0005701
–3,98
Year 2006 0,06177623
8,29–0,04197633
–7,81–0,01384758
–7,73–0,0033314
–6,33–0,00189037
–5,73–0,00073055
–4,54
Year 2007–0,01702378
–4,28 0,0110211
4,24 0,0040641
4,17 0,00105055
3,89 0,0006273
3,74 0,00026067
3,35
Source: Authors´ compilation.
B r a s í l i a , J a n u a r y 2 0 1 5

37
Estimations of generic drug entry in Brazil using count versus ordered models
Ordered multinomial models display similar results, but some magnitudes of the marginal effects vary considerably, especially along the categories. A difference worth mentioning is that the share of the own-generic has a positive significant sign.
5.4 DIAGNOSTIC TESTS AND COMMENTS
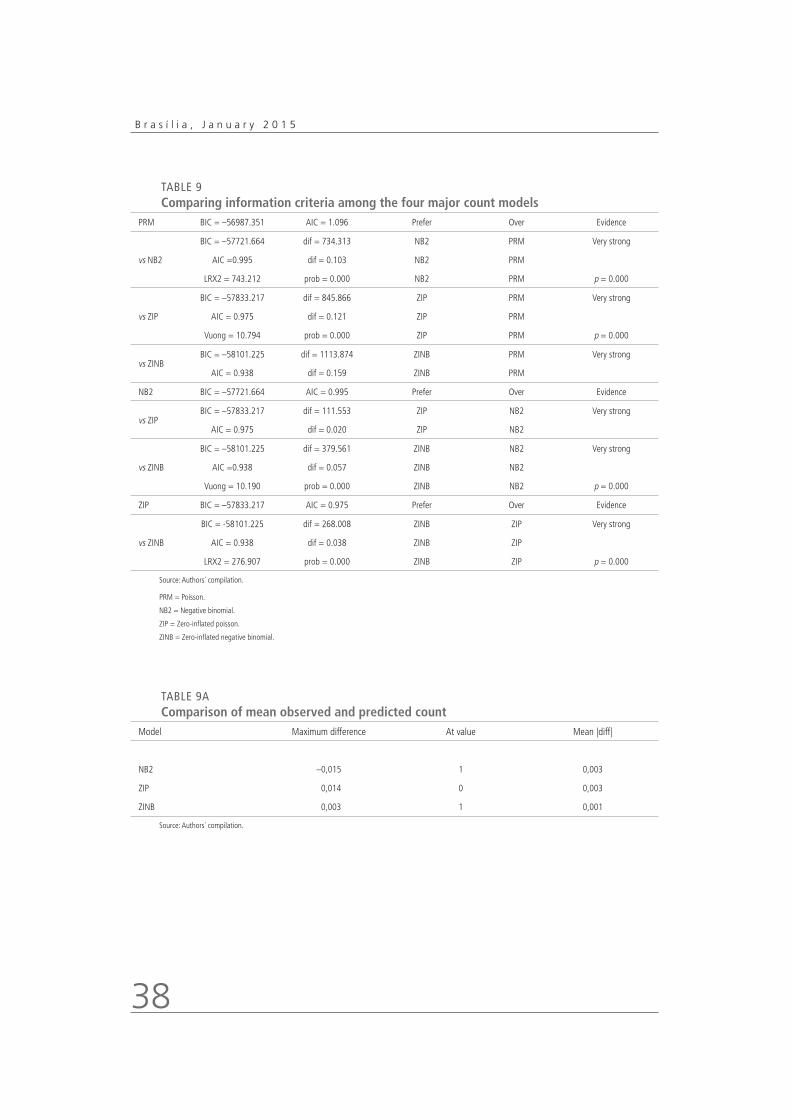
Wald tests comparing Poisson to NB1, NB2 and generalized NB models reject equidispersion. Vuong tests reject both Poisson and NB2 models in favor of Zero-inflated Poisson and Zero-inflated NB2 models, respectively. Both Akaike and Bayesian Information Criteria also suggest that the zero-inflated models are the best models (see Tables 6 and 9).
On the other hand, proportion of counts predicted by NB2 seem to be closer to the observed proportions than ZIP (see Figure 3 and Tables 9-A to 9-E). ZINB predicts fits particularly better the proportions of ones and twos than regular NB2. The worst fit is the regular Poisson’s.
FIGURE 3
Deviations in observed versus predicted proportions–count models(Observed–predicted)
Source: Authors´ compilation.Note: Positive deviations show underpredictions.
Discussion Paper186 (1511a)
38
TABLE 9
Comparing information criteria among the four major count models
PRM BIC = –56987.351 AIC = 1.096 Prefer Over Evidence
vs NB2
BIC = –57721.664 dif = 734.313 NB2 PRM Very strong
AIC =0.995 dif = 0.103 NB2 PRM
LRX2 = 743.212 prob = 0.000 NB2 PRM p = 0.000
vs ZIP
BIC = –57833.217 dif = 845.866 ZIP PRM Very strong
AIC = 0.975 dif = 0.121 ZIP PRM
Vuong = 10.794 prob = 0.000 ZIP PRM p = 0.000
vs ZINBBIC = –58101.225 dif = 1113.874 ZINB PRM Very strong
AIC = 0.938 dif = 0.159 ZINB PRM
NB2 BIC = –57721.664 AIC = 0.995 Prefer Over Evidence
vs ZIPBIC = –57833.217 dif = 111.553 ZIP NB2 Very strong
AIC = 0.975 dif = 0.020 ZIP NB2
vs ZINB
BIC = –58101.225 dif = 379.561 ZINB NB2 Very strong
AIC =0.938 dif = 0.057 ZINB NB2
Vuong = 10.190 prob = 0.000 ZINB NB2 p = 0.000
ZIP BIC = –57833.217 AIC = 0.975 Prefer Over Evidence
vs ZINB
BIC = -58101.225 dif = 268.008 ZINB ZIP Very strong
AIC = 0.938 dif = 0.038 ZINB ZIP
LRX2 = 276.907 prob = 0.000 ZINB ZIP p = 0.000
Source: Authors´ compilation.
PRM = Poisson.
NB2 = Negative binomial.
ZIP = Zero-inflated poisson.
ZINB = Zero-inflated negative binomial.
TABLE 9A
Comparison of mean observed and predicted count
Model Maximum difference At value Mean |diff|
NB2 –0,015 1 0,003
ZIP 0,014 0 0,003
ZINB 0,003 1 0,001
Source: Authors´ compilation.
B r a s í l i a , J a n u a r y 2 0 1 5

39
Estimations of generic drug entry in Brazil using count versus ordered models
TABLE 9B
PRM: predicted and actual probabilities
Actual Predicted |Diff| Pearson
0 0,857 0,813 0,044 17,404
1 0,076 0,132 0,056 175,434
2 0,035 0,032 0,002 1,393
3 0,013 0,011 0,001 0,001
4 0,010 0,005 0,005 39,768
5 0,003 0,003 0,000 0,000
6 0,003 0,001 0,002 16,036
7 0,001 0,001 0,000 1,521
8 0,001 0,000 0,001 9,195
9 0,000 0,000 0,000 1,616
10 0,000 0,000 0,000 1,216
11 0,000 0,000 0,000 0,001
12 0,000 0,000 0,000 21,103
13 0,000 0,000 0,000 3,057
Sum 1,000 1,000 0,113 289,266
Source: Authors´ compilation.
TABLE 9C
NB2: predicted and actual probabilities
Actual Predicted |Diff| Pearson
0 0,857 0,856 0,002 0,032
1 0,076 0,091 0,015 17,321
2 0,035 0,025 0,010 29,367
3 0,013 0,010 0,002 3,407
4 0,010 0,006 0,005 31,022
5 0,003 0,003 0,001 1,036
6 0,003 0,002 0,001 2,458
7 0,001 0,002 0,000 0,828
8 0,001 0,001 0,000 0,000
9 0,000 0,001 0,001 6,068
10 0,000 0,001 0,000 1,547
11 0,000 0,001 0,001 3,708
12 0,000 0,000 0,000 0,000
13 0,000 0,000 0,000 0,838
Sum 1,000 0,998 0,037 97,634
Source: Authors´ compilation.
Discussion Paper186 (1511a)
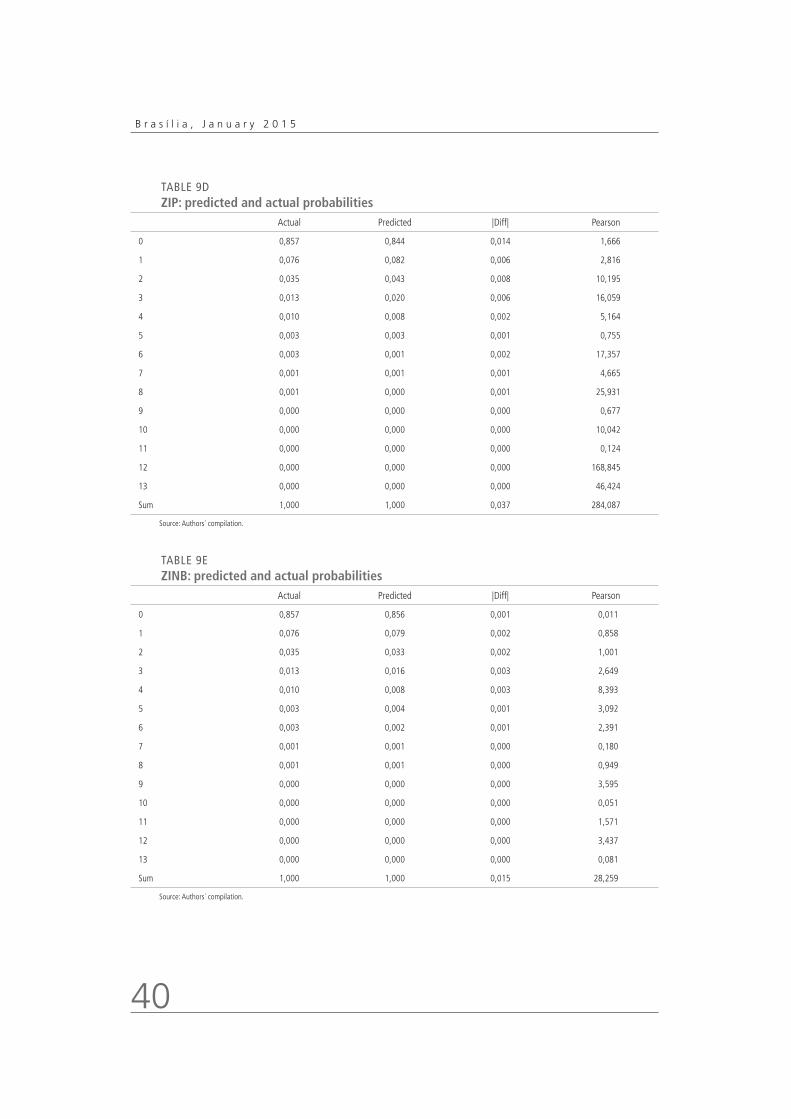
40
TABLE 9D
ZIP: predicted and actual probabilities
Actual Predicted |Diff| Pearson
0 0,857 0,844 0,014 1,666
1 0,076 0,082 0,006 2,816
2 0,035 0,043 0,008 10,195
3 0,013 0,020 0,006 16,059
4 0,010 0,008 0,002 5,164
5 0,003 0,003 0,001 0,755
6 0,003 0,001 0,002 17,357
7 0,001 0,001 0,001 4,665
8 0,001 0,000 0,001 25,931
9 0,000 0,000 0,000 0,677
10 0,000 0,000 0,000 10,042
11 0,000 0,000 0,000 0,124
12 0,000 0,000 0,000 168,845
13 0,000 0,000 0,000 46,424
Sum 1,000 1,000 0,037 284,087
Source: Authors´ compilation.
TABLE 9E
ZINB: predicted and actual probabilities
Actual Predicted |Diff| Pearson
0 0,857 0,856 0,001 0,011
1 0,076 0,079 0,002 0,858
2 0,035 0,033 0,002 1,001
3 0,013 0,016 0,003 2,649
4 0,010 0,008 0,003 8,393
5 0,003 0,004 0,001 3,092
6 0,003 0,002 0,001 2,391
7 0,001 0,001 0,000 0,180
8 0,001 0,001 0,000 0,949
9 0,000 0,000 0,000 3,595
10 0,000 0,000 0,000 0,051
11 0,000 0,000 0,000 1,571
12 0,000 0,000 0,000 3,437
13 0,000 0,000 0,000 0,081
Sum 1,000 1,000 0,015 28,259
Source: Authors´ compilation.
B r a s í l i a , J a n u a r y 2 0 1 5
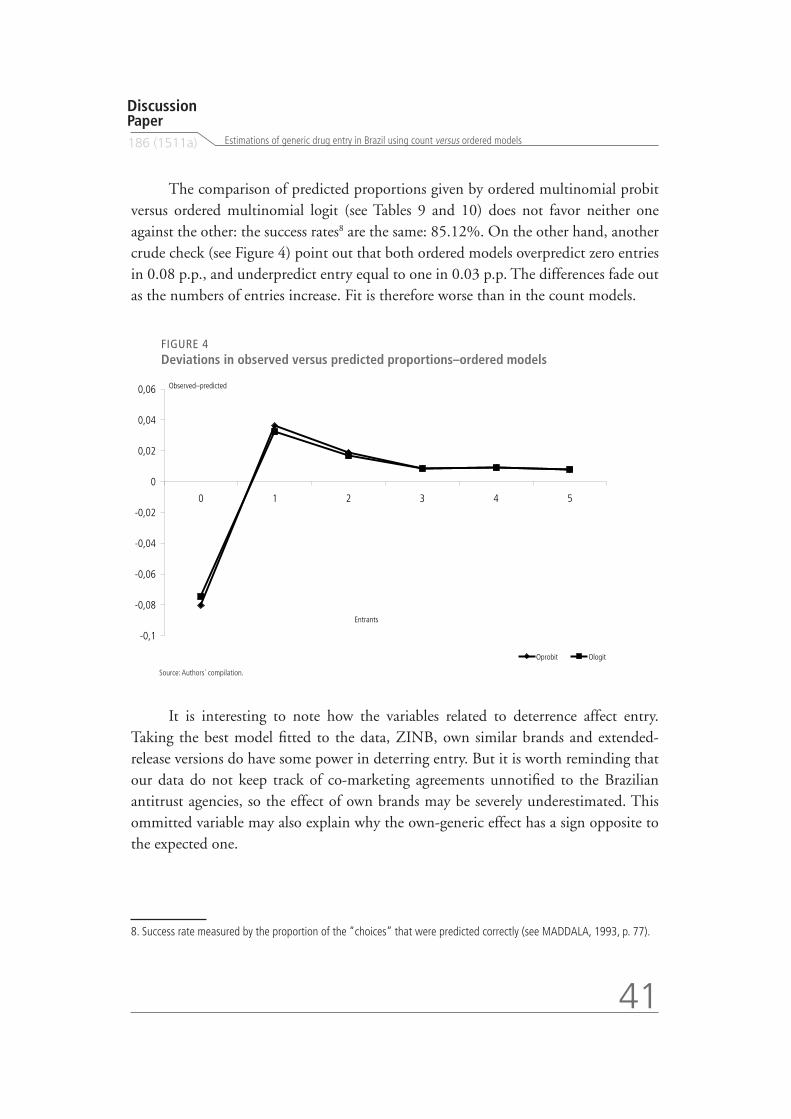
41
Estimations of generic drug entry in Brazil using count versus ordered models
The comparison of predicted proportions given by ordered multinomial probit versus ordered multinomial logit (see Tables 9 and 10) does not favor neither one against the other: the success rates8 are the same: 85.12%. On the other hand, another crude check (see Figure 4) point out that both ordered models overpredict zero entries in 0.08 p.p., and underpredict entry equal to one in 0.03 p.p. The differences fade out as the numbers of entries increase. Fit is therefore worse than in the count models.
8. Success rate measured by the proportion of the “choices” that were predicted correctly (see MADDALA, 1993, p. 77).
FIGURE 4
Deviations in observed versus predicted proportions–ordered models
It is interesting to note how the variables related to deterrence affect entry. Taking the best model fitted to the data, ZINB, own similar brands and extended-release versions do have some power in deterring entry. But it is worth reminding that our data do not keep track of co-marketing agreements unnotified to the Brazilian antitrust agencies, so the effect of own brands may be severely underestimated. This ommitted variable may also explain why the own-generic effect has a sign opposite to the expected one.
-0,1
-0,08
-0,06
-0,04
-0,02
0
0,02
0,04
0,06
0 1 2 3 4 5
Entrants
Observed–predicted
Oprobit Ologit
Source: Authors´ compilation.
Discussion Paper186 (1511a)

42
TABLE 10
Predicted versus observed counts–ordered probit
Predicted values
0 1 2 3 4 5+ Observed count
Observed values
0 6.091 89 13 3 1 1 6.198
1 482 54 17 3 0 0 556
2 182 51 16 3 2 0 254
3 61 18 10 1 2 0 92
4 47 21 5 1 1 0 75
5+ 30 17 8 7 3 0 65
Predicted count 6.893 250 69 18 9 1 7.240
Source: Authors´ compilation.
TABLE 11
Predicted versus observed counts–ordered logit
Predicted values
0 1 2 3 4 5+ Observed count
Observed values
0 6.081 99 15 1 1 1 6.198
1 479 56 19 2 0 0 556
2 179 49 21 3 1 1 254
3 58 20 11 1 2 0 92
4 46 20 7 1 1 0 75
5+ 29 17 11 4 1 3 65
Predicted count 6.872 261 84 12 6 5 7.240
Sources: Authors´ compilation.
It is also interesting to note how zero-inflated models predict zeros from the different distributions of the mixture. Figure 5 plots predicted proportions of zeros against the counts of brands in the respective drug markets. We note that the inflate equation predicts almost all zeros, and that drugs with as few as one brand hardly attract any entry, so the entry of branded competitors is an important leading indicator of a generic. In fact, it is easier to introduce a similar brand first. Moreover, as the regulatory board’s formula9 for entry price takes into account either the average market price or the average firm price, firms had better introduce similar drugs first, because existence of generic drugs bring the average down, due to their mandatory 35% rebate (this explains why a higher lagged number of non-generic brands is positively associated with generic entry).
9. Resolução no 2 CMED, March 5, 2004.
B r a s í l i a , J a n u a r y 2 0 1 5
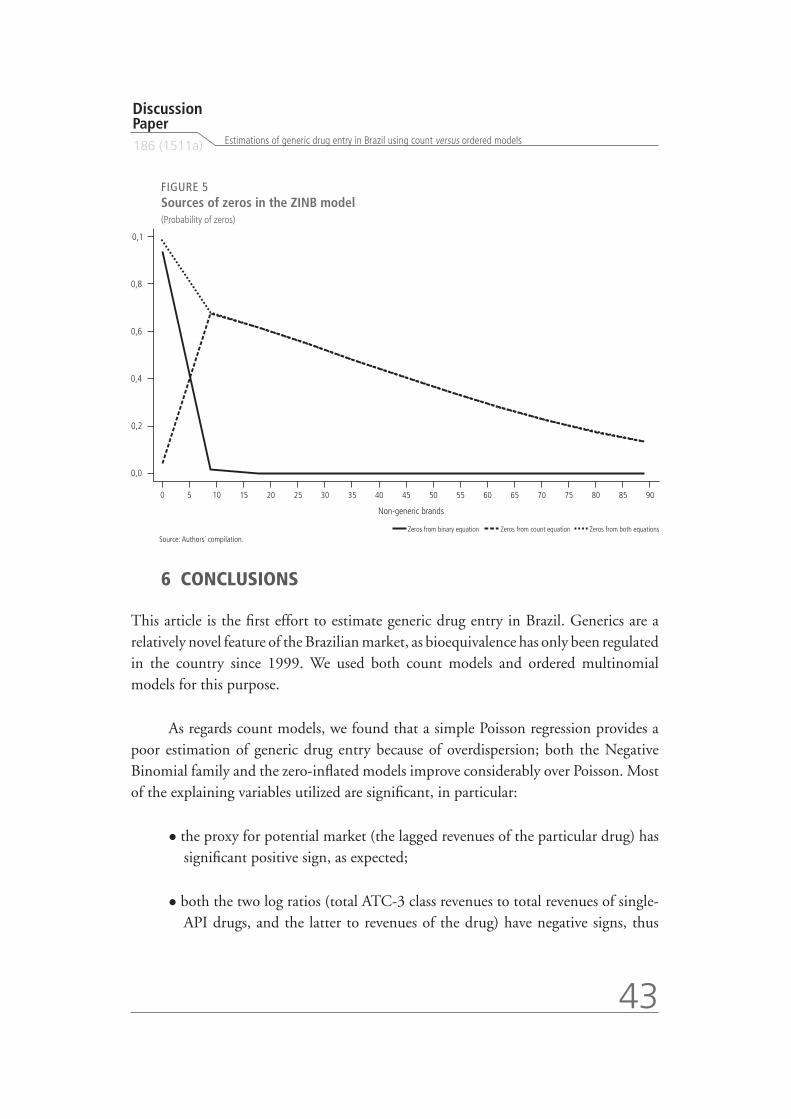
43
Estimations of generic drug entry in Brazil using count versus ordered models
6 CONCLUSIONS
This article is the first effort to estimate generic drug entry in Brazil. Generics are a relatively novel feature of the Brazilian market, as bioequivalence has only been regulated in the country since 1999. We used both count models and ordered multinomial models for this purpose.
As regards count models, we found that a simple Poisson regression provides a poor estimation of generic drug entry because of overdispersion; both the Negative Binomial family and the zero-inflated models improve considerably over Poisson. Most of the explaining variables utilized are significant, in particular:
the proxy for potential market (the lagged revenues of the particular drug) has significant positive sign, as expected;
both the two log ratios (total ATC-3 class revenues to total revenues of single-API drugs, and the latter to revenues of the drug) have negative signs, thus
FIGURE 5
Sources of zeros in the ZINB model(Probability of zeros)
Source: Authors´ compilation.
Discussion Paper186 (1511a)

44
indicating that competition from other drugs is quite important in the decision whether to enter;
the share of the pioneer drug’s seller has an ambiguous sign; in some specifications, has a dissuading (negative) significant effect on entry, but is positive and non-significant for the zero-inflated models;
a higher number of firms selling in the ATC-3 class apparently attracts prospective entrants;
a lower drug market concentration as measured by the HHI attracts entry;
the coefficients of the number of single-API drugs in the therapeutic class have mixed signs: the summation over the entire class has a positive sign (not significant in all specifications), while the summation within the same form in the class has a negative sign (also not significant everywhere);
the lagged number of non-generic brands is positively correlated with entry; apparently the rules for entry pricing favor entry of branded drugs before generics, so the number of brands seem to work as leading indicators of generic entry;
the lagged number of own generics surprisingly affects positively entry (although not always significant), but their share has a significant (positive) coefficient only when measured in the restricted drug’s market, not in the whole single-API market (excluded from the regressions reported);
the number of extended release brands (except in the negative binomial specification, where it is non-significant) and the number of brands belonging to the reference drug’s seller (barely, and not always significant) mostly seem to affect negatively entry, as expected (market preemption);
the share of phyotherapic revenues is not significant for explaining entry; and
the significant coefficient for the age of the pioneer drug–a proxy for the age of the molecule and therefore of the maturity of the drug’s market–points out that it attracts generic entry.
B r a s í l i a , J a n u a r y 2 0 1 5

45
Estimations of generic drug entry in Brazil using count versus ordered models
Ordered multinomial models display similar results, but some magnitudes of the marginal effects vary considerably, especially along the categories. A difference worth mentioning is that the share of the own-generic has a positive significant sign. However, fit is worse than in the count models.
This article is but the beginning of a series of studies on the pharmaceutical industry in Brazil using retail level data. Some extensions are already envisaged, in particular: i) a model of entry using firm-level data and sequential decision each year; thereby enabling us to add firm characteristics, as suggested by Kyle (2003) and Scott- Morton (2000), following Berry (1992). In particular, we may use diversification measures, ingredient experience, therapeutic class experience, and form experience; ii) incorporating dynamics of drug entry, as modeled by Reiffen and Ward (2005);iii) an assessment of diversification of sellers’s sales and of market concentration acrosstherapeutic classes and/or relevant markets defined by the Brazilian antitrust system; and iv) estimation of entry of NCE–what will require refinement of information on patent status and access to classification of drugs for introductory price regulation purposes–thus providing for a better assessment of welfare associated to innovation.
REFERENCES
BAE, J. P. Drug patent expirations and the speed of generic entry. Health Services Research, v. 32, p. 87-101, 1997.
BERRY, S. T. Estimation of a model of entery in the airline industry. Econometrica, v. 60, p. 889-917, 1992.
CAMERON, A. C.; TRIVEDI, P. K. Regression analysis of count data. Cambridge: Cambridge University Press, 1998.
CHAVES, G. C.; REIS, R. Challenges for the universal access to medicines in Brazil–brief comments from civil society. In: INTERNATIONAL CONFERENCE ON COMPULSORY LICENSING: INNOVATION AND ACCESS FOR ALL, 21-23 November 2007, Bangkok, Thailand, 2007.
DANZON, P. M.; CHAO, L.-W. Does regulation drive out competion in pharmaceutical markets? Journal of Laws and Economics, v. 43, p. 311-357, 2000.
EUROPEAN COMMISSION. Pharmaceutical sector inquiry–preliminary report/fact sheet– originator-generic competition. 2008.
Discussion Paper186 (1511a)
46
FIUZA, E. P. S.; LISBOA, M. B. Credence goods and market power: an econometric study of the Brazilian pharmaceutical industry. Estudos Econômicos, v. 33, n. 4, p. 601-638, 2003.
FRANK, R. G.; SALKEVER, D. S. Generic entry and the pricing of pharmaceuticals. Journal of Economics and Management Strategy, v. 6, n. 1, p. 75-90, 1997.
FTC. Generic drug entry prior to patent expiration: an FTC study. Washington, D.C., 2002.
HAUSMAN, J.; HALL, B. H.; GRILICHES, Z. Econometric models for count data with an application to the patents-R & D Relationship. Econometrica, v. 52, n. 4, p. 909-938, 1984.
HOMEDES, N.; LINARES, R. L.; UGALDE, A. Generic drug policies in Latin America. Washington, D.C.: World Bank, Health, Nutrition and Population (HNP) 2005. (Discussion Paper).
HUDSON, J. Generic take-up in the pharmaceutical market following patent expiry: a multi-country study. International Review of Law and Economics, v. 20, p. 205-221, 2000.
IIZUKA. T. Generic entry in a regulated pharmaceutical market. Aoyama Gakuin University, 2008. Mimeografado.
KYLE, M. K. Pharmaceutical price controls and entry strategies. Review of Economics and Statistics, v. 89, n.1, p. 88-99, 2003.
__________. The role of firm characteristics in pharmaceutical product launches. Rand Journal of Economics, v. 37, n. 3, p. 602-618, 2006.
LAMBERT, D. Zero-inflated poisson regression with an application to defects in manufacturing. Technometrics, v. 34, p. 1-14, 1992.
LANJOUW, J. O. Patents, price controls and acess to new drugs: how policy affects global market entry. 2005 (NBER Working Paper, n. 11.321).
LOPES, J. A. Estudo sobre a reação de preço dos medicamentos líderes de mercado à introdução de concorrentes genéricos e similares. São Paulo: EESP/FGV, 2009 (Unpublished Master’s Dissertation).
MADDALA, G. S. Limited-dependent and qualitative variables in econometrics. Cambridge (UK): Cambridge University Press, 1993.
MORENO-TORRES, J.; BORRELL-ARQUÉ, J.-R. Generic entry into a regulated pharmaceutical market. 2007. Mimeografado.
NISHIJIMA, M. Os preços dos medicamentos de referência após a entrada dos medicamentos genéricos no mercado farmacêutico brasileiro. Revista Brasileira de Economia, v. 62, n. 2, p. 189-206, 2008.
REIFFEN, D.; WARD, M. E. Generic drug industry dynamics. Review of Economics and Statistics, v. 87, n. 1, p. 37-49, 2005.
B r a s í l i a , J a n u a r y 2 0 1 5

47
Estimations of generic drug entry in Brazil using count versus ordered models
RUDHOLM, N. Entry and the number of firms in the Swedish pharmaceuticals market. Review of Industrial Organization, v. 19, p. 351-364, 2005.
SCOTT-MORTON, F. Entry decisions in the generic pharmaceutical industry. Rand Journal of Economics, v. 30, p. 421-440, 1999.
__________. Barriers to entry, brand advertising, and generic entry in the U.S. pharmaceutical industry. International Journal of Industrial Organization, v. 18, p. 1.085-1.104, 2000.
THOMAS, L. G., III. Industrial policy and international competitiveness in the pharmaceutical industry. In: HELMS, R. (Ed.). Competitive strategies in the pharmaceutical industry. Washington, D.C.: AEI Press, 1996.
Discussion Paper186 (1511a)


Ipea – Institute for Applied Economic Research
PUBLISHING DEPARTMENT
CoordinationCláudio Passos de Oliveira
SupervisionEverson da Silva MouraReginaldo da Silva Domingos
TypesettingBernar José VieiraCristiano Ferreira de AraújoDaniella Silva NogueiraDanilo Leite de Macedo TavaresDiego André Souza SantosJeovah Herculano Szervinsk JuniorLeonardo Hideki Higa
Cover designLuís Cláudio Cardoso da Silva
Graphic designRenato Rodrigues Buenos
The manuscripts in languages other than Portuguese published herein have not been proofread.
Ipea Bookstore
SBS – Quadra 1 − Bloco J − Ed. BNDES, Térreo 70076-900 − Brasília – DFBrazilTel.: + 55 (61) 3315 5336E-mail: [email protected]

I
PUBLICAÇÕES DO IPEA (TEXTOS) (2009/2010)
TEXTO PARA DISCUSSÃO TD
No 1369 – Uma Experiência de Desenvolvimento Metodológico para Avaliação de Programas: o modelo lógico do programa segundo tempo, Helder Ferreira, Martha Cassiolato, Roberto Gonzalez, Brasília, janeiro de 2009, 44 p.
No 1370 – Brasil e OCDE: avaliação da eficiência em sistemas de saúde, Alexandre Marinho, Simone de Souza Cardoso e Vivian Vicente de Almeida, Rio de Janeiro, janeiro de 2009, 65 p.
No 1371 – Cuidados de Longa Duração para Idosos: um novo risco para os sistemas de seguridade social, Maria Tereza de M. Pasinato e George E. M. Kornis, Rio de Janeiro, janeiro de 2009, 24 p. (Série seguridade social).
No 1372 – Pobres, Pobreza e Cidadania: os desafios recentes da proteção social, Luciana Jaccoud, Rio de Janeiro, janeiro de 2009, 26 p. (Série seguridade social).
No 1373 – Alguns Desafios ao Desenvolvimento do Brasil, Ronaldo Coutinho Garcia, Brasília, janeiro de 2009, 50 p.
No 1374 – Determinantes Principais de Inovação na Indústria Brasileira: uma análise preliminar, Luiz Dias Bahia, Rio de Janeiro 2009, 26 p.
No 1375 – Biotecnologia: perfil dos grupos de pesquisa no Brasil, Marco Aurélio Alves de Mendonça e Rogério Edivaldo Freitas, Rio de Janeiro, fevereiro de 2009, 23p.
No 1376 – A Constituição de um Modelo de Atenção à Saúde Universal: uma promessa não cumprida pelo SUS?, Carlos Octávio Ocké-Reis, Rio de Janeiro, fevereiro de 2009, 22 p. (Série seguridade social).
No 1377 – Avaliando os Efeitos da Política Fiscal no Brasil: resultados de um procedimento de identificação agnóstica, Mário Jorge Mendonça, Luis Alberto Medrano, Adolfo Sachsida, Rio de Janeiro, fevereiro de 2009, 23 p.
No 1378 – Participação Social e as Conferências Nacionais de Políticas Públicas: reflexões sobre os avanços e desafios no período 2003-2006, Enid Rocha Andrade da Silva, Rio de Janeiro, fevereiro de 2009, 36 p.
No 1379 – Uma Análise da Transmissão da Política Monetária e o Canal da Dívida Pública com Aplicação aos Dados Brasileiros, Manoel Carlos de Castro Pires, Joaquim Pinto de Andrade Rio de Janeiro, fevereiro de 2009, 29 p.
No 1380 – Hipoteca Reversa, Marcelo Abi-Ramia Caetano, Daniel da Mata Rio de Janeiro, fevereiro de 2009, 27 p.

II
No 1381 – Metodologias para Estabelecer a Linha de Pobreza: objetivas, subjetivas, relativas, multidimensionais, Sergei Suarez Dillon Soares, Rio de Janeiro, fevereiro de 2009, 49 p.
No 1382 – Antidumping nas Américas: uma investigação dos efeitos do uso desse instrumento sobre as exportações e sobre a conduta das empresas brasileiras, Marta dos Reis Castilho, Brasília, fevereiro de 2009, 50 p.
No 1383 – Acordos do Mercosul com Terceiros Países, Edson Peterli Guimarães e Rodrigo M. Zeidan, Brasília, fevereiro de 2009, 57 p.
No 1384 – O Financiamento Externo no Ciclo Recente da Economia Brasileira, Ricardo P. Câmara Leal, André L. Carvalhal da Silva, Brasília, fevereiro de 2009, 57 p.
No 1385 – Os Incentivos às Exportações Brasileiras: 1990 a 2004, Heloiza Camargos Moreira e Marcos Panariello, Brasília, fevereiro de 2009, 193 p.
No 1386 – Defesa da Concorrência no Brasil: aspectos institucionais, desempenho recente e perspectivas de reforma, Lucia Helena Salgado, Brasília, fevereiro de 2009, 26 p.
No 1387 – Rumo a um Novo Marco Regulatório para o Gás Natural, Lúcia Helena Salgado, Brasília, fevereiro de 2009, 16 p.
No 1388 – Caos Aéreo e Tragédia dos Comuns: falhas de mercado e de governo, Lucia Helena Salgado, Brasília, fevereiro de 2009, 19 p.
No 1389 – A Situação dos Transplantes de Órgãos no Brasil, Alexandre Marinho, Brasília, fevereiro de 2009, 15 p.
No 1390 – A Economia das Filas no Sistema Único de Saúde (SUS) Brasileiro, Alexandre Marinho, Brasília, fevereiro de 2009, 16 p.
No 1391 – Saúde no Brasil: algumas questões sobre o Sistema Único de Saúde (SUS), Sérgio Francisco Piola (Org.), Solon Magalhães Vianna (Org.), Alexandre Marinho, Déa Carvalho, José Aparecido Ribeiro, Joelmir Rodrigues da Silva, Luciana Mendes Servo, Roberto Passos Nogueira, Brasília, fevereiro de 2009, 83 p.
No 1392 – A Reforma Orçamentária e a Eficiência Fiscal, Fernando Rezende, Brasília, fevereiro de 2009, 34 p.
No 1393 – Estado e Economia: Estado e crescimento econômico no Brasil, Regis Bonelli, Brasília, fevereiro de 2009, 75 p.
No 1394 – Avaliação da Eficiência Técnica dos Países nos Jogos Olímpicos de Pequim – 2008, Alexandre Marinho, Simone de Souza Cardoso e Vivian Vicente de Almeida, Rio de Janeiro, fevereiro de 2009, 39 p.
No 1395 – Mobilidade Pendular: uma proposta teórico-metodológica, Rafael Henrique Moraes Pereira, Verónica Herrero, Rio de Janeiro, março de 2009, 26 p.
No 1396 – Focalização e Cobertura do Programa Bolsa Família: qual o significado dos 11 milhões de famílias? Sergei Soares, Rafael Perez Ribas, Fábio Veras Soares. Rio de Janeiro, março de 2009, 41 p.

III
No 1397 – O Impacto da Renda Domiciliar Sobre a Saúde Infantil no Brasil, Maurício Reis, Anna Crespo, Rio de Janeiro, março de 2009, 22 p.
No 1398 – O Mercado de Trabalho Rural: evolução recente, composição da renda e dimensão regional, Bernardo Campolina, Fernando Gaiger Silveira, Luis Carlos G. de Magalhães, Rio de Janeiro, março de 2009, 28 p.
No 1399 – Evolução da Ocupação no Sistema de Segurança no Brasil: uma perspectiva comparativa entre os setores público e privado, André Gambier Campos, Rio de Janeiro, março de 2009, 63 p.
No 1400 – Impactos de Políticas de Desoneração do Setor Produtivo: uma avaliação a partir de um modelo de gerações superpostas, Napoleão Luiz Costa da Silva, Marco Antônio Freitas Hollanda Cavalcanti, Rio de Janeiro, março de 2009, 31 p.
No 1401 – Aplicação de Funções de Distância para o Cálculo de Índices de Bem-Estar e a Evolução do Índice de Desenvolvimento Humano (IDH) para os Estados Brasileiros, Marcus Vinícius Magalhães de Lima e Rogério Boueri, Rio de Janeiro, abril de 2009, 71 p.
No 1402 – Os Idosos em Situação de Dependência e a Proteção Social no Brasil, Analia Soria Batista, Luciana Jaccoud, Lusenir Aquino e Patrícia Dario El-Moor, Brasília, abril de 2009, 66 p. (Série seguridade social).
No 1403 – Proteção das Pessoas Idosas Dependentes: análise comparativa da experiência internacional, Analia Soria Batista, Luciana Jaccoud, Lusenir Aquino e Patrícia Dario El-Moor, Brasília, abril de 2009, 33 p. (Série seguridade social).
No 1404 – Sobreapreciação Cambial no Brasil: estimativa, causas e consequências (1994-2008), Eliane Cristina de Araujo e Marcos Vinicius Chiliatto Leite, Brasília, abril de 2009, 30 p.
No 1405 – Projeções de Longo Prazo para o Regime Geral de Previdência Social – O Debate no Fórum Nacional de Previdência Social, Helmut Schwarzer, Eduardo da Silva Pereira e Luis Henrique Paiva, Rio de Janeiro, junho de 2009, 28 p. (Série seguridade social).
No 1406 – A Evolução da Segregação por Qualificação Profissional ao Nível das Firmas, Luiz Dias Bahia, Danilo Coelho, Alexandre Messa Silva e Sergei Soares Rio de Janeiro, junho de 2009, 20 p.
No 1407 – Novos Aspectos da Regulação do Trabalho no Brasil. Qual o Papel do Estado? André Gambier Campos, Brasília, junho de 2009, 42 p.
No 1408 – Portos Brasileiros 2009: ranking, área de influência, porte e valor agregado médio dos produtos movimentados, Carlos Alvares da Silva Campos Neto, Bolívar Pêgo Filho, Alfredo Eric Romminger e Iansã Melo Ferreira, Rio de Janeiro, junho de 2009, 68 p.
No 1409 – Avaliando a Condição da Política Fiscal no Brasil, Mário Jorge Mendonça, Luis Alberto Medrano, e Adolfo Sachsida, Rio de Janeiro, junho de 2009, 27 p.
IV
No 1410 – Perfil do Migrante Brasileiro, Adolfo Sachsida, Paulo Furtado de Castro, Mario Jorge Cardoso de Mendonça, e Pedro H. Albuquerque, Rio de Janeiro, julho de 2009, 39 p.
No 1411 – Mudança do Conceito de Família do Benefício de Prestação Continuada, Marcelo Medeiros, Fábio Henrique Granja e Melchior Sawaya Neto, Rio de Janeiro, julho de 2009, 17 p.
No 1412 – Sobre Maldições e Bênçãos: é possível gerir recursos naturais de forma sustentável? Uma análise sobre os royalties e as compensações financeiras no Brasil, Bruno de Oliveira Cruz e Márcio Bruno Ribeiro, Rio de Janeiro, julho de 2009, 40 p.
No 1413 – Alemanha: mitos, fatos e desafios para o século XXI, Licio da Costa Raimundo, Rio de Janeiro, julho de 2009, 30 p.
No 1414 – Sobre as Utilidades do Cadastro Único, Ricardo Paes de Barros, Mirela de Carvalho e Rosane Mendonça, Rio de Janeiro, agosto de 2009, 32 p.
No 1415 – O Tamanho do Setor Público no Contexto do Federalismo: um modelo aplicado aos municípios brasileiros, Roberta da Silva Vieira, Rio de Janeiro, agosto de 2009, 39 p.
No 1416 – A Distribuição das Transferências, Público-Alvo e Cobertura do Benefício de Prestação Continuada (BPC), Marcelo Medeiros, Melchior Sawaya Neto e Fábio Henrique Granja, Rio de Janeiro, agosto de 2009, 21 p.
No 1417 – Aspectos Distributivos do IPTU e do Patrimônio Imobiliário das Famílias Brasileiras, Pedro Humberto Bruno de Carvalho Jr., Rio de Janeiro, agosto de 2009, 50 p.
No 1417a – Distributive Aspects of Real Estate Property and its Taxation Among Brazilian Families, Pedro Humberto Bruno de Carvalho Jr, Rio de Janeiro, agosto de 2009, 50 p.
No 1418 – Uma Política de Investimentos Defensiva para o Resultado Operacional de Hospitais Públicos na Presença de Filas e de Desigualdades de Acesso a Hospitais Privados, Alexandre Marinho, Simone de Souza Cardoso e Vivian Vicente de Almeida, Rio de Janeiro, agosto de 2009, 47 p.
No 1419 – Mudanças Institucionais e a Lógica de Expansão da Grande Empresa, Luciana Acioly, Rio de Janeiro, agosto de 2009, 41p.
No 1420 – Entre o Trabalho e a Garantia de Renda: a trajetória recente da proteção social no Canadá, Luciana Jaccoud, Rio de Janeiro, setembro de 2009, 60p.
No 1421 – Sobre a Redução das Matrículas no Ensino Médio Regular, Paulo Roberto Corbucci, Brasília, setembro de 2009, 22p.
No 1422 – O Impacto da Política Fiscal nos Spreads Soberanos: a austeridade fiscal e a qualidade do ajuste, Katia Rocha e Ajax Moreira, Brasília, setembro de 2009, 18p.
V
No 1423 – Gargalos e Demandas da Infraestrutura Portuária e os Investimentos do PAC: mapeamento Ipea de obras portuárias, Carlos Alvares da Silva C. Neto Paulo, Bolívar Pêgo Filho, Alfredo Eric Romminger, Iansã Melo Ferreira e Leonardo Fernandes S. Vasconcelos, Brasília, outubro de 2009, 53p.
No 1424 – O Programa Bolsa Família: desenho institucional, impactos e possibilidades futuras, Sergei Soares e Natália Sátyro, Brasília, outubro de 2009, 37p.
No 1425 – Nível do Câmbio e Crescimento Econômico: teorias e evidências para países em desenvolvimento e emergentes – 1980-2007, Eliane Cristina de Araújo, Rio de Janeiro, outubro de 2009, 29p.
No 1426 – Perspectivas de Crescimento Para a População Brasileira: velhos e novos resultados, Ana Amélia Camarano e Solange Kanso, Brasília, outubro de 2009, 30p.
No 1427 – Clusterização Hierárquica Espacial, Alexandre Xavier Ywata Carvalho, Gilberto Rezende de Almeida Junior, Pedro Henrique Melo Albuquerque e Rafael Dantas Guimarães, Brasília, outubro de 2009, 79p.
No 1428 – Clusterização Hierárquica Espacial com Atributos Binários, Alexandre Xavier Ywata Carvalho, Pedro Henrique Melo Albuquerque, Gilberto Rezende de Almeida Junior, Rafael Dantas Guimarães e Camilo Rey Laureto, Brasília, outubro de 2009, 44p.
No 1429 – A Curva de Phillips e a Experiência Brasileira, Adolfo Sachsida, Marcio Ribeiro e Claudio Hamilton dos Santos, Brasília, outubro de 2009, 21p.
No 1430 – Reexaminando a Curva de Phillips Brasileira com Dados de Seis Regiões Metropolitanas, Adolfo Sachsida, Brasília, outubro de 2009, 16p.
No 1431 – Restrições Macroeconômicas ao Crescimento da Economia Brasileira: diagnósticos e algumas proposições de política, José Luis Oreiro, Lionello Punzo, Eliane Araújo e Gabriel Squeff, Brasília, outubro de 2009, 38p.
No 1432 – Fórum Nacional da Previdência Social: consensos e divergências, Felix Garcia Lopez, Brasília, novembro de 2009, 38p.
No 1433 – O Potencial Distributivo do Imposto de Renda-Pessoa Física (IRPF), Sergei Soares, Fernando Gaiger Silveira, Claudio Hamilton dos Santos, Fábio Monteiro Vaz e André Luis Souza, Rio de Janeiro, novembro de 2009, 44p.
No 1434 – Impactos Macroeconômicos dos Gastos Públicos na América Latina, Alexandre Manoel Angelo da Silva e José Oswaldo Cândido Júnior, Rio de Janeiro, novembro de 2009, 35p.
No 1435 – Análise do Impacto do Programa Bolsa Família e do Benefício de Prestação Continuada na Redução da Desigualdade nos Estados Brasileiros – 2004 a 2006, Natália Sátyro e Sergei Soares, Rio de Janeiro, novembro de 2009, 38p.
No 1436 – Liberalização Financeira, Performance Econômica e Estabilidade Macro-econômica no Brasil: uma avaliação do período recente, João Adelino de Faria, Luiz Fernando de Paula, Manoel Carlos de Castro Pires e Tiago Rinaldi Meyer, Rio de Janeiro, novembro de 2009, 33p.
VI
No 1437 – Indicadores Objetivos e Subjetivos de Qualidade de Vida das Famílias Brasileiras Segundo a POF de 2002-2003: um estudo sobre seus determinantes demográficos, sociais e econômicos, Marcelo de Sales Pessoa e Marcos Antonio C. da Silveira, Rio de Janeiro, novembro de 2009, 97p.
No 1438 – A Política Fiscal e as Taxas de Juros Domésticas nos Países Emergentes, Ajax Moreira e Katia Rocha, Brasília, novembro de 2009, 18p.
No 1439 – Um Modelo Econométrico com Parâmetros Variáveis para a Carga Tributária Bruta Brasileira Trimestral, Mário Jorge Mendonça, Cláudio Hamilton dos Santos e Luis Alberto Medrano, Brasília, novembro de 2009, 28p.
No 1440 – A Necessidade de uma Nova Política de Comercialização Agrícola, Júnia Cristina Peres R. da Conceição, Rio de Janeiro, novembro de 2009, 20p.
No 1441 – Desdobramentos de Curto e Médio Prazo da Crise Atual, Luciana Acioly, Milko Matijascic, Emilio Chernavsky, Maria Piñón, Rodrigo Pimentel Ferreira Leão, Rio de Janeiro, dezembro de 2009, 38p.
No 1442 – A Escolaridade dos Pais, os Retornos à Educação no Mercado de Trabalho e a Desigualdade de Rendimentos, Lauro Ramos e Mauricio Reis, Rio de Janeiro, dezembro de 2009, 19p.
No 1443 – O Mecanismo de Desenvolvimento Limpo Setorial: perspectivas para o desenvolvimento sustentável brasileiro, Maria Bernadete Gomes Pereira Sarmiento Gutierrez, Brasília, dezembro de 2009, 46p.
No 1444 – Eficiência Tributária dos Estados Brasileiros Mensurada com um Modelo de Fronteira Estocástica Geograficamente Ponderada, Rogério Boueri, Alexandre Xavier Ywata Carvalho e Fernanda Rocha Gomes Silva, Brasília, dezembro de 2009, 24p.
No 1445 – Apontamentos Sobre a Criação de um Sistema Nacional de Indicadores em Direitos Humanos, Marco Antonio Carvalho Natalino, Rio de Janeiro, dezembro de 2009, 24p.
No 1446 – O Estigma da Perda de um Emprego Formal no Brasil, Carlos Henrique L. Corseuil, Rodrigo F. Dias, Miguel N. Foguel e Daniel D. Santos, Brasília, dezembro de 2009, 23p.
No 1447 – Capital Estrangeiro e Diferenciais de Gênero nas Promoções: evidências da indústria de transformação brasileira, Danilo Coelho, Marcelo Fernandes e Miguel N. Foguel, Brasília, dezembro de 2009, 23p.
No 1448 – Mudanças Organizacionais nas Empresas Brasileiras: uma análise a partir das estruturas ocupacionais, Carlos Henrique L. Corseuil, Rio de Janeiro, dezembro de 2009, 23p.
No 1449 – Desoneração Fiscal de Não Residentes e a Estrutura a Termo da Taxa de Juros: efeito da medida provisória no 281/2006, Katia Rocha e Ajax Moreira, Rio de Janeiro, dezembro de 2009, 20p.
No 1450 – Determinantes da Expansão do Emprego Formal: o que explica o aumento do tamanho médio dos estabelecimentos?, Carlos Henrique L. Corseuil, Rodrigo L. Moura e Lauro Ramos, Brasília, dezembro de 2009, 25p.

VII
No 1451 – Transferências Fiscais Intergovernamentais no Brasil: uma avaliação das transferências federais, com ênfase no sistema único de saúde, Angelo José Mont´Alverne Duarte, Alexandre Manoel Angelo da Silva, Everaldo Manoel Luz e José Carlos Gerardo, Rio de Janeiro, dezembro de 2009, 35p.
No 1452 – Desafios da Real Política Industrial Brasileira do Século XXI, Mansueto Almeida, Brasília, dezembro de 2009, 69p.
No 1453 – Aplicação de um Modelo Fatorial Dinâmico para Previsão da Arrecadação Tributária no Brasil, Mário Jorge Mendonça, Cláudio Hamilton dos Santos e Thiago Guerrera Martins, Rio de Janeiro, dezembro de 2009, 32p.
No 1454 – Fatores Locacionais e o Investimento Estrangeiro em Pesquisa e Desenvolvimento: evidências para o Brasil, Argentina e México, Fernanda De Negri e Mariano Laplane, Rio de Janeiro, dezembro de 2009, 30p.
No 1455 – Finance-Led Growth Regime no Brasil: estatuto teórico, evidências empíricas e consequências macroeconômicas, Miguel Bruno, Hawa Diawara, Eliane Araújo, Anna Carolina Reis e Mario Rubens, Brasília, dezembro de 2009, 29 p.
No 1456 – Variáveis Fiscais e PIB Per Capita no Brasil: relações vigentes entre 1901 e 2006, Alexandre Manoel Angelo da Silva e Angelo José Mont´Alverne Duarte, Brasília, dezembro de 2009, 28 p.
No 1457 – Diferencial de Salários entre os Setores Público e Privado: uma resenha da literatura, Ana Luiza Neves de Holanda, Rio de Janeiro, dezembro de 2009, 38 p.
No 1458 – Políticas de Ciência, Tecnologia e Inovação no Brasil: uma análise com base nos indicadores agregados, Luiz Ricardo Cavalcante, Rio de Janeiro, dezembro de 2009, 26 p.
No 1459 – Volatilidade de Renda e a Cobertura do Programa Bolsa Família, Sergei Soares, Rio de Janeiro, dezembro de 2009, 18p.
No 1460 – Determinantes da Queda na Desigualdade de Renda no Brasil, Ricardo Barros, Mirela de Carvalho, Samuel Franco e Rosane Mendonça, Rio de Janeiro, janeiro de 2010, 50p.
No 1461 – Como as Famílias Brasileiras Avaliam a Suficiência de seus Rendimentos Segundo a POF 2002-2003 – Implicações para um Índice de Qualidade de Vida, Marcelo de Sales Pessoa e Marcos Antonio Coutinho da Silveira, Rio de Janeiro, janeiro de 2010, 34p.
No 1462 – Depósitos em Moeda Estrangeira como Hedge para Investidores Brasileiros de Longo Prazo: uma aplicação da teoria da escolha estratégica de portfólio, Carlos Eduardo Meyer dos Santos e Marcos Antonio C. da Silveira, Brasília, janeiro de 2010, 35p.
No 1463 – Análise de Impacto Regulatório: uma abordagem exploratória, Lucia Helena Salgado e Eduardo Bizzo de Pinho Borges, Brasília, janeiro de 2010, 26p.
VIII
No 1464 – Uma Análise da Carga Tributária Bruta e das Transferências de Assistência e Previdência no Brasil, no Período 1995-2009: evolução, composição e suas relações com a regressividade e a distribuição de renda, Márcio Bruno Ribeiro, Brasília, janeiro de 2010, 28p.
No 1465 – Gargalos e Demandas da Infraestrutura Ferroviária e os Investimentos do PAC: mapeamento Ipea de obras ferroviárias, Carlos Alvares da Silva Campos Neto, Bolívar Pêgo Filho, Alfredo Eric Romminger, Iansã Melo Ferreira e Leonardo Fernandes Soares Vasconcelos, Rio de Janeiro, janeiro de 2010, 42p.
No 1466 – Evolução Recente do Comércio Exterior Brasileiro com os Países do Mercosul, Sérvulo Vicente Moreira e Ethianne Érica Lucena Milhomem, Rio de Janeiro, janeiro de 2010, 37p.
No 1467 – Delimitação de Mercado Relevante e Simulação de Fusões Horizontais: uma abordagem unificada, Eduardo P. S. Fiuza, Rio de Janeiro, janeiro de 2010, 33p.
No 1467a – Relevant Market Delineation and Horizontal Merger Simulation: a unified approach, Eduardo P. S. Fiuza, Rio de Janeiro, janeiro de 2010, 35p.
No 1468 – Tarifas de Importação e Evasão Fiscal no Brasil, Honorio Kume, Guida Piani e Pedro Miranda, Brasília, janeiro de 2010, 25p.
No 1469 – A Evolução da Estrutura Tributária e do Fisco Brasileiro: 1889-2009, Fabrício Augusto de Oliveira, Brasília, janeiro de 2010, 57p.
No 1470 – China: estabilidade e crescimento econômico, Marcelo José Braga Nonnenberg, Brasília, fevereiro de 2010, 23p.
No 1471 – Distribuição de Renda, Transferências Federais e Imigração: um estudo de dados em painel para as unidades da federação do Brasil, Adolfo Sachsida, Marcelo Abi-Ramia Caetano e Pedro Albuquerque, Brasília, fevereiro de 2010, 18p.
No 1472 – Estrutura de Inovações na Indústria Automobilística Brasileira, Luiz Dias Bahia e Edson Paulo Domingues, Brasília, fevereiro de 2010,
No 1473 – Padrões Microeconômicos de Comércio Internacional e a Estratégia Brasileira de Exportação, Sérgio Kannebley Júnior, Luiz Alberto Esteves, Alexandre Messa Peixoto da Silva e Bruno César Araújo, Brasília, fevereiro de 2010, 45p.
No 1474 – Economia Política de Petróleo e Gás: a experiência russa, Giorgio Romano Schutte, Brasília, fevereiro de 2010, 51p.
No 1475 – Propriedade Intelectual, Origem de Capital e Desenvolvimento Tecnológico: a experiência brasileira, Graziela Ferrero Zucoloto, Brasília, março de 2010, 61p.
No 1476 – Pobreza no Espírito Santo, Ricardo Paes de Barros, Mirela de Carvalho, Samuel Franco e Andrezza Rosalém, Brasília, março de 2010, 42p.
No 1477 – Integrando Desiguais: assimetrias estruturais e políticas de integração no mercosul, André de Mello e Souza, Ivan Tiago Machado Oliveira e Samo Sérgio Gonçalves, Rio de Janeiro, março de 2010, 49p.
IX
No 1478 – Determinantes do Desenvolvimento na Primeira Infância no Brasil, Ricardo Paes de Barros, Lisa Biron, Mirela de Carvalho, Mariana Fandinho, Samuel Franco, Rosane Mendonça, Andrezza Rosalém, André Scofano e Roberta Tomas, Brasília, março de 2010, 31p.
No 1479 – Modelo Dinâmico Estocástico de Equilíbrio Geral (DSGE) Para a Economia Brasileira: versão 1, Luciano Vereda e Marco A. F. H. Cavalcanti, Brasília, março de 2010, 97p.
No 1480 – Ouvidoria Pública como Instrumento de Mudança, Antonio Semeraro Rito Cardoso, Brasília, março de 2010, 29p.
No 1481 – Evolução Urbana e Espraiamento na Região Metropolitana de São Paulo, Vanessa Gapriotti Nadalin e Danilo Camargo Igliori, Rio de Janeiro, abril de 2010, 46p.
No 1482 – As Carreiras no Serviço Público Federal Brasileiro: breve retrospecto e perspectivas, Ronaldo Dias, Brasília, abril de 2010, 38p.
No 1483 – Regressão Quantílica com Correção para a Seletividade Amostral: estimativa dos retornos educacionais e diferenciais raciais na distribuição de salários das mulheres no Brasil, Danilo Coelho, Róbert Veszteg e Fabio Veras Soares, Brasília, abril de 2010, 23p.
No 1484 – Teoria de Redes Complexas e o Poder de Difusão dos Municípios, Bernardo Assunção Mello, Daniel Oliveira Cajueiro, Luiz Henrique Batistuta Gomide, Roberta Vieira e Rogério Boueri, Brasília, abril de 2010, 31p.
No 1485 – Classificação e Análise das Despesas Públicas Federais pela Ótica Macroeconômica (2002-2009), Sérgio Wulff Gobetti e Rodrigo Octávio Orair, Brasília, abril de 2010, 39p.
No 1486 – Desafios para a Inclusão Produtiva das Famílias Vulneráveis: uma análise exploratória, Jorge Abrahão de Castro, Natália Sátyro, José Aparecido Ribeiro e Sergei Soares, Brasília, abril de 2010, 21p.
No 1487 – Os Determinantes Econômicos do Suicídio: um estudo para o Brasil, Paulo R. A. Loureiro, Mario J. C. de Mendonça e Adolfo Sachsida, Rio de Janeiro, maio de 2010, 22p.
No 1488 – Eficiência das Câmaras Legislativas Municipais, Roberta da Silva Vieira, Alexandre Manoel Angelo da Silva e Angelo José Mont´alverne Duarte, Brasília, maio de 2010, 37p.
No 1489 – Atual Arranjo Institucional da Política Externa Brasileira, Elaini Cristina Gonzaga da Silva, Priscila Spécie e Denise Vitale, Brasília, maio de 2010, 47p.
No 1490 – Elementos Teóricos e Conceituais para a Fundamentação de Políticas de Inovação Tecnológica em Economias Atrasadas, Luís Felipe Giesteira, Brasília, maio de 2010, 56p.
No 1491 – Dívida Pública, Política Fiscal e Nível de Atividade: uma abordagem var para o Brasil no período 1995-2008, Marco A. F. H. Cavalcanti e Napoleão L. C. Silva, Brasília, maio de 2010, 36p.

X
No 1492 – A Regulação das Emissões de Gases de Efeito Estufa no Brasil, Ronaldo Seroa da Motta, Brasília, maio de 2010, 23p.
No 1493 – Felicidade, Casamento e Choques Positivos de Renda: um estudo para o Distrito Federal, Alexandre Damasceno e Adolfo Sachsida, Rio de Janeiro, maio de 2010, 37p.
No 1494 – Aumento do Acesso à Internet em Banda Larga no Brasil e sua Possível Relação com o Crescimento Econômico: uma análise de dados em painel, Hildebrando Rodrigues Macedo e Alexandre Xavier Ywata de Carvalho, Rio de Janeiro, maio de 2010, 36p.
No 1495 – Aumento da Penetração do Serviço de Acesso à Internet em Banda Larga e seu Possível Impacto Econômico: análise através de sistema de equações simultâneas de oferta e demanda, Hildebrando Rodrigues Macedo e Alexandre Xavier Ywata de Carvalho, Rio de Janeiro, maio de 2010, 57p.
No 1496 – Estado e Direitos Humanos no Brasil: do AI-5 ao I Programa Nacional de Direitos Humanos, Marco Antonio Carvalho, Rio de Janeiro, maio de 2010, 52p.
No 1497 – Despesas de Investimento Municipais das Capitais Brasileiras no Período 2001-2008: o que podemos inferir com base nos dados bimestrais dos relatórios resumidos de execução orçamentária?, Márcio Bruno Ribeiro, Alessandra dos Santos Ferreira, Hilton Leal Silva e Wanderson Silva Rocha, Brasília, maio de 2010, 72p.
No 1498 – Olhares sobre a Cidade e a Região – Por Que Importam? Enfoques e Metodologias Disciplinares e Contraditórias de Análise do Território para Políticas Públicas, Bernardo Alves Furtado, Brasília, junho de 2010, 36p.
No 1499 – Distribuição Desigual dos Direitos Humanos e da Cidadania: áreas de concentração de vítimas de homicídio e ação policial no município do Rio de Janeiro, Patricia Silveira Rivero, Brasília, julho de 2010, 75p.
No 1500 – O Brasil em 4 Décadas, Rio de Janeiro, setembro de 2010,100p.
No 1501 – A Competitividade do Brasil e da China no Mercado Norte-Americano: 2000-2008, Marina Filgueiras, Honorio Kume, Brasília, julho de 2010, 26p.
No 1502 – Instrumentos de Controle da Despesa com Pessoal Inativo e Pensionistas de Estados, Municípios e do Distrito Federal, Marcelo Abi-Ramia Caetano, Brasília, julho de 2010, 20p.
No 1503 – Análise de Possíveis Determinantes da Penetração do Serviço de Acesso à Internet em Banda Larga nos Municípios Brasileiros, Hildebrando Rodrigues Macedo e Alexandre Xavier Ywata de Carvalho, Brasília, agosto de 2010, 46p.
No 1504 – Fronteira de Desigualdade Regional: Brasil (1872-2000), Leonardo M. Monasterio, Brasília, agosto de 2010, 20p.
No 1505 – Dívida Pública Afeta Variáveis Reais? Um Teste Alternativo da Equivalência Ricardiana Por Meio de Testes de Superexogeneidade em Séries Simuladas, Adolfo Sachsida e Fabio Nogueira Carlucci, Brasília, agosto de 2010, 94p.
XI
No 1506 – Trabalho Infantil no Brasil: rumo à erradicação, Ricardo Paes de Barros e Rosane Mendonça, Brasília, agosto de 2010, 26p.
No 1507 – Dimensionando o Programa Bolsa Família, Ricardo Paes de Barros, Rosane Mendonça e Mirela de Carvalho, Brasília, agosto de 2010, 16p.
No 1508 – Tópicos em Econometria Espacial para Dados Cross-Section, Alexandre Xavier Ywata Carvalho e Pedro Henrique Melo Albuquerque, Brasília, agosto de 2010, 44p.
No 1509 – Mídia e Poder: elementos conceituais e empíricos para o desenvolvimento da democracia brasileira, Francisco Fonseca, Brasília, setembro de 2010, 62p.
No 1510 – O Programa de Aquisição de Alimentos da Agricultura Familiar (PAA) e as Práticas dos Agricultores Participantes Orientadas ao Mercado: estudo de caso no estado de Sergipe, Danuta Chmielewska, Darana Souza e Acácio Alvarenga Lourete, Brasília, setembro de 2010, 42p.
No 1511 – Estimações de entrada de Medicamentos Genéricos no Brasil usando Modelos de Contagem versus Modelos Ordenados, Eduardo P. S. Fiuza e Barbara Caballero, Rio de Janeiro, outubro de 2010, 50p.
No 1511a – Estimations of Generic Drug entry in Brazil using count versus Ordered Models, Eduardo P. S. Fiuza e Barbara Caballero, Rio de Janeiro, outubro de 2010, 47p.

Ipea – Institute for Applied Economic Research
PUBLISHING DEPARTMENT
CoordinationCláudio Passos de Oliveira
SupervisionEverson da Silva MouraReginaldo da Silva Domingos
TypesettingBernar José VieiraCristiano Ferreira de AraújoDaniella Silva NogueiraDanilo Leite de Macedo TavaresDiego André Souza SantosJeovah Herculano Szervinsk JuniorLeonardo Hideki Higa
Cover designLuís Cláudio Cardoso da Silva
Graphic designRenato Rodrigues Buenos
The manuscripts in languages other than Portuguese published herein have not been proofread.
Ipea Bookstore
SBS – Quadra 1 − Bloco J − Ed. BNDES, Térreo 70076-900 − Brasília – DFBrazilTel.: + 55 (61) 3315 5336E-mail: [email protected]


Composed in Adobe Garamond 11/13.2 (text)Frutiger 47 (headings, graphs and tables)
Brasília – DF – Brazil


Ipea’s missionEnhance public policies that are essential to Brazilian development by producing and disseminating knowledge and by advising the state in its strategic decisions.