evaluation of sites and services projects - world bank · evaluation of sites and services projects...
TRANSCRIPT

swp\qqEvaluation of Sites and Services Projects
The Evidence from El Salvador
Michael BambergerEdgardo González-Polio
Umnuay Sae-Hau
WORLD BANK STAFF WORKING PAPERSÑumber 549
S> -f 62 ,-i (
Pub
lic D
iscl
osur
e A
utho
rized
Pub
lic D
iscl
osur
e A
utho
rized
Pub
lic D
iscl
osur
e A
utho
rized
Pub
lic D
iscl
osur
e A
utho
rized
WORLD BANK STAFF WORKING PAPERSNumber 549
Evaluation of Sites and Services Projects
The Evidence from El Salvador
Michael BambergerEdgardo González-Polio
Umnuay Sae-Hau
The World BankWashington, D.C., U.S.A.
Copyright © 1982The International Bank for Reconstructionand Development ¡ THE WORLD BANK1818 H Street, N.W.Washington, D.C. 20433, U.S.A.
All rights reservedManufactured in the United States of America
This is a working document published informally by The World Bank. Topresent the results of research with the least possible delay, the typescripthas not been prepared in accordance with the procedures appropriate toformal printed texts, and The World Bank accepts no responsibility for errors.The publication is supplied at a token charge to defray part of the cost ofmanufacture and distribution.
The views and interpretations in this document are those of the author(s)and should not be attributed to The World Bank, to its affiliatedorganizations, or to any individual acting on their behalf. Any maps usedhave been prepared solely for the convenience of the readers; thedenominations used and the boundaries shown do not imply, on the part ofThe World Bank and its affiliates, any judgment on the legal status of anyterritory or any endorsement or acceptance of such boundaries.
The full range of The World Bank publications is described in the Catalogof World Bank Publications; the continuing research program of the Bank isoutlined in World Bank Research Program: Abstracts of Current Studies. Bothbooklets are updated annually; the most recent edition of each is availablewithout charge from the Publications Distribution Unit of the Bank inWashington or from the European Office of the Bank, 66, avenue d'Iéna,75116 Paris, France.
Library of Congress C'ataloging in Publication¡ Data
Bamberger, Michael.Evaluation of sites and services project.
(World Bank staff working papers ; no. 549)Bibliography: p.1. Housing policy--El Salvador. 2. Public housing
---El Salvador. 3. Housing subsidies--El Salvador.4. El Salvador--Social policy. I. Gonzalez-Polio,Edgardo, 1947- . II. Sae-Hau, Umnuay, 1943-III. Title. IV. Series: World Bank staff workingpaper ; no. 549.HD7313.A3B35 1982 363.5'8 82-19984ISBN 0-8213-0116-0
Michael Bamberger is a sociologist with the Urban DevelopmentDepartment of The World Bank; Edgardo González-Polio is a consultant tothe Bank from Duke University; Umnuay Sae-Hau is a research assistant inthe Industry Department of the Bank.

ABSTRACT
This report presents the findings of a five-year evaluation of theFirst El Salvador Sites and Services Project. The evaluation formed partof a four-country cooperative research project supported jointly by TheWorld Bank and the International Development Research Centre (IDRC) ofCanada. The evaluation was conducted by a specíally created EvaluatíonUnit within the Project Implementing Agency. Three main types of studywere conducted: short-term studies on topics such as project demand andreasons for participant turnover; medium-range studies to evaluate theefficiency and impact of individual project components; and long-rangepolicy studies to estimate project impact on participants and housingpolícies. A quasi-experimental design was used for the impact evaluationin which a sample of participants and a control group were interviewed atthree points in time over a five-year period. The Report contains fourparts and an Executive Summary. Part I discusses the project and thecontext in which it was developed, Parts II and III report findings onproject effectiveness and efficiency and Part IV presents conclusions andpolicy recommendations.

ACKNOWLEDGEMENTS
This report is based on research conducted by the Evaluation Unit ofthe Salvadorean Low Cost Housing Foundation (FSDVM). The authors wouldlike to thank Juan Serrarols, Roberto Guzman and the other members of theEvaluation Unit for their untiring efforts during the five-yearevaluation. They would also like to thank the FSDVM, and particularly theExecutive Director, Padre Antonio Férnandez Ibanez; and the three
successive General Managers, Alberto Harth Deneke, Mauricio Silva andRoberto Samayoa for their constant encouragement.
Within the World Bank the staff of the Latin American Urban ProjectsDivision provided comments and support throughout the project and we wouldparticularly like to thank project officers responsible for El Salvador,Donna Haldane, George Gattoni, Roberto Chavez and Eric Canessa for theircooperation. Arturo Israel of the Project Advisory Staff (PAS) kindlyreviewed the report and made a number of valuable suggestions andcriticisms. We would also like to thank Mary Ann Heraud and Gemma Abarcarfor their invaluable assistance in typing and revision of the report.
A number of other researchers have taken advantage of the rich datasets generated by the evaluation to conduct more specialized studies onparticular topics. Four of these researchers whose work is cited and whoall proved most helpful to the production of parts of this document areJohn Quigley, David Lindauer, Emmanuel Jimenez and Dani Kaufmann.
Finally the authors would like to ackowledRe the support and Ruidancereceived from the International Development Research Centre throughout theresearch.
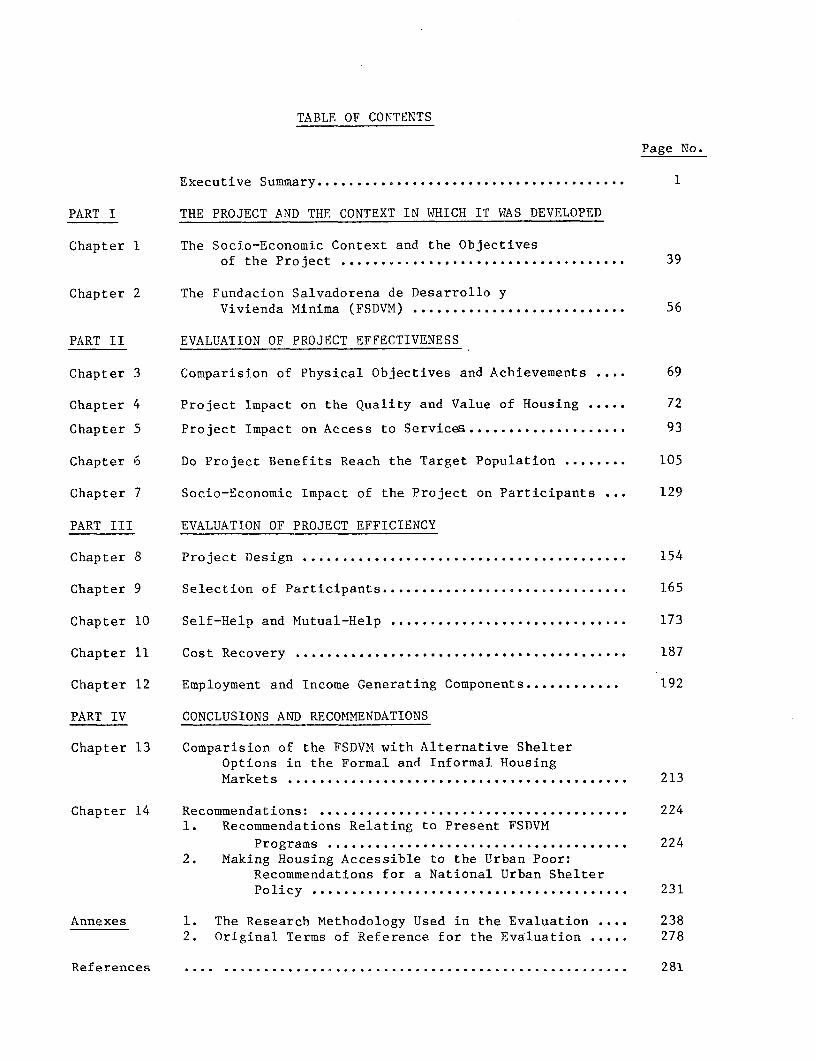
TABLE OF CONTENTS
Page NYo.
Executive Summary ....................................... 1
PART I THE PROJECT AND THE CONTEXT IN WHICH IT WAS DEVELOPED
Chapter 1 The Socio-Economic Context and the Objectivesof the Project ....... ............................. 39
Chapter 2 The Fundacion Salvadorena de Desarrollo yVivienda Minima (FSDVM) ........................... 56
PART II EVALUATION OF PROJECT EFFECTIVENESS
Chapter 3 Comparision of Physical Objectives and Achievements 69
Chapter 4 Project Impact on the Quality and Value of Housing 72
Chapter 5 Project Impact on Access to Services .93
Chapter 6 Do Project Benefits Reach the Target Population .105
Chapter 7 Socio-Economic Impact of the Project on Participants 129
PART III EVALUATION OF PROJECT EFFICIENCY
Chapter 8 Project Design .154
Chapter 9 Selection of Participants .165
Chapter 10 Self-Help and Mutual-Help .173
Chapter 11 Cost Recovery .187
Chapter 12 Employment and Income Generating Components .192
PART IV CONCLUSIONS AND RECOMMENDATIONS
Chapter 13 Comparision of the FSDVM with Alternative ShelterOptions in the Formal and Informal HousingMarkets .213
Chapter 14 Recommendations: .. 2241. Recommendations Relating to Present FSDVM
Programs .2242. Making Housing Accessible to the Urban Poor:
Recommendations for a National Urban ShelterPolicy .231
Annexes 1. The Research Methodology Used in the Evaluation 2382. Original Terms of Reference for the Evaluation 278
References .... ................................................... 281

EXECUTIVE SUMMARY
This Executive Summary presents the main findings and
recommendations of the evaluation of the First El Salvador Sites and
Services Project. The Project, which began in 1974, was intended to
provide 7,000 serviced plots to low income households in the major
Salvadorean cities. The Project, the details of which are presented in
Chapter 2, was unique among World Bank financed shelter projects in
that the Executing Agency, the Salvadorean Foundation for Low Cost
Housing (FSDVM), was a private, non-profit organization.
The terms of reference for the 5 year (1975-80) evaluation 1/
stated that the evaluation should:
'... seek to determine whether the objectives (of theproject) are being met over time, and whether projectcomponents (both physical and institutional) yield theintended social and economic impacts on projectparticipants and on associated institutions ... "
In accordance with these terms of reference, the evaluation
focussed on long-term impacts and the extent to which project objectives
were achieved. An analysis was also conducted of some aspects of
project efficiency but the terms of reference did not include an
evaluation of the financial and institutional context within which the
project was implemented. The overview begins with a presentation of the
main indicators of project efficiency and impact. This is followed by a
more detailed summary of each chapter of the report.
1/ The terms of reference for the evaluation are given in Annex 2.

Most of the evaluation was completed by mid 1979, before the
October 1979 coup which led to the overthrow of the Romero Government
and to the period of violence and political instability which
followed. No attempt has been made to evaluate the impact of these
events although they obviously have had extremely negative effects in
the area of housing. At the time of writing (March 1982) the FSDVM
continues to operate despite the fact that many of its staff have been
forced to leave the country. The use of mutual help construction and
other community development techniques which form a central part of the
FSDVM methodology, have been seriously constrained. The general climate
of violence and uncertainty has slowed the completion of projects, and
this, together with rapid cost increases, has created serious financial
problemns for the institution.
Summary Indicators of Project Efficiency and Impact
Table 1 presents six sets of indicators which can be used to
summarise the evaluation findings on the efficiency and impacts of the
FSDVM project. When taken in combination these indicators show that the
FSDVM project has been very successful in producing good quality housing
at a price which is both affordable to the target population and subs-
tantíally cheaper than any other public housing program. At the same
time the FSDVM has had one of the best cost recovery records of any Bank
financed shelter program. The main operational problem faced by the

Table 1: SUMMARY INDICATORS OF PROJECT EFFICIENCY AND IMPACTS
Indicators Chapter
Physical * All housing units completed, but with-considerable delays 3Implementation due to land acquisition problems.
* Water and drainage systems completed but with delays. 3* Shortfall by other agencies in the provision of schools,
clinica and community centers. 3
Accessibility * Despite high rates of inflation, at least 85 percent ofproject families fell within the target income range. 6
* Very low drop-out rates once houses occupied. 6* No evidence of higher drop-out rates among lower incomehouseholds. 6
* Selection system fair and unbiased. 9
Project Impacts * No clear evidence of impact on overall household income. 7on Participants * Possible increase in labor force participation of secondary
workers 7 w* Self-help construction phase generated approximately $500
labor income per unit. 7* Project construction generated 3700 person/years of employment 7* Specific employment generating components had very limited
impact on income/employment 12* No evidence of reduced expenditure on food as result of
increased housing investmient 7* Increase of 48 square meters of living space per participant 7* Slightly higher satisfaction with living conditions in project
than in control areas 7
Community * Significant progress in developing community organization. 7Participation
Cost Recovery * Only 2.3 percent arrearage (July 1980) with most less than90 days. 11
Comparison of * FSDVM project accessible to families as low as second incomeQuality and Costs decile whereas most public housing programs not accessible belowwith other Housing 6th percentile. 13uptions * FSDVM houses of higher quality than informal housing of
comparable cost. 13* FSDVM project has a higher economic rate of return than anyother formal or informal housing options. 13
* FSDVM projects include design innovations which producesignificant cost reductions 8 and 10

-4-
FSDVM was that of land acquisition, particularly in the Metropolitan
Area. The delays of more than two years caused substantial cost
increases.
Although the project produced significant improvements in the
physical quality of the environment, it was not possible to demonstrate
any long-term impact on income or employment. This is not surprising
when the economic and political climate is taken into account; also it
is possible that some economic impacts, such as increased income from
rent, may only become apparent over a longer time horizon.
In the following sections of this chapter these findings are
presented in more detail.
The Urban Tlousing Deficit in El Salvador (Chapter 2)
During the decade of the Sixties, it was estimated that 10,000
new urban households were forming every year in El Salvador and that
during the same period public and private housing programs were only
producing an average of 2,600 new units per year. By 1972 it was
estimated 147,000 units or 55 percent of the urban housing stock needed
improvement or replacement. The housing production, in addition to
being numerically inadequate, was mainly directed to families in the
upper forty percent of the income distribution, and virtually no formal
housing was being provided for the poorer sectors of the urban popul-
ation. As a consequence virtually all of the poorest 50 percent of the
population were living in dwelling units provided through the informal
market. Almost by definition the informal market was largely outside
the bounds of government regulation and many of the dwellings had
extremely inadequate provision of public services, and equally insecure
tenure arrangements.
The causes and possible solutions to the housing deficit
cannot be understood without considering them within the socio-economic
context of El Salvador.!! The country is very poor, with a per capita
income of $660 in 1978, and with the effects of poverty worsened by a
very skewed income distribution which resulted in the poorest 10 percent
of households receiving only 2.1 percent of income whilst the top 5
percent received an estimated 21.4 percent. One consequence of the
widespread poverty was the estimate in 1976 that three quarters of
children under 5 were suffering from malnutrition. Low incomes also
excluded at least 50 percent of the urban population from access to the
formal housing market, whilst at the same time limiting their financial
ability to produce satisfactory informal shelter alternatives.
The long-term perspective was further worsened by the increas-
ingly high rates of unemployment in the rural areas and the continued
drift towards the cities which further increased the pressure on
existing and new housing stock.
The Achievement of the Physical Objectives of the Project (Chapter 3)
Table 2 shows the progress which had been made towards
achieving the physical objectives of the project by June 1980 (the time
1! As stated earlier, it was not possible to evaluate the impacts ofthe current political situation as the study was completed beforethe recent political events had taken place.

Table 2: COMPARISON OF PHYSICAL OBJECTIVES AND ACHIEVEMENTS OF THEFIRST EL SALVADOR URBAN PROJECT. JUNE 1980.
Responsibility of the FSDVM Responsibility of Other AgencyIn In
Component Target Completed Progress Target Completed Progress
Dwelling Units 6594 1/ 4348 built 22463640 occupied
Infrastructure
Trunk water supply 6 5Sewage collection 2 1Contigency wells 1 1Sewage outfall 5 4Storm drain for O
direct dischargeinto river 5 4
Schools 7 3Clinics 2 1Community centers 10 2 2Market 1Foot pathways 8 5
1/ Original objective was 7000 units but due to switching of subprojects between the firstand second loans the estimates were revised downwards.
Source: URBD1 Back to Office Report. March 21, 1979.FSDVM 22nd report on progress of the First world Bank Loan. July 1980.

- 7 -
when field research for this report was completed). All of the 6594
dwelling units had either been completed or were in process of construc-
tion, although often with delays of more than 2 years due mainly to
difficulties in acquiring land in the major cities.
With respect to the FSDVM's responsibility for infrastruc-
ture: the contingency well was in process of construction, and 4 out of
the 5 storm drains and 5 out of the 8 footpathways had been completed.
It was decided not to complete the market.
With respect to the responsibility of government agencies,
most of the water supply and drainage related components were almost
complete but there had been a shortfall in the provision of schools,
cLinics and community centers.
Project Impact on the Quality and Value of Housing (Chapter 4)
Changes in housing were evaluated in terms of physical charac-
teristics (materials and types of services), family satisfaction and the
estimated monetary value. Table 3 presents the estimated changes in the
quality of housing based on its physical characteristics. FSDVM
participants experienced significant improvements in most aspects of
housing quality except for floors. Using a weighted average it can be
seen that quality increased more in FSDVM projects than in any of the
three types of low income housing in which participants had previously
lived.
A move to the FSDVM project produced quality improvements for
families previously living in all types of informal low-income housing,

Table 3: CHANGES IN HOUSING QUALITY OF PROJECT PARTICIPANTS IN SONSONATE1977-1980 AND THEIR COMPARISON WITH CHANGES IN CONTROL GROUP
(In Percent)
WeightedWeighted AverageAverage 1980
Roof Walls Floor Water Sanitation Light Change Change
Weights 3.875 .753 1.365 2.759 3.465 2.904
PARTICIPANTS
1977 Score 92.8 58.5 78.9 67.4 52.5 40.7 166.2
1980 Score 98.3 96.9 98.9 98.0 100.0 100.0 249.4
Change +5.5 +38.4 +20.0 +30.6 +47.5 +59.3 +83.1
CONTROL GROUP CHANGE
Mesones +3.7 +2.6 +6.1 -8.4 +13.1 +60.6 +37.1
Colonias +10.2 +10.8 +26.2 +40.2 +3.0 +87.1 +76.3

- 9 -
but the imiprovements were greatest for families moving from a squatter
settlement (tugurio). 1/ A study of satisfaction with housing conducted
in 1980 showed that project participants had higher levels of satisfac-
tion with lot size, living area, materials and quality of construction
than families in any of the main types of informal housing. 2/
Estimates were also made of changes in housing value. As
FSDVM participants were not permitted to sublet or seelduring the first
5 years it was not possible to obtain direct information on rents and
sales prices. Consequently estimates had to be based on comparisons of
cost with imputed rents and sales prices. Table 4 presents these
lndicators. Care must be taken in comparing the FSDVM with the colonias
(illegal subdivisions) as the latter has a very wide range of costs and
values. Although mean imputed value and rent is much higher in the
colonias, the imputed sale/cost ratio is higher for the FSDVM suggesting
a higher return on investment to FSDVM fa-milies. The final column
compares the sale/rent ratio. The lowest value is for the tugurio
(squatter settlement) which is consistent with the fact that they can
command rent because of their good loction but that the sale price is
very low due to the very insecure tenure. The sale/rent ratio is
considerably higher for the colonias than for the FSDVM. If these
estimates are accurate they suggest that FSDVM units can command a
relatively high rent due to their higher service level but that the
expected future value of the colonia (with its larger plot size) is
11 See Chapter 4, Table 4.5 for more details.2/ See chapter 4, Table 4.6 for more details.

Table 4: COMPARISON OF COST, OWNER S ESTIMATED SALE PRICE AND RENT FOR PROJECT AND INFORMAL HOUSINGSANTA ANA, 1980
Cost (C$) Estimated Sale Price (C$) 1/ Rent (C$) 2/ Sale-Cost Ratio Sale-Rent RatioInterquartile Range Interquartile Range
X 25% 75% X 25% 75% X X X
OWNERS
FSDVM 7639 5972 9136 9390 6500 10000 83.3 1.22 113
Colonia 20702 5946 21413 21318 12000 25000 136.8 1.08 156
Tugurio 645 288 836 616 350 800 17.8 .96 35
RENTERS
Meson 3317 33.2
Colonia 5122 51.2
Note: 1/ For owners, sale price was estimated by owners; for renters, it is actual rent times 100.2/ For owners, this is their estimate of rental value.

- 11 -
comparatively higher. Chapter 4 (Section 4) presents a number of
possibly ways to estimate changes in the value of housing between 1976
and 1980. None of these are entirely adequate as information was not
obtained on imputed rents and sales prices in 1976. If changes in
rental values are used as a proxy, the rental value of the FSDVM unit in
1980 is 3.59 times higher than the rental value of the tenement in which
the project family was living in 1976. This compares with much lower
increases for rented housing in illegal subdivisions and tenements,
suggesting that the move to the project produces greater increases in
housing value than would have occurred if participants had remained in
their previous rented accomodation.
An alternative approach to estimating the effect of the FSDVM
project was developed by Quigley. 1/ On the basis of hedonie price
coefficients estimates for mesones in 1976 2/ a utility function was
calculated to estimate the additional utility the participants derived
from their move to the project. The form chosen was the Generalized
Constant Elasticity of Substitution (GCES) function. It was estimated
that in 1979 the average amount which could be subtracted from
participants to leave them as well off as they were in 1976 was 5 .3
colones which is about 2.5 percent of total income or about 20 percent
1/ John Quigley, "The Distributional Consequences of Stylized HousingPrograms," Urban and Regional Report No. 80-18. Urban and RegionalEconomics Division, The World Bank, August 1980.
2/ This technique permits the estimation of a coefficient indicatingthe amount families are prepared to pay for each attribute of adwelling (type of water supply, number of rooms, quality ofmaterials, etc.). These coefficients can then be applied to thenew FSDVM project to estimate how much people would have beenprepared to pay for this package of housing services.

- 12 -
of what they would have been paying for rent. The amount of additional
utility was not found to be systematically related to income or family
size. -L/
Conclusion
The figures appear to show that the FSDVM project produces a
higher increase in value per colon invested than any other type of owner
occupied housing and that the value of the housing benefits has
increased for participants about twice as much as if they had continued
to live in a meson. Although the precise magnitude of estimated
benefits varíes with the method of estimation, the general pattern and
the more favorable evaluation of the FSDVM is consistent across all
estimates.
Project Impact on Access to Urban Services (Chapter 5)
Table 5 compares the project in Santa Ana with the main types
of informal housing in terms of their distances (in meters) from differ-
ent types of services. On average the project is further from these
services than are the tenements, but nearer than the illegal subdi-
visions. Given the smallness of most Salvadorean cities, not too much
importance should be given to the differences in distances.
When participants in Santa Ana were asked about their satis-
faction with access to services, 90 percent or more were completely
satisfied with access to schools, water and public lighting, but less
1/ Quigley, Table 22.

- 13 -
Table 5: MEAN DISTANCE IN METERS FROM SERVICES AND EMPLOYMENT. FSDVM PROJECTIN SANTA ANA. MESONES, COLONIAS AND TUGURIOS 1980.
Participants Mesones Colonias Tugurios Mean
Medical Aid 909 502 1369 810 800
School 250 380 490 477 351
Public Transport 1016 172 343 328 555
Public Lighting 18 46 228 214 109
Public Telephone 222 317 860 502 434
Market 2128 675 1610 976 1475
Playground or Park 182 602 1272 795 626
Heads Work Place 1583 1079 1164 1052 1279
Average Distance 780 471 917 775

- 14 - ;
than 20 percent were satisfied with access to medical services and
public transport. 1/ Families in mesones were more satisfied with both
medical services and transport and had comparable levels of satisfaction
to participants on the other services. 2/ Families in colonias were
more satisfied than participants with access to health and transport but
were less satisfied with access to schools, water and public lighting.
Interestingly the tugurio residents had almost the same level of
satisfaction as participants on most services.
The project has a more favorable evaluation than other types
of low-income housing with respect to access to water. In all other
cases water supply was severely restrieted in terms of hours of service,
quality or distance, whereas the project provided a constant service in
the house.
A final factor is sanitary facilities. One of the major
complaints of residents in mesones is having to share a toilet, often
with up to 10 other families. The possession of a private toilet is
another of the reasons given for wishing to participate in the FSDVM
project.
Project Affordability to the Target Population (Chapter 6)
Estimates of project affordability have traditionally been
based on two assumptions: that project costs can be equated with fixed
payments to the implementing agency and that families can only afford to
1/ Chapter 5, Table 5.4.2/ Chapter 5, Table 5.5.
- 15 -
invest a relatively low proportion of their monthly income (often about
20 percent) in housing. The evaluation showed that neither of these
assumptions was valid in the case of El Salvador. It was found that on
average fixed payments to the FSDVM only represented about 40 percent of
the total housing investment made by families (so that on average
families were paying more than twice the amount assumed in the original
affordability estimates). 1/ However, this did not cause major
affordability problems as families were willing to invest significantly
more than 20 percent of their income and because many of the poorest
households received financial support from relatives in the form of
regular income transfers. The decision to participate in the project
appeared to inerease the flow of income transfers.
Table 6 shows that in the three main projects, at least 85
percent of participants fell within the target income range (below the
65th income percentile). Moreover, projects in interior cities were
able to absorb between 14 and 18 percent of the total city population in
the third to fifth income deciles. 2/
Concern has often been expressed that poorer families might be
forced to drop out of the project due to their inability to meet house
consolidation costs. It was found, however, that annual project
turnover rates once the house was occupied ranged between 3 and 13
1/ Chapter 6, Table 6.2.2/ Chapter 6, Table 6.8.

- 16 -
Table 6: FSDVM PARTICIPANTS BY URBAN INCOME DECILESANTA ANA, SONSONATE AND SAN SALVADOR, 1976
Urban FSDVM Projects - Cumulative PercentagePopulation Participants in Each Decile
Income Deciles Upper Limit Santa Ana Sonsonate San Salvador
0 - 10 114 1 3.8 7.7
11 - 20 170 11 13.1 15.5
21 - 30 227 38 32.0 29.8
31 - 40 286 43 63.5 41.3
41 - 50 376 69 92.7 65.1
51 - 60 475 81 100.0 99.1
61 - 70 574 90 100.0
71 - 80 786 98
81 - 90 1153
91 - 100 4000

- 17 -
percent as compared to rates of 15 to 26 percent in other types of low-
income housing. There was also no evidence of higher drop-out rates for
poorer project families. 1-
Project Impacts on Participants (Chapter 7)
It was not possible to detect any clear pattern of project
impact on the overall income and employment situation of participants.
There were, however, a number of indications of ways in which the
project might have affected the economic situation of certain sub-
groups. It was found that between 1976 and 1980 total family income of
poor participants was increasing more, relative to control group
families, than the income of higher income project families. This is
due in part to transfer income received from non-household members. It
was also found that during the very difficult economie climate, labor
force participation rates for secondary workers in participant families
declined less than for control group families. This was particularly
true for spouses where there was a significant reduction in the number
of working spouses in the control group but almost no change among
participants.
Although it was not possible to identify any significant long
term project impact on the income or employment situation of partic-
ipants, Table 7 shows that the process of house contruction did produce
significant short term impacts. It was estimated that the construction
of each house generated on average $497 of income to hired labor and 6.4
1/ Chapter 6, Table 6.10.

Table 7: ESTIMATION OF INCOME AND PERSON/MONTHS OF EMPLOYMENT GENERATED BYHOUSE CONSTRUCTION IN THREE FSDVM PROJECTS
La Periquera Sensunapan El Naranjo Mean Income/Santa Ana Sonsonate Usulutan Months Per Family
Number of Units 1190 563 435
Contractor ConstructionPerson/months of employment 1908 1330 420 1.7Income (Colones) 478.368 307.508 112.263 410
Construction CooperativePerson/months 130 0.1Income (Colones) 20.000 9.1 H
Mutual HelpPerson/months 2471 1673 1342 2.5Income 392.267 217.580 174.550 343
Labor Hired by the FamilyPerson/months 2600 1200 950 2.2Income (Colones) 571.200 270.240 208.800 480
TOTALPerson/months 7109 4203 2712 6.4Income (Colones) 1.428.835 795.318 495.613 1243
Project Cost 3.921.818 1.817.087 1.504.136 3310
Investment Required to GenerateC 100 of Income 364 228 303 316
Investment Required to GenerateOne Month of Employment (Colones) 551 432 554 516

- 19 -
months of employment. The total project generated approximately
$4,160,000 of wage income and 3700 person/years of employment.
Efforts to develop specific employment generating components
within the project have not produced any significant quantitative impact
although a number of potentially interesting employment models have been
tested on a small scale.
There does not seem to be any overall negative effects of
participants' housing investment on consumption of basic necessities
such as food and medicine.
Most project participants previously lived in tenement houses
(mesones). In comparison with their former dwelling the move to the
project has meant an increase of 4.8 M2 in the living space per person
and a reduction of 2.2 in the number of people per room. -/ From the
health point of view these improvements are very significant.
When compared with the control groups, there is a slightly
higher proportion of participants who feel that their conditions have
improved over the past two years. The differences are greatest with
respect to income (63 percent consider they are better off compared with
52 percent of the control group), and health (37 percent consider their
conditions have improved as compared with 28 percent from the control
group).
1/ The changes are very substantial due to the fact that prior tomoving to the project participants had larger households than thecontrol group and lived in smaller than average dwellings.

- 20 -
Evaluating the Efficiency of Project Design (Chapter 9)
In an effort to reduce costs the FSDVM is continually
experimenting with new designs. The following are some of the ways in
which cost reductions are achieved:
a. More efficient land use:
The proportion of land used for vehicular traffic is
substantially reduced. Rouses are grouped around parks
or communal areas. Two storey units are constructed in
areas of high land cost.
b. House design and level of construction:
The FSDVM reduces the level of construction to a minimum
so that families can complete the construction according
to their own needs and resources. Project layout is
designed to minimize the amount of pipe needed for water
and sewage and to reduce drainage construction work by
taking advantage of natural gradients.
c. Use of progressive development and self-help:
Families are able to buy materials more cheaply than they
could be obtained in the formal market and in many cases
they reduce labor costs either by using underutilized
family labor or by hiring labor at below market rates.
d. Experimentation with new materials:
Research is conducted on the use of local materials for
making blocks and families can usually hire a block
making machine and receive training in its use.

- 21 -
e. Design innovations:
A number of new shelter designs have been tested in an
effort to reduce costs. One is the construction of 2
storey units so as to reduce plot size in high cost
areas. This has now achieved densities of 140 units per
hectare compared with less than 100 for traditional four
storey government apartments. Another innovation is to
experiment with the renovation of existing tenement
houses or the construction of tenements in the
projects. There is not yet sufficient experience to know
how this will affect costs but it is potentially a very
interesting way to provide accessible shelter in high
cost central city areas.
Studies showed that participants were more satisfied with all aspects of
house design than were families in mesones. -1 However, meson families
were more satisfied with access to services such as medical services,
public lighting and transport, etc. The project also compares favorably
with subdivisions in terms of satisfaction with water and sanitation,
but is rated lower in terms of lot area.
Selection of Participants (Chapter 9)
The selection procedures seem to have been unbiased and to
have selected families within the target income range. Considerable
time is devoted to initial interviews and orientation, and although this
1/ Chapter 8, Table 8.1.

- 22 -
slows the selection process, the policy seems to pay off as evidenced by
very low drop-out rates, rapid house consolidation and excellent
repayment rates.
A number of issues are discussed in this chapter:
a. A large number of applicants are lost during the
selection process as the address they have given cannot
be located.
b. Until now income criteria for eligibility are only based
on earned income. It is necessary to consider whether
gifts and other types of income transfer should also be
taken into consideration.
c. At present willingness to participate in mutual help
construction is an essential requirement for selection.
This appears to eliminate a certain number of otherwise
eligible families. Consideration should be given to
whether greater flexibility is required in the
application of this criterion.
d. The mechanics of the selection process may need to be
speeded up through computerization.
Mutual Help and Self-Help (Chapter 10)
The construction process consists of four stages: project
preparation, construction by contractor of infrastructure and in some
cases a basic sanitary core, mutual help group construction, and self-
help construction by the family.

- 23 -
Mutual-help construction, which is obligatory, normally lasts
between 25 and 35 weekends. Groups of about 25 families work together
to complete the basic unit. Mutual help construction eliminates the
requirement of a 10 percent down-payment and hence permits access to
poor families who have no savings. In the San Miguel project 75 percent
of families stated they would not have been able to participate were it
not for the mutual help system (and the elimination of the down-
payment).
In some of the earlier projects mutual help took longer than
expected due to: drop outs which reduced the size of the work group,
scheduling problems, and difficulties in providing sufficient community
promotors. These delays raised the cost and produced a certain amount
of dissatisfaction. In later projects the system has been streamlined
and work has been completed according to schedule. Estimates suggest
that except for skilled laborers with a high shadow wage, mutual help is
slightly cheaper for participants than contractor built housing. In
general the quality of the mutual help construction is comparable to
that of contractor built houses.
Mutual help construction appears to be an effective way of
training families in basic planning and organizational skills, and most
groups continue to work together on the physical consolidation of their
neighborhood after the house construction is completed. The FSDVM also
believes the mutual help system is a contributing factor to the
extremely good cost recovery performance.

- 24 -
Self-help construction is an essential complement to the
mutual help. The family normally receives a constructed area of about
30 M2 which after about 2 years will have been inereased by the fmaily
to between 35 and 40 M2.
As shown in Chapter 4 the quality of the construction is
generally superior to informal housing.
Self help construction is claimed by the FSDVM to be cheaper
than the use of contractors. A study found savings of between 19
percent and 46 percent when self-help construction was used. -/ How-
ever, if the opportunity cost of labor is included the savings are
smaller although still estimated to be in the range of 25 percent in
most cases. Families are able to obtain materials at below market
prices and mnake further savings by the use of family labor or by the
exchange of favors with neighbors or friends.
Cost Recovery (Chapter 11)
The FSDVM has one of the best loan repayment records of any
World Bank shelter program. As of July 1980 total payments in arrears
represented only 2.3 percent of the total loan portfolio. Most of the
overdue families are only 2 or 3 payments in arrears and only 22.4
percent of overdue families are more than 90 days in arrears. 2/
The FSDVM combines strict collection procedures with the
development of a high sense of social responsibility. Although many
1/ See Chapter 10, Table 10.3.2/ See Chapter 11, Table 11.2.

- 25 -
families fall into arrears for short periods due to economic diffic-
ulties, they rarely get so far behind that they cannot catch up. Up to
1980 the collection rate had been steadily improving, but since then the
default rate has begun to rise due to the political situation.
The question should be asked as to why the FSDVM repayments
position is so much better than most projects of this kind. The
following reasons can be given:
i. The FSDVM is a private organization and is thus freed
from some of the bureaucratic constraints and political
pressures which make collection more difficult in many
other organizations.
ii. The FSDVM is non-profit and does not have a large reserve
so a high repayment rate is absolutely essential if the
program is to continue operating. There is more motiv-
ation to collect than in many organizations.
iii. Relatively tough and highly visible measures are used to
pressure families to pay. Although evietion is rarely
used, a lawyer will visit the family when they fall too
far behind.
iv. Efficient collection procedures are used with computer
ization to provide immediate information on outstanding
debts, and with collectors who visit all families.
v. In some projects the community organizations play a major
role in collections.

- 26 -
vi. The use of mutual help construction and the substantial
investment of resources in developing community
institutions is probably a major factor in debt repay-
ment. The communities have a very high degree of social
responsibility.
vii. Until now the FSDVM has remained relatively small so it
has been easier to maintain a close supervision of debt
collection.
vi¡i. Careful selection of participants to ensure they have the
capacity to pay.
The Efficiency and Effectiveness of IncomeGenerating Components (Chapter 12)
From 1972, when the cooperative began, to 1978 the FSDVM had
created 7 cooperatives, a marketing and sales center and an artesan
school. Together the cooperatives had 629 members. After a rapid start
the cooperatives encountered a number of organizational and adminis-
trative problems and the rate of growth slowed very considerably. By
1977 the rate of progress was increasing again and in addition to the
six cooperatives operating at the time (see Table 8) work was in
progress on an additional 8 organizations.
Three and a half percent of the economically active population
in the first 6 projects obtained work through the cooperatives, (94 out
of a total labor force of approximately 2700). The main employment
generating cooperatives included: a bakery, production of building
materials, and dressmaking and rugmaking. To date the cooperative have

Table 8: DETAILS OF FSDVM ASSOCIATED COOPERATIVES WHICH WERE OPERATING IN SEPTEMBER 1978
DailyPeople Income
Name Activity Founded Members Employed (Colones) Social Capital Total Capital
Plan Piloto Dressmaking 1974 60 59 6.00 22,000 66,650
La Semilla de Artesan products of wood,Dios 1/ leather, etc. 1977 58 116 7.00 1,892 1,892
El Conacastal Bakery 1975 56 10 5.00 2,079 51,079
La Victoria Savings and loan andconsumer cooperative 1975 383 3 7.00 14,922 16,147
Liberacion Savings and loan andconsumer 1977 70 - - 6,714 6,714
5 de Noviembre Savings and loan and In the processconsumer of being formed 90 - - 6,618 3,618
TOTAL 717 188 C$51,225 C$145,650($20,490) ($58,260)
1/ This cooperative is not associated with an FSDVM housing project.
Source: Departamento de Empresas Comunitarias. FSDVM. Information prepared at the request of IBRD, September 20, 1978..

- 28 -
proved a useful source of employment for their members but none have the
growth potential to have a major impact on the economic conditions of
the project in which they operate.
The cooperative has proved an effective way to teach organiz-
ational skills to is members. Although the more active cooperatives
have increased the social consciousness and political awareness of their
members, most cooperatives only cater to a sector of the community and
in some cases they have tended to be a divisive force, creating what
other members of the community felt to be an economic elite. Other
types of cooperative such as savings and loan or consumer cooperatives
can have a wider appeal and can in principle involve all sectors of the
community.
The FSDVM has examined alternative employment strategies such
as accepting sub-contracts from large international corporations to
produce articles such as jeans or dolls. Whilst the employment poten-
tial is much greater the FSDVM is reluctant to enter into this type of
arrangement, partly because of the heavy financial responsibility the
FSDVM would have to assume, and partly because a project of this kind
would go against many of the social objectives the FSDVM is trying to
develop.
A Comparison of the FSDVM Projects with AlternativeShelter Options in the Formal and Informal Housing Market
Table 9 compares the affordability of nine types of formal and
informal housing in San Salvador. It can be seen that none of the
operating formal housing programs are affordable below the 48th income

- 29 -
Table 9: ACCESSIBILITY OF FORMAL AND INFORMAL HOUSING PROGRAMS TOTHE URBAN POOR. SAN SALVADOR. 1977
Lowest percentile whoInstitution Type of Housing can afford this option
Tenement housing Poorest quality 6(mesones)
Estra-legal Poorest quality 10subdivisions(colonia ilegal)
FSDVM Basic core unit 24
Tenement Housing Adequate quality 24
IVU (Instituto de Marginal housing 27Vivienda Urbana) in squatter areas
(discontinued)
Extra-legal Adequate standard 42subdivisions
FSV (Fondo Social Normal programpara la Vivienda) (1975-1978) 48
IVU 2 bedroomed houses 52
IVU 4 bedroomed houses Beyond 60th percentile
IVU Apartments Beyond 60th percentile
FSV Normal program Beyond 60th percentile(1978-1982)
Source: Jim Richard and Michael Bamberger, "Economic Evaluation ofSites and Services Programs and Their Accessibility toLow-Income Groups in El Salvador", Table 2.15, FSDVM ReportSeries on the Evaluation Program. No. 16. July 1977.

- 30 -
percentile, and most cater to groups above the 60th percentile. The
table also shows that the cheapest public housing costs more than twice
as much as the FSDVM units. The FSDVM projects are clearly more afford-
able to the urban poor than any other public housing. The situation is
more complicated with respect to informal housing as several types are
cheaper than the FSDVM. The cheapest mesones and colonias ilegales are
affordable to families in the lowest income decile and even good quality
mesones compete with the FSDVM.
An obvious explanation of why some types of housing cost less
is because there are differences in the quality of the package of
services received. Various methods are used to compare the amount of
benefits being offered for a given price:
(a) In Chapter 4 it was shown that the quality of the FSDVM
project was superior to that of most of the types of housing
from which participants came.
(b) Chapter 5 showed the FSDVM projects offer no such clear
advantage in terms of access to services. The mesones, with
their central location, have better access to many public
services although the FSDVM has better access to water and
sanitation.
c) A more systematic analysis was conducted through the use of
cost-benefit analysis. The Internal Rate of Return provides a
comparison of the benefits received for a given investment in
different types of housing. Table 10 shows that the two FSDVM
options studied have higher rates of return than any other

Table 10: COMPARISON OF HOUSING OPTIONS IN TERMS OF ECONOMIC RATE OF RETURN NET PRESENTVALUE AND NET PRESENT VALUE/TOTAL COST. SAN SALVADOR. 1978.
Net Ranking on 3Rate of Present Value Indicators
Housing Option Return (Colones) NPV/Cost (1 = highest)
Upgrading and Sites and Services
FSDVM Basic Unit 33 4065 1.2016 1
FSDVM Serviced Lot 28 2329 0.7269 2
IVU Rehabilitation 18 1078 0.2640 4
Traditional Housing
IVU Multi-family units 9 -1828 -0.1304 9
IVU Single family 2 bedroom unit 11 - 606 -0.0720 8
FSV Single family unit 13 452 0.0641 5
Informal market
Colonia ilegal 22 1788 0.3509 3
Meson 12 1674 0.0141 7
Tugurio 20 373 0.2972 6
Source: Marisa Fernandez-Palacios and Michael Bamberger, "An Economic Analysis of Low-CostHousing Options in El Salvador." DEDRB (draft). August 1979.

- 32 -
type of formal or informal housing accessible to low and
middle income groups in San Salvador. The projects also have
the most favorable rating on the other indicators and the
highest overall ranking. This is the closest we can
approximate to a comparison of "benefits received per unit
cost". This analysis suggests that for a family living in a
meson (where most participants previously lived) the move to
the project would almost treble the rate of return.
In conclusion we can say that the FSDVM projects offer a very
attractive option to low-income families. The projects are cheap
enough to be affordable down to the 20th percentile, whereas most
government programs do not reach below the 50th percentile. The FSDVM
projects also compare favorably in terms of cost benefit indicators with
all other formal and informal housing options. All of these indicators
suggest that a family can buy more housing services (benefits) for a
given amount of money from the FSDVM than from any the other shelter
options available in the market.
Recommendations (Chapter 14)
The first part of this chapter makes recommendations related
to FSDVM programs whilst the second part presents a more general dis-
cussion of strategies to make housing accessible to the urban poor. The
main recommendations relating to FSDVM programs are the following:

- 33 -
Project Design
i. The FSDVM should continue its policy of only working in
urban areas.
ii. The FSDVM should continue its policy of spreading programs
over a large number of cities.
iii. The polícy of selecting large sites on the periphery of the
major cities seems logical and inevitable given the scarcity
of land. At the same time advantage should be taken of any
smaller centrally located sites which become available.
iv. Within projeets the FSDVM should experiment with a number of
different options among which:
a. Variations in plot size.
b. Inclusion of rental units.
c. Serviced plots should mainly be sold to slightly higher
income families.
d. Experimentation should continue with units with shared
services (washing facilities, water or toilets).
v. The FSDVM should experiment with the following types of new
projects:
a. Tenement rehabilitation.
b. Two storey units.
c. Lower service levels. In particular attempts should be
made to gain authorization to experiment with communal
water supply as a way to reduce costs.
- 34 -
Project Finance
i. The possibility of larger loans for purchasing materials
should be explored.
ii. Loans should not necessarily have to be used in the project
store.
iii. Loans should also be usable for hiring labor as well as
buying materials.
iv. Experimentation should continue with cross-subsidies as a way
to reduce project costs.
v. If financing is available the FSDVM might wish to consider
the possibility of providing financing to families who wish to
build their own homes in colonias ilegales.
Project Implementation
i. A number of changes are recommended in selection procedures:
a. Sources of unearned income should be taken into account
when estimating a family's capacity to pay.
b. The requirement of participation in mutual help cons
truction should be relaxed.
c. More complete information should be provided to families
on all housing costs.
d. In large projects a more active attempt should be made to
select low-income families, particularly from squatter
settlements.

- 35 -
ii. Certain changes are proposed for mutual help:
a. Not all families should be required to participate in
mutual help.
b. Large project should be broken down into phases so that
all mutual help groups can begin with their full comple-
ment of families.
c. More efficient use should be made of skilled labor in the
groups, with these members possibly making their skills
available to a number of different groups.
d. The possibility should be investigated of permitting
groups to work during the week as well as at weekends.
iii. With respect to self-help:
a. The use of cheaper materials should be encouraged by the
provision of transport to help people bring materials
from their former dwellings, by having model houses built
of cheaper materials, and by setting aside sectors of the
project for poorer families.
b. Research should continue on local materials.
c. Loans should cover hiring labor as well as material
purchase.
d. Families should be permitted to use their loans to
purchase materials outside the project.
iv. Employment generation:
a. The cooperative program should continue with emphasis on:
reactivation of the building materials cooperative;
- 36 -
production cooperatives which generate more employment,
possibly through subcontracts from international
companies; and consumer cooperatives.
b. Small business loans should be provided to support exist
ing businesses and encourage the growth of new ones.
The second part of the recommendations refer to policies for
making housing more accessible to the urban poor. Six general
guidelines were proposed:
i. Emphasis on upgrading existing housing stock.
ii. The need to provide a wide range of different shelter options
as families have different requirements in terms of location,
cost, tenure, level of services, etc.
iii. Private initiative should be stimulated as a complement to
government programs. Both entrepreneurs who build for profit
and the house owners who wish to sublet should be encouraged.
iv. Previously unused financial and human resources should be
tapped.
v. Lower standards of construction and services much be accepted
if they are to be affordable.
vi. The development of a national land use policy is essential.
Within these general guidelines 3 main systems for the provision of
shelter should be utilized:

- 37 -
Upgrading Existing Housing Stock
This is usually thought of only in terms of upgrading squatter
settlements but the program should also cover upgrading of colonias
ilegales and tenements.
Sites and Services
In addition to the FSDVM approach, sites and services should
also be extended to include the colonias ilegales.
Traditional House Construction
Present programs of IVU, FSV, and FND should continue.
The main components of an integrated urban shelter program are
presented in Table 11. This emphasizes that at least 7 types of shelter
should be provided, each directed at a different target population.

Table 11: MAIN COMPONENTS OF AN INTEGRATED LOW-INCOME URBAN SHELTER STRATEGY
TargetPopulation
Type Income Institutional andSystem of Housing Location Deciles Characteristics Financial Arrangements
Upgrading Squatter Inner Lowest Irregular IVU with strong publicsettlements City 20% employment works component
Extra-legal Periphery 30 - 60 Wide variation Regulatory. Some infra-subdivision structure and major financial
component for self-help.
Tenement Inner 15 - 60 Small families, Regulatory. Some publicCity commerce, some works. Condominimum
migrant workers development with financialassistance. ¡
Sites FSDVM Model Periphery 20 - 60 Stable families FSDVM or IVU. Internationaland and relatively financing. Possible linkageServices stable income to FSV.
Extra-legal Periphery 35 - 60 Wide variation Regulatory. Infrastructuresubdivision and finance for construction
loans or land purchase
Traditional Single family Various 40 - 60 Stable families IVU, FSV, FNVHousing or multiple and stable
famiíly employment

-39-
CHAPTER 1
THE SOCIO-ECONOMIC CONTEXT AND THE OBJECTIVES OFTHE WORLD BANK SHELTER PROJECT
1. The Socio-Economic Context 1/
El Salvador is the smallest and most densely populated country
on the American continent. With a land area of 20,935 square kilometers
and an estimated population of 4,300,000 it has a population density
of over 200 per square kilometer, roughly equal to India. Given the
mountainous nature of the country, the effective population density is
even hígher.
Improvements in health, combined with a continued high birth
rate have produced a natural population growth rate of 3 percent per
annum. The effect has been to increase the dependency ratio of total
population to labor force, and to contribute to high rates of unemployment
and pressure on basic services.
El Salvador is basically an agricultural country. In 1980,
only 41 percent of the population are classified as urban. Although the
smallness of the country permits some people to work in the city but live
in rural areas, the low urbanization figure emphasizes the fact that the
majority of the working population is still dependent upon agriculture
for at least part of the year.
Agriculture which contributes one quarter of the Gross National
Product and provides employment for over half of the labor force, is
divided into two distinct sectors: the production of export crops
1/ At the time of completing this report (March 1982) El Salvador wasundergoing a violent revolution, the outcome of which is almostcertainly to produce dramatic changes in the social, political andeconomic conditions of the country. It is too early to evaluatethe effects of these changes and no attempt to analyze them ismade in the report.
- 40 -
(coffee and cotton) on about 2000 large farms of over 100 hectares,
and the production of basic grains on some 250,000 small holdings of
under 10 hectares. The main export crops only provide large scale
employment during the 5 months of the harvest and only about three
quarters of the 600,000 people employed in agriculture have permanent
employment. During the remaining seven months of the year it is estimated
that up to 50 percent of the rural labor force is unemployed. The
employment situation is further complicated by the fact that over 60
percent of small farmers are renters or share-croppers, many of them with
very large insecure land tenure. In recent years the demand for land for
export crops has further increased the proportion of landless peasants.
Unstable employment, insecure land tenure and lack of basic
services all contribute to the migration from rural to urban areas.
Although much of this migration is seasonal, with families returning to
the rural areas during the harvest season, increasing numbers are now
remaining in the cities or migratíng to other Central American countries.
It has been found that a very high proportion of urban migrants are women
as they have even more problems than men in finding employment in the
rural areas. This has a very disruptive effect on the family structure.
In several of the FSDVM projects up to 40 percent of household heads
are female.
Despite these structural problems in the rural areas, GDP
has grown at an average annual rate of 5.3 percent between 1960 and
1977 and about 2.1 percent on a per capita basis. The economic growth
has not been distributed evenly throughout the economy and is mainly

-41-
attributed to exports (coffee and cotton principally) which increased
from 22 percent to 36 percent of GDP between 1960 and 1977, and to a
relatively small but dynamic manufacturing and industrial sector whose
growth rates were significantly higher than those of the service sector
and agriculture.
2. Indicators of Poverty
As the Bank project is directed to the low-income population
it is worthwhile to briefly review some of the principal indicators of
poverty which are available for El Salvador. 1/ El Salvador is a poor
country with a GNP per capita of $660 in 1978. The effects of poverty
are worsened by the highly skewed income distribution. In 1976-77
it was estimated that whilst the top 5 percent of households received
21.4 percent of the total income, the poorest 10 percent of families
received only 2.1 percent. (See Table 1.1).
Although poor families in the urban areas spend about 50-70
percent of their income on food, malnutration is widespread, part-
icularly among children. In 1976 it was estimated that three quarters
of the children aged 6 months to 5 years suffered from malnutrition
and that over half suffered from first degree malnutrition. 2/ According
to recent national household budget surveys (1976-1977) about 40 percent
of the population with a monthly household income of less than 200
1/ The issue of poverty in El Salvador is examined in detail in therecent World Bank publication, "El Salvador: An Enquiry intoUrban Poverty."
2/ Ibid., p. 39.

-42-
Table 1.1: EL SALVADOR: CUMULATIVE HOUSEHOLD INCOMEDISTRIBUTION, 1976-1977
(Percentages)
El SalvadorDeciles Total Rural Urban
1 2.1 2.7 2.1
2 5.8 7.3 5.5
3 10.4 12.9 10.7
4 15.8 19.6 16.4
5 22.5 27.5 23.7
6 30.5 36.4 32.8
7 39.6 46.7 43.4
8 42.3 58.4 56.1
9 68.7 72.8 69.9
10 100.0 100.0 100.0
Top 5% 21.4 17.5 19.9
Top 1% 7.4 7.1 7.4
Gini Coefficient .413 .356 .384
Source: MINPLAN, DIGESTIC, and Central Bank, Distribuciondel Ingreso por Deciles de Familias, August 1976-July 1977.

-43-
colones was experiencing deficient diet while the bottom 12 percent of
the population with a monthly household income of 100 colones or less was
suffering from severely inadequate diet. The calorie deficiency of the
latter group was higher than their protein deficiency, which implies that
an increase in the quantity rather than the quality of food intake was
required.
Although there has been a steady fall in the overall death
rate (from 33 per 1000 in 1920 to 10.5 per 1000 today), the infant
mortality rate is still very high, particularly in rural areas (120
o/oo compared to 85 o/oo in urban areas). Diarrheal diseases, nutritional
deficiencies, pneumonia and perinatal diseases are the leading causes of
early deaths. An analysis of mortality and morbidity statistics clearly
indicate that lack of environmental sanitation (inadequate water supply,
waste disposal, letrinization, health education and health services)
are the most serious health problems facing the country.
3. Housing: Public Housing Programs and the Informal Housing Market
Investment in residential housing construction in 1977
represented 6.2 percent of GDP as compared with only 2.5 percent in
1972. 1/ The increase was due mainly to a rapid growth in public housing
which increased from 4.9 percent of residential construction in 1972
to 29.5 percent in 1977 (see Table 1.2).
1/ Ibid., p. 39.

-44-
Table 1.2: RESIDENTIAL CONSTRUCTION IN EL SALVADOR
1972 1973 1974 1975 1976 1977
Total Housing/GDP 2.5 2.7 3.5 3.6 4.5 6.2
Public Housing/Total Housing 4.9 12.7 14.9 25.4 29.5 29.5
Although residential construction as a proportion of GDP has
been rising over the years, in 1977 El Salvador still spent less than
the average of Latin American countries (see Table 1.3).
Table 1.3: RESIDENTIAL CONSTRUCTION AS PERCENTAGE OF GDP
1970 1975 1977
El Salvador 1.2 1.1 1.3
Average for Latin America 1.8 1.5 1.6
Note: The figures are considerably lower than the Bank'sestimates because of definitional differences. Whilethe Bank's estimates included the value added of allresidential buildings with or without permits regard-less of whether or not the construction was completedin each year, the U.N.-s estimates only countedauthorized constructions that were completed in eachyear.
Source: U.N. Yearbook of Construction Statistics, 1978-1979.This includes Dominican Republic, Guatemala, Honduras,Nicaragua, Panama, Brazil, Chile, Colombia, Ecuador,Venezuela, Costa Rica. Other Latin American countrieshave been left out for lack of comparable data.

-45-
The housing market reflects a dualism in which relatively
high standard housing, usually subsidized, is provided for middle class
families, but with public housing programs almost ignoring the needs
of the poorest 50 percent of the population.
In 1976 over 40 percent of the population of El Salvador
lived in urban areas, and the San Salvador Metropolitan Area (SSMA)
had more than 720,000 inhabitants or about 18 percent of the country's
total population. Another 12 percent lived in the four largest secondary
cities: Santa Ana (166,000); San Miguel (128,000), Sonsonate (102,000)
and Usulutan (95,000).
Public and private housing production in towns and cities
averaged only 2,600 units per year during 1960-1970, while 10,000
new households were formed annually in urban areas. This means a
deficit of approximately 7,400 units per year. In 1972, census figures
registered the urban housing stock at about 270,000 units, nearly two
thirds of which were in the five largest cities. Homes needing improve-
ment or replacement were estimated at 147,000 or about 55 percent of the
existing stock. About two thirds of these units were occupied by house-
holds earning less than the equivalent of US$100 per month. Although
most urban homes (84 percent in 1975) had electricity, 69 percent lacked
individual water supply and 62 percent lacked sewerage connections. In
addition, low quality materials and poor construction methods contributed
to the rapid physical deterioration of the housing stock.

-46-
Public Policies with Regard to Urban Land, Services and Housing 1/
Since 1950, four major housing programs including the FSDVM's
program, have been launched in El Salvador, plus a series of infrastructure
programs. Like most Latin American countries, El Salvador began to
devise national development plans around 1965.
Although it has taken 25 years to define a coherent housing
policy, government agencies, acting fairly autonomously, were able
to promote, finance and produce more than 55,000 housing units, of which
almost 20,000 were built between 1971 and 1975.
The first of these agencies was the Urban Housing Institute
(IVU), established in 1950. It was most active in the 1960s, when,
like other similar Latin American institutions, financed primarily by
housing loans from the Inter-American Development Bank, it launched a
large-scale program for the construction of conventional mass-produced
one-family units and four-floor, multi-family apartment buildings, which
were accessible to middle-income groups. By 1978 IVU had built more
than 23,000 units in its 28 years of existence, with dírect financing
from the central government. IVU is an autonomous agency, with a director
appointed by the President of the Republic. Its organizational growth
has been disproportionate to its output, and it has become too bureaucratic.
Although it has carried out several interesting pilot projects, they have
not been made part of its regular operations, and the bulk of its convent-
ional housing construction has been for middle income groups.
1/ This section is based on material prepared by Mauricio Silva, whichis a summary of the article "Housing built by mutual help andprogressive development: to what end?" by Maurico Silva andAlberto Harth-Deneke in "Self-Help: A Critique" Alexander Press,London 1979.

-47-
The second government agency was the National Housing Finance
Agency (FNV), established in 1965 under the auspices of the Alliance
for Progress as a means of channeling private savings toward housing
construction through the establishment of savings and loan associations.
In 13 years this organization had financed 26,600 units at an average
unit cost in 1978 of US$20,000. Most of these were completed one-family
dwellings in fully-serviced housing developments in the metropolitan area
of San Salvador. Since FNV was set up to mobilize private savings through
profit-making associations and the housing industry, the beneficiaries of
their program were in practice families from the top 30 percent of the
population. By 1978 it was financing condominium apartments costing up to
US$48,000 per unit.
The third important government housing agency, the Social
Housing Fund (FSV) was established in 1973, modelled after the examples
of Mexico and Brazil in the form of a payroll tax earmarked for housing.
The FSV was set up as an extension of El Salvador-s Social Security
program, with a view to promoting housing for heads of household covered
by the system, who were for the most part earning less than US$280 per
month. During the first four years of its existence, the FSV financed
5,000 dwellings, mainly conventional one-family units. Its source of
funds makes it financially the most stable and solid housing institution
in the country. Most of its early units, which cost between US$4,000 and
US$6,000 were accessible to only the wealthiest 30 percent in the social
security system. In early 1978 FSV announced that it was going to double
its ceiling prices and introduce a new long-term financing system, which

-48-
included variable interest rates and terms and a scheme for variable
monthly payments which, capitalizing on inflation, started out low and
increased every two years.
Although urban infrastructure and services have become available
with increasing efficiency to the upper and upper-middle income sectors,
many urban households still do not have basic urban services. According
to the 1971 Housing Census, for example, one-fourth of urban households
did not have access to either electricity or piped water in their
dwellings, regardless of whether it was private or shared, and only half
of urban dwellings had a toilet. Most of the public service institutions
face serious financial and administrative problems, which together with
the tendency to gear their services toward the privileged few, result in
a serious shortage of such services among lower income groups.
Nevertheless, the aspect most overlooked by the government
has perhaps been urban land policy. Although it is obvious that formal
housing programs cannot be implemented without converting land from
rural to urban, and that formal infrastructure programs require dramatic
changes in the potential future use of non-urban land, to date the
government has had no specific and effective policy for urban land per se.
If there were an abundance of potential urban land the absence of such a
policy would perhaps be understandable. However, in the context of El
Salvador, this omission has created major problems in the implementation
of national housing plans and for the future growth and costs in the
so-called informal sectors.

-49-
The scarcity of land in Salvadorean cities is aggravated
by several natural and man-made constraints. For example, the cities
are for the most part located in highly productive agricultural valleys
(coffee, cotton, sugar-cane, etc.) where there is little unused land. In
addition, the rugged terrain, which is a legacy of El Salvador's recent
geological origin, also makes land development very costly. Land tenure
has been highly concentrated and despite land scarcity large amounts of
potential urban land have not been developed although they lie near urban
infrastructure. This policy of large landowners holding land for speculation,
together with the total lack of coordination and planning by various
agencies involved in the urban land market, has hampered formal housing
programs and thwarted urban and regional planning. Furthermore, because
appropriate legislation is lacking, the State has not been able to
recover its investments in urban infrastructure; rather, these have often
boosted speculation and the concentration of wealth.
The Informal Housing Market 1/ It is estimated that between
50 and 75 percent of the population in most Salvadorean cities live in
houses which have been built in contravention of one or more planning
laws. In the case of San Salvador in 1977 a little over half of the
population lived in what has been defined as informal or popular housing.
The three main types of informal housing in the capital as in other
cities are: squatter settlements (tugurios), extralegal subdivisions
(colonias ilegales) and tenements (mesones) which together house close to
1/ Much of this section is taken from Daniel Ernst, "The Informal HousingMarket in San Salvador," DEDRB, Draft, 1979.

-50-
three quarters of the total population. Population growth in these areas
exceeds those of the city as a whole reaching 15-20 percent per year in
certain locations.
`Tugurios" are shantytowns which have been built in areas
not usable for other construction including ravines, steep hill sides
and railroad right-of-ways. These areas are usually locáted near centers
of high employment.
In 1977, it was estimated that 388,000 people or 4.8 percent of
San Salvador's total population lived in approximately 8,060 units in
squatter settlements. No shantytown in San Salvador has more than 1,000
families and most have less than 100. According to EDURES, the number of
families living in tugurios will increase by 98 percent between 1976 and
1987. In the provisional tugurios there is usually no water supply or
sanitary services. In the well-established communities, conditions are
generally better. Water is usually available from public taps or private
individuals who sell water. In many of these tugurios, the Government
has constructed communal latrines.
"Mesones" generally consist of 5-50 rooms clustered around
one or more central patios. In most cases a family rents a single
room and has to share water and sanitary services with other families.
They are usually located in the center of the city near major areas
of industry. In 1977, it was estimated that 184,910 people, or 23.4
percent of the San Salvador's total population lived in mesones numbering
about 48,660 units. In most mesones residents receive water and electricity
for no payment beyond their monthly rent. Access to water is usually
-51-
controlled by the manager and can be as little as two hours a day. The
number of inhabitants per toilet and shower averages 15 to 16 persons,
respectively. Electricity is more readily available in most tenements.
Mesones provide homes to many of the city's poor. Eighty percent of the
tenants had incomes between the l7th and 39th percentiles of the city's
income distribution in 1975.
"Colonias Ilegales" consist of land subdivided for sale
as housing without the installation of basic services. These sub-
divisions may be considered extralegal for either of two reasons.
First, because they lack basic services, colonias ilegales cannot be
approved by the Department of Urbanism and Architecture (DUA), a pre-
requisite to legal recognition of urban housing developments. Second,
colonias ilegales frequently resort to the use of rental with promise of
sale that is prohibited by the Commerce Act. Under this system families
pay monthly installments for five to fifteen years before getting title.
In 1977, colonias ilegales housed 20.5 percent of San Salvador's total
population, numbering about 27,670 units. EDURES estimated that the
number of households residing in colonias will increase by 160 percent
between 1976 and 1987. The lot size of colonias ilegales ranges from 80 to
200 square meters and the size of the dwellings constructed on these lots
ranges between 25 to 60 square meters. The construction varies from the
traditional "baharaque" method at one extreme, to concrete and brick
homes with asbestos and cement roofs at the other. Eighty five percent
of the homes in colonias were built by their present owners. Settlement-
wide averages of total construction costs ranged from $100 to $2,470
in 1975. Lack of adequate utilities is the main drawback to residents in

-52-
colonias ilegales. The majority of colonia inhabitants buy their water
from water trucks while some sink their own well or draw water from
public taps located outside their subdivision. Electricity is more
readily available as the city s private power company is allowed to
supply electricity to colonias. Transportation within subdivisions is
usually a problem.
4. The Objectives of the First World Bank Loan for the El SalvadorSites and Services Project
The El Salvador sites and services project was one of the
first shelter projects to be appraised by the World Bank. The Appraisal
Report, published in 1974 otressed the existence of a large and increasing
housing deficit (see Section 3 of this chapter) which the small and
fairly costly government housing programs were not able to resolve either
numerically or in terms of providing units which were economically
accessible to the urban poor. Given this increasing deficit and the
inability of existing programs to generate sufficient new units or to
produce them at a price affordable to the low-income population, the
project objectives were defined as follows:
"The objectives of the project are to: (i) demonstrate that
a site and service program with partially built units is a practical
alternative to conventional fully built Government housing programs,
the costs of which have been beyond the means of nearly 60 percent of
urban households; (ii) ease the severe shortage of low-cost urban
shelter by providing units affordable to families earning US$40-120 per

-53-
month, reaching down to the l7th percentile of the urban income distribution
scale; (iii) demonstrate the potential role of the private sector in
providing self-financing, low-income housing, thereby easing the burden
on Government resources; (iv) encourage provision of adequate community
facilities and effective community development programs as an integral
part of low-cost housing; and (v) generate employment through labor
intensive construction methods and organization of small commercial
ventures.
These objectives were to be achieved by a project, implemented
through the Fundacion Salvadorena de Desarrollo y Vivienda Minima
(FSDVM), which would consist of the following components:
(a) Serviced lots: Approximately 7000 lots serviced with water,
sewerage, storm water drainage, unpaved streets, footpaths
and optional electricity;
(b) Core units: Approximately 7000 sanitary units and 3500 basic
dwellings;
(c) Off-site infrastructure: Water distribution and sewer mains,
upgrading of access roads;
(d) Construction materials: Financing for a materials fund
designed to induce self-help extension of core units;
(e) Community facilities: Construction and equipping of 5
health clinics, 10 multipurpose community centers, 26
sportfields, and 12 markets. The Bank's second education
project will finance 6 basic schools on project sites;
(f) Small industries loans: Provisions of a pilot loan fund for
small industries developed by FSDVM; and
-54-
(g) Training and technical assistance: Short-term technical
assistance and training for FSDVM staff, and studies on
Urban Land Use/Squatter Upgrading, the structure of mortgage
interest rates in El Salvador and an evaluation of the socio-
economic effects of the project. The studies will be under-
taken by CONAPLAN, and will include project preparation for
future serviced site and squatter upgrading schemes.
It was emphasized that the project was not intended to completely
cover the housing deficit but to serve as a demonstration project showing
that the site and services approach is effective and replicable. It was
estimated that the project would meet the demand of about one third of
new household formation within the target group income limits.
Project Benefits
In the economic justification it was expected that the project
would produce the following benefits:
(a) Improved living conditions and community services for 7000
households;
(b) Increased output in the constructíon industries and employment
for project households through mutual-help and self-help
construction techniques, including increased earnings from
various commercial cooperatives organized through the project;
(c) The demonstration of an approach to housing problems which
could enable Government to keep pace with housing needs through-
out the country;

-55-
(d) A significant expansion in the construction capacity of the
private sector for very low-cost housing; and
(e) Improvements in government planning for low-income illegal
settlements.
A number of positive externalities were also anticipated, particularly:
(f) It was estimated that the project would have a substantial
redistributive effect in providing low-cost, serviced shelter
units to low-income households who are currently paying
excessive prices for unserviced subdivisions of land;
(g) Net external economies were also projected in that planned
housing/community development projects will enable the authorities
to reduce uncontrolled urban growth and the study component in
particular will help the Government's urban planning functions;
(h) People other than project participants will benefit from the
off-site infrastructure;
(i) The self-help/mutual-help training will improve the chances of
the urban poor in finding stable employment; and
(j) In general there will be an increase in the quality of life of
project households.
When all of the estimated project costs and benefits were discounted over
a 30 year period an internal rate of return of 20 percent was estimated
for the total project.

-56-
CHAPTER 2
THE FUNDACION SALVADORENA DE DESARROLLO YVIVIENDA MINIMA (FSDVM) 1/
The purpose of this chapter is to explain the philosophy and
work methods of the FSDVM, the executing agency for the project. The
FSDVM is unique in that it is the only private organization to date which
has been directly responsible for the implementation of a World Bank
financed urban shelter program, and for this reason a brief description of
the FSDVM seems useful.
The FSDVM began work on a small scale in 1968 to rehouse 30
families who lost their houses in a flood in San Salvador. On the basis
of the successful results of this first experience, the FSDVM was formally
registered as a private non-profit organization in 1970. Work was then
begun on a number of small projects and later a larger project involving
approximately 500 families. The success of these intitial projects attracted
the interest and support of a number of international organizations including
the Inter-American Foundation which provided the first substantial
external funding. By the time discussions began between the World Bank,
the Government of El Salvador and the FSDVM in 1972, the organization had
already built up a solid base of experience with small projects.
From its inception the FSDVM had placed high priority on the
use of housing as a medium for producing more general social and economic
changes in the condition of the urban poor, and had developed a methodology
1/ This chapter is based upon a report prepared by Mauricio Silva, the formerGeneral Manager of the FSDVM.

-57-
which required an intensive contact with the participating communities.
One of the questions which was asked during the development of the Bank
project was whether the FSDVM's labor-intensive methodology would be
feasible on a larger scale. At the same time many people in the FSDVM
questioned whether the rapid increase in scale of the project might not
divert the FSDVM from its primary objective of producing qualitative
change in project participants, into simply a producer of housing units.
In the view of the FSDVM, the analysis of urban land, services
and housing policies, presented in Chapter 1, and the broader economic
context in which the FSDVM works, have made it clear that for El Salvador
the "solution" to the housing problem requires that the current economic
and political structure be modified. 1/ Any program not based on this
premise is merely a short-term stop-gap.
The FSDVM placed great emphasis on learning by doing and has
sought to constantly modify the design of its prograns on the basis of
the experience acquired. As an institution it has the advantage of
having started with small projects of less than 100 units so that the
mistakes could be experienced and corrected on a small scale before
embarking on the larger projects with which it is now engaged.
The Foundation bases its work on faith in the abilities, values
and hard work of the participating communities. It does not seek convent-
ional solutions, but rather to stimulate participation on the part of
those requiring its help.
1/ This chapter was written before the political events of 1980.

-58-
1. Main Approaches and Housing Production
FSDVM's housing programs are governed by four basic concepts
which are designed to promote beneficiary participation in community
development and to facilitate working with the neediest: progressive
development, mutual help, grass-root participation and scaling down of
conventional standards. Progressive development is the building of houses
by stages. Top priority is given to security of tenure and services and
less importance to walls and roofs, thus giving each family the opportunity
to complete their own houses at their own pace.
The primary reasons why FSDVM uses progressive development in
community construction are as follows:
(a) Scarce national resources;
(b) Instability of household income in the lowest strata, meaning
that few households will be able to regularly allocate a
substantial amount of income for housing payments;
(c) Fixed payments can be reduced to a minimum to cover only the
cost of urbanization and services. This enables the household
to take advantage of short-lived "peaks" of financial prosperity
to consolidate and expand their dwellings;
(d) Using underemployed labor, cheaper materials and lower adminis-
trative costs represents a saving to the national economy and
to the family;
(e) The high value placed by the family on a dwelling that it built
itself. This is also important in ensuring project maintenance
and cost recovery.
Mutual help is defined as families working together as a team
in house construction. This sytem is used because:

-59-
(a) It forms the social and organizational basis of future community
development programs;
(b) It replaces a narrow self-interest of the family with a
broader sense of community;
(c) It is more efficient to work in groups of 20 than individually;
(d) It enables the families to get to know each other and interact
even before they move into their houses;
(e) It replaces the customary downpayment (10 to 20% of total cost
in most programs) which is a barrier to ownership by the lowest
income groups.
Grass-roots participation is the active and organized participation
of the beneficiary in the solving of his own problems. It should be
noted here that community participation still has relevance for a program
whose sole goal is to provide housing, since:
(a) It creates an organizational structure and momentum which
continues after the dwellings are occupied. This can later on
facilitate the completion of community works such as the paving
of streets, construction of community buildings, and obtaining
or providing through the community½s own resources of services
such as garbage collection, telephone hookups and public lighting;
(b) It provides the basis for broad-based community education
in responsibility, coordination, social participation and the
like, which will do much to remove social apathy while improving
the local environment in the process;
(c) It promotes and develops the community½s capacity for self-
management;

-60-
(d) It permits the implementation of projects which would otherwise be
impossible, such as the rehabilitation or relocation of settlements.
Using these concepts, since its founding a decade ago FSDVM has
helped to provide a total of 4500 housing units in 8 settlements,
while 12,500 more are under construction or planned for a total of 17,000
units since 1970. Current production averages 2,000 units per year.
The average unit price of all core units is approximately
US$1,500 including land and administrative costs. 1/ Very different
types of housing units have been designed for those prices, including
serviced lots with no construction, complete sanitary core, sanitary core
and 18 m2 of living area, and serviced lots with 36 m2 of living area.
Each lot has its own sewerage, potable water, drainage and electricity
hookups, and measures 60 to 90 m2.
Initially the communities are provided with a main street for
vehicle traffic and an internal network of pedestrian footpaths, mini-parks
and areas for future community services. Schools and health clinics are
built by the appropriate national ministries, while sanitation equipment,
maintenance of the road system and areas for parks and public lighting
are theoretically the responsibily of the municipalities. Transportation
and electricity are provided by private enterprises.
To date the main sources of finance for the housing program
have been the World Bank, local loans for the purchase of land, and
contributions by participants through their work in mutual help and their
labor and materials for progressive development. Credits are extended to
1/ This does not include money invested by the family in progressivedevelopment.
-61-
families at 6 percent annual interest for 20 years. The repayments made
by participants cover all project costs including administration, collection,
insurance, etc. Cost recovery is important because the goal is to make
these projects replicable on a national scale.
In order to arrive at the monthly payments, pre-costing sheets
are prepared, the last of which is drawn up just before they are shown
to the beneficiaries, i.e. shortly before the mutual help begins.
This includes all direct project costs such as land, infrastructure,
housing construction, design and supervision (calculated on the basis of
fixed costs per unit), financial costs during construction, taxes, and
a percentage for contingencies. All indirect costs are also included:
namely interest, maintenance for the first 10 years of civil responsibility
(charged on the basis of 1 percent of the value of the superstructure),
collection fees, costs incurred by delays in payment of monthly installments
or arrears (calculated on the basis of one-fourth of 1 percent per annum
over 20 years); and insurance against damage to the superstructure by
natural causes (not against death of the beneficiary, since this is
considered an unaffordable luxury) which costs about 3 percent of the
value of the superstructure for 20 years.
In order to arrive at unit costs, the cost per improved m2 for
each type of unit is calculated. The cost of labor contributed during
mutual help is considered the down payment on the dwelling. Monthly
installments are reviewed periodicallly for purposes of new plot allocations.
Various programs of cross-subsidies have been tried, whereby
higher income families would subsidize those with lower incomes through
a higher monthly payment: better located lots would cost more, and so

-62-
would more completed dwellings, thereby generating profits. The first
schemes were not successful since even the wealthier families in the
projects were too poor to be able to afford substantially higher prices.
The only subsidy program that has been effective is the direct
subsidizing, through a grant obtained by the Foundation, of the monthly
payment for the poorest families in the project. This subsidy, given to
the family and not to the housing unit, is renewed yearly depending on
the family's economic situation. However, this was only ever done on a
very limited scale and in only a few projects.
The legal instrument through which FSDVM gives tenure ís an
individual lease/purchase agreement. The property is transferred
upon the payment of the last installment, which cannot be made before
five years, so as to ensure community stability and prevent speculation.
After that period, the property may be transferred, with prior approval
of the community organization.
Although this limits the freedom of the participants, the
Foundation uses this type of tenure because it gives greater control
over the property and greater flexibility of action in the event of
withdrawals and new awards.
2. Methodology and Execution Timetable
The construction of a new community by the FSDVM begins with the
selection of land. Once its purchase is assured, a land survey is made.
The design of a site and service project cannot be considered in the
same light as a conventional housing development. Close attention
is given to grading and the attempt is made to minimize cut and fill
operations and adapt the slope of piping to that of the original land.

-63-
The design scale tries to give greater priority to man than to vehicles.
Details require close scrutiny, since in a dwelling costing US$2,000,
US$20 is already 1 percent of the total value.
The standards and norms used in the project must be designed to a
lower level and cost, since existing standards are generally too high,
having been prepared for another type of housing project. The width of
streets and pedestrian footpaths, the percentage of area given to parking,
the separation between dwellings, lot dimensions, percentages for vehicular
access, and the standards and details for the laying of pipes, all need
to be reviewed with regard to their financial feasibility and suitability
for prevailing conditions. 1/ The necessary soil and hydrogeological
studies go hand in hand with the design.
Frequently a study is conducted to determine the potential
demand for the project and to ascertain the preference of beneficiaries
for certain types of housing, and the willingness to participate in
mutual help construction. Such a study is indicated particularly in the
case of large-scale projects in which for the first time certain concepts
are being introduced, such as progressive development, mutual help,
unsubsidized projects, and projects located in the urban periphery. 2/
After the design is completed, the next step is to prepare
specifications, bidder prequalifications and invitations to tender.
Because of the context in which FSDVM works, the nature of the institution,
1/ For greater detail on standards and details used by FSDVM, seeChapter 8 of this publication and FSDVM-OAS, "Evaluacion deProyectos Habitacionales en El Salvador" (Evaluation of HousingProjects in El Salvador), Vols. I and II, San Salvador, 1978/1979.
2/ FSDVM has carried out several such demand studies, some of which havebeen published, e.g., see FSDVM, "Caracteristicas del Acceso de losPobres a Vivienda Popular", (Access to Low-Cost Housing by the Needy)(Demand study in Apopa), San Salvador, 1979.

-64-
and the specialized character of certain tasks, the FSDVM directly
designs and supervises project construction. Earthworks, infrastructure
works and some house construction are executed by contractors. One of
the most difficult decisions is to determine how much and which works to
carry out by each of the three possible construction methods (contractor,
mutual help or self-help).
Mutual help construction of the basic core unit is followed
by a self-help phase. This is the completion of the unit over time by
the beneficiary with his own resources. This can be done using his
own labor, paid labor or a combination of the two. Materials loans are
provided since these are much easier to control than cash loans and
because they ensure the investment will be used in the construction of
the unit. To avoid administrative complications, materials loans are
limited to basic items for the construction of the dwelling, such as
brick, gravel, sand, sheet metal for roofing and cement.
FSDVM has used two methods for materials supply. The first
involves giving families purchase orders to suppliers with which it has
credit, while the second uses direct supply to warehouses at the worksite.
The first method has the advantage of being simpler for the FSDVM to
administer, but is more complicated for the beneficiary, who has to
assume responsibility for transportation and agreements with the supplier.
Loans in materials are arranged separately, with terms ranging from 3 to
10 years and interest rates ranging from 8 to 12 percent.
After the construction contracts have been awarded and there
is a fairly clear idea of costs, the first estimates of monthly payments

-65-
are made. Project publicity is directed to the poor low-income neighbor-
hoods, through the means of communication most often used and understood
by them, i.e. radio, pamphlets, or direct talks.
The general criteria used by FSDVM in selection are:
- Interest in the project. Real willingness to participate,
which is vital in developing a positive attitude toward
the project, especially for working in groups.
- The applicant must be part of a stable family group,
regardless of its legal or religious status.
- One of the members of the household must be willing to
participate in mutual help.
- Monthly household income, defined as the earned income of
the spouses, must not exceed US$260 or be less than
US$140. These limits depend on the type of unit, project
and year.
- Residence of more than two years in the city.
- No ownership of any real estate.
After selection has been made participants are divided into
groups of 20-30 families for mutual help construction. Participants are
divided as equitably as possible in terms of sex of head of family,
occupation, household size, etc.
To carry out the publicity campaign about the project, selection
and mutual help, a team of social workers (promotores sociales) composed
of a coordinator and a social worker for every 150-175 families, is
formed for each project. The necessary technical and organizational

-66-
assistance for mutual help is provided by a team consisting of a part-time
engineer or architect, a construction technician for every 500 families
and a foreman for every 150-175 families. Liaison and coordination
between these two teams is achieved through weekly meetings coordinated
by the heads of the respective departments.
After the mutual help groups (made up of families who will live
in a given block or section and will be future neighboors) have been set
up, the participants attend a series of meetings designed to inform and
prepare them for the mutual help tasks. The first and last sessions are
handled by the social workers who speak about FSDVM and the project, the
participants rights and obligations, and the need for responsible
community work. They explain the detaíls of group organization, requesting
the groups to appoint a president, a warehouse watchman, and a treasurer,
and to sign the mutual help agreement. The second session is given by
the technical department and goes into details on the physical aspects of
the project and the general organization of mutual help. The third
meeting is sponsored by the Finance Division and deals with the costs and
monthly payments. This series of meetings, which is held before any
formal commitment is made, is extremely important, since correct information
will be the cornerstone for future good relations between the participants
and FSDVM and among the participants themselves.
The end of this series of meetings coincides with the completion
of the contracted works, so as to avoid problems of coordination and
interference and to permit free circulation at the site.
The mutual-help works are carried out only on weekends, in
order to minimize interference with the participants regular jobs. Work

-67-
is generally done on Saturdays from 2 to 5 p.m. and Sundays from 8 a.m.
to 2 p.m. During evenings or after the mutual-help activities, groups
meet to discuss construction and future community problems, thus beginning
to generate a community dynamic. The works carried out by mutual help
should be relatively simple and not require a great deal of machinery.
Nor should they be overly time-consuming, which could frustrate the
participants. In FSDVM½s experience, six to eight months of weekend
labor is the ideal period for mutual help. Grading and the laying of
pipes and foundations are not recommended for this process, which is more
suited to works such as installing roofs, sanitary installations and
floors and raising walls.
Each group has the right to withdraw a list of materials,
previously established by the Mutual Help Department, from the central
warehouse, which is owned and administered by FSDVM. Once the group
has taken these materials to its own warehouse (which is built in advance),
they are the exclusive responsibility of the group. The group is therefore
responsible for administering its warehouse, maintaining discipline among
its members, ruling on absences from work days, drop-outs and expulsions,
and construction problems. The members thus begin to participate actively
in decision-making, to become more aware of the need to work collectively
and in an organized manner vis-a-vis a society that has largely ignored
them, and to renew faith in themselves. Although this is only the beginning,
they begin to replace vertical authority structures with horizontal
cooperative relations.
The community organization, which goes hand in hand with group
organization, is composed of the presidents and representatives of each

-68-
section, and handles the problems at that level. The first problems that
the community generally faces are related to the executing agency. These
may be caused by misunderstandings on the part of the participants or
errors or oversights by the agency or by other institutions or contractors,
for which the agency is answerable to the participants. In these first
contacts with the community group, FSDVM should be open to dialogue
without becoming paternalistic, in order to foster the self-confidence so
vital to future community development.
After the mutual help is finished the lots are awarded.
Up to this point each of the participants knew that he was going to
be awarded one of the units that this group had been working on, but
not which one. The awards, except in special cases such as larger or
corner lots, which are decided by the group beforehand, are made by a
lottery, which is the occasion for a big celebration marking the birth of
the settlement.

-69-
PART II - EVALUATION OF PROJECT EFFECTIVENESS
CHAPTER 3
COMPARISON OF PHYSICAL OBJECTIVES AND ACHIEVEMENTS
Chapter 1 (Section 2) outlined the main objectives of the
First Urban Project. Part II of the report, of which this is the first
chapter, will discuss the various aspects of project implementation
and effectiveness. This chapter will be restricted to a general review
of the progress of physical implementation.
Table 3.1 sunmmarizes some of the major physical objectives
of the project, and for each one indicates whether implementation was
the responsibility of the FSDVM or a different government agency. The
main responsibility of the FSDVM was the construction of 6594 dwelling
units. 1/ Originally the project was scheduled for completion in 1978
but a number of delays occurred. By June 1980 4348 of the units had
been built and of these 3640 were occupied. Work was in progress on
the other 2246 units. The major reasons for implementation delays
were related to problems of land acquisition, particularly in the
Metropolitan Area. The scarcity of land, the absence of any national
land use policies, and the increasing land speculation, 2/ combined to
produce a delay of almost three years in land acquisition. All of the
land required for the first and second projects was obtained in 1978
and implementation has since continued at a relatively smooth rate.
1/ The original number of units was 7,000 but due to the inter-change of various sub-projects between the First and SecondUrban Projects, the figure has been adjusted slightly downwards.
2/ See Chapter 1, Section 3.

-70-
A second problem which affected implementation of the last
two project sites has been the very rapid cost escalation over the
past two years. It had been estimated that inflation during the
implementation phase would run at about 4 percent per annum, but
in fact for the construction industry the figure has been closer to
20 percent. This has been aggravated by the previously mentioned
three year delay in land acquisition which has meant that materials
and labor have been paid for three years later than anticipated
and hence at much higher prices. These factors have combined
to produce an increase of about 35 percent in the costs of the
final two projects as compared with the original estimates.
Table 3.1 also shows that the FSDVM was responsible for
the construction of a contingency well, 5 storm drains for
discharge into the river, a market and 8 foot pathways. The
well is under construction, 4 out of 5 storm drains have been
completed, and 5 out of the 8 foot pathways are completed. It
was decided not to procede with the market as subsequent
experience and discussions with the community questioned whether
there was in fact a need.
It can be seen that although there have been delays
(for reasons largely outside the control of the FSDVM), by 1981
virtually all of the physical implementation objectives will have
been achieved.
Table 3.1 also indicates the main services to be provided
by other government agencies. The main short-falls are in the
construction of schools and community centers, as well as one clinic.

Table 3.1: COMPARISON OF OBJECTIVES AND ACRIEVEMENTS OF PHYSICAL DIPLEMENTATION OFFIRST EL SALVADOR URBAN PROJECT. JUNE 1980.
Responsibility of the FSDVM Responsibility of Other AgencyIn In
Component Target Completed Progress Target Completed Progress
Dwelling Units 6594 1/ 4348 built 22463640 occupied
Infrastructure
Trunk water supply 6 5Sewage collection 2 1Contigency wells 1 1Sewage outfall 5 4Storm drain fordirect dischargeinto river 5 4
Schools 7 3Clinics 2 1Community centers 10 2 2Idarket 1Foot pathways 8 5
1/ Original objective was 7000 units but due to switching of subprojects between the firstand second loans the estimates were revised downwards.
Source: FSDVM 22nd report on progress of the First world Bank Loan. July 1980.

-72-
CHIAPTER 4
PROJECT IMPACT ON THE QUALITY AND VALUE OF HOUSING
1. Methodology 1/
In most studies of housing, market rent is used as the principal
indicator of the quality or value of housing. It is assumed that in a well
functioning housing market, improvements in quality will be reflected in
families willingness to pay higher rents. When allowance is made for
inflation and other outside factors, it is assumed that the changes in
the average rent provide a good indicator of changes in value.
The present study, like many similar studies in developing
countries, is faced with the problem that one cannot assume the exist-
ence of a well functioning housing market. In many projects the ability
of the family to rent or sell is severely constrained whilst in other
sectors of the housing market there may also be rent control or similar
restrictions. Even when certain sectors of the market do operate
relatively freely, it is often very difficult to obtain reliable information
on rental or sale prices. This becomes even more problematic when we
wish to compare changes over time.
In the present study the approach has been to develop three
independent sets of indicators which will be used to measure changes. The
indicators which are shown in Figure 4.1 are:
a. The quality of materials, services and neighborhood character-istics and the way they are maintained:
This is based on a subjective evaluation by theresearcher of the quality and maintenance of each typeof material and service. Various techniques are thenused to reduce the information to one or a small numberof indices.
1/ See Annex 1 for explanation on the methodology.

-73-
b. Family satisfaction wíth different aspects of the dwelling unit:
The information is derived from the application of a simpleattitude scale.
c. The value of the house:
Three estimates are used. The first, which probably givesa low estimate of value, is the calculation of the cost ofconstruction or purchase of the house. The second, whichprobably provides a higher limit, is the family s estimateof the rental or sale value of their property. The third,is based upon the estimation of hedonic price indices foreach component of the house and neighborhood attributes(which are assumed to affect the value of the house).
Changes in value and quality were estimated in two ways. First,
information was obtained through the longitudinal studies for 1976, 1979
and 1980. For the control group changes in each indicator were measured
for the same house. For participants the comparison was between the
attributes of the house in which they were living before moving to the
project, and the new project house in which they were living in 1980.
Second, cross-sectional studies were conducted to compare the quality
and value of different types of houses in 1980. If the control group was
well selected (Annex 1 shows that in general it was) then the conditions
of the control houses in 1980 can serve as an indicator of the type of
housing in which the participants would now be living if there had not
been a project.
Data was obtained from FSDVM projects in both Santa Ana and
Sonsonate. To simplify the presentation, only the results from Santa
Ana are presented, but the text indicates and discusses those cases
in which the results from Sonsonate are significantly different.

- 74 -
FIGURE 4.1: INDICATORS OF HOUSING QUALITY AND VALUE
Type of Indicator Specific Indicator How measured
HOUSING QUALITY Quality of roof Classification of materials ona 3 point quality scale
Quality of walls "Quality of floor "Quality of water supplyQuality of sanitationQuality of electricityInterior area Interval scaleNumber of rooms Interval scaleCrowding M2 per person; persons/room
Toilet crowding Families/toiletsShower crowding Families/showersCleanliness of patio 5 point scaleMaintenance of patio 5 point scaleCleanliness of streets 5 point scaleCleanliness of public areas 5 point scaleCondition of streets 5 point scaleCondition of drains 5 point scaleSocial ambience 5 point scaleSecurity 5 point scale
FAMILY SATISFACTION Lot size 3 point scaleLiving area 3 point sealeMaterials 3 point scaleQuality of construction 3 point scale
HOUSING VALUE Cost of construction or purchase All costs adjusted to 1980 prices.Imputed rent Family estimate of how much their
house could rent for.Imputed sales value Family estimate of how much their
house could sell for.Imputed hedonic price Application of hedonic coefficients
derived from mesones, to theattributes of FSDVM unit. *
Increase in family utility Calculation of GCES utilityfunetion. *
Imputed market value of each Estimation of hedonic pricecomponent of the housing coefficients. *package.
* Only computed for FSDVM project.

-75-
2. Plousing Quality
2.1 Housing quality in Santa Ana 1976 (when the project began)
Although the discusslon in this chapter is based Qn Santa
Ana, similar information is available from a longitudinal study in
Sonsonate and descriptive cross-sectional studies have been reported for
San Salvador (Ernst) 1/ and San Salvador, Sonsonate and San Miguel
(FSDVM) 2/.
In 1976 when the FSDVM was beginning its first project in
Santa Ana it was estimated that approximately 12,600 families (65,000
people) lived in informal housing in the city. Of these the majority
(77%) lived in tenement houses (mesones) in central areas of the City,
20% in extra-legal subdivisions (colonias ilegales) on the periphery
and 3% in squatter settlements (tugurios) on publie land mainly along
the ralíroad track. Between them these 3 types of Informal housing
provided shelter for about 67 percent of the total city population.
Table 4.1 summarizes the main characteristics of each of
these types of settlement in terms of the quality of materials and
services. The meson is normally relatively well built although the
walls which are often built of mud on a bamboo franie or of mud bricks,
may have deteriorated. Nearly ah rooms have electric hight and piped
water supply although the water is always communal. The supply of water
tends to be limited by the mesonera (superintendent) and in some cases
the water may only be turned on for as little as 2 hours per day. 31 The
1/ Daniel Ernst. "The Informal Housing Market in San Salvador",DEDRB, 1979.
2/ FSDVM "La Vivienda Popular en El Salvador"3/ A detailed description of a meson is given in Aida Herrera and
Martin Baro. "Law and Order in a meson in San Salvador". El Salvador,October 1980. See also Chapter 5 of this report.

-76-
other main draw-back of the meson is that the communal toilets are
often not well maintained and are dirty and a major source of disease.
The colonias ilegales have varied construction quality,
ranging from temporary shelters of mud and zinc, to solidly built
two storey brick houses. In addition many of the houses sampled
are still in the process of being built. Although almost half of
the houses now have individual water connections, water is a major
problem (and expense) for the other families as it will usually have
to be bought and often carried a considerable distance. In most cases
the family will have an individual pit latrine, which is more hygenic
than the meson as it is not shared with other families. About one
third of houses only have dirt floors which reflects in part the
relatively low-priority many families seem to place on a solid floor.
In the tugurios the quality of housing is inferior to the
meson and colonia ilegal in most respects. At least half of the
houses are constructed of scrap materials and virtually all have
dirt floors. Water is bought or obtained from wells and a high
proportion (40%) obtain it from rivers or other contaminated
sources. Almost 80% of families have no toilet and use communal pit
latrines or open spaces.
Table 4.1 also gives a summary score for each settlement on
each attribute. Giving scores of 2, 1 and 0 for ratings of good,
average and bad respectively, it is possible to derive a score with
a maximum of 100 points and a minimum of 0. The scores must be
interpreted with caution as the components are measured on ordinal
and not interval scales.

-77-
Table 4.1: MAIN CHARACTERISTICS OF LOW-INCOME HOUSING IN SANTA ANA 1976AND THEIR RATING ON A SCALE OF QUALITY
ColoniaAttribute Rating Description Meson Ilegal Tugurio
ROOF Good Asbestos sheets orcement tiles 97.2 79.1 *6.2
Average Metal Sheete 1.9 17.4 43.3
Bad Cardboard, scrapmaterial or straw 0.9 3.5 50.5
Summary Seore * 98 88 28
EXTERIOR Good Bricks and concreteWALLS or concrete 5.8 59.3 0.0
Average Mud on bamboo frame,earth bricks, woodor metal sheets 90.4 38.1 33.7
Bad Scrap material, strawor palm 3.8 2.7 66.3
Summary Score * 51 79 17
FLOOR Good Cement bricks 59.0 44.7 0.0
Average Earth brickz or wood 34.3 23.7 1.0
Bad Earth 6.7 31.6 99.0
Summary Score 76 57 1
WATER Good Individual connectionSUPPLY to public water supply 0.0 45.2 3.9
Average Communal connection topublic supply, wellwater or purchasefrom a truck 100 0 40.9 55.3
Bad River water or othercontaminated source 0.0 13.9 40.8
Summary Score * 50 66 32
SANITATION Good Individual connectionto public sewer 1.8 15.0 0.0
Average Communal toiletconnected to sewer, orprivate pit latrine 68.2 69.9 16.5
Bad Communal pit latrineor open ait 30.0 15.0 83.5
Summary Score * 36 50 9
LIGHT Good Electricity 86.1 79.3 2.0
Average Gas or oil 11.1 15.5 78.4
Bad Candles 2.8 5.2 19.6
Summary Score * 92 87 42* In calculating the summary score, the category "Bad" is given a score of
0, the category "average" a score of 1, and the category "good" a scoreof 2. The frequences in each category are multiplied by the score andthe total divided by 2. This creates a scale with a maximum value of100 and a minimum of 0.
SOURCE: FSDVM Socio-Economic Study of Santa Ana. 1976. Conducted by theUnidad de Evaluacion of the FSDVM and analyzed in cooperation withthe Urbán and Regional Economics Division of the World Bank.

-78-
The table shows that whilst the meson and colonia ilegal
tend to be at somewhat the same quality level, the tugurio is at a
significantly lower level on all variables.
Over 80 percent of project participants were living in mesones
before they entered the project. Table 4.2 presents a comparison of the
condition in 1976 of mesones in which participants and the control group
lived. An individual component by component analysis shows there is
almost no difference between the two groups. In order to permit a more
rigorous overall comparison a weighted average of all components was
computed. It is obviously not possible to simply add the individual
scores as this would give equal weight to each component, whereas one
would expect that some components are more important than others and
should have a higher weight. Weights are obtained from a Hedonic Price
Analysis conducted in Santa Ana by Quigley and Kaufmann. 1/ The analysis,
which is explained in more detail in Annex 1, estimates a price coefficent
for each component of the housing package. These coefficients can
be conceived of as giving an approximate indication of the relative
importance (value) which families attach to each component. These
coefficients can then be used as weights by which each individual
component is multiplied to provide a weighted average. 2/
1/ John Quigley, "The Distributional Consequences of Stylized HousingPrograms." Urban and Regional Report No. 80-13, Urban and RegionalEconomics Division. World Bank, August 1980.
2/ The use of this technique to generate an index of quality isvalidated by the relatively high correlation coefficients which arefound when the weighted averages are compared with estimates ofhousing value, about .60 in the case of the colonias in both SantaAna and Sonsonate. However, given a relative lack of variation inthese characteristics among project houses, the coefficient isconsiderably lower for participants, but statistically significantnevertheless (about .25). It should also be noted that in theoriginal equation, the coefficients used for weighting the abovecomponents were not all statistically signficicant at 0.05 levelalthough they all have the right sign.

-79-
Table 4.2 shows that the weighted averages of control and
participant mesones are very close, thus supporting the contention
that participants were drawn from typical mesones.
2.2 Estimating changes in housing quality of participants in Santa Ana
Table 4.3 presents participants quality scores in 1976 before
they entered the project and again in 1980 after they had been living
in the project for about two years. With the exception of the type
of floor (where many families who had previously lived in mesones with
cement floors had chosen not to cement the floor in the project house)
there were improvements on all components. The improvements were small
for roof and light, both of which are normally adequate in the meson,
and very substantial with respect to water, sanitation and walls.
From this table it is clear that participants have experienced a significant
improvement in the quality of their dwelling.
The question must now be asked whether these improvements
were unique to project participants or were similar improvements
experienced by families living in the control areas? For this purpose
we make use of the weighted averages derived from the hedonic coefficients.
It can be seen that families living in mesones have experienced virtually
no change. However, families in colonias ilegales experienced a change
of +27.9 points (compared with 56.1 for participants) and families in
tugurios experienced an increase of 36.9 points. 1/
1_ The experience in Sonsonate is somewhat different although, likeSanta Ana, the participants experienced the greatest improvementin housing quality as shown in Table 4.4. The same table showsthat in Sonsonate all the major housing groups enjoyed a varyingdegree of improvement over time, but that the partícipants experíencedthe greatest improvement of all, followed closely by the coloniadwellers. It should be noted that the participants, before movementstarted at a relatively higher level of housing quality than theControl Group and that the colonias in the same period scored lessthan mesones mainly for lack of such basic services as water andlight. Nevertheless, the participants still came out ahead of thecolonia dwellers in terms of average change.

- 80 -
Table 4.2: QUALITY OF HOUSING IN WHICH PROJECT PARTICIPANTS LIVED IN 1976 ANDITS COMPARISON WITH THE QUALITY OF MESONES IN THE CONTROL GROUP
WeightedRoof Walls Floor Water Sanitation Light Average **
Weights * 3.875 .753 1.365 2.759 3.465 2.904
All Participants 96 53 78 49 43 93 178.0
Participantsliving inmesones 99 53 80 49 45 94 182.8
Controlfamilies inmesones 98 51 76 50 36 92 175.3
* These weights are derived from the Hedonic Price Analysis conducted byJohn Quigley and Dani Kaufmann. See John M. Quigley, "The DistributionalConsequences of Stylized Housing Programs. Theory and Empirical Analysis".Urban and Regional Report No. 80-18. World Bank, August 1980.
** Each individual score is multiplied by the Hedonic Price Weights. The resultis then divided by 6 to give the average score. See Annex 1 for moredetailed explanations.
Source: FSDVM Socio-Economic Study of Santa Ana. 1976. Survey conducted bythe Unidad de Evaluacion of the FSDVM and analyzed in cooperationwith the Urban and Regional Economics Division of the World Bank.

Table 4.3: CHANGES IN HOUSING QUALITY OF PROJECT PARTICIPANTS IN SANTA ANA1976-1980 AND THEIR COMPARISON WITH CHANGES
IN CONTROL GROUP HOUSING
(In Percent)
WeightedWeighted AverageAverage 1980
Roof Walls Floor Water Sanitation Light Change Score
Weights * 3.875 .753 1.365 2.759 3.465 2.904
Participants
1976 Score 99 53 80 49 45 94
1980 Score 100 99 48 100 100 100 240.0
Change +1 +46 -32 +51 +55 +6 +57.2
Control GroupChange
Mesones +1 +4 -23 -3 +11 +3 + 2.3 177.6
Colonias +5 0 -16 +22 +24 +9 +27.9 207.1
Tugurios +20 +20 +1 +17 +25 -2 +36.9 97.6
Note: Data on participants obtained from the percentage of families whopreviously lived in mesones. There is no statistically significantdifference between their rate of change and that for all participants.
* Weights are derived in the same way as for Table 4.2.** Weighted Averages are derived in the same way as for Table 4.2.
Source: Control group data taken from Table 4.2.Participants: FSDVMI Socio-Economic Study of Santa Ana. 1976 and 1980.

Table 4.4: CHANGES IN HOUSING QUALITY OF PROJECT PARTICIPANTS IN SONSONATE1977-1980 AND THEIR COMPARISON WITH CHANGES IN CONTROL GROUP
(In Percent)
WeightedWeighted AverageAverage 1980
Roof Walls Floor Water Sanitation Light Change Change
Weights 3.875 .753 1.365 2.759 3.465 2.904
PARTICIPANTS
1977 Score 92.8 58.5 78.9 67.4 52.5 40.7 166.2
1980 Score 98.3 96.9 98.9 98.0 100.0 100.0 249.4
Change +5.5 +38.4 +20.0 +30.6 +47.5 +59.3 +83.1
CONTROL GROUP CHANGE
Ivesones +3.7 +2.6 +6.1 -8.4 +13.1 +60.6 +37.1
Colonias +10.2 +10.8 +26.2 +40.2 +3.0 +87.1 +76.3

-83-
Table 4.5 shows what would be the effect on housing quality for
families living in mesones, colonias, and tugurios in 1976 of the decision
to stay in the same house or to move to one of the other types of settlement
or to the FSDVM project. In all cases a move to the FSDVM would have
produced considerable improvement in housing quality. The move to the
colonia ilegal would also have produced improvements for all families but
of a lesser magnitude. 1/
3. Satisfaction with Housing
In the 1980 survey in Santa Ana, respondents were asked to
indicate their degree of satisfaction (satisfied, more or less satisfied,
dissatisfied) with lot size, living area, materials and quality of
construction. Table 4.6 summarizes the results of the study. Project
partícipants have the highest level of satisfaction on each of the four
items and in no case do less than 80 percent indicate they are completely
satisfied. In general it appears that families in colonias ilegales are
also satisfied with the mean of satisfaction being only slightly lower
than for the FSDVM. Families in mesones are clearly the least
satisfied with less than 30 percent completely satisfied with any of
the three items on which they were questioned. 2/
1/ An analysis of the project in Sonsonate also shows that in allcases a move to the FSDVM would have produced considerableimprovement in housing quality as shown in the same table.
2/ Meson families were not asked about lot size as this has nomeaning in their case.

Table 4.5: EFFECT ON CHANGES IN HOUSING QUALITY OF MOVING TO ALTERNATIVE TYPE OF SETTLEMENTOR STAYING IN SAME PLACE. FAMILIES LIVING IN MESONES, TUGURIOS AND
COLONIAS ILEGALES
SANTA ANA
Quality Change in 1980 by Moving to Each of the Settlement TypesSettlement in Which
Living in 1976 Meson Colonia Ilegal Tugurio FSDVM
Meson + 2.3 + 31.8 -114.6 + 57.2
Colonia - 1.6 + 27.9 - 81.6 + 60.800
Tugurio +116.9 +146.4 + 36.9 +179.3
SONSONATE
1977
Meson + 37.1 + 49.3 +101.9
Colonia + 64.2 + 76.3 +128.9

- 85 -
Table 4.6: SATISFACTION WITH LOT SIZE, LIVING AREA, MATERIALS AND QUALITY OF CONSTRUCTION.COMPARISION OF PROJECT PARTICIPANTS AND FAMILIES IN MESONES, COLONIAS
ILEGALES AND TUGURIOS. SANTA ANA. 1980
(In Percent)
Project Mesones Colonias Ilegales Tugurios
LOT SIZE Good 89.9 N/A 87.7 49.5
Average 9.2 N/A 9.6 35.9
Bad 1.0 N/A 2.6 14.6
Summary Score* 95.0 92.0 68.0
LIVING AREA Good 87.8 27.1 81.7 33.7
Average 10.2 40.2 8.7 49.0
Bad 2.0 32.7 9.6 17.3
Summary Score* 93.0 47.0 86.0 58.0
MATERIALS Good 91.8 12.1 65.2 10.6
Average 7.7 54.2 23.5 59.6
Bad 0.5 33.6 11.3 29.8
Summary Score* 96.0 39.0 77.0 41.0
QUALITY OF CONSTRUCTION Good 80.1 11.2 66.1 8.7
Average 15.8 56.1 21.7 60.6
Bad 4.1 32.7 12.2 30.8
Summary Seore* 88.0 40.0 77.0 39.0
Average SatisfactionScore (100 = satisfiedwith everything. O =dissastisfied witheverything) 93 42 83 52
Source: FSDVM Socio-Economic Survey of Santa Ana. 1980..* Maximum = 100 Minimum = 0.

-86-
The figures on satisfaction again seem to indicate that
families in the project are receiving better quality housing than
are families in other areas. On all three comparisons the level of
satisfaction is twice as high as for the mesones, the dwelling in which
most had previously lived. 1/
4. Estimating changes in the value of shelter of FSDVM projectparticipants
In the previous section we evaluated the impact of the FSDVM
project by estimating changes in housing quality. One problem of this
approach is that it is difficult to know how valid the quality index is
or the relative value which families place on different components of the
housing package. An alternative approach is to estimate changes in the
value of housing. In a well funetioning housing market this estimation
would be relatively simple as one would only have to compare rental
and/or sale values of houses at different points in time. Unfortunately,
in the case of the projects we are evaluating a number of factors make
the process of estimating more difficult. Firstly, FSDVM participants
were normally not permitted to sublet or sell their house for at least 5
years, and as that period had not lapsed by the time the study was
completed, we have no direct information on rental or sale prices in the
project areas. Secondly, information on imputed rents and imputed sales
values was only obtained in 1980 so it is not possible to compare these
values with the earlier surveys. Thirdly, project participants changed
1/ The results are similar to what is found in the Sonsonate studyin which the project participants expressed the highest levelof overall satisfaction. The level of satisfaction among theproject participants was considerably higher than meson andcolonia dwellers with respect to materials and quality ofconstruction, although in terms of lot size and living areathe colonia dwellers were slightly more satisfied than theparticipants.

-87-
the type of house in which they were living so that the value of two
different types of house must be compared. Although these factors make
it difficult to conduct any rigorous evaluation of changes in housing
values, it is possible to obtain some tentative estimates from both
cross-sectional and longitudinal data. Both types of estimates should,
however, be treated with considerable caution. The followíng 4 cross-
sectional indicators of value have been used:
a) Cost of construction or purchase of the house adjustedto 1980 prices.
b) Owners estimate of the monthly rent which could beobtained for the house.
c) Owners estimate of the sale price.
d) For the rental market (mesones and colonia renters)we have direct information on level of rents.
Table 4.7 uses these indicators to estimate housing values in
1980. For many indicators we give both the mean and interquartile
range as the former can be influenced by extreme values. The mean cost
of the FSDVM house is C 7639 ($3055) with an inter-quartile range of
C 5972 to C 9136. The owners estimate of the sale price is about 22
percent higher than this with a mean value of $3756. As a consistency
check we give the estimated sale price divided by (100 x the estimated
rent) and we find that the mean ratio is 1.13. As a rule of thumb
it is often assumed that the sale price is 100 times the rent so these
estimates appear to be relatively consistent. 1/
1/ The consistency is further borne out by the fact that the ratiorises with the estimated sale price. This is because the renttends to rise more slowly than the value of the house. This isquite consistent with findings from other countries.

Table 4.7: COMPARISON OF COST, OWNER'S ESTIMATED SALE PRICE AND RENT FOR PROJECT AND INFORMAL HOUSINGSANTA ANA, 1980
Cost (C$) Estimated Sale Price (C$) 1/ Rent (C$) 2/ Sale-Cost Ratio Sale-Rent Ratio 3/Interguartile Range Interguartile Range
X 25% 75% X 25% 75% X X X
OWNERScn
FSDVM 7983 5972 9136 9390 6500 10000 83.3 1.18 1.13
Colonia 20702 5946 21413 20732 12000 25000 136.8 1.00 1.52
* Tugurio 645 288 836 616 350 800 17.8 .96 .35
RENTERS
Meson 3317 33.2
Colonia 5122 51.2
Note: 1/ For owners, sale price was estimated by owners; for renters, it is actual rent times 100.2/ For owners, this is their estimate of rental value.3/ Rent = imputed rent x 100.

-89-
For the colonias ilegales the mean cost is C$19661 ($7864)
which is about 2.6 times as high as the FSDVM cost. When we compare the
inter-quartile ranges, however, we find that the lower quartile cost is
almost the same as the lower FSDVM figure which shows that the colonia
houses cover a much wider income spectrum than the FSDVM. Although
estimated cost is about 2.6 times as high, the estimated sale price is
only 2.3 times as high, and the estimated rent is only 1.64 times as
high. If these comparisons are valid they suggest the FSDVM project
produces a greater increase in value per colon invested than does the
colonia ilegal. This is shown by the fact that the FSDVM has a sale/cost
ratio of 1.22 compared with a ratio of only 1.08 for the colonia.
The tugurio house has a cost of only about one tenth that
of the FSDVM house and a sale price almost equal to cost. In this case
the sale/rent ratio is only 35 suggesting that due to insecure tenure
few people would wish to buy but that there is a relatively high rental
value due to the favorable locations close to places of work and the
center of the city.
Table 4.7 also gives information on rents in mesones and
colonias ilegales (in the latter case this may refer to a rented room
or to a complete house which has been rented). These figures refer
to actual rents, rather than to owners estimates, thus reflecting
a true market price. The mean rent in mesones is about 40 percent
of the imputed FSDVM rent, and the mean rent in colonias is about

-90-
30 percent of the imputed rent given by owners of colonia houses.
The colonia figures are consistent as in most cases only a part of the
house is rented out.
Unfortunately only very limited information is available for
estimating changes in values between 1976 and 1980. One of the most
interesting comparisons, between colonia owners and FSDVM participants,
cannot be made as information was not collected on imputed rents in the
colonias in 1976. Table 4.8 compares actual rents in 1976 with actual or
imputed rents in 1980. In the case of FSDVM participants the comparison
is between actual rent paid in a meson in 1976 with the imputed rental
value of the FSDVM house in 1980. The table estimates that the rental
value has increased 3.59 times. This increase is much greater than
rental changes in either mesones or rented rooms in colonias over the
same period. The comparison suggestes that FSDVM participants are
receiving more housing benefits than they would have if they had continued
to live in a meson.
The same conclusion was reached in a more sophistical way by
Quigley. 1/ On the basis of hedonic price coefficients estimated for
mesones in 1976 2/ a utility function was calculated to estimate the
additional utility the participants derived from their move to the
1/ John Quigley, "The Distributional Consequences of Stylized HousingPrograms", Urban and Regional Report No. 80-18. Urban and RegionalEconomics Division, The World Bank, August 1980.
2/ This technique permits the estimation of a coefficient indicatingthe amount families are prepared to pay for each attribute of adwelling (type of water supply, number of rooms, quality ofmaterials, etc.). These coefficients can then be applied to thenew FSDVM project to estimate how much people would have beenprepared to pay for this package of housing services.

Table 4.8: CHANGES IN VALUE OF HOUSING. 1976-1980. COMPARISON OF FSDVM PARTICIPANTSWITH INFORMAL HOUSING. SANTA ANA.
(In 1980 Colones)
Value-
1976 1980 Rent 1980/ 1976 Rent Value
Rent (1) Rent Rent 1976 (2) x 100 (3) Increase (4)
X Md. X Md. X Md. X Md. X Md.
OWNERS
FSDVM 21.2 19.7 83.3 76.2 3.59 2.87 6595 6042 2.95 2.32
Colonia 18.5 12.5 136.8 126.0 3.37 2.99 20238 15991 4.53 2.94
RENTERS
Meson 21.8 17.9 33.2 29.0 1.22 1.29
Colonia 28.1 25.0 51.2 35.0 1.45 1.12
Notes: (1) In 1976 prices.(2) 1976 prices adjusted for inflation.(3) 1976 prices adjusted for inflation.
(4) For FSDVM 1980 sales price is compared with 100 x 1976 (adjusted) rent

-92-
project. The form chosen was the Generalized Constant Elasticity of
Substitution (GCES) function. It was estimated that in 1979 the average
amount which could be subtracted from participants to leave them as well
off as they were in 1976 was 5.3 colones which is about 2.5% of total
income or about about 20% of the average rent paid in mesones in 1979.
This could be interpreted as meaning that project participants received a
consumer surplus equivalent to about 20% of what they would have been
paying for rent. The amount of additional utility was not found to be
systematically related to income or family size. 1/
Conclusion
The figures appear to show that the FSDVM project produces a
higher increase in value per colon invested than any other type of owner
occupied housing and that the value of the housing benefits has increased
for participants about twice as much as if they had continued to live in a
meson. Although the precise magnitude of estimated benefits varies with
the method of estimation, the general pattern and the more favorable
evaluation of the FSDVM is consistent across all estimates.
1/ Quigley, Table 22.

-93-
CHAPTER 5
ACCESS TO URBAN SERVICES AND PLACE OF WORK
The purpose of this chapter is to evaluate the impact of the
project on access to urban services and to place of employment. The
study from which many of these figures was taken was conducted in Santa
Ana which has a population of less than 100,000. Consequently the
difference in distances to services are not very great between different
types of shelter programs. However, it can be seen there are trade-offs
between. For example, closeness to work and level of services. Table 5.1
shows the distance of project households in Santa Ana from basic services
and from the place of employment. The figures given in meters 1/ show
that all families in the project are within 600 meters of a school,
public telephone, and park or playground and that virtually all are
within 200 meters of public street lighting. Medical assistance and
public transport are on average only 1000 meters distant, and for most
people the place of work and the local market are within 2000 meters.
This means that for most people all of the basic services and the place
of employment are within half an hour½s walk of their home.
Santa Ana, like most of the Salvadorean cities, is quite
small so the absolute differences for each. type of project are not
very great. However, there are some differences which illustrate the
types of trade-offs which become important in larger cities. Table
5.2 shows that residents in mesones are on average 60 percent closer
to these services than are project participants. Families in colonias
ilegales on the other hand are on average 20 percent further away than
participants.
1/ In most cases the information was given in "Cuadras" (blocks) whichis about 100 Meters.
-94-
Table 5.3 shows the effect which a move to the project would
have on access to services for families presently living in mesones and
colonias ilegales. The meson family would on average have to travel
an extra 309 meters to reach the services. The greatest increases would
be to visit the market (+1453 meters), a health center (+407 meters),
public transport (+844 meters) and place of work (+ 504 meters). The
only substantial improvement would be that the project is 420 meters
closer to a park or children's playground.
From the point of view of families living in colonias ilegales
the move to the project is more attractive in terms of nearness to
services. The greatest improvements are in access to: children's
playground ( -1090 meters), public telephone (-638 meters) and medical
assistance (-460). On the other hand the project is further away from
public transport ( + 673 meters), market (+518 meters) and place of work
(+419).
Care should be taken not to place too great an importance on
these differences as in most cases the distances are very short. Perhaps
the most important considerations are access to a children's playground,
and distance from work for people who are self-employed small traders.
One of the advantages of the meson is that a family can operate the
business from the house so that the mother can operate a small store
whilst being able to look after the children. The move to the project,
even though it does not represent a very substantial increase in distance,
may mean a loss of the customers who frequent the stores in the busy town
center where the mesones are located.
-95-
Access to services is determined by other factors as
well as distance. In the case of water supply many families only
have water available for a certain number of hours a day or have
to spend time queuing. Neither of these are problems in the project
so this is an area where a move to the project produces an important
increase in access. Table 5.7 presents indicators of the importance
of these factors. In the case of colonias ilegales it can be seen
that only 62.2 percent of families with individual water connections
have a water supply for 24 hours per day and 16 percent have water
for 10 hours or less per day. In the case of mesones only 84.5
percent of families have water for 24 hours per day and 6.8 have
it for less than 10 hours. For those families who have to purchase
water in tugurios or colonias ilegales virtually all have to spend
at least one hour per day engaged in queuing and carrying and almost
half have to spend two hours or more.
Satisfaction with access to services
Table 5.4 indicates the degree of satisfaction of project
participants with their access to different services. In general
there is a high degree of satisfaction with access to schools, water
and public lighting, but most families are dissatisfied or only
moderately satisfied with access to medical services and public
transport. Table 5.5 presents a comparison of the level of satisfaction
on these variables of project participants and families in informal
housing. Project participants' satisfaction is substantially below
average with respect to medical services and public transport,
-96-
and close to the average for schools and water. The only area in which
the project is substantially above average is public street lighting.
Table 5.6 shows, as we might expect, that there is a close
correlation between nearness to services and degree of satisfaction
with access. Each of the 4 types of settlement was ranked from 1
(highest) to 4 (lowest) on nearness to each of four services (medical,
school, transport and public lighting) and on level of satisfaction
with each service. It can be seen that there is very close cor-
respondence between nearness and satisfaction.
Summary
In 1976 most future project participants were living in mesones.
If the family were to decide whether they would have improved access
to services by moving to the project, to a colonia ilegal or by
staying in a meson, the following are the factors they should take
into account:
i) The meson is on average nearer than the project to
most basic services, whereas the colonia is further
away than the project. However, given the smallness
of the city the differences in distance are not very
great. Perhaps the most important differences are
firstly that the meson is nearer to the center of
town and hence to the potential clients for small
businesses. Secondly, the project provides easier
access to children½s playgrounds, an important con-
sideration when compared with the meson where children
have almost nowhere to play.

-97-
ii) The project provides considerably better access to
water supply as many families in both mesones and co-
lonias have water only part of the time or must spend
considerable amounts of time queuing.
iii) The project also offers substantially better access
to sanitary services by providing every family with
individual water born sewerage. Mesones and colonias
tend to have substantial defects in this respect.
In summary there can be seen to be some trade-offs. The project
provides a higher standard of water and sanitation, but innevitably
is further removed from employment and the other facilities one finds
in the central city areas where the meson is located. For a self-
employed small trader this nearness to place of employment is important,
but for most other groups the smallness of the city means that the
higher level of services provided in the project more than offsets
the relatively small increase of distance to some of the public
services.

Table 5.1: DISTANCE OF PARTICIPANTS HOUSE FROM PUBLIC SERVICES AND HEADS PLACE OF WORK.SANTA ANA 1980.
D I S T A N C E I N M E T E R S
101- 201- 401- 601- 801- 1001- .1501 2001- 2501- 3001- Mean0-100 200 400 600 800 1000 1500 2000 2500 3000 5000 Total Distance
Service (Percentage of Participants)
Medical Aid 26.0 .35.2 34.6 2.0 2.0 100 905
School 35.8 62.3 2.0 100 250
Public Transport 0.0 0.0 0.5 0.0 15.8 11.8 68.4 3.5 100 1016
Public Telephone 5.1 25.0 57.1 11.7 0.5 100 222
Public Street Lighting 82.7 16.8 0.5 100 18
Market 0.0 0.0 0.0 0.5 6.6 90.3 2.6 100 2129
Playgrond or Park 9.7 30.1 55.1 3.6 1.5 100 181
Heads Work Place 17.0 1.0 4.0 8.0 1.0 2.0 6.0 15.0 20.0 12.0 14.0 100 1584

Table 5.2: MEAN DISTANCE IN METERS FROM SERVICES AND EMPLOYMENT. FSDVM PROJECTIN SANTA ANA. MESONES, COLONIAS AND TUGURIOS 1980.
Participants Mesones Colonias Tugurios Mean
Medical Aid 909 502 1369 810 800
School 250 380 490 477 351
Public Transport 1016 172 343 328 555
Public Lighting 18 46 228 214 109
Public Telephone 222 317 860 502 434
Market 2128 675 1610 976 1475
Playground or Park 182 602 1272 795 626
Heads Work Place 1583 1079 1164 1052 1279
Average Distance 780 471 917 775
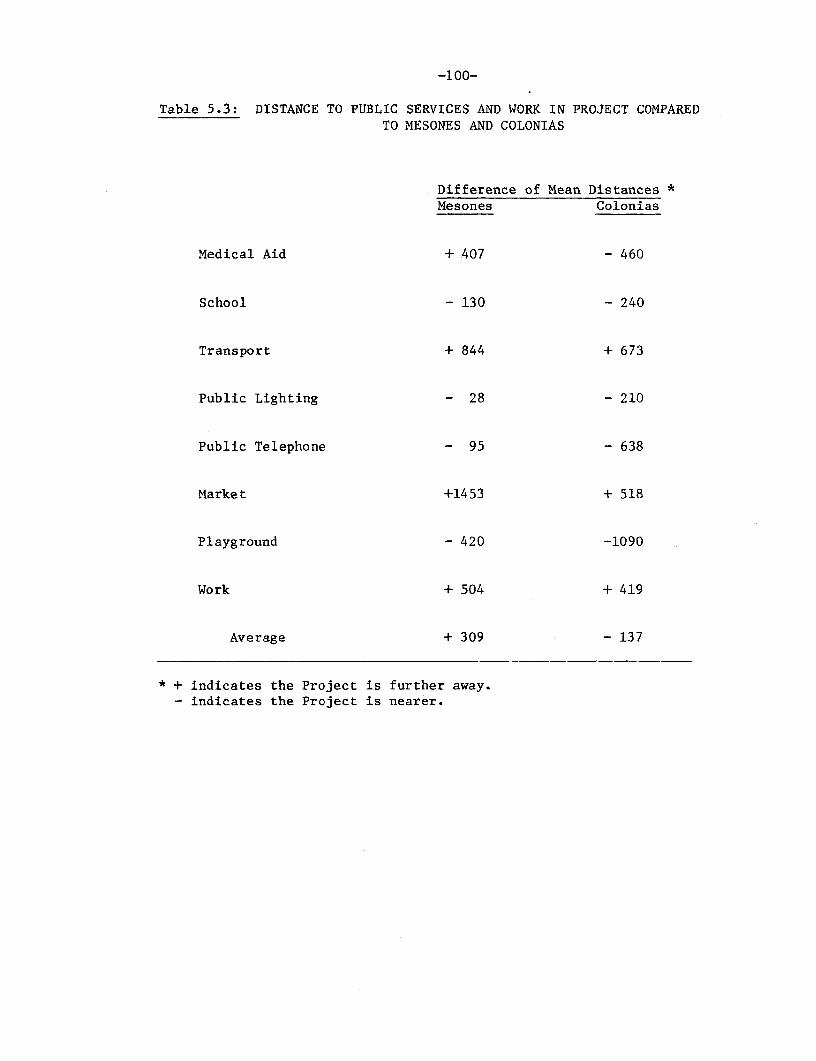
-100-
Table 5.3: DISTANCE TO PUBLIC SERVICES AND WORK IN PROJECT COMPAREDTO MESONES AND COLONIAS
Difference of Mean Distances *Mesones Colonias
Medical Aid + 407 - 460
School - 130 - 240
Transport + 844 + 673
Public Lighting - 28 - 210
Public Telephone - 95 - 638
Market +1453 + 518
Playground - 420 -1090
Wo rk + 504 + 419
Average + 309 - 137
* + indicates the Project is further away.- indicates the Project is nearer.

-101-
Table 5.4: SATISFACTION OF PROJECT PARTICIPANTS WITH ACCESS TO SERVICES.SANTA ANA 1980.
(In Percent)
Fairly PercentSatisfied Satisfied Disastified Satisfaction *
Medical Services 16.8 46.4 36.7 40.2
Schools 97.4 1.5 1.0 98.1
Water 88.8 9.2 2.0 93.4
Public Lighting 96.9 2.0 1.0 97.8
Public Transport 2.0 25.0 73.0 14.9
* 100 = completely satisfiedO = completely dissatisfied.

Table 5.5: MEAN SATISFACTION WITH ACCESS TO SERVICES. COMPARISON OF PROJECT, COLONIAS,MESONES AND TUGURIOS. SANTA ANA 1980.
(In Percent)
Participants Mesones Colonias Tugurios Mean *
Medical Services 40.2 77.6 64.8 68.0 59.0
Schools 98.1 95.0 86.0 88.0 92.4
Water 93.4 95.0 87.0 87.0 90.9
Publie Lighting 97.8 92.0 35.0 40.6 71.2
Public Transport 14.9 97.0 78.0 86.9 60.0
Mean * 68.9 91.3 70.1 74.1 74.7
* 100 = complete satisfactionO = comlete díssatisfaction

-103-
Table 5.6: DISTANCE FROM SERVICES AND SATISFACTION WITH ACCESS.COMPARISON OF RANK ORDERS. SANTA ANA 1980
(Rank Order: [1 = Highest 4 = Lowest]
Project Meson Colonia TugurioDist. Sat. Dist. Sat. Dist. Sat. Dist. Sat.
MedicalServices 3 4 1 1 4 3 2 2
School 1 1 3 2 4 4 2 3
Transport 4 4 1 1 3 3 2 2
PublicLighting 1 1 2 2 4 4 3 3
Note: Dist. = DistanceSat. = Satisfaction

Table 5.7: INDICATORS OF ACCESS TO WATER SUPPLY: HOURS WATER AVAILABLE INCOLONIAS AND MESONES AND TIME SPEND QUEUING TO BUY WATER.
SANTA ANA 1980.
(In Percent)
H O U R S W A T E R A V A I L A B L ELess Than 24 Sample1 Hour 1 2 3 4 5 6-10 11-15 16-20 Hours Size
Colonias Ilegales-Individual Faucetts 4.4 5.6 1.1 1.1 4.4 11.1 10.0 62.2 90
Mesones - CollectiveSupply 4.9 1.9 7.8 1.0 84.5 103
Time Spent Queuingto Buy and CarryingWater: Tuguriosand Colonias 0.9 52.3 36.4 8.4 1.9 107

-105-
CHAPTER 6
AFFORDABILITY AND ACCESS OF THE PROJECT TO THE TARGET POPULATION
This chapter reviews the evidence on the extent to which the
project has achieved its goal of providing housing which is affordable
and accessible to the target population. Two main issues will be
discussed:
(a) Are the costs of entering the project sufficiently low
to be affordable to the target population?
(b) Is there any evidence that poorer families are being
forced to drop out of the project due to their
inability to cover the costs of consolidation of the
house?
A. Is the Target Population Able to Meet the Costs ofof Entering the Project
Defining the Target Population
In the Appraisal Report it was stated that the projects
were intended for low income urban families who did not already possess
a house. It was realized that Sites and Services projects are not
intended to reach the very poorest sectors of the urban population,
but it was intended that the project should be accessible down to the
l7th income percentile of the urban income distribution. As will be
pointed out in the discussion there was no very clear definition of how
income was to be defined. In addition to these requirements the FSDVM
has generally required that families should have been living for at least
two years in the city (in an attempt to discourage rural families from

-106-
coming to the city simply to obtain a house) and that families be
prepared to participate in the mutal help construction process.
The requirement of participation in mutual help construction
derives partly from the FSDVM's objective of using house construction
to develop an organizational base to initiate a wider program of social
and economic change, and partly from the belief that mutual help is the
most cost effective way to provide affordable housing to the urban poor.
Participation in mutual help construction replaces the 10 percent down-
payment which is required in many housing programs, and which the FSDVM
believes would have been a barrier to participation by many of the
poorer families.
In practice the FSDVM has been pragmatic with respect to the
mutual help requirement. In projects where there has been excess
demand (for example, the first Santa Ana project) the requirement has
been enforced strictly, whereas in projects where there has been a
scarcity of applicants (for example Usulutan) the requirement has been
relaxed.
Are Projects Affordable to the Target Population? 1/
Initially the Bank assumed that a family could spend up to
about 20 percent of its monthly income on housing and that the project
would therefore be affordable to families whose monthly income was five
times greater than the monthly payment to the FSDVM. To test these
assumptions and to investigate their applicability the following
equation has proved useful. A project is affordable to a family if:
C < aY
1/ For a more complete discussion of Affordability, see Douglas H. Keareand Emmanuel Jimenez, "Affordability, Income and Housing Consumption"Urban and Regional Economics Division, World Bank, November 1980,(Draft).

-107-
where C = the monthly cost of the project to the family
Y = family monthly income
a = proportion of income a family is willing to spend on housing.
To evaluate affordability we will begin by presenting estimates
of C, Y and a and will then combine them in the equation.
Estimating C (monthly housing cost)
Given the fact that the project is based on the concept of
progressive development, where families complete the unit at their
own expense and according to their own plans and timetable, the monthly
cost will be different for each family. Families make both fixed payments
on mortgage payments and the FSDVM material loan, and variable payments
for additional purchase of materials and payment for labor. The variable
payments differ in amount, with some families buying expensive materials
and hiring skilled labor, and others using cheaper materials and doing
the work themselves. There are also differences in the ways in which
these payments are financed with some families paying out of their
monthly wages, others using savings and others borrowing money. About
one third of materials are bought on credit and one third paid for out of
savings. Table 6.1 summarizes the amount of each type of payment and the
typical ways of paying. It is estimated that the average cost of a
complete project house in 1979 was colones 7561 (US$3024). With the
assumptions indicated in the footnotes we arrive at approximate estimates
of the monthly expenditures the families have to make to complete the
houses. The average monthly cost is colones 78 (US$31).

Table 6.1: STRUCTURE OF ROUSING COSTS IN FSDVM
Project Santa Ana - 1979 Prices (Colones)
Total Cost to Family Monthly Payment (1) Typical Form of PaymentType of Payment Mean Interguartile Range Mean Range Cash (X) Credit (Z) Savings (Z)
Mortgage Paymentto FSDVM 4237 3454 - 5110 28 23 - 33 20 yrs at 6%
Material Loanto FSDVM 323 200 - 1000 6 2 - 8 5 yrs at 8%
Other Material (2) oPurchase 2069 380 - 2400 24 0 - 28 37 33 30
(3)Payment for Labor 480 80 - 825 20 3 - 34 100
Value of Mutual (4) Compulsary participationHelp Labor 452 452 452 0 0 - 0 in Construction
T O T A L 7561 4566 9787 78 28 -103
TOTAL US$ 3024 1826 3915 31 11 41
Notes: (1) The average amount families pay each month is obtained by combining average total payment with information onform of payment.
(2) Assumes credit is for 5 years at 12 percent.(3) Assumes payment for labor made over 2 year perid.(4) Mutual help not included as additional monthly payment because it is part of the payment to FSDVM. Shadow value of
labor ís not included as cost.

-109-
From the point of view of estimating affordability it is
important to note that the monthly mortgage payment to the FSDVM only
represents about 36% of the total monthly payment made by most families
(Table 6.2). Purchases by the family of additional materials represents
a further 31% and payment for labor 25%. This fact is important because
many estimates of affordability are based simply on the mortgage payment.
The justification usually given for only considering fixed payments is
that families are not obliged to make additional payments and that these
should not therefore enter into estimates of basic affordability. This
is a difficult issue because many families have a relatively high expect-
ation of minimum acceptable level of housing and this level requires the
additional expenditures. In this chapter we make alternative estimates
of affordability which both include and exclude the additional payments
so as to test the sensitivity of affordability estimates to the assumptions
about cost.
A basic characteristic of the progressive development model is
that families have flexibility in terms of the amount and timing of their
investment in housing. Table 6.3 presents a frequency distribution
of monthly expenditures on housing by the project participants.
It can be seen there is considerable variation with some families
paying as little as $16 per month and others paying as much as $60.
Almost 75% of the families pay between $20 and $36 per month and
this can be taken as the range for estimating affordability as only
7% were paying less than this.
For some of the estimates it is necessary to use 1976 prices
as this was the year in which families entered the project. To estimate
1976 prices the figures for 1979 are multiplied by 0.8.

-110-
Table 6.2: PROPORTIONAL BREAKDOWN OF MONTHLY HOUSING COSTSFSDVM - SANTA ANA
Mean Monthly Cost Percent of TotalComponent (Colones) ($) Monthly Payment
Mortgage Paymentto FSDVM 28 11.2 35.9
Material Loan toFSDVM 6 2.4 7.7
Other MaterialPurchase 24 9.6 30.8
Payment for Labor 20 8.0 25.6
Total Monthly Payment 78 31.2 100.0

-111-
Table 6.3: FREQUENCY DISTRIBUTION OF MONTHLY HOUSING PAYMENT IN 1979 COLONESFSDVM PROJECT - SANTA ANA
Number of Families$ Colones Percent Cumulative
Less Than 16 Less Than 40 1.1 1.1
16 - 20 41 - 50 5.8 6.9
20 - 24 51 - 60 24.2 31.1
25 - 28 61 - 70 21.6 52.7
29 - 32 71 - 80 14.2 66.9
33 - 36 81 - 90 12.1 79.0
37 - 40 91 - 100 6.3 85.3
41 - 50 101 - 125 7.9 93.2
51 - 60 126 - 150 5.2 98.6
Over 60 Over 150 1.6 100.0
TOTAL 100.0

-112-
Estimating Income (Y)
To estimate income it is necessary to decide which of the
following definitions will be used: (a) Earned income of head,
(b) Earned income of all household members, (c) Earned income plus rent
and pensions, (d) All sources of income including transfers from
non-family members. Projects in different countries have varied in
terms of which of these definitions they have used.
Table 6.4 gives mean income of project participants in Santa
Ana in 1976, 1979 and 1980, based on three different definitions.
The broadest definition includes all sources of income, earned
as well as gifts, of all persons living in the household. If only
earned income is taken into account, estimated income drops by about
8%, whilst if only earned income of the head is considered, the estimate
is only about 56% of all income. To date Bank appraisal reports tend
not to discuss this issue of which definition of income should be
used. Although it was not explicit, the FSDVM seems to have used the
intermediate definition in which only earned income of family members
is counted. The implicit assumption is that gift income from relatives
not living in the household will be unstable and should not be taken
into consideration. There is in fact no evidence that these sources of
income are any more unstable than earned income. Lindauer and Kaufmann 1/
have shown that the exclusion of income transfers produces a systematic
bías against the selection of low-income families. For many low-income
1/ David Lindauer and Dani Kaufmann, "Basic Needs, InterhouseholdTransfers and the Extended Family", Urban and Regional ReportNo. 80-15, DEDRB, DED, World Bank.

Table 6.4: COMPARISON OF EARNED INCOME OF HEAD, EARNED INCOME OF ALL FAMILY MEMBERS AND FAMILY INCOME FROM ALLSOURCES PROJECT PARTICIPANTS - SANTA ANA 1976, 1979 AND 1980
1976 1979 1980Mean Median Mean Median Mean Median Average Mean
Colones Colones Colones Colones Colones Colones (Percent)
Earned Income of Head 185 164 276 260 336 300 56
Earned Income of
All Family Members 338 310 451 400 526 482 92
All Sources ofFamily Income 358 321 493 433 580 510 100

-114-
families, particularly female headed households, income transfers can
represent up to 20% of total household income. Excluding these sources
implicitly reduces the estimated income by 20 percent and results in many
of these households not meeting the minimum affordability and thus being
potentially excluded from the project. 1/
Table 6.5 presents two estimates of the income distribution in
Santa Ana. The first is taken from a national study of income distribution
in urban areas in 1976 2/ and the figures have been interpolated by the
authors to estimate maximum incomes for each decile. A second estimate
is obtained from the FSDVM study of popular housing conducted in Santa
Ana in 1976. The study only covered the low-income population but it was
assumed that this represented the poorest 65% of the urban population.
The estimates were then weighted and interpolated 3/ to provide an
approximate estimate of income distribution of the lowest 65% of the
population. The estimates compare closely with the national study for
the first five income deciles but there is a considerable discrepancy
for the sixth decile. It is assumed that the reason for this is that
whilst popular housing includes virtually all poor families in Santa
Ana, some of the communities, particularly colonias ilegales, also
house wealthier families. This would suggest that figures provide
1/ On the basis of the 1979 data, using the average fixed payment ofthe FSDVM project and 20 percent as a proportion of income spent onhousing, we estimated that the exclusion of transfer income inproject selection criteria could discriminate against 6-7 percent ofthe potential applicants who would have otherwise qualified.
2/ El Salvador. Banco Central. "Caracteristicas de los Hogares y delas Viviendas", 1979. Quoted in "An Enquiry into Urban Poverty",World Bank, 1980.
3/ Lindauer (1979)

Table 6.5: ESTIMATION OF THE INCOME DISTRIBUTION FOR SANTA ANA AND DISTRIBUTION OFPROJECT PARTICIPANTS BETWEEN DECILES.
SANTA ANA. 1976.
(1) ~~~~~(2)National( ) Santa Percent FSDVM In (3)
Urban Ana Each Santa Ana Income Decile
Income Cumulative
Decile Upper Limit for Decile (Colones) Percent Percent
0 - 10 114 100 1 1
11 - 20 170 169 10 11
21 - 30 227 258 25 38
31 - 40 286 288 7 43
41 - 51 376 371 23 69
51 - 60 475 475* 8 81
61.- 70 574 9 90
71 - 80 786 16 98
81 - 90 1153
91 -100 4000
* Taken from national figures.
Source: (1) Deciles computed from "Caracteristicas de los Hogares y de las Viviendas"Banco Central, El Salvador, May 1979.
(2) FSDVM "Socio Economic Study of Santa Ana, 1976". Estimated by Lindauer.
(3) The upper limit for income deciles for the distribution of FSDVM
participants are: (lst) 165; (2nd) 195; (3rd) 240; (4th) 285; (5th) 315;
(6th) 345; (7th) 385; (8th) 465; (9th) 570; (lOth) 920.

-116-
an accurate estimate of the lower end of the distribution but are
less reliable at the upper end. For this reason we will use the
national estimate for the sixth decile and above.
Estimating the Proportion of Income Families are Willing toSpend on Housing (a).
It has usually been assumed by the World Bank and most other
housing institutions that a family can or should spend a maximum of
between 15 and 25 percent of their income on housing. A proportion
within this range has usually been used as guideline in the estimation of
project affordability. The results of several studies conducted by DEDRB
suggest that in fact there ís considerable variation in the proportion of
income which a family is willing and able to spend on housing. 1/ The
proportion varies according to household income, tenure status, type of
housing and family characteristics. Table 6.6 presents the results of 3
different methods of estimating these proportions.
The upper section of the table gives the proportion of household
income spent on rent by families renting rooms in a meson. It can
be seen that there is a strong inverse relationship between household
income and the proportion of income spent on rent. Thus whilst the
poorest 10 percent of families spend 23 percent of their income on rent,
the highest 40 percent all spend less than 6 percent. This relationship
reflects the fact that the cheapest available accommodation is still
relatively expensive so that the poorest families are forced to spend
an extremely high proporition of their income on rent. As income
rises the amount spent on rent increases much more slowly.
1/ The findings are discussed in detail in Keare and Jimenez,"Affordability, Income and Housing Consumption", November 1980,(Draft), Urban and Regional Economics Division, World Bank.

Table 6.6: PROPORTION OF MONTHLY INCOME SPENT ON HOUSING BY OWNERS AND RENTERS, SANTA ANA, 1980.
INCOME DECILES FOR POPULAR HOUSING
1 2 3 4 5 6 7 8 9 10 Mean SampleSize
RENTERS
Meson .23 .12 .09 .12 .06 .09 .06 .06 .06 .04 .09 105
OWNERS
Total Housing Cost 1/
Colonia - - .04 - - .03 .07 .10 .04 .07 .05 72
Tugurio - .04 .03 - .04 .07 .05 - - - - 104
FSDVM .18 .14 .10 .09 .10 .10 .12 .09 .11 .14 .12 196
Total Monthly Rent 2!
Colonia - .25 - .31 .41 .54 .26 .28 .17 .17 .22 69
Tugurio .13 .09 .08 .06 .05 .05 .03 .03 .02 .04 .07 103
FSDVM .57 .27 .34 .23 .23 .23 .18 .16 .13 .09 .18 191
1/ Including fixed payments, construction, light and water.2/ Owner's estimate of what the monthly rent would be.

-118-
The middle section of the table refers to the amount spent
by owners on housing during the month of the survey. The amount includes
both fixed payments on loan repayments and services and the expenditure
on materials and labor for house improvements. In this case the figures
for the FSDVM show no clear relationship between income and the proportion
of income spent on housing. This suggests that the amount spent on
housing investments increases in proportion to income since the fixed
payments to FSDVM vary little across income groups. As can be seen the
proportion only varies between a high of 18 percent and a low of 9
percent over the whole table. In colonias ilegales the average expend-
iture on housing is only about a third of that of the FSDVM (4 percent
compared with 12 percent) and there is no clear relationship to income.
It is not surprising that the proportions are lower as most colonia
families have been living in their houses for longer periods of time and
have completed their main investments. In the tugurio the average
proportion is even lower (2 percent) and again there is no clear relation-
ship to income. The conclusion from the FSDVM figures would seem to be
that families are able and willing to spend between 9 and 20 percent of
their income on housing.
The bottom section of the table is based upon the proportion
which imputed rent represents of total family income. Families were
asked to indicate how much they think they could rent their house for.
In a perfect market one would expect that famnilies who would be willing
to rent the house would have approximately the same incomes as the
family presently living there. By this line of arguing the imputed rent
could be used as an indication of how much the owner would have been

-119-
prepared to pay in rent for the house. However, in the present case this
assumption is probably not valid because owners receive a number of
hidden subsidies as they are acquiring the house at below market value.
As a result it is likely they could rent the house to families of higher
income levels than themselves as the house is in fact worth more on the
free market than they had to pay. This means that the proportions given
in this section of the table for the FSDVM may not reflect the amount of
rent the owners would be willing to pay. With this reservation it is
interesting to note that for all three types of housing, the ratio of
rent to total income declines as income increases, implying an income
elasticity of less than one which is consistent with the finding in the
top section of the table relating to mesones.
Estimating Affordability and Accessibility
As stated earlier it was the objective of the Bank project to
be affordable down to the l7th income percentile. Considerable infor-
mation is available on the extent to which this objective has been
achieved. The final column of Table 6.5 gives the cumulative
proportions of project participants in Santa Ana on the city income
distribution. It can be seen that 11 percent are estimated to come
within the lowest 20 percent of the income distribution, whilst a total
of 38 percent and 43 percent come within the lowest 30 and 40 percent
respectively. A total of approximately 85 percent come within the
lowest 65 percent of the distribution and hence fall within the original
target population limits.

-120-
Table 6.7 presents similar estimates for the Sonsonate project
and the first two projects in San Salvador. In both cases it is
found that virtually all participants come below the 60th percentile.
In general it can be seen that the project has been successful in
achieving its goal of reaching families below the 65th percentile, but
that there has been a tendency for participants to cluster towards the
upper end of the target limits. The majority of participants come from
the thirtieth to the sixtieth percentiles. These people are poor
having per capita incomes below $30 per month but they have slightly
better economic conditions than the families at the lower end of the
target population. The projects have had more difficulty in reaching
the families in the second and third income deciles and these represent
thirty percent or less of the project participants.
The effect of this clustering towards the upper end can
be seen clearly in Table 6.8 which shows the proportion of families in
each income decile who have participated in FSDVM projects in three
cities. The proportion of families who benefit from the project increases
steadily for each income decile. Thus although only 1.39% of families
from the first decile participate, the proportion rises to 13.58 for
the third decile and to 18.69 for the sixth decile. The project only
reaches about one in ten families in the second and third deciles but
almost one in five of families in the fifth and sixth deciles.
B. Is There Any Evidence that Poorer Families are DroppingOut of the Project Through Inability to Pay?
The earlier sections of this chapter show that the fixed monthly
payments to the FSDVM represent only about one third of the total amount
of money which the average family pays to purchase and complete the

-121-
Table 6.7: FSDVM PARTICIPANTS BY URBAN INCOME DECILESANTA ANA, SONSONATE AND SAN SALVADOR, 1976
Urban FSDVM Projects - Cumulative PercentagePopulation Participants in Each Decile
Income Deciles Upper Limit Santa Ana Sonsonate San Salvador
0 - 10 114 1 3.8 7.7
11 - 20 170 11 13.1 15.5
21 - 30 227 38 32.0 29.8
31 - 40 286 43 63.5 41.3
41 - 50 376 69 92.7 65.1
51 - 60 475 81 100.0 99.1
61 - 70 574 90 100.0
71 - 80 786 98
81 - 90 1153
91 - 100 4000
Source: (1) Gonzalez-Polio, "FSDVM Studies on Demand and Affordability".

Table 6.8: PROPORTION OF FAMILIES IN EACH INCOME DECILE PARTICIPATIN& IN FSDVM PROJECTSSANTA ANA, SONSONATE AND USULUTAN
Proportion of Total City FamiliesParticipating in Project
Income DecilesTotal Families
1 2 3 4 5 6 in the City (1976)
Santa Ana 0.5 6.3 7.7 7.5 10.5 25.7 12659
Sonsonate 2.7 6.5 13.3 22.1 20.5 5.1 6400
Usulutan 1.0 12.0 19.7 19.0 23.0 25.5 4952
Average Proportion 1.4 8.3 13.6 16.2 18.0 18.7
Source: Gonzalez-Polio, "FSDVM Studies on Accessibility of Projects to the Urban Poor".

-123-
construction of their house. As was pointed out, most of the estimates
of affordability were based on the fixed payments to the FSDVM. The
question therefore arises as to whether there is evidence that poorer
families have been forced to drop out of the project due to these higher
than expected consolidation costs. In this context it must of course be
recalled that the family has considerable flexibility in terms of the
total amount which it chooses to invest in the house and Table 6.3 shows
that the poorest 10 percent of families are spending less than half the
monthly amount invested by the richest 15 percent.
Table 6.9 summarizes available information on drop-out rates
in Santa Ana and Sonsonate for participants and control groups. The
figures refer in each case to different intervals of time but estimates
of annual turnover rates have been made by Lindauer. 1/ Weighted
averages have been computed for turnover rates in control areas and
the rates vary from a low 14.9% to a high of 25.8%. We assume that
these figures give an idea of the normal turnover rate in low-cost
housing, and this can be used as a reference point for evaluating
project turnover. For project participants in Santa Ana, figures show
that the turnover rate among participants was very high before the
completion of mutual help (about 30 percent of selected participants
dropped out before the completion of mutual help); but once the mutual
help is completed the annual drop-out rate falls to between 6% and 13%
for the 1976-1979 period and to 2.6% for the 1979-1980 period. Similarly,
in Sonsonate it was estimated that the drop-out rate after mutual
help was about 8%.
1/ Lindauer, `Longitudinal Analysis of Project Turnover. SomeLessons from El Salvador." September 1979, DEDRB.

- 124 -
Table 6.9: ESTIMATES OF ANNUAL TURNOVER RATES AMONG PROJECT PARTICIPANTS ANDCONTROL GROUPS. SANTA ANA AND SONSONATE. 1976-1979 AND 1979-1980
1977 - 1979 1976 - 1979 1979 - 1980
SONSONATE1/
Control Group 25.8
Mesones 29.4
Colonias Ilegales 13.3
Tugurios n.a.
Pro ject
Before completion ofmutual help n.a.
After mutual help 8.0
SANTA ANA1/
Control Group 14.9 24.9
Mesones 15.6 26.4
Colonias Ilegales 12.4 20.5
Tugurios 15.2 13.9
Project 16.2 2.6
Before completion ofmutual help 2/ 26.2-35.2
After mutual help 2/ 5.9-12.7
1/ Weighted average2/ Two alternative estimates were used (see Lindauer below)
Source: David Lindauer, "Longitudinal Analysis and Project Turnover. SomeLessons from El Salvador". September 1979. DEDRB.Some additional material was prepared by Lindauer for 1980 whichdoes not appear in the paper.

-125-
The reasons for drop-out before and during mutual help are
complex, many of them being related to administrative factors in the
selection process (for example not being able to locate families who had
applied). There is no evidence, however, that inability to pay was
a major cause of dropping out.
Once families have made the investment of time and resources
to complete the mutual help, the drop-out is extremely low. As most
of the additional housing investment is made after mutual help it would
seem that very few families are forced to leave the project through
their inability to cover the costs of material purchase and labor.
This finding is further supported in Chapter 7 where it is shown that
increased investment in project housing does not seem to have had any
negative effect on per capita expenditure on food or medicine.
A comparison was also made of the income of drop-outs and
families staying in the project. Table 6.10 shows there is no significant
difference in the drop-out rates of low, medium and high income families.
Table 6.11 also shows that there is no clear difference in drop-out
rates of male and female headed households.
Conclusion: Is the Project Affordable to the Target Population?
Despite the fact that project costs are higher than assumed in
the initial estimates of affordability and the poorer families are
spending a higher than expected proportion of their income on housing,
the project does seem to be affordable to the target population. At
least 85% of participants fall within the specified income range and
a substantial proportion of families come from the lower end of the
range. One factor which may partly explain the ability of poorer
families to meet the higher than expected housing costs is the

-126-
Table 6.10: COMPARISON OF ANNUAL TURNOVER RATES BY INCOME CLASS IN THEFSDVM PROJECTS IN SANTA ANA AND SONSONATE
Income ClassLow Middle High
Sonsonate 8.1 8.8 6.8
Santa Ana 17.6 16.7 18.8
Source: David Lindauer, "Longitudinal Analysis and Project Turnover.Lessons from El Salvador." DEDRB. Table 7.
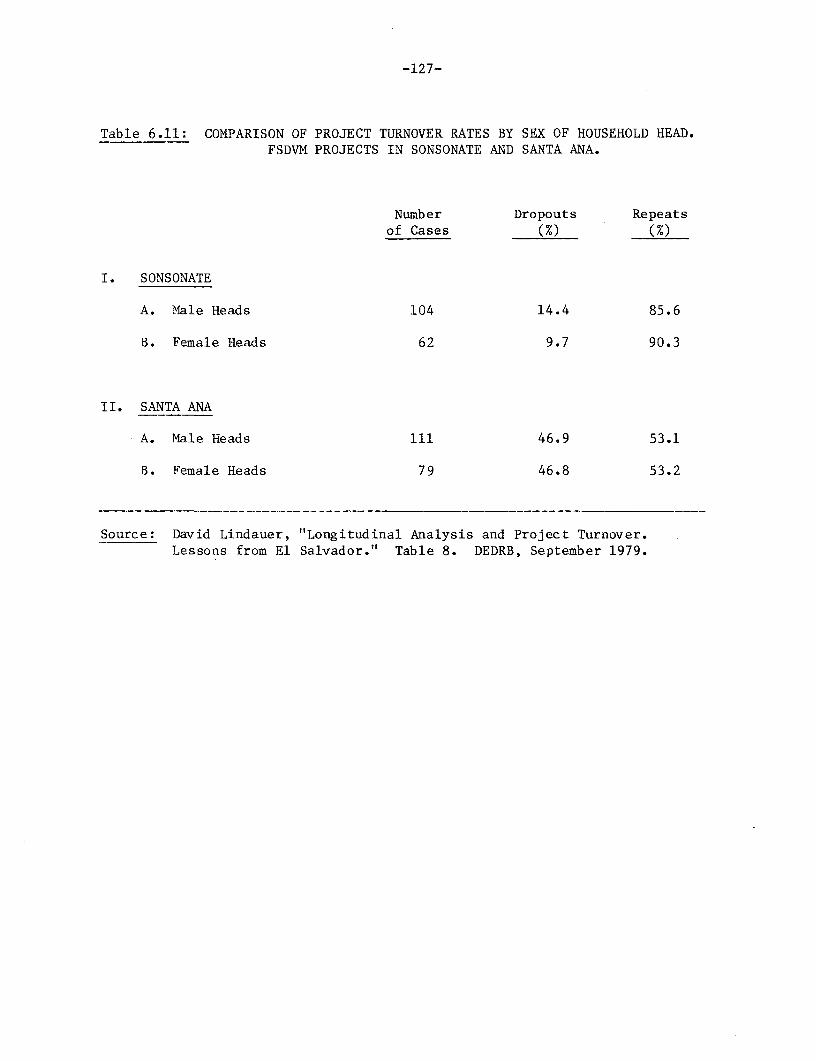
-127-
Table 6.11: COMPARISON OF PROJECT TURNOVER RATES BY SEX OF HOUSEHOLD HEAD.FSDVM PROJECTS IN SONSONATE AND SANTA ANA.
Number Dropouts Repeatsof Cases (%) (%)
I. SONSONATE
A. Male Heads 104 14.4 85.6
B. Female Heads 62 9.7 90.3
II. SANTA ANA
A. Male Heads 111 46.9 53.1
B. Female Heads 79 46.8 53.2
Source: David Lindauer, "Longitudinal Analysis and Project Turnover.Lessons from El Salvador." Table 8. DEDRB, September 1979.

-128-
important finding by Kaufmann and Lindauer 1/ that poorer families
tend to receive some transfers from non-household members of the family
group. For the poorest families this can represent a substantial portion
of total income and there is evidence both from El Salvador and the
Philippines 2/ that investment in housing will tend to attract support
from the extended family group.
There is some tendency for participants to concentrate towards
the upper end of the permissible income range, but given the very high
inflation rate that erodes the incomes of the urban poor this tendency
is probably innevitable. Rather than use this as a criticism it is
probably more correct to say that it is very impressive, given the
escalating costs, that the project is still affordable to families within
the original income range.
The analysis also shows that the turnover rate among project
participants is very low once the initial ínvestment of time has been
made in the mutual help. This provides evidence that there is no
substantial proportion of families who were forced to leave the project
through inability to cover costs. This finding is further reinforced by
the fact that there is no difference in income between families who
leave the project and those who stay.
In conclusion, one can say that the projects have clearly
demonstrated their affordability and accessibility to the target
population.
1/ D. Kaufmann and D. Lindauer, "Basic Needs, Interhousehold Transfersand the Extended Family", Urban and Regional Report No. 80-15,DEDRB, DED, World Bank.
2/ Income and Expenditure Report, Research and Analysis Division,National Housing Authority of the Philippines.
-129-
CHAPTER 7
SOCIO-ECONOMIC IMPACT
1. Evaluating the Overall Project Impact on Incomeand Employment
Although the generation of income and employment was not
the primary objective of the Project, the Appraisal Report did indicate
that the Project was expected to have some impact in this area. In
this chapter we shall try to evaluate project impact in two different
ways. In the present section we will try to evaluate overall project
impact by comparing changes in income and employment of project partic-
ipants with the corresponding changes experienced by a control group of
families which is matched as closely as possible with participants. If
differences are found between the two groups (after they have been
matched statistically) this will indicate a potential project impact on
income or employment. Care must be taken in the interpretation of these
results as this is not a true experimental situation and other factors
unrelated to the project might have produced the apparent "project
impact." If differences are found, other methods should then be used to
susbtantiate whether it is plausiable to assume they were due to the
effect of the project (this is called "triangulation"). In fact, as will
be seen, very few statistically significant differences were found
between participants and control groups so the conclusion is that with a
few possible exceptions, there was no evidence of the project having
produced an overall impact on income or employment. However, given the
interest in potential project impacts in this area, a number of different
analyses were conducted to try and identify possible impacts on certain
subgroups. The results of these tests, mostly negative, are presented in
the following sections.

-130-
In Sections 2.1 and 2.2 an evaluation is presented of the impact
of the Project components which were specifically designed to generate
income and employment. In this case it is possible to make inferences
about causal relationships on the micro-level (i.e. how many people in the
project were employed during the construction stage), but it'is usually
not possible to evaluate the net employment or income generating impacts
on the economy. We may demonstrate for example that X person/years of
employment were generated during the construction of the houses. The
research design does not permit, however, an evaluation of whether
these jobs were taken by people who were previously unemployed (and hence
represented a net increase in employment) or whether labor was diverted
from alternative construction projects so that there may have been no net
change at the national level.
1.1 Research design for evaluating overall project impacton income and employment
The analysis of overall project impact is based on the long-
itudinal study in which a sample of project participants and a control
group were interviewed at 3 points in time (see Annex 1 for a detailed
explanation of the design of this study). In analyzing overall impact on
income, multiple regression analysis was used to control for initial
differences between the control and experimental groups, and determine
project impact by examining the coefficient of the dummy variable
representing project status. (See Annex 1, Section 4 for a detailed
explanation of the logic of this method of analysis). The nature of
the analysis is such that one can make inferences as to whether or not
the project has had an effect but that it is not possible to determine
statistically what caused the effect.

-131-
Given the fact that we did not have any very precise hypothesis
as to the way in which the project might affect income, it was decided
to conduct independent analyses of project impact on total family
income, family earned income, earned income of the household head,
total earnings of secondary workers and family earnings per worker.
In addition, we also look at possible effects of labor force particip-
ation. The results of each of these analyses is presented in the
following sections, at the end of which the overall conclusions are
discussed.
1.2 Project impact on total family income (earned incomeplus income from other sources)
Table 7.1 shows absolute and relative changes in total family
income of participants and the control group for 1976 (before the project
began), 1979 and 1980. It can be seen that the absolute change between
1976 and 1980 was greater among the participants than the non-participants
but that the rate of increase was slightly higher for the Control Group.
This was because the initial income of the Control Group in 1976 was
lower. It would appear from this table that there is no clear evidence
of an overall positive impact of the project on income and that in fact
the rate of income increase appears to have been lower for Participants.
Table 7.1: TOTAL FAMILY MONTHLY INCOME FOR PARTICIPANTSAND CONTROL GROUP. SANTA ANA. 1976-1979, 1980
(Colones)
Change 1976-19801976 1979 1980 Absolute %
Participants 344 504 603 259 75.3
Non-Participants 276 433 493 217 78.6
Note: Figures have been rounded.

-132-
1.3 Project impact on family earned income
Table 7.2 shows absolute and relative changes in the family
earned income of participants and control group in Santa Ana between
1976 (a few months before families moved into the project) and 1980.
Table 7.2: CHANGES IN AVERAGE MONTHLY FAMILY EARNED INCOME1976,1979, AND 1980
(Colones)
Change 1976-19801976 1979 1980 Absolute _%
Participants 335 470 569 234 70.0
Non-Participants 258 390 451 193 74.6
Note: Figures have been rounded.
Although participants on average enjoyed a larger absolute
increase in income (234 colones compared with 193) the percentage
increase was slightly lower for participants than for the control
group. The difference between the absolute and percentage positions
is due to the fact that the average income of participants was higher
in 1976 than that of the control group. The more rigorous regression
analysis corroborated the fact that there was no observable difference
in the rate of change of income of the two groups, in other words,
it was not possible to detect any overall project impact on total family
earned income. 1/
1.4 Project impact on earned income of the household head
Like family earnings, it was not possible to detect any
project impact on the earnings of the household head. 2/
1/ See Table 3 of Annex 1.2/ See Table 4 of Annex 1.

-133-
1.5 Project impact on total earnings of secondary workers
According to Table 7.3, both in absolute and percentage terms
the Participants seem to have done better than the non-participants
with respect to earnings of secondary workers. Using the regression
analysis, we estimated that on the average the secondary workers among
the participating families between 1976 and 1980 experienced an increase
in earned income of about 77 colones more than their counterparts in the
Control Group. (See 4.11 of Annex 1.).
Table 7.3: CHANGES IN TOTAL MONTHLY EARNINGS OF SECONDARYWORKERS
(Current Colones)
Change 1976-19801976 1979 1980 Absolute %
Participants 160 196 254 94 58.8
Non-Participants 100 161 145 45 45.0
1.6 Project impact on monthly earnings per worker
Table 7.4 presents information on monthly earnings per worker
for the Participants and Control Groups in Santa Ana in 1976, 1979 and
1980. In each of the 3 periods the average earnings of Project Participants
are higher but the rate of increase is lower for Participants than for
the Control Group. Using the same regression analysis, we found that
between 1976-1979, although on average there was no significant difference
in the absolute amount of earnings between the Participants and the
Control Group, there is some evidence that the project had a positive
effect on the earnings of the lower income group, the effect being

-134-
less as income increased. The regression results are included in
Table 7 of Annex 1 and are illustrated in Figure 4. It can be
seen that for average earnings up to 219 colones, the Participants
experienced a positive effect compared with the Control Group, but that
above this level the effect was negative. This includes about 85
percent of the Participants. However, as this effect was only found
for the 1976-1979 period, it is not clear how important it is or
how it should be interpreted. A similar result was found in Sonsonate
but in this case for the 1977 and 1980 period. As the effect appeared
in both cities over a 3-year period it can be very tentatively hypothe-
sized that lower income workers may achieve some positive impact from
the project during the early stages but that this may not continue
over a longer period.
Table 7.4: MONTHLY EARNINGS PER WORKER IN SANTA ANA.1976, 1979, and 1980
(Colones)
% Change1976 1979 1980 1976-79 1976-80
Participants 159 248 309 55.5 94.3
Non-Participants 130 211 275 62.3 111.5
Note: Figures have been rounded.
1.7 Project impact on labor force participation rates
Table 7.5 presents information on the average number of employed
persons per family in Santa Ana in 1976, 1979 and 1980. The average

-135-
number of employed persons falls steadily for both Participants and the
Control Group but the rate of decline is very slightly faster for the
Control Group. As a consequence, whilst both groups had an average
of 2.4 workers per family in 1976, by 1980 the average had fallen
to 1.9 for Participant families and 1.7 for Control families. The
difference between the two groups is too small to attach any great
importance to it.
Table 7.5: AVERAGE NUMBER OF EMPLOYED PERSONS PER FAMILY
No. of1976 1979 1980 families
Participants 2.4(291) 2.0(241) 1.9(232) 119
Non-Participants 2.4(384) 2.0(320) 1.7(283) 162
A great difference is found when we examine labor force particip-
ation of spouses. Table 7.6 shows that whilst there was no change in the
number of project spouses who were in the labor force (employed or looking
for work), there was a drop of almost 30 percent in the proportion of control
family spouses in the labor force (a decline from 60 to 44 in the sample).
There was a corresponding increase in the number of control spouses who
declared themselves to be housewives in 1980. An interesting question ís
why many more control spouses should drop out of the labor force. To ask
the question in the other way: was there anything in the dynamics of the
project which encouraged spouses to remain in the labor force?

-136-
Table 7.6: EMPLOYMENT STATUS OF SPOUSE
Participant Non-Participant1976 1979 1980 1970 1979 1980
Employed 45 48 49 50 55 43
Unemployed 7 3 3 10 5 1
Economically Active 1/ 52 51 52 60 60 44
Housewife 28 23 23 46 49 63
Others 2/ 39 45 44 56 53 55
TOTAL 119 119 119 162 162 162
1/ Employed plus unemployed.2/ Mostly non-existent. Otherwise, none of the above categories
or no information.
At this point we do not have the answer but one hypothesis
is that the need to cover the increased housing payments gave spouses
in the Project more incentive to continue working or to enter the labor
market.
Conclusions: The overall impact of the project onincome and employment
The findings presented in this section are inconclusive and
difficult to interpret. Although there is no evidence of an overall
project impact on income or employment, there are some tentative indic-
ations of potential impact on certain sub-groups. It was found, for
example, that poorer participant families seem to obtain a proportionately
greater increase in total income than do the slightly wealthier families.
It also appears that the earnings of the secondary workers in the
project are higher than those in the Control Group. An analysis of
labor force participation suggests that some of these income differences

137-
may be due to the fact that more secondary workers in the Control Group
left the labor force than did among Participants. This was a particularly
strong effect with respect to spouses where there was a marked drop
in labor force participation in the Control Group but almost no change
among the Participants.
None of the above effects were very strong or consistent.
It seems that much of the income difference (in as far as it exists)
is due to higher labor force participation among secondary workers
and particularly spouses. We do not yet have sufficient evidence
to know whether this difference is due to selection biases (for example
that Participants are more motivated to continue working) or whether
the effect is produced by something which happens after families enter
the project. As stated earlier, all of these possibilities require
further research It should also be stated that El Salvador was under-
going an extremely difficult economic and political period during the
years covered by the research, so that it is difficult to know whether
the observed impacts are a product of this particular socio-political
context or reflect some more general characteristics of the Project.
2. Impact of House Construction on Income and Employment
One of the ways in which the project was expected to influence
income and employment was through the generation of demand for labor
during the construction of project houses. It was anticipated that
construction could affect income and employment in the following ways:
(M) Persons hired directly or indirectly by thecontractors who build the core units.
(ii) Contracts which the FSDVM supported cooperativesreceive from subcontractors or directly frorm theFSDVM.
-138-
(iii) The value of manpower contributed by participantsduring the mutual help stage.
(iv) Labor hired by families to complete the constructionof the house during the self-help stage.
It is possible there will be indirect effects such as the
increased demand for consumer goods as a result of the additional
employment generated during the construction phase, but these indirect
effects will not be considered in this section. We will now summarize
the results of studies which try to estimate the magnitude of the
four factors outlined above.
2.1 Hiring of Labor by Subcontractors
Table 7.8 presents information on the employment generated by
subcontractors in the "La Periquera" project in Santa Ana.
Aceording to the information provided by the contractor, there
were a total of 85 persons hired full time for a period of 12 months, and
a total of 111 piece-rate workers who worked for 8 months. This
represents a total of 1,908 man/months.
In all, the sub-contractor paid C 478,368 in wages to his
personnel. The highest daily wage was C 50.00 paid to the engineer
and the lowest was C 5.60 and C 5.62 paid to watchmen, metal workers,
laborers, cleaning personnel, water carriers and mechanical assistants.
The average daily wage for all personnel was C 8.11, giving C 250.00 per
month.
Table 7.9 provides similar information for the projects in Sonsonate
and Usulutan. In these two projects 1,330 and 420 man/months of employment
were generated.

- 139 -
Table 7.8: ESTIMATION OF SALARIES, TIME EMPLOYED AND NUMBER OF WORKERSEMPLOYED BY THE CONTRACTOR IN THE PROJECT "LA PERIQUERA"
IN SANTA ANA
No. of Months of TotalPersonnel People Daily Wage Work (4) Income (3)
Engineer (1) 1 C 50.00 12 C 18.000
Assistant to engineer andtopographer (1) 2 30.00 24 21.600
Equipment operator (1) 2 16.00 24. 11.520
Foreman (1) 3 14.00 36 15.120
Mechanic (1) 1 10.00 12 3.600
Carpenter (1) 2 9.54 24 6.868
Storekeeper, assistant totopographer, equipmentoperator, driver, deputyforeman (1) 11 8.00 132 31.680
Office Assistant (1) 1 7.00 12 2.520
Clerk (1) 1 6.80 12 2.448
Assistant foreman (1) 3 6.00 36 6.480
Watchmen, mechanic, unskilledworkmen, water carriers (1) 57 5.62 684 115.322
Assistant mechanic (1) 1 5.60 12 2.016
Bricklayers (2) 60 10.00 480 144.000
Plumber (2) 6 10.00 48 14.399
Bricklayers assistant (2) 15 9.00 120 32.398
Unskilled workers (2) 30 7.00 240 50.397
TOTAL 196 1.908 478.368
Average Daíly Salary 8.11
Note: (1) Hired for 12 months. Monthly salary daily salary x 30.(2) Hired for 8 months. Monthly salary = daily salary x 30.(3) Total income = Monthly salary x months of work(4) Months of work = No. of people x months contracted.
Source: Department of Supervision and Construction. Income estimated by Unidad deEvaluacion Socio-Economica.

Table 7.9: ESTIMATION OF SALARIES, TIME EMPLOYED AND NUMBER OF WORKERS EMPLOYED BYTHE CONTRACTOR IN THE PROJECTS "SENSUNAPAN" (SONSONATE) AND "EL NARANJO" (USULUTAN)
S E N S U N A P A N E L N A R A N J ONo. of Months No. of MonthsPeople Daily Wage Total Income of Work People Daily Wage Total Income of Work
Engineer 1 C 50.00 C 10.500 7 1 C 50.00 C 12.000 8
Topographer 1 40.00 8.400 7 1 30.00 4.500 5
Assistant to Engineer 1 30.00 7.260 7 1 30.00 8.300 8
Foreman 2 14.00 5.879 14 1 14.00 3.359 8
Bricklayer, plumber 44 10.00 65.997 220 16 10.00 24.000 80
Carpenter 2 9.54 3.472 14 1 9.54 2.289 8
Storekeeper, assistantto topographer,equipment operator,driver, deputy foreman 9 8.00 15.111 63 3 8.00 5.759 24
Bricklayers assistant 40 9.50 56.997 200 8 6.00 7.199 40
Watchman, mechanic,unskilled workmen andwater carriers 110 5.62 129.816 770 27 5.62 36.518 216
Assistant storekeeper,Watchmen 4 5.60 4.076 28
Equipment Operator 1 16.00 3.839 8
Assistant to topograher 3 10.00 4.500 15
TOTAL 214 307.508 1.330 63 112.263 420
Average 7.80

-141-
2.2 Income Obtained Under the Contracts Received by the Cooperatives
The cooperative "El Progreso R.L." received 3 contracts for the
manufacture of wash-sinks, doors, angles and butts, respectively (Table 7.10).
In the case of the wash-sinks the laborer was paid C 10.00 per sink and he
was responsible for paying his assistant. The contract was for 1,000 sinks
and the total income paid to manpower was therefore C 10,000.
We have no direct information concerning the number of persons
who were employed, but the contract specified delivery of 200 units per
month, which suggests that it was not possible to employ more than 10
workers with their assistants, for 5 months. The only member of the
cooperative who worked on this contract was the foreman; in other cases
the cooperative acted as an intermediary for hiring non-member workers.
On the assumption that one worker and his assistant built one
sink per day, the contract would produce a total of 60 to 70 man/months
of work.
In contracts for wooden articles, a group of approximately
10 carpenters were employed, all members of the cooperative. We have
no information concerning the total wages paid or the duration of the
contracts, but given the fact that the total value of the two contracts
was C 16,570, it was probable that wages would have a total value of
between C 5,000 and C 10,000 and that the contract would have lasted from
4 to 6 months, thus giving a total of between 40 and 60 man/months.
To resume, it can be estimated that the 3 contracts received by
the cooperatives created employment for 20 to 30 persons, giving a total
of 100 to 130 man/months. Income paid to manpower had a value of between
C 15,000 and C 20,000.
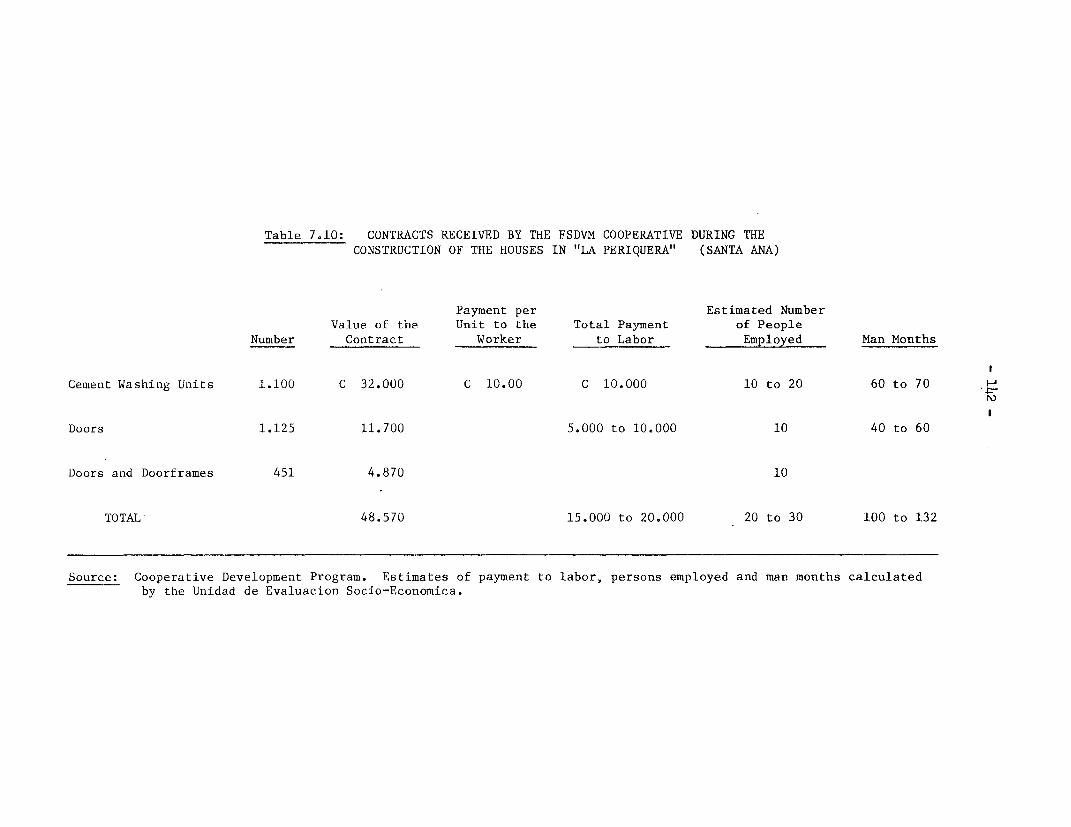
Table 7.10: CONTRACTS RECEIVED BY THE FSDVM COOPERATIVE DURING THECONSTRUCTION OF THE HOUSES IN "LA PERIQUERA" (SANTA ANA)
Payment per Estimated NumberValue of the Unit to the Total Payment of People
Number Contract Worker to Labor Employed Man Months
Cement Washing Units 1.100 C 32.000 C 10.00 C 10.000 10 to 20 60 to 70
Doors 1.125 11.700 5.000 to 10.000 10 40 to 60
Doors and Doorframes 451 4.870 10
TOTAL 48.570 15.000 to 20.000 20 to 30 100 to 132
Souree: Cooperative Development Program. Estimates of payment to labor, persons employed and man months calculatedby the Unidad de Evaluacion Socio-Economica.

-143-
2.3 The Value Credited to Families for Their Participation inMutual Help Work Days
In accordance with the methodology of the FSDVM each of the
1,190 families who were to receive a housing unit had to participate
in the mutual aid stage. There were 1.5 work days per week during
approximately 3 months. This represents a total of approximately
64,260 work days (2,461 man/months). In the pre-cost study for the
project a value of C 359,267 was assigned to the mutual aid stage,
equivalent to an income of C 5.5 per day or C 302 per family during
the entire stage.
2.4 The Value of Labor Hired by the Families During the Self-Help Phase
It is estimated that on average families hired C 480 of
labor for the completion of the house during the self-help phase.
This figure includes both hired labor and the imputed value of unpaid
family labor.
2.5 Estimating the Total Value of Income and Employment Generated
Table 7.11 summarizes available information on the amount of
income and employment generated during the contractor phase, cooperative
subcontracts, mutual help and hiring of labor by the family to complete
the house. It is estimated that on average the construction of each house
generates C 1243 ($497) of income and 6.4 months of employment. For the
total project of 7000 units and in 1980 prices the construction of the
houses will generate approximately $4,160,000 of income and 3700 person/
years of employment. The largest contribution is labor hired by the
family during the self-help phase which represents 38.6 percent of
income generated. This is followed by the contractor phase with 32.9
percent and the mutual help phase with 27.5 percent.

Table 7.11: ESTIMATION OF INCOME AND PERSON/MONTHS OF EMPLOYMENT GENERATED BYHOUSE CONSTRUCTION IN THREE FSDVM PROJECTS
La Periquera Sensunapan El Naranjo Mean Income/Santa Ana Sonsonate Usulutan Months Per Family
Number of Units 1190 563 435
Contractor ConstructionPerson/months of employment 1908 1330 420 1.7Income (Colones) 478.368 307.508 112.263 410
Construction CooperativePerson/months 130 0.1Income (Colones) 20.000 9.1 1
Mutual HelpPerson/months 2471 1673 1342 2.5Income 392.267 217.580 174.550 343
Labor hired by the FamilyPerson/months 2600 1200 950 2.2Income (Colones) 571.200 270.240 208.800 480
TOTALPerson/months 7109 4203 2712 6.4Income (Colones) 1.428.835 795.318 495.613 1243
Project Cost 3.921.818 1.817.087 1.504.136 3310
Investment Required to Generate
C 100 of Income 364 228 303 316
Investment Required to GenerateOne Month of Employment (Colones) 551 432 554 516

-145-
It should be noted there is considerable variation from one
project to another. This is largely due to differences in the topographic
nature of the project site and the resulting capital/labor ratio of
the contractor. When we compare the three projects we find that in
Sonsonate contractor payment to labor represented 16.9 percent of project
costs whereas the figure was only 12.2 percent in Santa Ana and 7.4
percent in Usulutan.
3. Impact of the Project on Expenditure Patterns
It had been hypothesized that one negative effect of the
project might be that increased expenditures on housing would force
families to spend less on food, medicines and other basic necessities.
Table 7.12 compares changes in expenditure patterns of participants and
the control group between 1976 and 1980. It can be seen that monthly
expenditure on housing increased significantly more for participants than
for the control group. The increase for participants was from C 3.95 per
capita in 1976 to C 5.7 per capita in 1980. However, there was no
observable difference between Participants and the Control Group in
changes of expenditures on food, medicine or transport. One
of the reasons why participants were able to spend more on housing without
being obliged to reduce expenditures on items such as food is that
participation in the project tended to increase the amount of income
transfers received from relatives. Kaufmann (1981) estimated that on
average a female headed household would receive an additional 40 colones
($16) a month in transfers if the household participated in the project.
These results suggest that to date there is no evidence that
the project is producing negative effects by forcing families to reduce
expenditures on other basic necessities.

-146-
Table 7.12: CHANGES IN PER CAPITA EXPENDITURE ON HOUSING, FOOD, MEDICINE,AND TRANSPORT BETWEEN 1976 AND 1980.
COMPARISON OF PARTICIPANTS AND CONTROL GROUP, SANTA ANA
Per Capita Monthly Expenditureof Participants (Colones)
Statistical Comparison1976 1980 % Increase With Control Group
Housing 3.95 5.7 +144 Participants have greaterincrease.
Food 24.6 55.0 +223 No statistical differencebetween the two groups.
Medicine 0.83 3.03 +365 No statistical differencebetween the two groups.
Transport 1.14 2.50 +219 No statistical differencebetween the two groups.

-147-
4. Impact of the Project on Social Participation
Table 7.13 summarizes information on participation in different
types of organization for Participants and Control Groups in 1980 and
the changes from 1976. This information was difficult to obtain given
the extremely turbulent political events of 1979 and 1980 in El Salvador.
Many people did not wish to provide information on the groups to which
they belonged, particularly those types of group in any way related to
politics. For this reason the information must be interpreted with
caution as it almost certainly underestimates participation levels.
It can be seen from the table that in general, participation
in formal organizations tends to be low. Ten percent or less of
both Participants and Control Groups claimed to be a member of a sports
club, cooperative, trade union or political party. About one third of
each group claimed a religious affiliation. The major difference in
1980 was that about three quarters of Participants were members of a
community organization compared with only about,5 percent of the
Control Group.
When we examine differences between the two groups in terms
of changes between 1976 and 1980 no clear pattern emerges. The main
effect of the project has been to involve most families in a community
organization but there has been little noticeable effect on participation
in other types of organizations. There is no clear explanation of why
participation in religious organizations should have dropped, except
the fact that the Church was actively involved in the political changes
during the past two years so that many people may not have wished to
admit religious affiliation.

Table 7.13: PARTICIPATION IN ORGANIZATIONS 1976-1980.COMPARISON OF PARTICIPANTS AND CONTROL GROUP. SANTA ANA
Percent DifferenceType of Control Control in Change
Organization Group Participants Group Participants Participants-Control
Sport 8.6% 10.7% +4.3% +7.2% +2.9
Religious 37.7 35.2 +8.6 -7.0 -15.6
Coop 7.3 5.6 +0.2 -0.5 -0.7
Trade Union 4.6 10.2 0 -1.5 -1.5
PoliticalParty 0.9 0.5 -3.1 -1.5 +1.6
CommunityOrganization 5.2 73.5 +1.5 +48.2 +46.7
Average 10.7 22.6 +1.9 +7.4 +5.6

-149-
5. Project Impact on Crowding
Table 7.14 compares the project and the control areas in terms
of indicators of crowding. The lot area per capita is less than one
quarter of that in colonias ilegales and only slightly higher than for
tugurios. The number of square meters of roof per capita is substantially
higher than tugurios and slightly higher than mesones but almost 60 percent
less than colonias. A similar pattern emerges when we compare persons per
room. The tugurio is worse with 4 persons per room followed by the meson
with 3. The project only has an average of 2.5 persons per room whilst the
colonia is lowest with 2 persons.
Table 7.15 summarizes the effect of the move to the project on
crowding. It can be seen that in the project families have an additional
4.6 m2 of roof area per person and the number of persons per room drops
by about 2. This means that the move to the project meant a significant
lessening of crowding. The changes are very substantial because Participant
families had larger than average families when they lived previously in
mesones. Their average household size was 6.1 compared with an average of
only 3.7 for all meson families. Also, the participants in their previous
dwellings seemed to have a lower than average roofed area than the control
group, about 28.5 m2 against 38.2.
6. Families Opinions About Project Impact on Their Lives
Families in both the Project and Control Groups were asked
to indicate whether compared with 2 years ago their present living
conditions were better, the same or worse. Table 7.16 presents
the results for both Participants and Control Groups. A summary

- 150 -
Table 7.14: INDICATORS OF CROWDING. COMPARISON OF THE PROJECTWITH INFORMAL HOUSING. SANTA ANA 1980.
Median Values for 1980
Meson Colonia Tugurio Project
2• lot/person 50.0 12.0 13.6
2• roof/person 9.3 14.3 6.0 9.6
Person/room 2.9 2.0 4.1 2.5

-151-
Table 7.15: CHANGES IN DENSITY INDICATORS FOR PROJECT PARTICIPANTS.COMPARISON BETWEEN PREVIOUS RESIDENCE IN 1976
AND PROJECT IN 1980. SANTA ANA.
Changes 1976-1980 in Median Values
Participants WhoAll Project Previously LivedParticipants in Mesones
2M Roof Area/Person + 4.8 + 4.8
Persons/Room - 2.5 - 2.2

Table 7.16: OPINIONS ABOUT CHANGES IN CONDITIONS DURING THE PAST TWO YEARS.COMPARISON OF PARTICIPANTS AND CONTROL GROUP. SANTA ANA. 1980
Compared with two yearsago your conditions
are now: Summary
Better Same Worse 100= Best Possible% % % Percent O = Worst Possible
Control 51.8 21.8 24.6 61.9Family Income
Participants 62.8 20.9 16.3 73.2
Control 26.1 43.9 30.1 48.3Employment
Participants 29.1 48.5 22.4 53.5
Control 27.9 56.4 15.6 56.2dealth
Participants 37.2 43.4 19.4 59.1
Control 9.8 12.9 77.3 16.5Family Expenses
Participants 7.7 7.7 84.7 11.9
Social Ambience Participants 79.1 9.7 11.2 8.4
Control 28.9 33.7 36.9 45.7Summary of Changes
Participants 34.2 30.1 28.7 49.4
-153-
index was developed to permit a synthesis of the different opinions
to obtain an overall view of change.
When we compare the proportion of families who consider their
conditions have improved we find a slightly higher proportion of
participants (34.2 percent compared with 28.9 percent) on all 4 indices.
The greatest differences between participants and non-participants occur
with respect to family income (11 percent more participants consider they
are better off) and health (9.3 percent more participants consider they
are better off). This indicates some tendency for participants to feel
the project has improved their living conditions. The area in which
participants are most positive refers to social ambience where 79.1
percent felt there had been an improvement since they moved to the
project.

-154-
CHAPTER 8
EVALUATING THE EFFICIENCY OF PROJECT DESIGN
1. Differences between the FSDVM and traditional housing designs
The continual search by the FSDVM to find ways of making
shelter accessible to the low-income population has led to continuing
experimentation with alternative designs and has created a number of
major differences between FSDVM housing and traditional public housing
programs. The following are some of the main differences:
(a) Single family units which are not completed by the FSDVM but
are sold at various stages of their development to be completed
by the family. Families have the option to receive a serviced
lot with sanitary core; a serviced lot with a sanitary core
and additional constructed area or a "complete house" with2
about 33 m of construction.
(b) Grouping of houses around parks or green areas which both
serve as access to the interior plots, and also provide semi-
private recreation areas. These mini-parks are supplemented by
larger open spaces in the community which are used for a
variety of community activities.
(e) High priority is given to the provision and design of public
spaces, and these occupy a higher proportion of the land
area than is the case in most housing projects.
(d) Significant reductions in the proportion of land assigned
to vehicular traffic and parking.
(e) Priority is given to creating the projects on a human scale
with studies being conducted to determine the needs and priorities
of the families who will live there. This is reflected in
-155-
the lot sizes, width and quality of streets, level of infra-
structure, etc. Plot areas are normally between 60 m2 and 75 m2
with a frontage of 5 meters and a depth of between 12 and
15 meters. The plots are designed to be as regular in shape as
possible. Most circulation is achieved by means of footpaths
with a very limited vehicular access. In some projects there
is only one paved access road. Footpaths have a width of
between two and three meters with an addítional depth of about
2.5 meters at the front of the plot on which there is originally
no construction (although most families tend to build on this
later).
(f) Water and sanitary services are provided in the traditional
way with individual water connections and water borne
sanitation. Electricity and drainage are also provided on each
plot.
2. Methods used by the FSDVM to reduce costs
As has been shown in other chapters (see Chapters 4 and 13) the
costs of FSDVM shelter units are substantially lower than those of any public
or private housing produced by more traditional methods. These reductions can
be attributed in part to the design developed by the FSDVM and its efficient
execution by participants, and in part to the economies the families themselves
are able to make during the house consolidation process. The following are
some of the key factors in achieving cost reductions:
a. Land Use and Services. Land is one of the scarcest resources in
El Salvador, particularly in the Metropolitan Area. This is due to the
absence of any land use policy and to the retention of large areas for

-156-
speculative purposes by major land owners. This has led the FSDVM to seek
methods to reduce the impact of land values on the cost of the total shelter
package. The following are some of the methods used:
(i) Design of projects with the highest possible densities consistent
with maintenance of a satisfactory living environment. This is
achieved through: increasing the sales area, two storey units,
reduction of the frontage of the lot, concentration of lots
around communal areas and design of larger projects. Experiments
have also been conducted with provision of communal services
such as clothes washing facilities. The success of these
policies is shown by the fact that sales area as a proportion of
total project area has increased from 50 percent in the first
projects to almost 70 percent in the newest projects (Table
8.1). At the same time there has been a steady increase in the
number of units per hectare.
(ii) Studies conducted by the FSDVM have shown that the number
of units per hectare is less when rectangular-block designs
are used with vehicular roads surrounding each block. 1/
It has also been found that 4 storey multi-family dwellings do
not always increase densities (and in fact often have lower
densities than the FSDVM) but do increase costs. For example
IVU's major 4 storey ZACAMIL project only achieves densities
about 10 percent higher than recent FSDVM projects and almost
50 percent lower than the FSDVM 2 storey project (See Table 8.2).
1/ Design is discussed in detail in FSDVM, "Analisis del proceso evolutivoy soluciones autonomas" Vol I and II, 1976/79. This study comparesthe FSDVM with public and private housing programs in terms of designand land use.

Table 8.1: SUMMARY OF COMPARATIVE DESIGN INDICATORS FOR FSDVM PROJECTS, IVU, FSV AND FNV
Year 1972 1974 1975 1975 1977 1978 1968 1967 1977 1973 1977 1977Institution FSDVM FSDVM FSDVM FSDVM FSDVM FSDVM IVU IVU FSV FSV FSV FNV
Project SJP PEP PER SEN PRE CON AMA ZAC* OCT* CRE SJF JSCINDICATOR UNIT
Sales Area 48 50 59 66 69 62 62 15 21 60 49 38 % of Project
Public Areas 51 49 40 333 31 38 37 85 79 39 51 62 % of Project
Communal Areas 22 21 21 23 17 23 10 65 67 15 11 32 % of Project
Circulation 29 28 19 10 14 15 27 19 12 23 40 30 % of Project
Lots 77 79 81 64 78 40 92 - - 41 56 - Lots/Hectare
Units 77 80 83 69 82 140 92 94 55 41 85 86 Units/Hectare
CirculationNetwork 664 580 511 289 407 547 704 463 376 452 611 690 Meters/Hectare @
VehicularNetwork 68 32 65 11 47 22 96 60 66 107 99 83 Meters/Hectare
PedestrianNetwork 597 547 445 289 360 525 608 403 310 344 512 607 Meters/Hectare
Solid WasteDisposal Pipe 7.9 6.0 4.2 4.1 4.0 5.4 4.9 2.9 9.2 5.5 8.2 8.8 Meters/Unit
Drinking WaterPipe 6.5 5.4 4.6 4.2 4.0 3.1 5.4 3.2 9.2 5.6 8.2 9.9 Meters/Unit
Construction asProportion ofTotal Cost 69 31 45 37 40 50 58 71 60 68 60 79 % of Total Cost
Sales Price 2018 2510 3484 2900 3912 4058 4002 7000 15000 8763 9800 21950
-158-
One of the main reasons why costs increase with vertical
construction is that it is necessary to use stronger materials,
leave larger spaces between buildings and increase the
proportion of land devoted to public areas, thus reducing
the saleable area.
(iii) Projects which group houses around small communal parks
giving access to the interior houses obtain a more
efficient land utilization. They also reduce infrastructure
costs, particularly in terms of the number of meters of
pipe required to provide services to each dwelling. This
design also reduces the land devoted to vehicular traffic
and again reduces cost in this respect.
(iv) Small green areas and parks are maintained more efficiently
and used more intensively than large park areas. The
smaller areas are designed on a more human scale and create
a sense of responsibility on the part of the families for
their maintenance. On the other hand large park areas tend
to be less used and to require more expensive upkeep.
b. Design and construction methods used by participants. A poor
family buying a house always faces a conflict between their needs and
level of expectations and their purchasing capacity. The FSDVM has
tried to design projects which satisfy basic shelter needs but at the
same time have tried to limit the level of expectation of participants.
Families have been encouraged (in earlier projects) to bring
materials from their previous dwelling, and in general to use cheaper
materials.

-159-
Recently some of the studies have suggested that social pressures
may exist in some projects for families to invest more in housing than
they are able. It has been suggested that this might affect accessibility
of poorer families although there is as yet no firm evidence on this
point. 1/ Several proposals were made as to how this pressute could be
controlled, among which:
(a) Actively encouraging families to bring materials from their
previous dwelling (if they lived in a squatter settlement)
and providing transport to help move the materíals.
(b) Reserving sectors of the project for lower-income families
so as to reduce the social pressures.
(c) Further research on low-cost materials (see the following section).
c. Amount of construction provided by the FSDVM. Initially it had been
assumed that one way to reduce costs was to provide a serviced plot with no
construction so that the families could construct in the way they chose,
economizing on the types of materials used. Experience has shown,
however, that poorer families prefer to receive a more completed house
as they have difficulties mobilizing the resources to complete the
construction. It has been the economically better off families who prefer
to receive just the serviced lot.
This conclusion is also partly due to the fact that there is a much
greater use of hired labor than had been supposed, so that cost saving through
use of own labor is much less than had been expected.
These findings suggest the following policy options:
(1) Provide a more complete unit for poorer families.
1/ Unidad de Evaluation, "Demand Study in Apopa", FSDVM 1979.

-160-
(ii) Provide greater material and labor loans so that families can
complete construction with funds provided within the project.
(iii) Find ways to encourage greater use of own labor.
d. Types of construction materials. The FSDVM uses traditional
construction materials: bricks, cement, roofs of asbestos or cement,
cement floors and windows of aluminum and glass. All of these are
without any special finish. The FSDVM has conducted research on the
development of construction materials using locally produced materials 1/
but the conclusion has been that although a certain cost reduction has
sometimes been achieved, the results are very difficult to apply on a
national scale as a study is required on each project site to determine
which types of materials are available. The types of soil and rock vary
considerbly from one region of the country to another.
e. Mutual help and self-help construction. As will be shown in
Chapter 10 the use of mutual help and self-help construction makes an
important contribution to cost reduction and project accessibility.
3. Design Innovations
Although the basic project design has proved very economic
and accessible to participants, the FSDVM continues to experiment
with new designs. Three reasons have motivated this reserch. First,
rising costs of land and materials means there is a constant struggle
to avoid cost escalation. Second, there still exists at least one
fifth of the urban population who are too poor to be able to afford the
FSDVM project options. Third, is it becoming clear that the market is
1/ The reserch project was supported by the Organization of AmericanStates.

-161-
segmented into a number of different sectors and there is no single
ideal design which appeals to everyone. Two major innovations are
currently being experimented with and will be discussed here.
The first of these is the provision of two-storey units.
This has been tried in the "Conacaste" project in the North of San
Salvador. The project is located in a densely populated low-income
area and is very well located in terms of access to urban services.
Because of its good location the cost of land per meter is relatively
high. The plots have 4 meters of frontage and are 8 meters deep and are
concentrated around a patio. The ground floor is provided through
mutual-help construction and the second floor is built either by
mutual-help or self-help. The lower floor area of construction is
25 m2 and it is possible to build an additional 20 m2 on the second
floor. To date the reactions to this project have been very positive
and the project has achieved the highest population density of any
shelter design with acceptable standards in the country. The two
storey design does however involve a certain increase of costs due
to the more solid structural construction which must be provided. The
project has been able to achieve a density of 140 units per hectare as
compared with 94 for IVU's 4 storey apartment buildings and 82 which was
the highest previous FSDVM density.
The second design innovation is the adaptation of a traditional
and already existing meson (tenement house). The first project of this
kind, "El Progreso", is located very close to "Conacaste". The meson was
bought by the FSDVM, renovated and sold to the families who are presently
renting. Originally, the meson had a large open area which was underutilized.
There were two toilets and two showers and water taps. The physical

-162-
condition was very poor. The community was involved from the planning
stage and participated actively in the construction and administration.
The redesign involved the renovation of existing rooms, the construction of
new rooms, a wash basin for each family and a shower-toilet for every
two families. Ownership is now in the form of a condominium. It was
possible to achieve all of this with an increase of only about 20
percent in the monthly payment. 1/
This project is potentially very attractive given the fact
that more than 75 percent of the low-income population live in
mesones, many of which are very well located. The cost of
rehabilitation can potentially be less than for the provision of
completely new units. The FSDVM studies 1/ have also shown the
existing system of exploitation and social control which exists in the
meson with the family being at the mercy of the landlord and his
agent (mesonero). The transference of ownership thus also produces
very positive social changes. One question which arises in the
interpretation of the results of the meson experiment is the fact that
this meson was relatively unique in that it had a large area of
unutilized land which could easily be used to construct more rooms.
This is normally not the case so the cost figures from this project
may be somewhat misleading and may underrepresent the costs of
applying this type of project on a large scale.
4. Evidence on Participants' Satisfaction with Design
Table 8.2 presents a comparison of participants' satisfaction
with design and services as compared with families in other types of
1/ Aida Herrera and Francisco Altschul, "Proyecto Experimental deRehabilitacion del Meson El Progreso", FSDVM 1979.
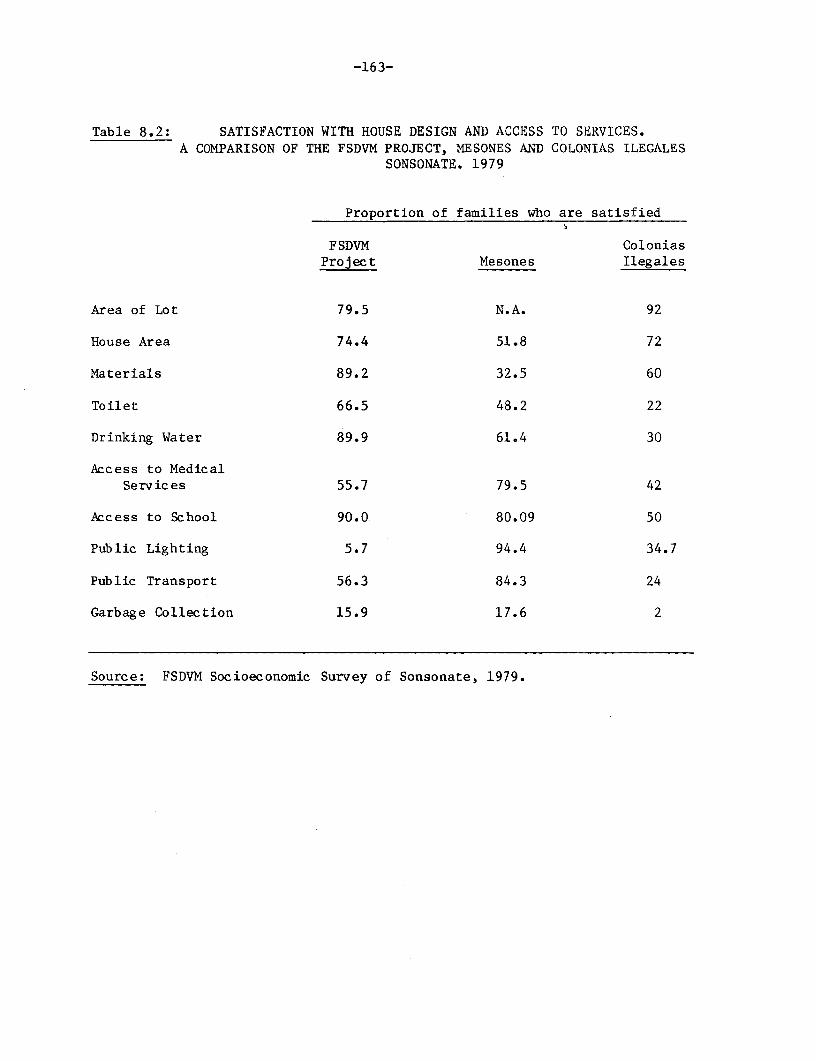
-163-
Table 8.2: SATISFACTION WITH HOUSE DESIGN AND ACCESS TO SERVICES.A COMPARISON OF THE FSDVM PROJECT, MESONES AND COLONIAS ILEGALES
SONSONATE. 1979
Proportion of families who are satisfied
FSDVM ColoniasProject Mesones Ilegales
Area of Lot 79.5 N.A. 92
House Area 74.4 51.8 72
Materials 89.2 32.5 60
Toilet 66.5 48.2 22
Drinking Water 89.9 61.4 30
Access to MedicalServices 55.7 79.5 42
Access to School 90.0 80.09 50
Public Lighting 5.7 94.4 34.7
Public Transport 56.3 84.3 24
Garbage Collection 15.9 17.6 2
Source: FSDVM Socioeconomic Survey of Sonsonate, 1979.
-164-
informal housing. In comparison with mesones (the type of housing
where most project participants previously lived) the project is ranked
as being more satisfactory except in terms of access to medical services,
public transport, public lighting and garbage disposal. In terms
of area of the house, materials, access to water and sanitation
the project was considered to be superior.
When compared with the colonias ilegales the project ís
ranked more favorably except in terms of lot size and access to
public lighting.
Participants also considered that the project had produced
improvements in health and the social environment.

-165-
CHAPTER 9
SELECTION OF PARTICIPANTS
1. Description of the Selection Process
The selection system has changed over time, so this section
presents a summary of the typical procedures, indicating what are the
main changes which have been introduced.
(a) Demand studies to determine the type of project of most interest
and to estimate the level of demand. Although this is not
directly part of the selection process it is closely related.
The reactions of the target populatioti to the different types of
option, and to participation in mutual help, have influenced the
way in which the selection procedures have been implemented.
In earlier projects such as Usulutan, where this study was not
done before selection began, a number of major problems arose
and selection criteria had to be modified half-way through
the selection process. 1/ In the recent and larger projects,
the demand studies have been quite substantial and have had
an important influence on the design of the project, division
of selection and implementation into various stages and to
some extent the selection criteria. 2/
(b) Recruitment of community promotors. The promotors who will
be responsible for the community development and mutual help
programs are also responsible for the selection. It is
1/ FSDVM/DEDRB, "Analysis of the Level of Demand for Low Cost Housingin Usulutan," DEDRB. Urban and Regional Report No. ME-2.
2/ For example, in Acajutla the demand studies recommended involvingfishing cooperatives in the selection process. In Apopa (SanSalvador) it was recommended that the selection should give specialpriority to squatter settlements.

-166-
believed that using this procedure will ensure more reliable
information and accurate selection. One promotor will normally
be employed for every 150 families in the project.
(c) Publicity campaign: The target population usually consists of
all low-income families in the city who do not already own a
house. To inform this group of the project, a publicity
campaign is developed using radio, newspapers, cinemas, schools
and community organizations. Personal visits are made by
promotors to most of the major low-income areas.
(d) Orientation and pre-inseription: Interested families are
invited to attend initial orientation sessions in which a brief
description of the project is given. If they are interested
they can complete a pre-inscription form and will be invited to
a more formal orientation session. The procedures vary somewhat,
and in some cases there will be no follow-up session but
ínstead the family will be invited to complete an application
form giving information on income, family size, etc. The form
is very brief, normally only one page.
(e) Pre-selection: On the basis of the information provided on the
application form, a pre-selection will be made. Normally the
following criteria will be used: (i) income must fall within
specified limits (for example between $40 and $240 per month);
(ii) the family must live within the city.
(f) Socio-economic interview with pre-selected families: An
individual interview will be conducted with each of the
pre-selected families by one of the promotors. Ideally the

-167-
interview is conducted in the applicant's house so that
a check can be made on the economic conditions of the family.
Sometimes, due to time pressure, the interview is conducted in
the FSDVM office (always in the city where the project is being
started).
(g) Selection of participants and reserves: The final selection
normally takes into account the following criteria: (i) income;
(ií) stable family group (normally a couple with or without
children or one parent and children), (iii) size of family
group. Often it is required there are at least 3 or even
4 people in the family. In some cases a maximum size is
also specified. (iv) The family does not already own a house;
(v) the family lives within the limits of the city. In some
cases there is a requirement that the family has lived in the
city for at least two years (to avoid rural to urban migration).
(vi) Willingness to participate in the mutual help construction
work groups. (vii) In some projects the participants' prior
experience in community development or other organizational
activities may also be taken into account.
Until recently the selection was done manually with the
preparation of large charts, but computer selection systems are
now being developed. Participants are selected as well as
reserves who will become eligible if participants drop-out.
Selected families are advised by telegram and asked to come to
the FSDVM office.

-168-
(h) Formal orientation sessions: Participants are invited to
attend 4 orientation sessions in which detailed information
is given on different aspects of the project. The meetings
cover topics such as project costs and financial obligations of
participants, legal aspects such as land tenure and ownership,
social and community development.
The meetings are part of the selection process in that some
families may decide to drop out of the project once they have
become more informed as to the costs and the type of house.
(i) Division of participants into residential/work groups: The
final stage of selection consists of dividing participants into
residential groups of about 25 families. The families will live
either in houses surrounding a small park, or will face each
other along a road or pathway. All families will work together
during the mutual help construction stage. Care is taken to
make each group heterogeneous with families with different types
of occupation, both male and female headed households, etc.
Skilled workers will also be distributed as evenly as possible
between groups.
2. Example of a Typical Selection Process: Santa Ana
Table 9.1 summarizes the main selection stages used in Santa
Ana. One-thousand twenty-seven plots were available in the first stage of
the project. After the publicity campaign 4950 applicants obtained a form
inviting them to an initial meeting. Of these only 3674 actually came to
the meeting and all took an application form, but only 2920 returned the

Table 9.1: PRINCIPAL STAGES IN THE SELECTION PROCESS. SANTA ANA. 1976.
No. Activity Description No. of families
1 Publicity Distributing general inform- All low-incomeation on project population
2 Invitation to meeting Form giving date, time of 4950meeting
3 Orientation talks Information on costs, type 3674of house, etc.
4 Application forms Giving out application 3674
5 Return of application Completed applications 2920
6 Pre-selection Selection of applicants for 2106socio-economic interview
7 Socio-economie interview Visits to houses to inter- 1804view families
8 Selection Selection of participants 1027on the basis of the inter-view schedule
9 Formal orientation Series of talks on different 898aspects of the project
10 Presentation of form Participants indicate which 808indicating which option of the housing options theyselected would like to select
Source: FSDVM, "Evaluation of the causes of absenteeism and resignation offamilies selected for the "La Periquera" project in Santa Ana".Unidad de Evaluacion. Report No. 1, May 1976.
-170-
application. Two thousand one hundred and six of the applicants were
considered to satisfy the conditions required but it was only possible to
conduct a socio-economic interview with 1804 of them as the others could
not be located. One thousand twenty seven of these were selected for the
project and asked to come to the formal orientation sessions but in fact
only 898 did come and only 808 completed the form indicating which of the
types of house they would prefer.
Thus out of 4950 initially interested families only 808 finally
entered the project during the first selection phase. Even more families
dropped out when the mutual help construction began. This shows that
selection is a long and arduous process with high drop-out rates at all
stages. The process must continue long after the original families were
selected as there will be a continual need to replace drop-outs.
3. General Evaluation of the Selection Procedures
In general the FSDVM selection procedures seemed to have worked
well in that they appear to be fair and to select families within the
target income ranges. Considerable investment of resources is devoted to
the initial orientation and personal contact, and although this may make
the selection go somewhat more slowly, the end results seem to have been
very satisfactory. A good indicator of the effective selection procedures
is the fact that once families complete the construction of the house, the
drop-out rate is extremely low (See Chapter 6) indicating that all families
have the capacity to pay and are genuinely interested in the project. This
combined with the fact that almost all families are within the target
income range indicates the selection works well.

-171-
The following are some issues relating to selection:
(a) A major source of drop-out during the selection process
are the families who cannot be relocated. Addresses are
not very precise and as a result many eligible families are
simply lost.
(b) Until now only earned income has been taken into account
in estimating family income and capacity to pay. Studies
by Lindauer and Kaufmann have shown that substantial income
transfers take place within the extended family group and that
these tend to increase by as much as 20 percent the income of
many low income families, particularly female headed households.
If these sources of income are taken into account, more poor
families might become eligible for the project.
(c) There has been a continuing debate as to whether participation
in mutual help construction should be a necessary requirement
for selection. Whílst the whole logic of the FSDVM program is
based on community participation, there is strong evidence that
a substantial number of otherwise eligible families may be
excluded from the project. This is a difficult issue but one
which deserves further consideration.
(d) Despite the increasing size of projects, there has been
resistence within the FSDVM to the computerization of the
selection process as it was felt that the human element would
be excluded and a purely mechanistic approach developed. The
concern arises from the fact that the personal judgment of
the promotor plays an important part in the selection. Ways

-17 2-
exist to permit the judgement of the promotor to be
included whilst at the same time computerizing the
selection. 1/ This issue will need to be solved as the
size of the projects continues to grow.
1/ One simple approach is to code the promotors opinion as to whetherthe family should be selected or not. The selection would then bemade in terms of the normal weighting of selection criteria, butindividual attention would be given to all cases where the promotorsopinion was inconsistent with the recommendations based on theweighting system.
-173-
CHAPTER 10
MUTUAL HELP AND SELF-HELP
Introduction
The basic principle of the FSDVM's work methodology is
progressive development, which consists of building a house in stages,
making use of the potential resources of the family. Various types
of housing units are built; they include:
1. Sites with infrastructure.
2. Sites with services and a sanitary unit.
3. Sites with services, a sanitary unit and constructedareas which range from 18 to 36 square meters in size.
Each site has a surface area of between 60 and 90 square
meters, a sewerage system, tap water, storm drains and individual
electrical installations.
The construction process in FSDVM housing developments includes
four stages:
1. Project preparation
2. Construction by contractors
3. Construction by means of mutual help
4. Construction by means of self-help
The present chapter only presents the results of the evaluation
for stages 3 and 4.
Mutual Help
The housing units are built by groups of particípants organized
under the direction of a social worker and a building technician. Normally

-174-
there are between 15 and 25 families per group. The number of groups in
each project and the basic criteria used to assign individuals to one
group or another depend on:
1. The number of housing units to be built
2. The extent of specialized manpower available
3. The amount of work to be carried out by mutual help (squaremeters of construction).
At the same time as the housing units are being built, the
work of promotion centers on two activities: work days and training
meetings. The former take place on weekends, the main activity being
the building of housing units; the latter are held once a week, their
purpose being to discuss problems related to construction and to teach
the techniques of working in groups and the importance of organization
for the future development of the community.
The essential purpose of this stage of activity is to create
the basic conditions necessary to render the housing units habitable,
and from the social point of view to lay the foundations for the develop-
ment of self-management by the community.
Self-Help
The fundamental aim of this stage is to consolidate the housing
units. Generally this work is done individually by families; although in a
few cases the mutual help organization used in the previous stage may
continue.
THE RESULTS OF MUTUAL HELP
This section summarizes the most important findings of the studies
of mutual help carried out in two FSDVM housing projects.
The FSDVM uses mutual help programs for two main reasons: to
incorporate low-income urban sectors into housing programs and to

-175-
use the experience of working in construction groups to initiate
a process of organization in the communities thus created. From the
earliest days of the institution, al.l its housing projects, which to
date include a total of 12,500 housing units, have been built by means
of mutual help and self help programs. In this way, the combined
efforts of participants and Foundation have made it possible tQ include
families who would never have been able to participate in any of the
public housing programs. The accepted and proven basic hypothesis
is that these programs have facilitated the participation of families
who, because of theír scanty financial resources, have no access to
public housing prograns which require a down-payment as a condition
of participation.
Mutual help has increased project affordability in two ways:
1. By the elimination of a cash down payment it has made it
possible to include participants from the lowest 20 percent
of the income scale. Of those who participate in FSDVM
programs, only very few have any savings; in the El Pepeto
project only 12 percent had savings, and in Santa Ana
only 40 percent. These savings themselves are so modest
that they can only partially cover the costs of house
consolidation. It is interesting to note that 75 percent of
participants in one of the projects (La Presita) consider mutual
help to be the factor that made their participation possible.
2. Construction by means of progressive development is a low-
cost method compared to the formal housing construction
sector (see below).

-176-
2.1 The programming and execution of the work
The duration of the entire process is defined in terms of the
number of man-months required for construction as carried out by a
construction company. In most cases construction has been programmed
to be completed in 1.5 man-months. In the earliest projects the work
took longer than the schedule provided; Sensunapan, for example, involved
variations of up to 35 percent depending on the work group involved.
Table 10.1 shows different time periods required by work groups to
complete various scheduled tasks.
The reasons detected are:
1. Bad organization and administration. Commencement of the work
with incomplete groups and the existence of problems relating
to the collection and distribution of materials.
2. Absenteeism of participants from work days. The highest rate
of absenteeism was 15 percent.
3. Lack of trained manpower and/or tools. Inequitative distribution
of specialized workers and of male and female participants.
Over this period of time a substantial improvement has been
observed in the relationship between programming and execution. The
San Miguel project, built later than the Sonsonate one, was completed
10 percent earlier than the programmed date. According to the
technical experts, the contributing factors are:
1. A better distribution and assignment of individuals to
groups with respect to trained manpower and sex.
2. Greater attention of social promotion to responsibility in work,
and social awareness training.

-177-
Table 10.1: SCHEDULED AND REQUIRED TIME (WEEKENDS) FOR THE PERFORMANCEOF MUTUAL HELP CONSTRUCTION TASKS BY THREE GROUPS
SONSONATE 1977
Time SpentScheduled (Weekends)Periods Group Group Group
Construction Stage (Weekends) 9 5 24 Average
1. Layout & Staking 12 10 14 19 14
2. Excavation 13 10 14 19 14
3. Foundation(concrete) 15 10 14 19 14
4. Walls 28 26 30 33 30
5. Vertical Structures(roof) 16 33 33 35 34
6. Horizontal Structures(roof) 16 33 33 35 34
7. Sheet covering (roof) 16 33 34 36 34
8. Floor 15 20 20 47 29

-178-
3. The introduction of certain changes in technical aspects:
(a) elimination from mutual help of 3 construction processes
which require a certain level of expertise: marking out,
excavations and the casting of foundation supports, and (b) the
introduction of mechanized systems for the collection and
distribution of materials.
2.2 Economic Aspects
Mutual help can be justified economically on the ground that
it replaces a down payment and makes possible the participation of many
poorer families who would otherwise be unable to save the C$450 which
is the amount of the down payment on the house. The studies carried out
show that approximately 60 percent of the participants who work on the
project have a money-earning activity on weekends and that 45 percent of
these families lose income when they have to participate. When the economic
benefits of mutual help are estimated, 1/ one of the most interesting
results is that mutual help generates a type of tax in which the better-off
families lose money and the poorer families receive a net profit. 2/ In
some of the projects this sacrifice led to certain open tensions both
during the work days and at the training sessions. In Sonsonate, for
example, many heads of families trained in construction work did not
attend, and sent their wives to work instead, which directly influenced the
length of time required to complete the work.
1/ "Evaluation of Mutual Help and its functions in the process ofsocial change. The case of Sonsonate." FSDVM, July 1977.
2/ "An economic evaluation of sites and services programs and ofconstruction by means of progressive development as housingproduction systems with the aim of reaching low-income groups,and their potential application as part of a national housingpolicy." FSDVM. July 1977.

-179-
Financing. In most proj.ects at least half of the families have
funds available for purchasing materials. Although the amount they
receive as a materials loan is relatively low (varying from 150 to 900
colones), this serves as a stimulus to the families to produce the
additional amount needed from other sources such as wages and savings.
In one of the projects studied, El Pepeto, "A total of 50 percent of the
families provide their own financing at the start of construction; of
this 38 percent invest part of their wages, 12 percent use savings, and
the rest a combination of the two". 1/
A cost-benefit analysis showed that the only other type of
housing produced in the country which is comparable to that of the FSDVM
sites and services programs, in terms of costs and quality, is the colonia
ilegal. The colonia also reaches poorer families since the land can be
acquired through a low monthly payment although with a shorter repayment
period (averaging 7 years) and the family can build a more economical form
of shelter if they wish. The major differences between the two systems
are: the colonias, since they are built illegally, do not include basic
urban services at the time they are built; these are incorporated later,
after periods of time which vary from one settlement to another; nor are
they assigned institutional financing for the acquisition and consolidation
of the housing units.
1/ Analysis of the development process and of autonomous solutions.El Pepeto Project, Vol. II.

-180-
Social Aspects
From the social point of view, FSDVM hopes that in training
participants in the techniques of group work mutual help will create
an organizational foundation for the future development of the community.
The participants joined the program with no previous experience.
Their basic aim is to obtain proper housing and to escape from the problems
of the meson or squatter settlement. In the beginning, they show no
evidence of collective attitude or feeling, and perceive the new community
as a result of their own efforts and not as a result of the work of groups.
As the first months of work go by, they begin to discover the importance of
organization and of working in groups for the solution of problems, while
maintaining their orientation towards immediate goals -- the construction
of their housing. Studies have shown that once the mutual help process has
finished a change in attitude becomes apparent; most participants then
perceive it as a process which has made it possible for them to form
relationships with other persons, to solve group problems, and, in general,
accept it as a valuable experience and feel the need to continue working in
groups. See Table 10.2.
To summarize, the conclusions concerning mutual help are:
1. It facilitates the participation of families from the lowest
income sectors who have never been reached by formal housing
programs. The elimination of the down payment is the major
factor in enabling families from the lowest 20 percent of the
income scale to join the projects.
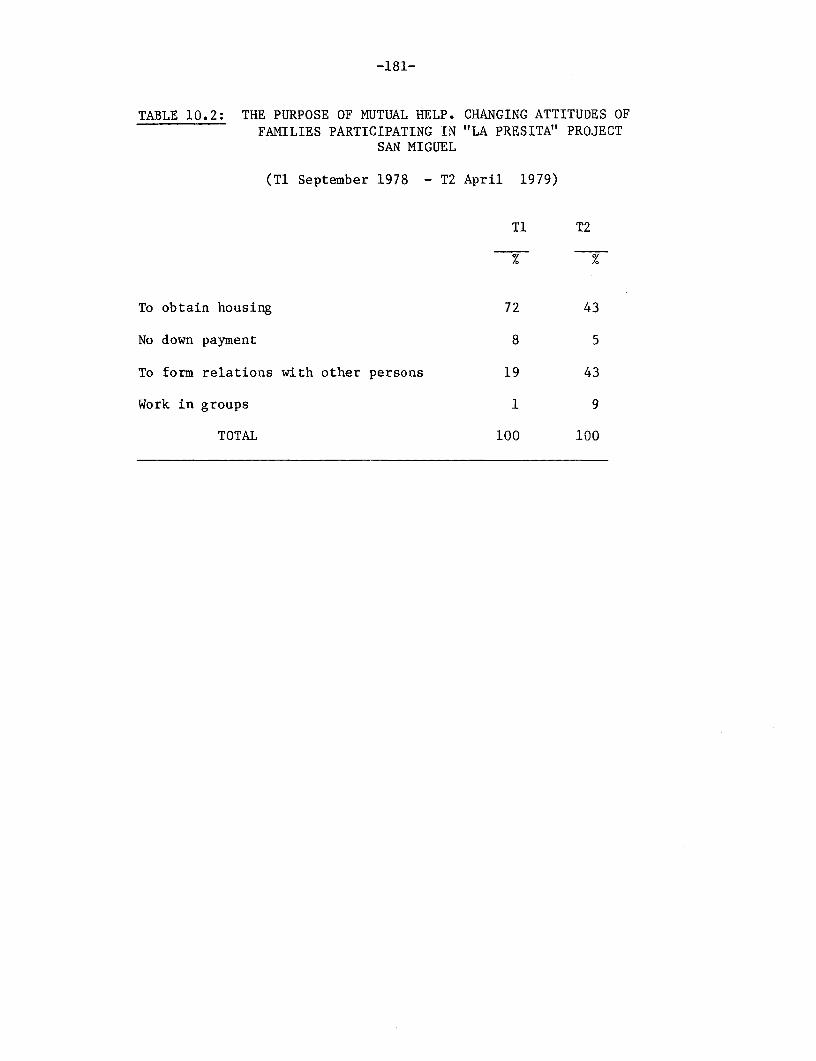
-181-
TABLE 10.2: THE PURPOSE OF MUTUAL HELP. CHANGING ATTITUDES OFFAMILIES PARTICIPATING IN "LA PRESITA" PROJECT
SAN MIGUEL
(Ti September 1978 - T2 April 1979)
Ti T2
To obtain housing 72 43
No down payment 8 5
To form relations with other persons 19 43
Work in groups 1 9
TOTAL 100 100

-182-
2. It mobilizes under-utilized resources, directing them towards
the housing sector. Once the families have acquired a basic
unit, help is usually forthcoming from relatives and others in
the form of building materials or labor.
3. It facilitates, through house construction a process of education
and consciousness raising which helps restore the concept of
responsibilty. Some of the economic benefits which result from
this include:
(a) The default rate for FSDVM project participants is one of
the lowest for any Bank housing project.
(b) It has made it possible to use popular participation in
order to obtain basic services and to maintain them.
Organized pressure in the San Miguel, El Pepeto and Lamatepec
projects has helped obtain urban services.
4. Two problems encountered in the mutual help process
are:
(i) Delays in completion of the houses mean manyfamilies must continue to pay rent for a longerperiod.
(ii) For many families, who carry out income-producingactivities on weekends, mutual help representsa constraint.
THE RESULTS OF SELF-HELP. THE PHYSICAL CONSOLIDATION OFTHE HOUSING UNITS.
The FSDVM delivers to the families incomplete housing units
to be completed over a period of time in accordance with the needs and
financial resources of the families. By the time the families move into

-183-
the new housing units they will have built an average area of 30 square
meters, the minimum area required to render the units habitable. From
then onwards, a process of improvements and enlargements begins. This is
generally carried out individually using the family's own resources.
Physical Development
The studies show that almost all families (90 percent) add
extensions to the new housing unit. These generally include an
additional bedroom which is completed before moving in, which more or less
doubles the total constructed area.
The following is the order of priority for most families in
the improvement of their houses.
(a) Enlargement of living space.
(b) Security and family privacy.
(c) improvements in terms of physical (aesthetic) appearance.
This process occurs in approximately the same form and at the
same speed in all the projects. At the end of two years the families
have built a total roofed area of 35 to 40 square meters; of this total,
15 to 20 square meters correspond to the self-help period. It would
seem that 35 to 40 square meters is an acceptable area to most of the
families. Although there are differences in the initial areas the families
receive, depending on the types of units, this acceptable area is usually
achieved un two years.
After achieving the 40 square meters of roofed construction,
most of the further improvements the families plan to carry out are
related to the appearance and decoration of the house.

-184-
In general, the quality of housing in the FSDVM projects
is considerably higher than in the informal settlements and of equal
quality to that in the formal sector. (See Chapter 4).
Consolidation Costs
In order to test the efficiency of progressive development
as a method of housing construction for the poorer economíc sectors,
studies were carried out which made a comparison between:
a) Expenditure made by the family in building materials and
labor when building their housing unit themselves; and
b) An estimate based on budgets for materials and labor
at market prices which the same housing unit would have
cost the family.
In both cases studies show that the families save approximately
35 percent by building their houses themselves as shown in Table 10.3.
The factors contributing to this reduction in cost are:
1. The families buy the materials for the basic housing structures
at prices lower than the corresponding market prices. For
certain accessories for the house they use second-hand materials
in good condition. Estimates show that a 30 percent cost
reduction is achieved in this way.
2. There is a reduction of approximately 50% in the total cost of
labor at market prices; this is due basically to two factors:
(a) the use of labor by family members trained during the
mutual help process; (b) the exchange of favors generated
between members of the community. In general, both these
methods are used.
-185-
Although estimates of labor costs for this project did not take
into consideration the shadow price of manpower, studies carried out in
Sonsonate estimated that labor in the form of mutual help resulted in a
saving of 27 percent for the FSDVM, compared to labor supplied by
contractors, and that even taking into account the longest delay encountered
by certain groups (35 percent), the family saved 12 percent by building
their own house instead of paying a contractor. The comparison includes
only the direct cost of labor without adding the profit margin (assumed
to be from 10 to 33 percent) obtained by the construction company.
Satisfaction with Housing
In all the projects built there has been a high level of
satisfaction with all the different components of the housing unit; in
most cases the level of satisfaction in the FSDVM projects is higher than
that observed in colonias ilegales or mesones, but the latter competes
favorably in terms of urban services, since it is located within the city
limits.
The great majority of the participants (75 percent) stated
that their new house had brought about many positive changes in the
living conditions of the family. The reasons given include security of
tenure, more peaceful surroundings, better conditions of hygiene and a
better social ambience.

-186-
Table 10.3: COMPARISON OF THE COSTS OF HOUSING CONSOLIDATION BYMEANS OF DIRECT FAMILY INVESTMENT AND AT FORMAL
MARKET PRICES. THREE TYPES OF HOUSING UNIT.
Direct InvestmentFamily at Market Relative
Investment * Prices ** SavingC$ C$
Basic Unit 1287 2030 37%
Sanitary Unit 1271 2370 46%
Site and Services 2821 3454 19%
-k Real investment made by the family.** Investment estimated on the basis of unit costs at formal
market prices.
Source: Analysis of the development process and of autonomoussolutions. El Pepeto Project. Vol. II. FSDVM. 1978.

-187-
CHAPTER 11
COST RECOVERY
The FSDVM probably has one of the best loan repayment records of
any World Bank financed shelter program. As of July 1980 total payments
in arrears represented only 2.3 percent of the total loan portfolio. The
information is presented in more detall in Table 11.1. This shows that
out of a total of C$15,276,400 which should have been collected by the
end of June, 1980, only C$345,717 was in arrears. Table 11.2 shows that
most of the amount overdue represents only 2 or 3 payments in arrears and
only 22.4 percent of families are more than 90 days in arrears.
The FSDVM combines strict collection procedures with the development
of a high sense of social responsibility. This has meant that although
many families occasionally fall into arrears for short periods due to
economic difficulties, very few fall so far into arrears that they cannot
catch up. The situation is particularly impressive as the collection rate
appears to have been improving over time. 1/ Once families become established
in the project a definite payment routine is established and most families
comply strictly.
The question should be asked as to why the FSDVM repayments position
is so much better than most projects of this kind. The following reasons
can be given:
1. The FSDVM is a private organization and is thus free from someof the bureaucratic constraints and political pressures whichmake collection more difficult in many government agencies.
2. The FSDVM is non-profit and does not have a large reserve soa high repayment rate is absolutely essential if the programis to continue operating. This means there is more motivationto collect than in many organizations.
1/ Since 1980 the default rate has begun to rise as a consequence of thepolitical instability.

Table 11.1: DEBT REPAYMENT BY FSDVM PROJECT PARTICIPANTS. NUMBER OF FAMILIES IN ARREARS ANDAMOUNT OWED BY PERIOD OVERDUE. ALL FSDVM PROJECTS AT JUNE 1980.
Number of families Amount Owed (Colones)Percent Percent Percent of
Percent families in Amount of total outstandingTime Overdue No. all families in arrears C$ to be paid debt
30 days 1185 26.6 33.1 114,971 0.8 33.3
60 days 844 19.0 23.6 75,526 0.5 21.8
90 days 549 12.3 15.4 49,098 0.3 14.2
120 days 334 7.5 9.4 31,507 0.2 9.1
150 days 208 4.7 5.8 20,695 0.1 6.0 X
180 days 120 2.7 3.4 14,011 0.1 4.1
Over 180 days 333 7.5 9.3 39,905 0.3 11.5
TOTAL 3572 80.3 100.0 345,717 2.3 100.0
Total familiesin the project 4450
Total amount dueto be paid 15,276,440
Source: FSDVM 22nd report to World Bank on the Advance of the First Loan. July 1980.

-189-
Table 11.2: PROPORTION OF PARTICIPANTS IN ARREARS ON LOAN REPAYMENTSBY TIME AND NUMBER OF PAYMENTS IN ARREARS.
ALL FSDVM PROJECTS.
June 1980
Number of Cumulative ProportionTime Overdue Payments Overdue of all Participants (%)
Over 180 days 7 or more 7.5
Over 150 days 6 10.2
Over 120 days 5 14.9
Over 90 days 4 22.4
Over 60 days 3 34.7
Over 30 days 2 53.7
Less than 30 days 1 80.8
Source: FSDVM 22nd report to World Bank on the Advance of the FirstLoan. July 1980.
-190-
3. Relatively tough and highly visible measures are used to pressurefamilies to pay. Although it has rarely been necessary to resortto evietion, a lawyer will visit the family when they fall too farbehind.
4. An important contributing factor has been the efficient adminis-trative systems of the FSDVM. Records are computerized so thatthere is an up to date report on the payment status of eachhousehold. In addition the FSDVM employs fulltime collectors whovisit each house every month. This helps create a regular routineas well as providing constant pressure on any potential defaulters.
5. The FSDVM devotes considerable time and resources to the developmentof community institutions and a sense of community responsibilityfor the maintenance and development of the project. One of themain ways in which this is achieved is through the requirementthat all participants work together with their neighbors toconstruct the core house through mutual help. It is believed thatthe sense of responsibility for the project which is developedduring this phase makes an important contribution to the low defaultrates. In several projects the community has even taken over theresponsibility for the collection of the loan payments.
6. Until now the organization has remained relatively small soit has been easier to maintain a close supervision of debtcollection.
7. Careful selection of partícipants to ensure they have the capacityto pay is another important factor.
Studies suggest that in a new project the default rate tends to be
higher but that it drops once families become established in the community
and the payment routine is developed.
One final point with respect to the relationship between community
organization and loan repayment should be stressed. Although in general
the community organizations have helped considerably with loan repayments,
there have also been several cases where the communities have organized them-
selves against the FSDVM to resist making payments until certain basic
services such as water were provided. The point is that an active community

-191-
is not a passive tool of program management, if the program is generally
progressing well, as in the case in El Salvador, the community can be very
cooperative, but if a project is facing delays or the community is not
satisfied, it is quite likely that the higher the level of community
organization the lower the rate of loan repayment.

-192-
CHAPTER 12
THE EFFICIENCY AND EFFECTIVENESS OF EMPLOYMENT ANDINCOME GENERATING COMPONENTS
When the Bank project was planned it was intended to affect
income and employment generation both directly and indirectly. The
indirect effects were expected through the generation of employment
during the construction process and through additional income which
would subsequently be earned by people who had learned new construction
skills during the mutual help construction phase. The impact of the
construction of the houses on employment has been discussed in Chapter 7.
As yet we do not have firm information on whether the new construction
skills learned during the mutual help have had any subsequent effect on
income or employment.
The purpose of this chapter is to review the direct effects of
FSDVM programs designed specifically to promote income and
employment. Initially it was intended to develop cooperatives and also
to provide credit and technical assistance in small business development.
The second of these activities was never really developed by the FSDVM
although a small business loan program was developed by FEDECREDITO
with financial support from the World Bank. This chapter will therefore
be limited to a review of the FSDVM cooperative program. 1/ The FSDVM
cooperative program is not intended purely as an economie program but
is intended to have five main objectives:
1/ This section is based on FSDVM Report No. 17, "Effectiveness of theCooperative as a Medium for Social Change and the Definition ofthe Alternatives for Action for the Community Enterprises Program",2 Volumes, December 1977.

-193-
(a) To improve the economic conditions of the participatingfamilies.
(b) To promote self-management and community control 1/ of themeans of production.
(c) To contribute to the development of an organizational baseand to act as a unifying factor in the promotion of communityand intercommunity organizations.
(d) To raise the level of social awareness.
(e) To develop model projects with the aim of demonstrating,firstly, that it is technically feasible to develop economicprojects based on the concept of self-management, but that,secondly, the existing structural barriers seriously limitthe possibility of applying the model on a larger scale.On the basis of this experience, it is hoped to convinceand pressure decision making groups to eliminate or reducesome of these barriers.
The Impact of the Cooperative Program
The evaluation of the FSDVM cooperative program contains a
chapter reviewing the experience of other cooperative programs. The
review shows the tremendous difficulties which cooperatives have faced
in trying to reach the low-income population. In fact most programs in
both urban and rural areas have come to the conclusion that the lowest
income groups are too high a risk and have concentrated their efforts on
higher income groups. Despite this experience of other organizations,
the aim of the FSDVM program is to reach the economically marginal groups.
The report concludes:
"...it is difficult to think of a less propitiouscondition for the development of a cooperative pro-gram. But this was the context in which FSDVM, with-out experience, with no fixed budget assigned to theprogram, and with very limited personnel, decidedto undertake the development of cooperatives."
1/ The Spanish term "auto-gestion" can mean self-management of an organizationby its members, or community control of such an organization; the termused will therefore vary according to the particular context.

-194-
The Number and Types of Cooperatives Which Have Been Organized
The analysis covers the period up to November 1977. Since
then considerable progress has been made in experimenting with alternative
forms of economic organization as well as in the founding of a number of new
cooperatives. Tables 12.1 and 12.2 present the latest information available
in September 1978 although the report itself only refers to those cooperatives
which had been founded prior to November 1977. During the five year
period from 1972 (when the first cooperatives were started) and November
1977 (when the analysis for this study was conducted) the FSDVM had created
a total of 7 cooperatives, a marketing and sales center and an artesan
school. At the time of the study the cooperatives had a total of 629
members. The experimentation with the cooperative model included savings
and loan, consumer, agricultural and production cooperatives. Some type of
cooperative exists in each of the FSDVM projects and in some cases as many
as half the project families have been members (although in no case has a
cooperative involved all families in a project).
Despite a promising start in 1972 the cooperative program
suffered a certain degree of stagnation during the period 1975-1977.
The total number of members fell from 637 in 1975 to 629 in 1977, and
during the same period the social capital only increased from U.S.$11,400
to U.S.$15,314. During the same period one cooperative had to be closed
and most of the others suffered serious administrative problems. In
this context it is important to note that the same pattern of rapid growth
followed by administrative problems and a slow-down, was observed in the
other two major cooperative programs studied (FUNPROCOOP and FEDECACES).

-195-
The Economic Impact
The cooperative model was able to generate employment and
income for 3.5 percent of the economically active population in the first
six projects. Of these 2 percent obtained work for the first time.
In absolute terms the number of people employed in the cooperatives in
1977 was 94 out of a labor force of approximately 2700 (in the first six
FSDVM projects). It should be stressed that only three of the cooperatives
were designed to create employment, the others being consumer or savings
and loans cooperatives.
The Potential for Generating Employment and Income
Three production cooperatives were started by 1977, plus a
technical training school which places graduates in work. The
experience of the three production cooperatives can be summarized as
follows: 1/
(a) A bakery and agricultural production cooperative in a smallrural project
A total of 44 families live in this rural project in the center
of one of the major coffee growing areas. Most of the families had
previously been day laborers during the coffee season and largely unemployed
during the rest of the year.
Initially it had been hoped to create an agricultural cooperative
which could offer work to the majority of the families in this community.
On the basis of studies of availability of land and the difficulties of
1/ Information was not available on the newly founded technical trainingprograms.

-196-
establishing any type of agro-industry, it was decided that it would not
be possible to start a major project in agriculture. However, 11 hectares
of land were rented in 1975 and 12 people have been employed in the
cultivation of maize and black beans (the former being used for the
bakery).
Studies were conducted in 1975 on the consumption and supply
of basic consumer goods, and on the basis of this study it was decided to
start a bakery. A training course was given and as of November 1977,
seven people were employed full time in baking the bread and a further 12
worked part-time on the distribution. Approximately US$120 of bread was
sold every day and the seven bakers received the minimum wage. Distribution
of bread was done on foot and the sales could probably be expanded if
transport was available.
Studies so far suggest the bakery project is economically
viable but with very little prospect of expanding beyond the present work
force.
The agricultural project has been less successful and the
main barrier has been the obtaining of productive land. The only land
which could be obtained is 7 KM from the community and on a steep and
wooded side of a volcano. Clearing the trees was expensive and the land
is difficult to work and not highly productive. There are also major
transportation difficulties. Despite the high level of unemployment,
interest in the project was relatively low and 3 of the 12 workers had to
be hired from outside the community.
Both projects have made an important economic contribution as
they have been able to generate employment outside of the coffee harvest,
which previously had been the almost exclusive form of employment.

-197-
(b) Building construction materials
At the time of the study this cooperative had temporarily been
closed due to administrative problems and the FSDVM was considering the
necessity of assigning their own administrator. Due to these problems
it was not possible to obtain detailed information on the project.
When the cooperative was working it had two main sections,
building materials and carpentry. Most of the building materials were
bought by the FSDVM and the main outlets for carpentry were through
FSDVM construction and the marketing center set up by the FSDVM.
In an earlier study of employment generation in the construction
stage of the FSDVM projects, 1/ an analysis was made of the contracts
received by the cooperative in the La Periquera project in Santa Ana.
The cooperative received three contracts for the construction of cement
washing units, doors, and the wooden frames for doors.
The contract was for 1000 washing units and the cooperative paid
U.S.$4 to the worker for each one. Out of this the worker had to hire
and pay his own assistant. On the assumption that a worker and his
assistant could produce one unit a day, this first contract produced
approximately 60 to 70 man/months of employment at a wage slightly
below the minimum salary.
For the two contacts for wooden products (doors and surrounds)
it is estimated that 40 to 60 man/months of employment were generated
with total salaries of US$2,000 to US$4,000. Information is not
available on the number of hours worked on the production of these wood
items so it is not possible to estimate the daily wage.
1/ FSDVM, "The Effect of Construction and Mutual Help on the Generationof Employment and Income. The Case of the Projects in Santa Ana,Sonsonate and Usulutan." Report No. 4, September 1976 (Revised).
-198-
In summary, the project generated during the construction of
the 1000 housing units a total of 100 to 130 man/months of employment
with total payment to labor of US$6,000 to US$8,000. This represents the
generation of approximately 3-4 days of employment and US$6 to US$8 of
income for every unit built. Similar contracts were received from some of
the other projects.
As the cooperative was highly dependent on the FSDVM, it is
not clear whether it would be able to obtain independent contracts
from other sources. The building construction industry is controlled
by a number of large concerns and it might be difficult to break into the
market. The FSDVM plans to build a maximum of 2000 units per year which
means that possibly 30 people could be employed fulltime, but to make a
more significant impact the cooperative would obviously have to seek
contracts from other sources.
The experience of this cooperative indicates a number of
serious administrative problems which must be faced. Carpenters are
traditionally self-employed and very reluctant to accept discipline and
regular hours. This made it very difficult to comply with contract
dates for large orders and in many cases the lack of discipline was
further complicated by a serious problem of alcoholism. Obtaining
and controling of construction contracts also requires an efficient
administrative system and this is likely to be a problem for a
cooperative which is mainly employing unskilled or semi-skilled
labor with a low educational level.
Despite these problems this type of cooperative clearly has
considerable potential, particularly as the FSDVM construction and
consolidation process offers a substantial and partally protected market.
-199-
(e) Dressmaking and Rugmaking
This project, started in 1974, was in 1977 the largest
employment generator of the FSDVM cooperatives with 50 women-and 2
men working fulltime. The project mainly caters to the tourist trade,
making high quality embroidered shirts and dresses, rugs, etc.
Table 12.3 which is based on interviews with members of the
cooperative suggests that between 1974, when the cooperative started,
and 1977, the incomes of women who had previously been working increased
by 70 percent 1/ whilst the average income for all members (including
those who had not previously been working), more than doubled. The
majority of those previously employed had been working on sub-contract
for a middleman and had earned a very low wage on a piece-rate basis.
The cooperative, by setting up its own marketing system had been
able to eliminate the middleman and hence increase profits to the
workers.
The cooperative seems to be economically viable but will be
dependent upon the FSDVM for a considerable time to provide many
administrative and marketing skills. The dependence upon the FSDVM
and the difficulties of replicating a project which depends on the tourist
trade raise questions as to how far this model could be applied on a
significantly larger scale.
(d) Savings and Loans
To the end of 1976 (the last available figures at the time of
the study) the cooperatives had total assets of C$350,000 (about
1/ Given an increase of about 40 percent in the Cost of Living Index inthat period this represents a net increase of about 30 percent inreal income.

-200-
US$140,000) and a total of C$36,287 (US$15,314) of social capital
(savings and shares of members). As most of the members are too poor
to have previously had access to a cooperative it is difficult to
obtain a yardstick against which this figure may be measured.
The studies show that many of the savings and loans cooperatives,
after a rapid start, later suffered from the effects of a lack of admin-
istration and planning, and, as a result, their growth rates were reduced
by a very high default rate. This rate was steadily being reduced by more
careful management but, at the time of the study, was still requiring most
of the cooperatives to consolidate their position rather than pursue
further growth.
The Cooperative as a Way of Creating Self-Government andCommunity Control of the Means of Production 1/
Neither of the two rural projects had been able to obtain
suitable land for developing agricultural production, and the families
are dependent on the big landowners. Bakeries and other similar
projects can create a certain number of sources of employment, but the
only way real financial autonomy can be achieved is through control
of the land. An analysis of the economic structure shows that there
has been a progressive concentration of land ownership and a continual
dispossession of the small farmer. 2/ The other organizations working
in rural areas have encountered the same problem, and it will be
extremely difficult for the FSDVM to counteract this long-term trend.
Without access to land it is almost impossible to achieve community
control on a significant scale in rural areas.
1/ This section is taken from a report written in 1978. The politicalsituation has changed dramatically since then.
2/ See Volume 2 of original report in Spanish.

-201-
So far, none of the cooperatives have been able to become
completely independent of the FSDVM. In each case the FSDVM covers
certain costs and provides certain administrative or marketing services
which the organization is not yet capable of covering. In all the
cooperatives the educational level of the members is extremely low
and this has made training in administration and marketing, etc. more
difficult. It is seriously questioned whether it is feasible to expect
that the cooperatives will become completely independent and self-managing
when the educational level is so low. Many persons consider that it is
inevitable, at least for a few years, that the FSDVM will have to part-
icipate directly in the administration and management of the cooperatives.
The interviews carried out in Plan Piloto show that almost
all the members consider that the FSDVM must participate directly
in management and administration, either because the community does
not possess the necessary skills or because it is desirable to have
someone from outside to resolve conflicts. All the work of creating
designs and defining markets is done by the FSDVM, and since sales
have been oriented towards the tourist markets and the middle class,
it is difficult for somebody from the community to acquire all the
necessary skills.
Another obstacle to self-management is the paternalistic
attitude of the members, many of whom still feel the need for a patron, and
have looked upon the FSDVM as a surrogate for their previous patron. For
many families, access to a patron is their only hope in a case of emergency,
such as the illness or death of a member of the family, and they therefore
have little desire to give up this source of security.

-202-
In the opinion of the promotors, another reason for the lack
of progress towards self-management has been the FSDVM's failure to
define clearly its policy. For a long time, self-management was not
considered an objective of major importance and more time was spent on
creating new cooperatives or finding markets for the products. It is
possible that there would have been much more progress in this respect if
self-management had really been defined as a high priority objective.
Another limiting factor is the complicated legislation and
organization of the cooperative movement in El Salvador. These regulations
and the way in which the regulating body operates 1/ make it very difficult
for the social sectors with which the FSDVM is working to understand and
comply with all the regulations and the philosophical aspects.
Organizational Development of the Cooperatives and their Potentialas an Integrating Force in the Community
All the cooperatives have at one time or another undergone serious
administrative and/or financial crises. The amount of time and energy
devoted by the FSDVM and the Cooperative Division to the resolution
of these problems has seriously reduced the time available for developing
a stronger community base. The lack of administrative controls often
meant the cooperative was not able to provide up-to-date information to
the members on the financial situation and this caused suspicion and
lack of confidence in the directors.
1/ Annex 2, Monograph 3, Section 5.3 of main report.2/ INSAFOCOOP (Instituto Salvadoreno de Fomento de Cooperativas).

-203-
Despite these set-backs in many of the cooperatives the directors
have made substantial progress in acquiring organizational skills, but
their low-level of education slows down the acquisition of many formal
skills and this ís likely to imply a close involvement by the-FSDVM for
a longer period than had been originally envisaged.
Although the FSDVM perceives the cooperative as a medium for
community integration, most of the members only see its economic functions
and this has made the process of education a slow and difficult one.
Despite the lack of interest in wider issues by most members, substantial
progress has been made in the preparation of a core of leaders in each
cooperative who have a deep understanding of the wider goals of the
cooperative.
None of the cooperatives have served as a base for the develop-
ment of other community organizations, and in most cases relations
between the cooperative and other community organizations have been
non-existent or in some cases even negative. Most of the members see
the cooperative as a way of resolving their own financial problems and
are unwilling to allow too many new members to join, so as not to
reduce their own access to employment. This has caused, in some cases,
resentment among the rest of the community who consider the members to
be a privileged elite keeping themselves aloof from other less fortunate
famílies. This tendency has been re-inforced by the fact that in many
communities a particular group has managed to gain control of the cooperative
and has tried to exclude other groups from entering.
Despite the weakness in developing relationships within the
community, the cooperative has proved to be the most successful means
yet developed by the FSDVM for developing relationships between different

-204-
communities. The economic motivation, which serves as a divisive factor
at the level of the community, has served as a bond between groups in
different communities (for example dress-makers, carpenters, etc.)
In terms of achieving the FSDVM's wider organization goals the
cooperative has the advantage that it is not necessary to restrict member-
ship to one geographical area and hence has greater organizational flexibility
than a housing program which is innevitably restricted to given geographical
areas.
Development of Social Awareness
For the FSDVM the creating of a higher level of social and
political consciousness is one of the main goals of the cooperative. Until
now the small scale of the cooperatives has limited their direct confrontation
with the realities of the political and economic system; therefore, there has
been little opportunity for education of the members in the understanding
of these wider problems. The following are indications of the ways in which
the cooperatives may be starting to encourage understanding of these problems:
(a) Many of the dressmakers and embroiderers who work with "PlanPiloto" had previously worked through middlemen and receivedvery low pay for many hours of very hard work. Through theirexperience in the cooperative they have realized how much moneythe owners of enterprises make. Several of them say that theowner obtains all the profits from the workers' labor and thatthey have no share in the profits.
(b) Recently, when there was a disagreement between the members of"Plan Piloto" many of the members talked about organizing astrike. Then they began to think about who they were strikingagainst, and realized they would be striking against themselves.This provided an important lesson in the concept of control ofthe means of production. This is an important experience becausemany of the members still do not feel they are the owners of thecooperative; this is one of the reasons for the conflicts betweenthe members and the board of directors.

-205-
(c) In the rural cooperative, where the more direct control by theland-owners over access to land and employment would seem to bringthe cooperative more directly into conflict with the economicrealities, it is much more difficult to detect any changes in thelevel of social and political awareness of the members. It issuggested in the report that this is due at least in part tothe fear of the members to openly express their views as thiswould probably prejudice their future employment opportunities.
(d) In several cooperatives, the members have seen the effects ofofficial intervention in the control of the cooperatives.Several of the members have expressed their doubts as tothe suitability of the cooperative in its present form asa means of achieving social change, since their scope foraction is limited by legal and official controls. There hasbeen talk of the need for a different type of organizationthat would really allow community autonomy and would make itpossible for the community to convert the cooperative (orcommunal enterprise) into a more powerful social force.
The Principal Causes of the Problems Faced by the Cooperative Program
The problems of the cooperative program can be divided into
two groups: external problems caused by structural factors beyond
the control of the FSDVM, and internal problems caused by the
methodology of the FSDVM and the ways in which it operates.
(a) External Factors
The most serious problem is the acute poverty in which most
of the families live, and the economic and political factors that
maintain this inequitative structure. Poor families are unable to
accumulate capital by investing their savings in a business. Also, when
a family is living on the breadline, inevitably it has to think about its
more pressing needs and thus cannot concern itself with the more general
situation. It is for this reason that most of the families consider the
cooperative as a means of solving their own financial problems and would
therefore like to limit the entry of new members in order to protect
their own access to jobs.

-206-
In rural areas, the monopoly control of land and of the means of
production greatly reduces the possibility of achieving improvements and
community control, and serves to reinforce an attitude of dependency. The
two rural cooperatives have been unable to acquire land for agricultural
development.
The low income levels also reduce the market for production
cooperatives. Many of the families spend 80 percent or more of their
income on housing and food and have no money to spend on other things.
The low level of internal demand in the country means that many projects
will have to be oriented towards the export market, but this is a much
more difficult field for a small company to get into.
The high level of unemployment is an eKtremely serious problem
for the participants and this is particularly true in rural areas. The
abundance of labor enables the employers to pay subsistence wages and
the situation provides a dramatic illustration of the effects of having
a reserve army of the employed. In many cases, landowners do not even
comply with their legal obligation to pay the minimum wage, and the
workers, since they have no alternative, have to accept the conditions
imposed.
The political situation also is unpropitious for a program
oriented towards social development and community participation. The
possibilities for forming grass-roots organizations and the open
discussion of political matters are severely limited.
The legal and philosophical structure of cooperativism in
El Salvador also creates problems. The philosophy is too sophisticated
for most of the members to comprehend, nor is it directly applicable to

-207-
the Salvadorean situation. Some of the administrative requirements for the
formation of a cooperative are excessively demanding and it is therefore
questioned whether cooperatives are really the most appropriate means of
achieving the economic and social development of the poorer sectors.
(b) Internal Factors
In the opinion of the personnel of the Community Enterprises
Department, the most serious internal problem has been the FSDVM's
failure to define its policy with respect to the cooperative program.
This made it impossible to systematically develop a working strategy, and
has been one of the causes of many of the other problems. This lack of
clear orientation is still felt, and is evident in the lack of attention to
education programs, in the low priority given to the definition of a systematic
methodology aimed at achieving self-management and in the lack of criteria
to aid in the selection of the type of project to be carried out.
In almost all the cooperatives, the administrative systems
have been inadequate, and at least at one time, the FSDVM had no control
over the finances involved. In almost all cases this lack of control
led to financial losses, and on several occasions to accusations that
somebody had taken personal advantage of the situation.
There has been very little continuity of promotors. This
is due in part to the limited budget of the Department and also
to numerous changes in the personnel.
In the early stages of all the savings and loan and consumer
cooperatives, there was great interest in increasing the volume of loans

-208-
or credit. As a result credit was given to many persons whose need
for such credit was acute, but who were not able to repay. Almost all
the cooperatives have hígh arrearage, and many of the debts are unrecover-
able. This has led to a serious loss of capital and has created a
negative atmosphere. Obviously the FSDVM cannot simply ignore these
debts, but the effect is that the directors of the cooperatives have to
spend a great deal of time and effort to loan repayment.
In their eagerness to develop more cooperatives, the FSDVM
pressured those interested to find other families, in order to obtain
the number of members necessary to legalize the cooperative. The
result has been that many cooperatives started with a very weak base
and in one case the cooperative never recovered and had to be closed
down, while in almost all the others the organization is still suffering
the results of this initial hastiness.
In many of the cooperatives a situation has developed where the
organization is dependent on the FSDVM, because the cooperative is unable to
cover all its administrative costs. The FSDVM often provides personnel
without charge, or directly pays other expenses such as rent, transport
or machinery. In the short run this policy may be justified to give the
cooperatives an initial impulse, but in the long term it can lead to
economic dependence. As it is the FSDVM still makes many of the important
decisions concerning marketing, investment, etc. In the inteviews with
FEDECACES it was emphasized that this policy of covering certain costs was,
in their opinion, one of the main mistakes they made at first, and they
recommended that the FSDVM should avoid falling into the same trap.

-209-
The FSDVM has not been able to devote sufficient time to member
education and as a result many of the members only see the economic aspects
of the cooperative and are unaware of its social functions.
Although this was not evaluated in the present study, there
is concern within the Department that the emphasis of the training
courses is excessively "developmentalist" and does not give sufficient
weight to criticism of the present economic and political system.
In the past, there was poor coordination between the program
and the Social Action Division. This problem has been solved, but
it meant that many of the cooperatives were not properly integrated
into the social development policy of the FSDVM.
There were various changes in the directors and advisors
assigned to the cooperative program, and this led to a certain lack
of continuity in policy and orientation.

Table 12.1: DETAILS OF FSDVM ASSOCIATED COOPERATIVES WHICH WERE OPERATING IN SEPTEMBER 1978
DailyPeople Income
Name Activity Founded Members Employed (Colones) Social Capital Total Capital
Plan Piloto Dressmaking 1974 60 59 6.00 22,000 66,650
La Semilla de Artesan products of wood,Dios 1/ leather, etc. 1977 58 116 7.00 1,892 1,892
El Conacastal Bakery 1975 56 10 5.00 2,079 51,079
La Victoria Savings and loan andconsumer cooperative 1975 383 3 7.00 14,922 16,147
Liberacion Savings and loan andconsumer 1977 70 - - 6,714 6,714
5 de Noviembre Savings and loan and In the processconsumer of being formed 90 - - 6,618 3,618
TOTAL 717 188 C$51,225 C$145,650($20,490) ($58,260)
1/ This cooperative is not associated with an FSDVM housing project.
Source: Departamento de Empresas Comunitarias. FSDVM. Information prepared at the request of IBRD, September 20, 1978..

Table 12.2: DETAILS OF COOPERATIVES AND OTHER TYPES OF COMMUNITY ENTERPRISESBEING FORMED BY FSDVM IN SEPTEMBER 1978
DailyPeople Income
Name Activity Members Employed (Colones) Functioning
Agricultural production Agriculturalgroup "Coloquil" production 19 19 6.00 Yes
Cooperative"La Periquera" Not yet defined 18 - - No
Production and consumer Consumersgroup "Sensunapan" cooperative 32 - - No
Chicken farm Chicken Previously"El Vaticano" rearing 16 16 3.00 operated
Supermarket"Del Hogar" Consumption - 6 8.00 Yes
Artesan School, Making toysSanta Tecla and dolls 12 12 7.00 Yes
Fishing cooperative"El Maculis" Fishing 80 70 ? Yes
Cooperative "Las MakingConchitas de Hilo" hammocks 20 20
TOTAL 235 143
Source: Departamento de Empresas Comunitarias. FSDVM. Information prepared at the request of IBRD.September 20, 1978.

Table 12.3: THE ESTIMATED IMPACT OF THE PLAN PILOTO SEWING COOPERATIVE ON THEINCOME OF ITS MEMBERS DURING THE PERIOD 1974-1977
Monthly Income of Members Monthly Income of MembersWho Were Previously Who Were Not Previously Average Monthly Income
Employed Employed of All Members
Colones Per Month Colones Per Month Colones Per Month
Income before entering I
the cooperative 116.00 0 70.20
Income after enteringthe cooperative 197.50 138.20 174.00
Increase 81.50 138.20 103.80
Number interviewed 26 17 43
Note: The total number of members at the time of the study was 50, but 7 could not be interviewed.
Not all members entered at the same time so it is not at present possible to estimate the annualincrease in income of members, as the cooperative has continued to grow rapidly the bestassumption would probably be to assume the average person has been working with the cooperativefor one and a half years.

-213-
CHAPTER 13
A COMPARISON OF THE FSDVM PROJECTS WITH ALTERNATIVE SHELTEROPTIONS IN TRE FORMAL AND INFORMAL HOUSING MARKET
Introduction
It was argued in Chapter 1 that traditional housing programs
both public and private virtually do not reach to the poorest 50 percent
of the urban population. The poorest half of the population and in
fact nearer to 70 percent must rely upon the informal housing market for
the provision of shelter and urban services. It was shown in Chapter 6
that the FSDVM projects are able to reach down to about the 20th income
percentile (and in some cases slightly lower) so that they offer a potentially
attractive option to a large sector of the urban poor.
In this chapter we will compare the FSDVM projects with alter-
native forms of shelter in the formal and informal market. The
comparison will be made in terms of cost, quality and the benefits
which are purchased for a given amount of money. On the basis of
this analysis the following chapter will draw policy conclusions for
a national housing strategy designed to reach the urban poor.
1. Cost and accessibility
In 1977 Richard and Bamberger 1/ compared the monthly cost
to participants of all types of formal and informal housing potentially
accessible to the low-income population of San Salvador. The results
of this analysis are summarized in Table 13.1. The third columan
estimates the lowest income percentile who can afford each of the
1/ Jim Richard and Michael Bamberger, "Economic Evaluation of Sitesand Services Programs and Their Accessibility to Low-Income Groupsin El Salvador." FSDVM. Report series on the evaluation, No. 16.July 1977.

-214-
Table 13.1: ACCESSIBILITY OF FORMAL AND INFORMAL HOUSING PROGRAMS TOTHE URBAN POOR. SAN SALVADOR. 1977
Lowest percentile whoInstitution Type of Housing can afford this option
Tenement housing Poorest quality 6(mesones)
Extra-legal Poorest quality 10subdivisions(colonia ilegal)
FSDVM Basic core unít 24
Tenement Housing Adequate quality 24
IVU (Instituto de Marginal housing 27Vivienda Urbana) in squatter areas
(discontinued)
Extra-legal Adequate standard 42subdivisions
FSV (Fondo Social Normal programpara la Vivienda) (1975-1978) 48
IVU 2 bedroomed houses 52
IVU 4 bedroomed houses Beyond 60th percentile
IVU Apartments Beyond 60th percentile
FSV Normal program Beyond 60th percentile(1978-1982)
Source: Jim Richard and Michael Bamberger, "Economic Evaluation ofSites and Services Programs and Their Accessibility toLow-Income Groups in El Salvador", Table 2.15, FSDVM ReportSeries on the Evaluation Program. No. 16. July 1977.

-215-
options. According to these estimates none of the public housing
programs were affordable to families below the 48th income percent-
ile and most were only affordable to families above the 60th percentile.
These conclusions are also supported by a comparison of cost figures for
different projects (Table 13.2). The figures show that the cheapest
government housing costs at least twice as much as FSDVM project houses.
In terms of a comparison with public housing the conclusion
is very clearly that the FSDVM is accessible to much lower income
groups. The situation becomes more complicated, however, when the
FSDVM is compared with the informal housing sector. In most cities
between 50 and 70 percent of the population live in mesones (tenements),
colonias ilegales (extra-legal subdivisions) or tugurios (squatter
settlements). Table 13.1 shows that several types of informal housing
are cheaper and more accessible than the FSDVM. The poorest quality
mesones and colonias ilegales are accessible to families in the poorest
10 percent of the population, and even good quality mesones compete
with the FSDVM in terms of their potential accessibility. The same
finding is shown in Table 4.6 (Chapter 4) where estimates are made of
monthly rent in different types of informal housing. The estimated
median monthly rent in FSDVM projects was shown to be about 3 times
the median rent in mesones, twice the median in colonias ilegales
and 5 times the median for tugurios.
The conclusion is that although the FSDVM reaches down to
poor families it is by no means the cheapest option, and there are
several other forms of shelter which are more accessible to the
poorest urban families.

-216-
Table 13.2: COMPARISON OF COST OF FORMAL AND INFORMAL SHELTEROPTIONS. SAN SALVADOR. 1978.
(Note future costs discounted at 12%)
Cost (Colones)
Upgrading and Sites and Services
FSDVM basic unit 3383
FSDVM serviced lot 3204
IVU squatter upgrading 4083
Traditional Housing
IVU Multi-family units 14023
IVU Single family 2 bedroom units 8414
FSV Single family unit 7046
Informal Housing
Extra-legal subsidivisions 5096
Tenement 2127
Squatter settlement 1255
Note: The information is based on a sample of typical units ineach category.
Source: Marisa Fernandez-Palacios and Michael Bamberger, "AnEconomic Analysis of Low-Cost Housing Options inEl Salvador" (draft), August 1979. DEDRB.

-217-
2. Comparing benefits received from different shelter programs
An obvious explanation of why some shelter costs more than
others is that there are differences in the quality of the package
of services rendered. An important question is to find a way of comparing
the amount of benefits received per unit cost in different housing programs.
A number of dífferent methods have been developed during the El Salvador
evaluation, some of which have already been referred to in earlier chapters.
Some possible indicators are the following:
2.1 Comparison of quality/access to services
Table 13.3 presents a comparison of the quality of housing
in mesones, colonias ilegales, tugurios and the project in 1980. It can
be seen that with the exception of floor quality (many project houses
have dirt floors) the project houses are of equal or better quality than
the housing offered in the informal sector. Chapter 4 showed that in
1976 most participants were living in typical mesones (Chapter 4, Table
4.3) and that the move to the project produced a significant increase in
housing quality whereas for families who continued to live in mesones there
was no significant improvement (Chapter 4, Table 4.4).
This analysis suggests that the quality of project houses is
superior to that of houses in the informal sector from which most
families came.
When we compare access to services the pattern is not so clear.
Chapter 5 showed that in many ways the mesones, with their central

Table 13.3: QUALITY OF THE HOUSE IN 1980. COMPARISON OF INFORMAL HOUSING ANDTHE FSDVM PROJECT. SANTA ANA.
Percentage Score on Quality Index (100% = maximum)
Roof Walls Floor Water Sanitation Light Average
Meson 99 55 53 47 47 95 66
Colonia Ilegal 93 79 41 84 74 96 78
1",
Tugurios 48 47 2 49 34 40 35 X
Project 100 99 48 100 100 100 91
Source: Chapter 4.

-219-
location, have better access to services than the project. The project
does however enjoy an advantage in comparison to most colonias ilegales.
In the case of most interior cities such as Santa Ana and Sonsonate, not
too much importance should be attached to differences in distances from
services as the cities are so small that the difference in distances to
services between one type of community and another is usually less than
one mile.
In general the project has a considerable advantage over
other types of informal housing in terms of water quality and access,
quality of sanitary services and, to a lesser extent, quality of building
materials. The projects tend to be at a disadvantage in comparison with
mesones in terms of access to public services such as transport, schools,
hospitals, etc. In comparison with colonias ilegales the main disadvantage
of the projects is in terms of a smaller lot size.
Direct comparisons of quality were not made in quite the same
way with public housing programs but a similar type of comparison will be
discussed in the following paragraphs.
The comparisons of quality become much more meaningful if
we can compare them with differences in cost and value. If we find
that a family can buy better quality housing in the project if they are
prepared to increase the amount they pay for housing, this would not be a
very dramatic conclusion. What is more interesting is to compare the
"amount" of housing which can be obtained in different projects for a
given quantity of money. In other words can a poor family obtain more
housing services (benefits) in the FSDVM project than they can obtain
elsewhere, for a given amount of money. This question has been approached
-220-
in two different ways in the evaluation. First through the use of
cost-benefit analysis and second through the use of hedonic price
indices and the estimation of utility functions.
A cost-benefit analysis was conducted of 9 housing options
in San Salvador (Fernandez-Palacios and Bamberger) 1/ which represented
the major options potentially accessible to low-income families. The
analysis included the main types of housing offered by the informal
market (mesones, colonias ilegales and tugurios); three types of upgrading
and sites and services programs (2 FSDVM options and one government
program through IVU); and 3 traditional public housing programs. An
attempt was made to measure all costs and all benefits produced by these
projects and on this basis to develop a number of indicators to compare
them. Three of the basic indicators are summarized in Table 13.4. These
are:
a. The internal rate of return. This means, in somewhat simplifiedterms, the "return" which a family could expect to receive ifthey bought (or rented) the different types of housing. Thehigher the rate of return, the higher the benefits received bythe family. In general, the most attractive project is the onewhich offers the highest rate of return.
b. The net present value. This is the difference between totalproject benefits and total project costs for each year of theprojects life (in this case projected over a period of 20 and30 years). The figure is then discounted at the current rateof interest. If the NPV is positive this means that a familyobtains more benefits from investing their money in the shelteroption being studied than they could have obtained by investingthe money in the bank. Again the higher the NPV the greater thenet benefits obtained. To adjust for differences in the amountof initial investment, NPV is divided by total cost, so as to obtaina standardized comparison between projects.
c. The simple net present value is also included in the table forcomparative purposes.
1/ Marisa Fernandez-Palacios and Michael Bamberger, "An Economic Analysisof Low-Cost Housing Options in El Salvador". (Draft) August 1979,DEDRB.
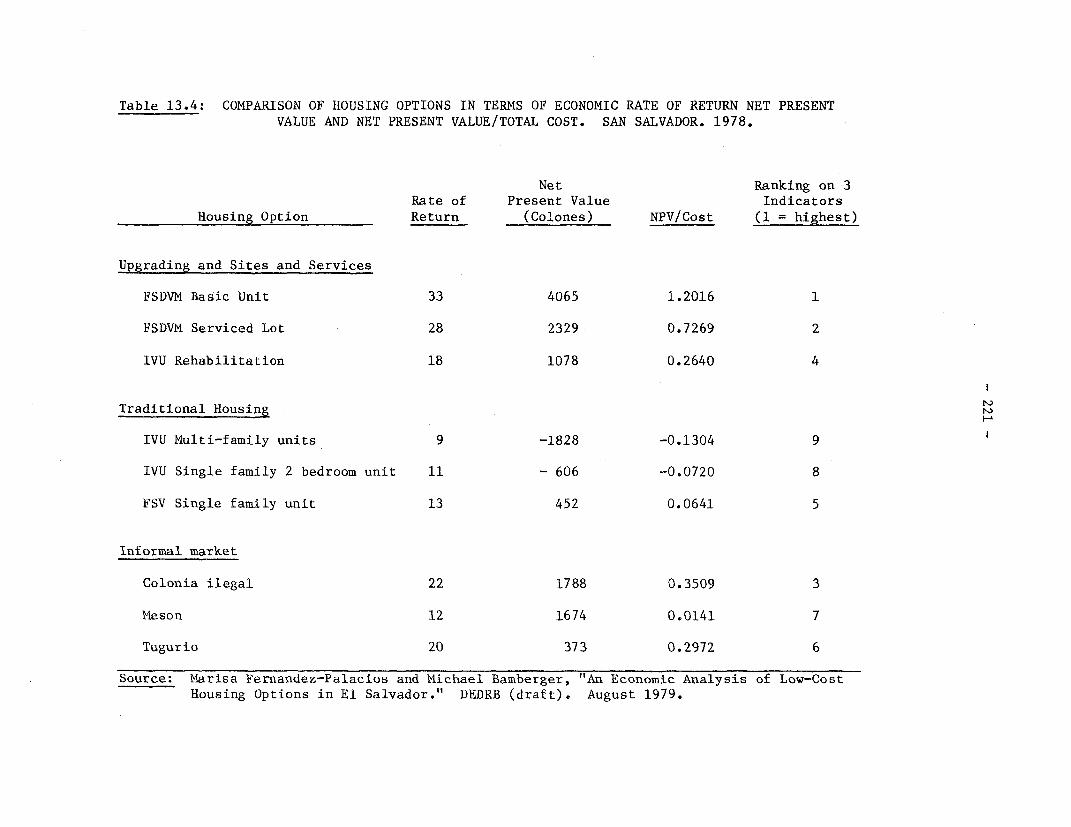
Table 13.4: COMPARISON OF HOUSING OPTIONS IN TERMS OF ECONOMIC RATE OF RETURN NET PRESENT
VALUE AND NET PRESENT VALUE/TOTAL COST. SAN SALVADOR. 1978.
Net Ranking on 3
Rate of Present Value Indicators
Housing Option Return (Colones) NPV/Cost (1 = highest)
Upgrading and Sites and Services
FSDVM Basic Unit 33 4065 1.2016 1
FSDVM Serviced Lot 28 2329- 0.7269 2
IVU Rehabilitation 18 1078 0.2640 4
Traditional Housing
IVU Multi-family units 9 -1828 -0.1304 9
IVU Single family 2 bedroom unit 11 - 606 -0.0720 8
FSV Single family unit 13 452 0.0641 5
Informal market
Colonia ilegal 22 1788 0.3509 3
Meson 12 1674 0.0141 7
Tugurio 20 373 0.2972 6
Source: Marisa Fernandez-Palacios and Michael Bamberger, "An Economic Analysis of Low-Cost
Housing Options in El Salvador." DEDRB (draft). August 1979.

-222-
The nine projects are ranked from highest to lowest on each
of these indicators and it can be seen that the pattern of ranking is
consistent between the three indicators. In each case the FSDVM projects
have the highest ranking with the colonia ilegal the next highest. The
highest ranked public housing project is the IVU squatter upgrading
program which is not a traditional program. None of the traditional
government programs achieve a ranking higher than 5 on any of the índicators
and in general they occupy the lowest positions.
The conclusion of this analysis is that the FSDVM projects
produce the highest return (benefits) for each colon invested. For a
family living in a meson (where most project participants previously
lived), the rate of return will almost treble if the family moves to the
project. If the family had to choose between moving to an FSDVM project
and movíng to a colonia ilegal, the rate of return would be higher for
the FSDVM but the dífference would not be as great. This underlines the
fact, to which we will return in the next chapter, that the colonia
ilegal is potentially an attractive option if some of its shortcomings
can be reduced.
Conclusions
The analysis indicates that the FSDVM projects offer a very attract-
ive option to low-income families. The projects are cheap enough to be
affordable down to about the 20th income percentile, whereas most
government programs do not reach below the 50th percentile. The FSDVM
projects also compare favorably in terms of cost-benefit indicators
such as internal rate of return and present value. In both cases it

-223-
appears that a family can obtain more housing services (benefits) for a
given amount of money from the FSDVM than from any of the shelter
options available in the informal housing market.
The option which most closely competes with the FSDVM appears
to be the colonia ilegal. This offers considerably more space and
hence more flexibility in styles of construction and types of materials
used. The disadvantage of the colonia is the lack of direct access
to water and sanitation services. In a large number of cases these
services are provided after a certain period of time, but there is
no guarantee. The colonia appears to be a more attractive option
for higher income families who are able to arrange their own financing
but compares somewhat less favorably with the FSDVM for the lower income
families. 1/
None of the traditional public or private housing programs are
able to compete with the progressive development model, and it is interest-
ing to note that the highest ranked government housing program is the
squatter upgrading project of IVU. It would seem that with the present
Salvadorean income distribution and the relative costs of providing
complete housing as opposed to the provision of serviced plots combined
with progressive development construction, the latter option is without
doubt the most attractive for the urban poor.
1/ This is evaluated by comparing the ranking of the projects onEfficiency Analysis, where it does not matter who receives thebenefits; with the ranking on social analysis where higher weightsare given to benefits received by poorer families. The relativeposition of the colonia declines where social analysis is used. SeeFernandez Palacios and Bamberger, Part 3.

-224-
CHAPTER 14
RECOMMENDATIONS
1. Recommendations Relating to Present FSDVM Programs
The main conclusion of this report is that in general the
FSDVM program is working well and, despite the extremely difficult
economic and political context within which it operates, the program is
achieving most of its objectives. It is within this generally positive
context that the present recommendations are presented. They should be
considered as ways to improve an already effective program rather than as
basic criticisms of that program.
1.1 Project Design
1.1.1 Macro Level DecisionsRural vs. Urban Location:
The FSDVM should continue to limit itself to urban projects.
The demand is sufficiently high to absorb all of the Fundacion's resources
for many years to come. Rural housing is also sufficiently different to
require completely new types of programs in which the Fundacion has only
very limited experience and no great comparative advantage.
Choice of cities:
The FSDVM should continue to distribute its programs among a
large number of different cities, and hence to set an example to other
housing programs which have tended to concentrate in the Metropolitan area.
Locations within the city:
Economies of scale, combined with the problems of finding
affordable prime land suggest that the FSDVM should continue its recent
policy of selecting large project sites, usually on the periphery of the
city.

-225-
At the same time there is a large demand for housing
located near to the center of the city, and where possible smaller
projects should be developed on any centrally located land which can
be found. The rehabilitation of tenements and the construction of
2-storey units are both potentially important models for providing
inner city shelter.
Project size:
A number of pressures (mentioned above) suggest that
priority must be given to larger project sites. Not least among the
reasons is the problem of acquiring land. Often a large project should
be broken down into a number of stages so that it becomes a sequence
of smaller projects.
At the same time the FSDVM should continue to develop a number
of smaller projects, both to permit continued experimentation and to
take advantage of inner city locations if they become available.
1.1.2 Micro-level decisions
Options within a project
Larger projects make it more economic to offer a number of
different options. There are several reasons for wishing to do this.
The most important is that experience has shown that different types of
families demand different types of shelter. This variation depends on
factors such as income, family size, willingness to become involved in
mutual help and self-help construction, preference for purchasing or
renting, etc. The following are some of the main options which should,
where possible, be offered within a project:

-226-
(a) Some variation in plot size. This could include both smallerplots for poorer or smaller families and larger plots forwealthier families or those with larger families. If plotsizes could be increased to 150 m2 (for some plots) thiswould compete favorably with the typical colonia ilegal.
(b) Include rental units as well as units for sale. There is avery large demand for rental units from small incompletefamilies and from people who are not yet established in thecity. In some cases this could be a step towards ownershipbut in others it could be a permanent arrangement. One veryinteresting approach would be to encourage families to sub-letone or more rooms as a way of covering their investment costs,and of making the project more accessible to poorer families.This has been done successfully in other countries. 1/
(c) The two main types of option should be the serviced plot andthe partially completed house. The serviced plots should normallybe sold to higher income groups, but with some exceptions (forexample encouraging families from tugurios to transfer thematerials from their previous dwelling to the project).
(d) A final option should be units with certain shared services (suchas clothes washing, showers, toilets, etc.). This could producesignificant cost reductions. Initial experiments with thesecondominium models were not very successful but that was due toa number of specific problems which it should be possible tocorrect in the future.
New types of project:
The FSDVM should continue to develop both the tenement rehabilitation
projects and the two storey units as both have a strong potential. The first
is a way to take advantage of existing structures with favorable locations,
and the second to reduce the cost of land and hence to give access to better
located sites.
Lower service levels:
The FSDVM projects offer higher service levels than almost any other
Bank supported sites and services project. All units have individual water
1/ The Dandora project in Nairobi is an example where poorer families areencouraged to construct additional rooms for renting. About 80 percentof dwellings have at least one room sublet.

-227-
connections and water borne sanitation. These service levels, which
are required under Salvador's urban planning laws, mean that project
costs are increased and the projects become less accessible to poorer
families. Every effort should be made to find ways of experimenting
with lower service levels and hence of reducing costs.
1.2 Project Finance
Larger loans for materials and for hiring labor
(a) In many projects construction has become paralized once thematerial loan from the FSDVM is exhausted. This is particularlya problem for poorer families. If possible the size of thematerial loan should be increased, at least for poorer families,so as to permit them to complete the construction.
In a free market the rationing of loans would be achieved bymaking financing available but at a relatively high interestrate so that families would have an incentive to first seekalternative sources. However, in the present case this wouldpenalize the poorest families who most need help. An alternativewould be to make larger loans available to poorer families butwithout increasing the interest rate.
(b) Until now loans have only been available for obtaining materialsfrom the project material store. The FSDVM should also considerthe possibility of allowing families to use the loans to purchasematerials from other sources.
(c) As most families hire labor to complete the construction, thepossibility should be considered of allowing loans also to beused to pay for hired labor.
Cross Subsidization
A number of positive social benefits are achieved by having a
mix of families from different economic levels in the project. One
possible approach is to permit the use of cross-subsidies whereby the
better off families are charged higher prices and the surplus which is
generated is used to reduce the charges to the poorer families. In the

-228-
past little success has been achieved with cross-subsidies, largely
because the better off families are still sufficiently poor not to be
able to pay much higher costs. Despite these problems it would be
useful to consider the possibility of developing a cross-subsidy
program. The following are some of the options:
(a) Charge higher prices for the serviced lots which areintended for higher income groups.
(b) Charge higher prices to families who do not participatein mutual help construction.
Financing of extra-legal subdivision development
The studies by Fernandez-Palacios and Bamberger, and Richard
and Bamberger suggest that one of the main determainants of the higher
rate of return to the FSDVM projects compared with the colonias ilegales
is the provision of subsidized interest rates. At the same time it seems
that the lack of access to financing may be one of the barriers limiting
the access of lower income groups to many of the colonias. One suggestion
deriving from this analysis is that the provision of more attractive
interest and financing might make the colonias more accessible to lower
income families and be an interesting alternative way to provide
low-income housing. Although the program itself may be interesting it
is not immediately clear whether the FSDVM would be the appropriate
institution to provide the financing.
1.3 Project Implementation
1.3.1 Selection procedures
(a) In assessing capacity to pay, sources of income other thanearned income should be taken into consideration. Femaleheaded households in particular receive a high proportion of

-229-
their income from transfers, and taking these sources intoaccount would make it eásier for female headed householdsto become eligible for the project.
(b) Mutual help has been shown to be a barrier to participation inthe project by certain groups. Although this is art importantpart of the program, consideration should be given to waysof permiting a certain proportion of families to enter withoutpassing through this process. As suggested earlier, exemptionfrom mutual help could possibly be linked to a cross-subsidyscheme whereby the exempt families paid higher prices for theirhouse.
(c) The need exists to give more complete information on allhousing costs at the time when families are being selected.It is important that families realize the total financialcommitment they will have to make.
(d) In large projects a more active attempt might be made to seeklow-income families. One possible way could be to reservesections of the project for poorer families and conductsystematic campaigns in tugurios and other low-income areasto encourage families to participate. Active guidance couldthen be given on how to use cheaper materials.
1.3.2 Mutual help
(a) Although mutual help has proved quite successful and should beretained as a central part of the program, ways should be foundto permit a certain proportion of families to enter withouthaving to participate in mutual help.
(b) Large projects should be broken down into a number of phasesso as to ensure that all groups begin with their full complementof participants.
(c) Although the development of a feeling of group identity isimportant, the attempt to make each group self-sufficient mightmean inefficient utilization of the scarce skilled labor. Abricklayer may be working on routine manual activitíes in onegroup while at the same time another group has to pay money tohire a bricklayer. A way should be found to pool the skilledlabor of a number of groups so that specialized workers canmove from one group to another as they are required.
(d) The possibility should be investigated of permitting groups towork during weekdays as well as weekends so as to acceleratethe completion of the work.

-230-
1.3.3 Self-help
(a) The use of cheaper materials should be actively encouraged by:
(i) Provision of transport to help people bring materialsfrom their previous house.
(ii) Model houses, using cheaper materials should be on show.
(iii) Sectors of the project should be set aside for lowerincome families so as to encourage use of cheaper materialswithout feeling compelled to keep up with the Joneses bybuilding to higher standards than they could afford.
(b) Research should be continued on the use of local materials.
(c) Loans should be made available for hiring labor as well as forpurchase of materials.
(d) Families should be permitted to use their loans to purchasematerials outside the project as well as from a materialstore if they can obtain a better price.
1.3.4 Employment generation
(a) The cooperative program should be continued with emphasis on thefollowing:
(i) Reactivation of production of building materials withpossible expansion into small construction companies whichcould be hired by the FSDVM or directly by households.
(ii) Production cooperatives. To achieve larger scale the ideaof working on subcontract for larger national or inter-national companies should again be considered. 1/
(iii) Consumer cooperatives should be continued as they offerseveral advantages: they can reduce the cost of basiccommodities, generate employment and provide linkageswith production cooperatives in other areas.
1/ The FSDVM has received various offers from international companies.For example the production of jeans or toys. In both cases asubstantial market would have been provided and technical assistanceand training would have been given. In both cases, however, theFSDVM would have had to make a very substantial investment whichwould have placed considerable constraints on the flexibility ofthe organization and would have made the whole of the FSDVM dependenton the sucess of this venture.

-231-
(b) Small business loans should be provided to support existingbusinesses and to encourage the growth of new ones. Theprogram should probably include a certain level of technicalassistance but not to such a level as to substantiallyincrease the cost of borrowing.
2. Making Housing Accessible to the Urban Poor: Recommendationsfor a National Urban Shelter Policy
As part of the evaluation of the FSDVM, a wide range of studies
have been conducted in other types of informal and formal housing programs.
It is on the basis of these studies that the following recommendations
are made. A number of general guidelines are suggested by these studies.
First, given the limited available resources, the policy
should be to conserve and upgrade as far as possible the existing
housing stock. Providing new housing stock tends to be much more expensive
than upgrading and also tends to dislocate poor families to provide
housing for higher income groups.
Second, there is a need to provide a range of different shelter
options as different types of family have different requirements.
The demand varies in terms of location, cost, tenure, level of services,
etc. and an integrated program must cover a wide range of options.
Third, the prograns should try to stimulate private initiative
as a complement to government programs. Both the entrepreneur who
builds houses for profit, and the household which can use own labor and
resources should be encouraged. In many cases considerable increases in
the housing stock can be achieved at a very low cost simply by stimulating,
or removing barriers from private initiative.
Fourth, efforts should be made to encourage the mobilization
of previously untapped financial and human resources. Studies have

-232-
shown that families, including very poor families, are able to generate
considerable amounts of resources for house construction and improvement.
Fifth, if housing is to be financially affordable to the urban
poor, it will be necessary to accept lower standards of services and
construction.
Sixth, a national land use policy is absolutely essential.
Land is so scarce and represents such a large component of the cost of
the shelter package that the government must intervene to regulate the
price and use of land.
2.1 Three main systems for producing shelter
A national housing policy must actively pursue the use of three
distinct systems for providing shelter. These are:
(a) Upgrading of existing housing stock. Traditionally upgradinghas been restrieted to squatter settlements but similarstrategies can also be used with tenement housing and extra-legal subdivisions.
(b) Sites and services. This includes both the model developedby the FSDVM and also a more dynamic regulation and encourage-ment of the extra-legal subdivision.
(c) Traditional single family and multi-family housing.
Table 14.1 describes the main characteristics of each of the types
of housing within each system and we will elaborate on this in the following
sections.
2.1.1 Upgrading existing housing stock
Upgrading has the advantage that it can improve the quality
of the housing stock at a relatively low cost and relatively rapidly. It
also has the advantage of ensuring that the benefits reach the existing

Table 14.1: MAIN COMPONENTS OF AN INTEGRATED LOW-INCOME URBAN SHELTER STRATEGY
TargetPopulation
Type Income Institutional andSystem of Housing Location Percentiles Characteristics Financial Arrangements
Upgrading Squatter Inner Lowest Irregular IVU with strong publicsettlements City 20% employment works component
Extra-legal Periphery 30 - 60 Wide variation Regulatory. Some infra-subdivision structure and major financial
component for self-help.
Tenement Inner 15 - 60 Small families, Regulatory. Some publicCity commerce, some works. Condominimum
migrant workers development with financial wassistance.
Sites FSDVM Model Periphery 20 - 60 Stable families FSDVM or IVU. Internationaland and relatively financing. Possible linkageServices stable income to FSV.
Extra-legal Períphery 35 - 60 Wide variation Regulatory. Infrastructuresubdivision and finance for construction
loans or land purchase
Traditional Single family Various 40 - 60 Stable families IVU, FSV, FNVHousing or multiple and stable
family employment

-234-
population, something which is very of ten not the case with dernolition
and relocation. In the study by Fernandez-Palacios and Bamberger 11
it is shown that upgrading and progressive developrnent were much
cheaper and yielded a rnuch higher internal rate of return than any
of the traditional housing programs.
2.1.1.1 Upgrading squatter settlements
Squatter settlements are of ten the only available shelter
option for the poorest 20 percent of the urban population. It is
irnpossible to provide non-subsidized housing which is affordable to this
group. Squatter upgrading programs have proved to be effective in many
parts of the world, and once security of tenure is obtained and sorne
basic improvements are introduced, families are of ten encouraged to use
their own resources to i.rnprove their own dwelling. The squatter settle-
rnents usually have favorable locations with respect to places of eniploy-
ment so their irnprovement in situ also has advantages in this respect.
2.1.1.2 Upgrading extra-legal subdivisions
Although the poorest of the extra-legal subdivisions are
often physically indistinguishable from squatter settlernents the former
enjoys a more stable tenure. The subdivision also covers a wide spectrum
and rnany subdivisions house middle and even upper middle-class faniilies.
Because of their quasi legal and unregulated form of development, many of
the subdivisions lack basic public services. The occupiers may also have
a somewhat insecure tenure due to the quasi-legal way in which the sale
of land is usually arranged.
1/ Marisa Fernandez-Palacios and Michael Bamberger, "Li EconomicAnalysis of Low-Cost Housing Options in El Salvador." (Draft)August 1979. DEDRB.

-235-
Significant improvements in the quality of public services
could be achieved relatively easily and in most cases with complete
cost recovery. The main change which is needed to achieve this is a
revision of the regulations relating to the tenure status of these
communities. Once this is resolved the public authorities are legally able
to install services and families would also have a much greater incentive
to invest in house improvements.
2.1.1.3 Upgrading tenements
As was mentioned earlier, a large proportion of the cities
population live in rented rooms in tenement houses. Although the location
of many of these tenements is very good, the quality of water and sanitary
services is often extremely low. Many of the mesones are converted middle
class houses which are structurally sound. The FSDVM pilot project has
illustrated one viable approach. Two main strategies can be pursued. The
first is to sell the meson as a condominimum to the present tenants,
who become responsible for the renovation. The second option is to provide
incentives to the present owners to upgrade. At the moment improve-
ments are legally prohibited so there is no incentive to improve. The
problem is to make it financially attractive to make some improvements
without encouraging such large rent increases as to make the meson inacces-
sible to the urban poor. This problem makes the condominium approach
potentially attractive.
2.2 Sites and Services
The sites and services approach has already demonstrated
its great potential. It has the advantage of being flexible and
-236-
providing different levels of development of the plot so as to appeal
to different income groups. It is also a very effective way to
mobilize private resources. Finally it has proved to be a very
cost-effective way to make housing accessible to low-income groups.
2.2.1 The FSDVM model
This has already been discussed in Section 1 of this
chapter. Future projects should offer serviced sites to slightly
richer families and more developed plots to the poorer groups.
Projects should probably include rental accommodations and should
certainly encourage sub-letting. Although we have called this the
FSDVM model, it could equally well be developed by IVU who already
have experience with this method of construction.
2.2.2 Applying the sites and services approach to theextra-legal subdivision
Once the subdivision is accepted as a legitimate develop-
ment, it becomes possible to introduce a certain amount of regulation
of standards, and to provide basic services in coordination with the
developer. The level of services could range from communual water and pit
latrines to individual water connections and water borne sewerage. If
regulation is used correctly it would be possible to ensure that a certain
proportion of the subdivisions remain accessible to lower income families.
This form of regulation, in addition to upgrading the housing
stock, also widens the tax base. The legalization of the subdivisions
means that occupiers can pay property taxes and this provides the
revenue base for the provision of additional services.

-237-
2.3 Traditional Housing
The present housing programs of IVU, FSV and FNV should continue
more or less in their present form. The FSV has the potential to introduce
a number of innovations which would enable it to reach lower income
families. The most important change would be to accept lower standards
of housing so that it could finance housing for the lower 50 percent of
families who are potentially eligible to use its programs. Once this
change is accepted it becomes possible to finance the purchase of
sites and services units and to finance the development of some extra-legal
subdivisions.
Conclusion
Using an integrated strategy similar to the above it becomes
possible to develop a national housing strategy which encourages more
rapid increases in the housing stock and even more rapid upgrading of the
quality of present housing, both at prices accessible to the low-income
population.

-238-
ANNEX 1:
THE RESEARCH METHODOLOGY USED IN THE EVALUATION
1. Definition of the Objectives of the Evaluation
In discussions with the FSDVM and the World Bank in 1975-76
three main types of evaluation studies were identified, each of which
was intended to contribute to a different phase of project planning and
implementation. The three types of studies were:
(a) Short-term evaluation studíes designed to provide immediate
feedback to prolect management.
(b) Medium-range evaluation of project components designed to help
modify the methods used for project implementation in new
project sites still in the planning stage. These studies were
of particular value to the FSDVM as about ten new projects
started during the evaluation.
(e) Long-range impact and policy studies designed to assist in the
evaluation of overall project impact and to assist in defining
future shelter strategies for both the FSDVM and national
planning agencies.
A list of the main studies conducted in each of these categories is
given in Table 1. In the following sections the methodology used in
each of these types of studies will be described.
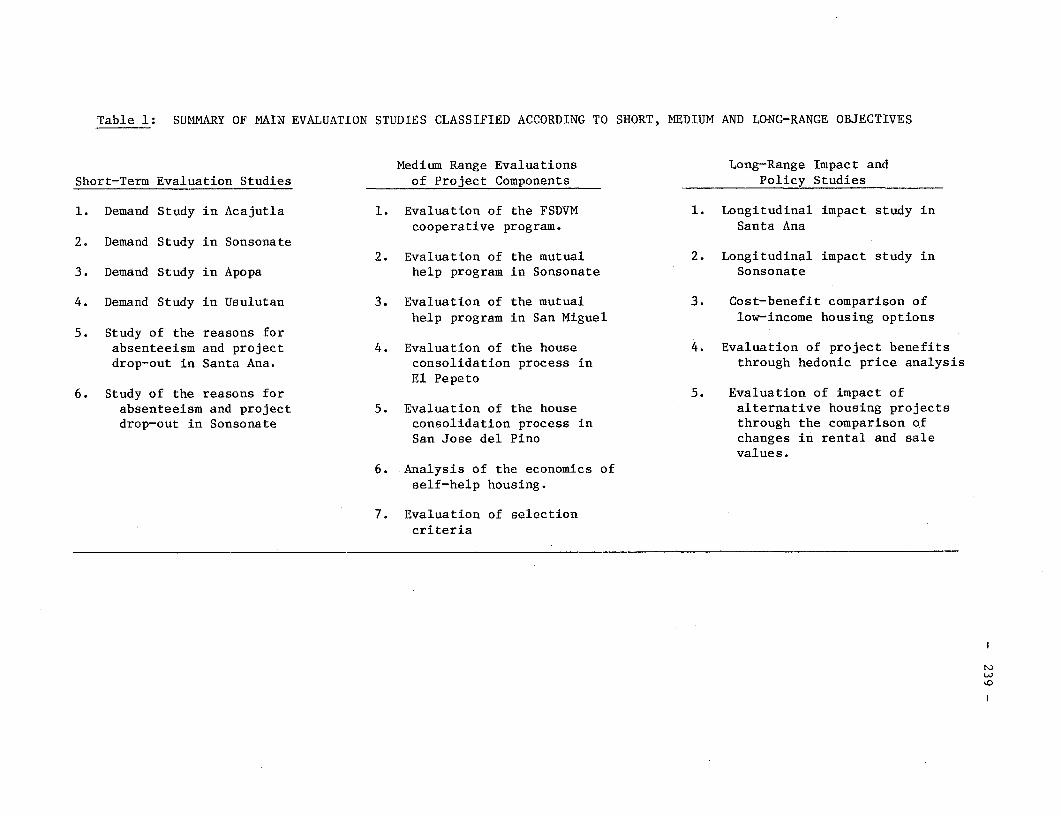
Table 1: SUMMARY OF MAIN EVALUATION STUDIES CLASSIFIED ACCORDING TO SHORT, MEDIUM AND LONG-RANGE OBJECTIVES
Medium Range Evaluations Long-Range Impact and
Short-Term Evaluation Studies of Project Components Policy Studies
1. Demand Study in Acajutla 1. Evaluation of the FSDVM 1. Longitudinal impact study in
cooperative program. Santa Ana
2. Demand Study in Sonsonate2. Evaluation of the mutual 2. Longitudinal impact study in
3. Demand Study in Apopa help program in Sonsonate Sonsonate
4. Demand Study in Usulutan 3. Evaluation of the mutual 3. Cost-benefit comparison of
help program in San Miguel low-income housing options5. Study of the reasons for
absenteeism and project 4. Evaluation of the house 4. Evaluation of project benefitsdrop-out in Santa Ana. consolidation process in through hedonic price analysis
El Pepeto6. Study of the reasons for 5. Evaluation of impact of
absenteeism and project 5. Evaluation of the house alternative housing projectsdrop-out in Sonsonate consolidation process in through the comparison of
San Jose del Pino changes in rental and salevalues.
6. Analysis of the economies of
self-help housing.
7. Evaluation of selection
criteria
w.

-240-
2. Short-Term Evaluation Studies
2.1 Estimating the Potential Demiand for FSDVM Projects
The objectives of these studies were to help FSDVM estimate
the potential demand for its projects and to evaluate their effective-
ness in reaching the low-income target population. Recommendations were
made on dissemination, selection procedures and project design. Although
there were certain variations, the main stages in the methodology were
as follows: (See Figure 1).
a. Estimation of total family income
It was discovered that in the selection procedure for some of
the earlier projects there was a confusion between: llousehold income
which referred to money assigned for covering household expenses, and
Total Family Income which referred to all income of household members,
irrespective of how it is used. The total famíly income (or family
expenditure) is a better measure but it ís often diffícult to verify.
The interview is often conducted in the home with the housewife who in
many cases is not aware of the total amount earned by her husband. It
was found that Total Family Income tends to be between 30 and 50 percent
higher than household income (or expenditure).
A series of consistency checks were built into the question-
naire to increase the reliability of the information. One was to
compare income with expenditures, another was to compare stated earnings
from different types of jobs with information on typical wage rates.
Where inconsistencies were found a return visit was made to the
respondent. Another conceptual problem relates to the definition of the

Figure 1: STAGES IN THE ESTIMATION OF POTENTIAL DEMAND FOR FSDVM PROJECTS
_|PROJECTELIGIBILITY |
I DEFINITION AND ABIITYAND POTENTIAL DEMANDMEASUREMENT OF INTEREST WILLINGNESS AND PROJECTFAMILY INCOME v TO PAY . ACCESSIBILITY
SAMPLE SURVEYS AND/ORUSE OF SECONDARY
DATA SOURCES
ESTIMATION OF.. _+ ~~INCOME DISTRIBUTION_
CURVE
,ESTIMATIG TOTALPROJECT COSTS

-242-
sources of income. Figure 2 illustrates the major components of total
family income. Income is generated by many different people, and can be
earned, received in kind or be obtained in the form of non-earned income
(rents, pensions, etc.). In addition, income can be received in the
form of loans or gifts from nonhousehold members.
The original affordability estimates were based only on
earnings, rent and transfers from government. However, an analysis of
sources of income showed that transfers from non-household members often
represent a very significant proportion of the total income of the
poorest families. 1/ For this reason the evaluation unit recommended
that inter-household transfers should be included in the definition of
total income. 2/
The analysis also includes questions on the stability of
income over time. In most demand studies this information was obtained
by asking families what was their lowest and highest income during the
course of a year. The longitudinal studies in which the same family is
interviewed three times over a period of three years also permit
estimates of permanent income in that long-term fluctuations can be
studied and adjusted for.
The design of the sample in the demand studies depended upon
the point in the project cycle at which the interviews were conducted.
If they were done during the planning stage the study was usually based
1/ David Lindauer and Dani Kaufmann, "Basic Needs. HouseholdTransfers and the Extended Family." Urban and Regional Report No.80-15. Urban and Regional Economics Division. The World Bank.1980.
2/ FSDVM, "Socio-Economic Study of Santa Ana," 1978.

Figure 2: THE STRUCTURE OF FAMILY INCOME
__IREGULAREMPLOYMENT -IIEAD
WiA-c, E-S -SPOUSE
PART-TIME OR OTHER FAMILY
IRREGULAR MEMBERS
EMPLOYMENT
RENT
NON-WAGE MONETARY -PENSION
INCOML PROFITS FROM HEAD
INCOME RETAINED BY INCOME EARNED BRY _ REGULAR BUSINESS
FAMILY bIMESROUSEROLDMEBRPAYMENT FOR PART- _SPOUSE
TIME OR IRREGULAR
SERVICESOTHER FAMILY
SALE OF CAPITAL MEMBERS
- GOODS OF HOUSEHOLD
TOTAL FAMILY (CAR, HOUSE, ETC.)
INCOME SUBSIDIES PAID TO
FAMILY
INCOVIE CONTRIBUTED GIFTS AND LOANS FROM
TO HOUSEHOLD NON-HOUSEHOLD
BUDGET FAMILY MEMBERS
FOOD GROWN
r IN-KIND I CLOTIES MADE
INCOMEFOOD/CLOTIIES
RECEIVED AT WORK

-244-
on a stratified random sample of low-income families. 1/ If the studY
was conducted afteY the project had begun (for example to evaluate
reasons for lack of demand. 2/) then the sample was normally divided
into: Participants, families who had dropped out and families who did
not apply. The information given on income in the application forms
tended to be very unreliable because many families misreported their
income so as to fall within the income range specified by the FSDVM
selection procedures.
b. Project eligibility
This is normally defined in terms of not owning property,
family characteristics and residence requirements, and income within a
certain range. In the analysis of the survey results the population is
classified into eligible and non-eligible groups on the basis of these
criteria.
C. Interest in the project
This is usually defined in terms of the response to simple
questions on a) interest in owning FSDVM type house, b) interest in
living in a particular location in the city, and c) willingness to
participate in mutual help construction.
d. Ability or willingness to pay.
DEDRB studies in El Salvador and elsewhere have shown that the
problem of estimating ability to pay for housing is more complex than
1/ For example, The Demand Study in Apopa (FSDVM Evaluation Report No.18).
2/ For example, The Demand Study in Usulutan (FSDVM Evaluation ReportNo. 11).

-245-
previously assumed and that there is no fixed proportion of income which
all families will be willing to spend on housing. 1/ In the FSDVM
studies three independent estimates of willingness to pay were compared:
a) The assumption that a family would be willing to pay up to a
certain proportion of their income on housing. Usually 25
percent of income was used as a liberal estimate and 15
percent as a more conservative figure. 2/
b) Assumption that a family would not be willing to spend more
than they are currently spending.
c) Asking families whether they would be willing to spend the
monthly amount specified by the FSDVM.
The combined use of three estimates provided lower (b) and upper
(usually (c) limits for the estimates.
e. Estimation of income distribution curve
To estimate the proportion of the low-income population who
can afford a project it is necessary to have information on the income
distribution of all families. No complete income distribution data was
available for most of the cities studied so two independent estimates
were combined:
a) It was assumed the distribution would be the same as that
found in the 1974 ILO study in San Salvador (with adjustment
made for inflation).
1/ Douglas Keare and Emmanuel Jimenez, "Affordability, Income and
Housing Consumption.' DEDRB (draft), 1980.2/ Normally about 90 percent of renters were found to be spending less
than 25 percent of their income on rent.

-246-
b) The FSDVM studies of families living in low-income housing
normally covered approximately the poorest 65 percent of the
population. From this some rough estimates can be made of the
characteristics of the lower end of the income distribution
curve.
f. Potential demand and project accessibility
Combining the estimates from a, d and e it is possible to
estimate the proportion of low-income families able and willing to pay
the project costs.
2.2 Evaluating the reasons families drop out of the projects
During the early stages of many FSDVM projects, and before the
houses were actually occupied, there was a high rate of absenteeism and
families dropping out of the projects. In addition to the immediate
problems which the drop-outs caused for project implementation (and to
some extent for cash-flow) there was a more general concern that the
drop-outs might signal some basic problems with the project design. The
problems could either arise from dissatisfaction with the project or
from inability to pay.
Several studies were conducted during the early stages of
project implementation. Using project records, a comparison was made of
the characteristics of families who dropped out of the project with
those who remained. Although there was in some cases a slight tendency

-247-
for drop-outs to be poorer, the differences were not very great. In the
same way there was no significant difference in drop-out rates between
males and females. Follow-up interviews with families who had dropped
out showed that often the main reasons for dropping out were adminis-
trative. In some cases it was a lack of information on procedures for
re-entering the project after an absence, in others an address or a
piece of paper was lost. It seemed that improving the communication
systems would often make a major contribution to resolving the
problems. There was also, however, a sígnificant group of families who
dropped out once they realized how small the house would be.
Studies were also conducted one and two years after families
had occupied the project. Comparisons were made between drop-out rates
in the control and experimental groups, and between drop-outs and
families who contínued in the project. The drop-out studies proved to
be quick and cheap, and provided a lot of useful information to the
FSDVM.
3. Medium-range evaluations of project components
3.1 Evaluation of the FSDVM Cooperative Program 1/
The cooperative program was perceived by the FSDVM to have
both social and economic objectives. The program consisted of
approximately ten cooperatives at the time of the study, and the
following research techniques were used in the evaluation:
1/ FSDVM Evaluation Report No. 17.

-248-
a) Case studies were prepared on each cooperative by the
promotor. These were prepared following a guide. In several
cases the promotor conducted a brief survey with members to
obtain information on their characteristics.
b) Interviews were conducted with members of the largest
cooperative (sewing and rug-making). The interviews were
semi-structured and sought to evaluate the impact of the
cooperative on the social and economie life of the members.
c) Interviews were conducted to measure the change in income as a
result of working in the cooperative.
d) Secondary sources, such as the cooperative accounts, were
reviewed.
e) Interviews were conducted with the cooperative staff.
f) Interviews were conducted with other organizations promoting
cooperatives.
g) A review was made of data on the social, economic and
political factors which affected the development of
cooperative programs in El Salvador.
3.2 Evaluation of the Mutual Help Program /-
Mutual help is a required part of the house construction
process and is considered by the FSDVM to make a major contribution to
the social and economic development of the communities. In most cases
1/ FSDVM Evaluation Report No. 12 (July 1977) and DEDRB Monitoring andEvaluation Report No. 3.
-249-
the mutual help construction process lasts between four and six months
(only working on weekends). Evaluations were conducted in two of the
projects using the following methodology:
a) Participant observation of the construction process and group
meetings.
b) Interviews with families at the beginning and end of the
process.
c) Case studies with a small number of participants.
d) Interviews with project staff.
e) Review of project records.
f) Obtaining information from the families on the amount of money
they normally earned at weekends (so as to estimate the
opportunity cost of participating in mutual help).
3.3 Evaluation of the House ConsolidationfProcess
The process of house consolidation can continue over a period
of two years or more. Consequently, it is not possible to obtain
complete ínfortnation on the costs or quality of the construction until
this period is completed. It was also found that many families have
difficulties recalling all of their expenditures at the end of this
period so it is useful to conduct longitudinal studies in whích
1/ Report prepared by the FSDVM for the Organization of AmericanStates on the progressive development process in the San Jose delPino project. "Analisis del Proceso Evolutivo y de las SolucionesAutonomas", February 1977.
-250-
ínformation is obtained on construction costs at different points of
time. The methodology used in the studies was as follows:
a) Intervíews with families at three points in time to obtaín
information on house construction costs.
b) Application of a detailed observation guide to record all of
the materials used and the quantity of each. An estimate was
then made of current market prices for purchase of these
materials and for hiring labor.
c) Information was obtained from the families on the price paid
for labor and the number of hours of unpaid labor used in the
construction. An imputed wage was used to estimate the value
of this free labor.
d) Architects evaluated the quality of the construction.
In the analysis it was found that families claimed to have spent
substantially less on their house then the current market value of the
materials and labor used. Care was taken to check these figures for
consistency and accuracy. It seems that families are able to obtain
materials at considerable discounts either through friends or through
using (and sometimes reconditioning) second hand or lower quality
materials. Care must be taken in interpreting the results of these
studies. On a first reading it would appear that if applied on a
massive scale, self-help housing would produce very large savings on
materials and labor. In fact it is likely that if the scale of the

-251-
projects were increased it would become more difficult for families to
acquire materíals at such large discounts as the supplies of surplus
materials would become used up.
3.4 Analysis of the Economies of Self-Help Housing 1/
Originally it had been assumed that families would build their
house with their own labor. The studies showed that in fact many fam-
ilies prefer to hire labor, and that one of the main reasons is that the
opportunity cost of labor is higher than expected. An analysis was made
of the conditions under which families use own or hired labor. The
analysis is complicated by the fact that families are both producers and
consumers of housing. Normally when wages increase families tend to
consume more. With self-help housing, however, a rise in wages means
that the opportunity cost of building ones own house increases. If a
participants wage increases sufficiently in real terms it becomes
possible to hire labor (if one is earning more than the going rate for
construction labor). However, there is often an intermediate range
where an increase in wage rates can lead to a decrease in house
construction. In this range higher wage rates raise the opportunity
cost of labor and discourage own-labor construction. The increase may
not be sufficíent, however, to justify hiring labor so the rate of
construction may decline. Over this range housing might have a negative
1/ Emmanuel Jimenez, `The Economies of Self-Help llousing: Theory andSome Evidence." Urban and Regional Report No. 80-16. DEDRB. 1980.
-252-
income elasticity. An economic model was developed to describe the
economics of the choices facing the family, and the model was applied to
data from various FSDVM projects.
3.5 Evaluation of the selection process
An objective of the FSDVM projects is to ensure that priority
is given to poor families but that at the same time only those families
are selected who have the ability to pay. A number of studies were
conducted to evaluate the efficiency and impact of the selection
procedures. The main methodologies used were the following:
a) Comparison of the income of project participants with city
income distribution curves to determine the location of
participants on the curve.
b) An analysis was conducted of cost-recovery. The fact that the
default rates were very low indicated that the selection
procedures had selected families with the ability to pay.
c) A comparison of families leaving the project with those who
stayed indicated that leavers were not significantly poorer
than those who stayed so that affordability did not seem to be
a major cause of leaving.
d) An analysis of the sources of household income suggested that
if income transfers from non-household members had been taken
into account, a significant number of low-income families
(particularly female headed households) who are excluded on
present income criteria, would in fact have had enough income
to qualify.

-253-
4. Long-range impact and policy studies
4.1 Longitudinal impact studies
One of the major objectives of the evaluation was to determine
the impacts of the projects on the socioeconomic conditions of project
participants. This was done through the use of a quasi-experimental
design, the main characteristics of which are shown in Figure 3.
The design, defined as a mixed panel sample, was used in two
of the interior cities - Santa Ana and Sonsonate. We will describe the
design in Santa Ana although it was similar to Sonsonate. The experi-
mental group was formed by 196 families who had been selected for the
project but who had not yet moved to their new house. There are three
main types of low-cost housing in which virtually all low-income fam-
ilies in Santa Ana live. These are mesones (tenement houses), colonias
ilegales (extra-legal subdivisions) and tugurios (illegal squatter
settlements). A stratífied control sample was used with approximately
100 families being selected from each type of settlement. 1/ Good
estimates existed of the total number of families in each type of
settlement so that in the analysis it was possible to use weights to
adjust strata sizes and obtain estimates for the total low-income
population. As no sampling frame existed it was necessary to draw a map
of each community to be sampled so as to be able to locate all
houses. This required the use of two-stage sampling to reduce the
1/ It was estimated that this was the minimum sample size to obtain
reliable estimates on the main variables and to be able to measurechanges over time. The estimating procedure is explained in
"Socio-Economic Baseline Study of Santa Ana," Chapter 1. FSDVMEvaluation Report No. 10, October 1977.

Figure 3: QUASI-EXPERIMENTAL DESIGN WITH MIXED PANEL SAMPLE
T I M E P E R I O D S
T(1) T(2) T(3)
E(1,1) 1E(1,2)-- bE(1,3) ORIGINAL PANEL
PARTICIPANTS E(2,2) kE(2,3) REPLACEMENTS IN T(2)
(3,3) REPLACEMENTS IN T(3)
u,C(1,1) BC(1,2) -C(1,3) ORIGINAL PANEL
CONTROL GROUP C(2,2) qC(2,3) REPLACEMENTS IN T(2)
>>C(3,3) REPLACEMENTS IN T(3)
-255-
number of maps to be drawn. The samples from the three control strata
were drawn as follows:
Mesones: A sample of 50 mesones was drawn at random (out
of approximately 1000 mesones in the city). Maps were
prepared of each meson indicating all occupied rooms and a
random sample of rooms was then drawn. This is technicallY a
cluster sample but as both the total number of mesones and the
number of mesones in the sample, were quite large, it iS
argued that for operational purposes the sample can be
considered to approximate a simple random sample.
Colonias ilegales: About 30 colonias existed in the city.
All were visited, classified on a series of indicators, and
then ranked and classified into two groups, poorer and
richer. A sample of five colonias was selected in each
group. A map was drawn of each of the selected colonias to
locate each dwelling unit and a random sample of families was
then drawn. Although this sample can potentially have a
larger bias, it was again treated as a simple random sample.
Tugurios: Only two tugurios existed in the city. Maps were
drawn to locate each dwelling and a random sample of all
dwellings was then selected.
The original samples are represented in Figure 3 as those
households interviewed in T(1). The experimental sample is defined as
E(l,l) to indicate that these are families selected in T(1) and
interviewed in T(1). Similarly the control sample is defined as

-256-
C(1,l). It was decided to use a mixed sample design in which the
attempt would be made to reinterview families in T(2) and T(3). The
families who were reinterviewed would form a panel. If the family had
moved, the second (or third) interview would be conducted with the new
family now occupying the same house. In the case of the experimental
group, participants had moved to the project by T (2) so the second
interview was conducted in the new house. If the family had moved to
the project but left before the second interview, the interview would be
conducted with the new family occupying the project house. If the
family never moved to the project, the second interview would be
conducted with a randomly selected family in the project.
In T(2) the families who were reinterviewed in the project are
classified as E(1,2) indicating they were selected in T(1) but are being
interviewed in T(2). A replacement family is defined as E(2,2)
indicating this family was selected in T(2) and is being interviewed in
T(2). The advantage of this mixed panel design is that it can be
disaggregated into sub-samples:
a) A panel sample of families who are interviewed at both points
of time (or at three points). In T(2) this is represented by
the E(1,2) and C(1,2) groups.
b) A replacement sample of new families. In T(2) this is
represented by E(2,2) and C(2,2).
c) An approximately random sample of all families living in the
survey area at the time of the study. This is represented in

-257-
T(2) by the E(l,2) + E(2,2) groups for participants and by the
C(1,2) + C(2,2) groups for the control.
This design permits a comparison of the original families with
replacements whilst at the same time providing an approximately random
sample of all families. 1/ The same logic can be applied in T(3)
although it can be seen that the sample is now disaggregated into three
sub-groups. It was found that the turnover rates for the original
panels were sufficiently low for it to be possible to conduct
statistical comparisons over time within the panel sub-sample.
A major theoretical problem in the use of this design to
evaluate project impact is that there is a non-equivalent control
group. There are significant differences between participants and the
control group in T(1) so that if differences are found between, for
example, the income of the two groups in T(3) we cannot immediately
infer that the difference is due to project impact. The difference may
be a result of the initial differences between the two groups. To
compensate for the non-equivalency of the control group, multiple
regression analysis was used with the dependent variable, the score in
T(2), being regressed on the score in T(1) and on other relevant factors
such as education, family size and, of course, participation status
(which is a dummy variable). If the coefficient of the participant
1/ The logic of this sample design is discussed in more detail in
Bamberger "Quasi-Experimentation in an Urban Contect: A Review ofExperience in the Evaluation of World Bank Urban Shelter
Programs." Urban and Regional Report No. 81-5. Urban and RegionalEconomics Division. World Bank, 1981.

-258-
status is found to be significant (whilst controlling for the above
mentioned independent variables) then there is a strong indication that
the project has produced some effect.
In the following section the application of this model is
illustrated with the analysis of project impact on income. -1/
Economic conditions tend to change dramatically for the urban
poor (even more so in the tumultous conditions experienced by El
Salvador during recent years) and the purpose of the Control Group is to
give an idea of what the conditions of the Experimental Group would have
been like if participants had stayed in their previous place of
residence rather than moving to the project. A simple illustration of
the importance of the Control Group is given in Table 2, which shows
that in 1976, before moving to the project, the average monthly family
income of the participants was 335 colones and that in 1980, about
three years after the move, it went up to 569 colones. To be able to
evaluate the extent to which this change can be attributed to the
project, we need to know what happened in the same period to the income
of equivalent families not affected by the project. It can be seen that
although the absolute increase in participant income was greater [234.5
compared to 192.7] the rate of change was slightly higher for the
control group [74.6 percent compared to 70 percent].
1/ The analysis for this section was prepared by Umnuay Sae-Hau.
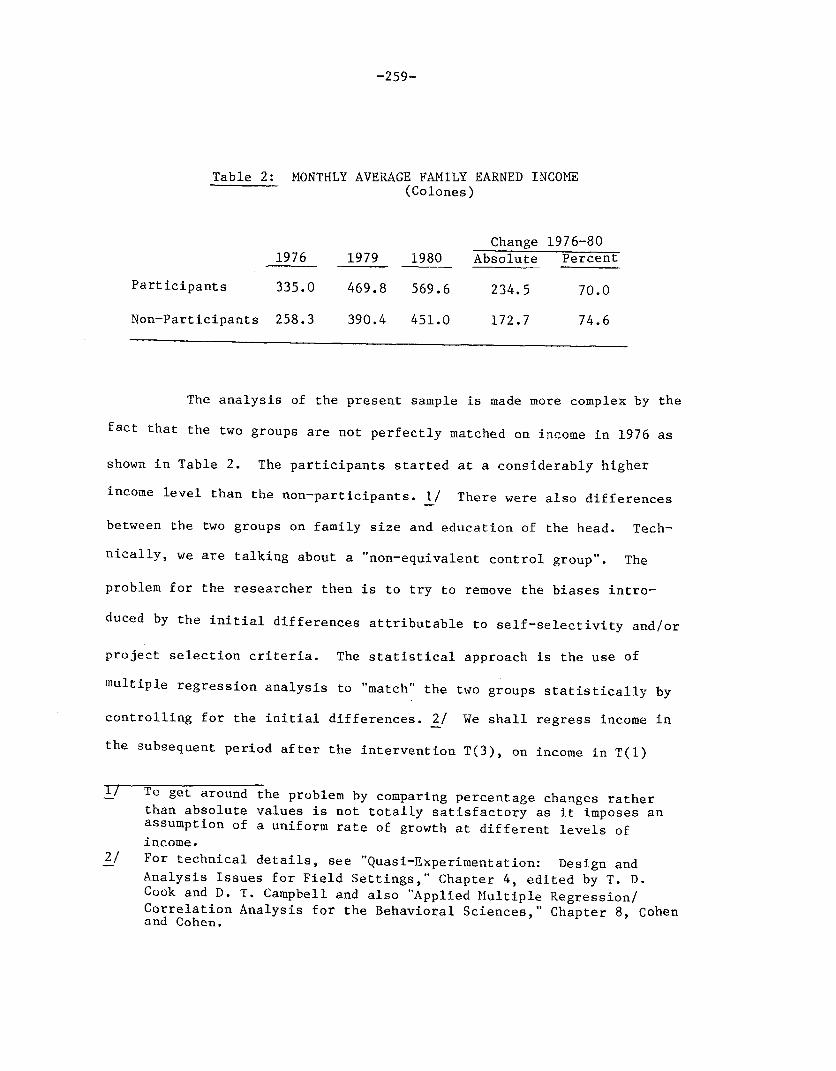
-259-
Table 2: MONTHLY AVERAGE FAMILY EARNED INCOME(Colones)
Change 1976-801976 1979 1980 Absolute Percent
Participants 335.0 469.8 569.6 234.5 70.0
Non-Participants 258.3 390.4 451.0 172.7 74.6
The analysis of the present sample is made more complex by the
fact that the two groups are not perfectly matched on income in 1976 as
shown in Table 2. The participants started at a considerably higher
income level than the non-participants. 1/ There were also differences
between the two groups on family size and education of the head. Tech-
nically, we are talking about a "non-equivalent control group". The
problem for the researcher then is to try to remove the biases intro-
duced by the initial differences attributable to self-selectivity and/or
project selection criteria. The statistical approach is the use of
multiple regression analysis to "match" the two groups statistically by
controlling for the initial differences. 2/ We shall regress income in
the subsequent period after the intervention T(3), on income in T(1)
17 To get around the problem by comparing percentage changes rather
than absolute values is not totally satisfactory as it imposes anassumption of a uniform rate of growth at different levels of
income.2/ For technical details, see "Quasi-Experimentation: Design and
Analysis Issues for Field Settings," Chapter 4, edited by T. D.Cook and D. T. Campbell and also "Applied Multiple Regression/
Correlation Analysis for the Behavioral Sciences," Chapter 8, Cohenand Cohen.

-260-
plus a dummy variable representing participation status, and an inter-
action term between the dummy variable and income in 1976. 1/ The
coefficients of the dummy variable and the interaction term between
income in base period and participation status will approximate the
project impact. 2/ Our equation will look like this:
y a + bYo + cD + dI + e
in which,
y1 = income after treatment (after moving into the project)
Yo = income before treatment
D = dummy variable: Partipant = 1, non-Participants = O
1= Y x Do
e = error term
Our null hypotheses will be: 1. Ho c = O and
2. Ho c = d = O, i.e., the project had
no impact. The joint hypothesis test in 2 is used to test whether
jointly the coefficients of the dummy variable and the interaction are
not equal to zero. This has to be used because of a high correlation
between the variables D and I, which could affect the statistical
significance of both variables. F statistics will be used for this
test.
1/ Education, age of head and family size were included in the initialstages of the analysis but are not included here as they did notaffect the results given in this section.
2! The coefficient of the dummy variable represents a shift in theintercept while that of the interaction term represents a shift inthe slope. This will be made clear in an actual illustration to beshown later.

-261-
4.1.1 Main Findings on Earned Incomes
Family Earnings
Taking total family earnings between 1976 and 1980, we found
no significant project impact as shown in Table 3.
Table 3: REGRESSION RESULTS ON FAMILY EARNINGS
Family Earnings, 1976-80Equation 1 Equation 2
Intercept 279.39 270.98
Earnings in 1976 .66 .70(7.48)** 1/ (6.48)**
Participation Status 49.24 80.57(1.44) (1.17)
Interaction Term .10(.52)
Adjusted R2 .18 .18
No. of cases 281 281
1/ ** indicates statistically significant at .01 level.
According to the above table, in Equation 1, we regress family earnings
in 1980 on family earnings in 1976 and participation status. The
coefficient of participation status is not statistically significant at
.05 significance level although it has a positive sign. This means that
we are 95 percent confident that the project had no impact on family
earnings. In Equation 2, when adding an interaction term, we found no
change in our results. Neither participation status nor the
interaction term are statistically significant at .05 significance
level, singly or jointly.

-262-
Earnings of the Household Head
Using the same method, we also found no significant impact on
the earnings of the household head between 1976 and 1980. The results
are shown in Table 4.
Table 4: REGRESSION RESULTS ON EARNINGS OF HEAD
Earnings of Household Head, 1976-80Equation 1 Equation 2
Intercept 189.83 174.45
Earnings in 1976 ..76 .86
(8 03)** (7.75)**
Participation Status 3.34 66.26(.14) (1.47)
Interaction Term 1/ 35(1.64)
Adjusted R2 .21 .22
No. of cases 240 240
/ Earnings of Head in 1976 x Participant Status.

-263-
Earnings of Secondary Workers
When we took out the earnings of the household head and
examined the earnings of the secondary worker alone, we found
significant results as shown in Table 5.
Table 5: REGRESSION RESULTS ON EARNINGS OF SECONDARY WORKERS
Earnings of Secondary Workers, 1976-80Equation 1 Equation 2
Intercept 90.47 96.16
Earnings in 1976 .55 .49(5.25)** (3.45)**
Participation Status 1! 77.15 60.79(2.54)** (1.49)
Interaction Term 2/ .13(.60)
Adjusted R2 .14 .13
No. of cases 249 249
1/ Significant at 0.01 level.2/ Earnings of Secondary Worker in 1976 x Participant Status.
According to the results above in Equation 1 between 1976 and
1980, controlling for earnings in 1976, on the average the secondary
workers in the Experimental Group experienced an increase of about 77
colones more than their counterparts in the Control Group. In Equation
2, when the interaction term is added, participation status ceases to be
significant and the coefficient of the interaction term is not
significant either. However, a joint hypothesis test shows that jointly
they are significant at .05 significance level [F2,2 45 = 3.41. This

-264-
means that together participation status and its interaction term are
significant, suggesting that project participation may have affected the
income of the secondary workers, the average difference between the
participating household and the non-participant being about 77
colones. Since the coefficient of the interaction term has a positive
sign (though not statistically significant) there might be a slight
tendency for the increase to be greater among the better off families.
The same type of analysis was performed using 1976-79 period,
but no significant difference was found on all earning categories
between the two groups in that period.
Applying the same tests on the panel data from Sonsonate with
a similar project, we found a similar pattern, ¡.e., the secondary
workers in the Experimental Group seem to have experienced a greater
average increase in earnings than their counterparts in the Control
Group, about 63 colones between 1977 and 1980. As in Santa Ana, no
difference was found in the earning of the household head over these
periods.
Main Fíndings on Earned Income per Worker
Table 6 presents mean earnings per worker at three points in
time. As can be seen, the difference between the two groups does not
vary much over time, ranging from 29.2 to 36.3 colones.

-265-
Table 6: MEAN EARNINGS PER WORKER IN CURRENT COLONES
1976 1979 1980
Participants 159.2 247.5 308.6
Non-Participants 130.0 211.2 275.0
Hlowever, if we control for the initial differences as we did
in the previous analysis, we do find that there is a difference during
1976-79 but not during 1976-80. The results are presented in Table 7.
Table 7: REGRESSION RESULTS ON EARNINGS PER WORKER
Earnings per worker, 1976-79
Equation 1 Equation 2
Intercept 152.53 138.32
Earnings per Worker in 1976 .45 .56
(6.03)** (6.09)**
Participation Stattos 23.10 70.23(1.45) (2.49)**
Interaction Term 1/ -.32(2.02)* 2/
Adjusted R2 .12 .13
No. of Cases 281 281
ti Earnings per worker in 1976 x participation status.
2/ Significant at .05 level.
According to the above results, in Equation 1, by itself
participation status does not seem to be statistically significant at
.05 level, but when the interaction is added to the equation in Equation

-266-
2, both participation status and the interaction term are statistic-
ally significant at .01 and .05 respectively. The joint hypothesis
test is also statistically significant at .05 level with an estimated
F2,277 statistic of 3.04, implying that jointly participation status and
the interaction term are statistically significant at .05 level. We
thus cannot accept the null hypothesis that the project had no impact.
The way the results in Equation 2 may be interpreted is illustrated in
Figure 4.
Figure 4: PROJECT IMPACT ON EARNINGS PER WORKER
Participants (withoutinteraction term)
Non-Participant
208.5Participant (with
interaction term)138.3
219.4
Earnings per worker 1976
Without the interaction term the participant regression line
is parallel to the non-participant but 70.2 higher as indicated by the
dotted line. But as a result of a negative shift in the slope (coef-
ficient of the interaction term), the resultant regression line for the
participants with the interaction term will have a lower slope and will

-267-
intercept the líne for the non-participants at a point where earnings
per worker in 1976 equals 219.4 colones. This means that up to that
point,the participants will be better off than the non-participants. It
also indicates that the poorer the participants, the better they are
likely to perform in terms of earnings per worker. About 85 percent of
the participants had earnings per worker of less than 220 colones in
1976.
It should be noted that we found a similar result in the
project in Sonsonate although it occurred in a different period, 1977-
80. Now since the two projects started at a different time, about a
year apart of each other. It is possible that the project impact on
earnings may have occurred during the early stages of the project cycle
roughly between year 1 and year 2.
4.1.2 Main Fíndings on Employment
Table 8 shows average number of persons employed per family
for both groups over time. The figures in parentheses represent the
absolute number of persons employed in the subsample used in the
analysis in the previous paragraphs.

-268-
Table 8: AVERAGE NUMBER OF EMPLOYED PERSONS PER FAMILY
No. of
1976 1979 1980 Families
Participants 2.4(291) 2.0(241) 1.9(232) 119
Non-Participants 2.4(384) 2.0(320) 1.7(283) 162
The above table shows that over time the average number of
persons employed per family declined in both groups, but the decline is
slightly less among the participants. In 1976, both groups had about
the same average number of 2.4. From 1976 to 1979, both groups
experienced the same decline, from 2.4 to 2.0. However, between 1979
and 1980, the average figure for the non-participants continued to fall
while that of the participants remained more or less at the same level.
The decline in the number of persons employed seems to have
little to do with the employment status of the household head,
particularly among the non-participants. Employment seems to have been
fairly stable over time for the household head in both groups. In
contrast, the employment patterns of the spouses, particularly among the
non-participants show some significant changes as shown in Table 9.

-269-
Table 9: EMPLOYMENT STATUS OF SPOUSE
Participant Non-Participant
1976 1979 1980 1976 1979 1980
Employed 45 48 49 50 55 43
Unemployed 7 3 3 10 5 1
Economicallyactive 52 51 52 60 60 44
llousewife 28 23 23 46 49 63
Others 1/ 39 45 44 56 53 55
Total 119 119 119 162 162 162
1/ In most cases there was no spouse. The remainder indicate no- information.
The most striking finding is that whilst the number of
economically active spouses remained constant for participants, there
was a sharp decline for the control group from 60 to 44. As this
decline was accompanied by an increase in the number of housewives in
the control group it would seem likely that many of these women left the
labor force either to give birth or because they were discouraged in
their job search or because of some other change in the household life-
cycle.
The relative difference between the two groups is even more
pronounced if we look at the employment patterns of secondary workers as
a whole. The number of secondary workers among the non-participants
rose from 180 in 1976 to 203 in 1979 but dropped sharply in 1980 to

-270-
150. In contrast, the participants did not experience such a drastic
change. The number of secondary workers among this group fell from 144
in 1976 to 137 in 1979, suggesting that relocation may well have had a
disruptive effect on the economic activity of this group. However, from
1979 to 1980, compared to the non-participants, the level of employment
for this group remained quite stable at 137 and 135 respectively.
4.1.3 Summary of Findings
Our results indicate that the participants may have
experienced a slightly greater increase in earnings than the non-
participants and that the less well off they were, the better they
performed with respect to earnings per worker. Whether one considers
this a project impact is a moot point as earnings are a function of a
variety of things and their connection with housing is by no means
direct, nor is it a strong one. However, there seems to be some
evidence of motivation at work among the participating households as
indicated by a relative stability in the employment patterns among their
secondary workers.
4.2 Cost-benefit comparison of low-income housing options
An important question for policy makers is to be able to
compare the relative benefits which are obtained from investments in
different types of housing options. A cost-benefit analysis, using a

-271-
modified version of the Squire-van der Tak 1/ approach was used to
compare eight housing options which were potentially accessible to the
low-income population of San Salvador. 2/ The following options were
included in the comparison:
Public housing programs
a) Multi-family apartments constructed by IVU.
b) Single family homes constructed by IVU.
c) Single family homes constructed by the FSV.
Progressive development programs
d) IVU squatter upgrading project.
e) FSDVM project with serviced lot.
f) FSDVM project with core house.'
Informal housing market
g) Colonia ilegal
h) Tugurio
For each of these housing options comprehensive information
was obtained on all costs. The information was obtained partly from the
organization responsible for the construction (in some cases this would
1/ Lyn Squire and Herman van der Tak, "Economic Analysis ofProjects," Johns Hopkins, 1975.
2/ Marisa Fernandez-Palacios and Michael Bamberger, -An EconomicAnalysis of Low-Cost Housing Options in El Salvador," Urban andRegional Report No. 81-4, Urban and Regional Economics Division,World Bank, 1981.

-272-
be the family) and by conducting interviews with a sample of families.
Benefits were estimated in terms of the imputed rent (this was estimated
by asking families for how much they think their house could be
rented). Conversion factors were then estimated so as to calculate the
costs and benefits to the nation. Flows of costs and benefits were
estimated over 20 and 30-year time horizons.
The resulting benefit-cost ratios were then calculated in
terms of internal rates of return and Net Present Value/Discounted total
cost. These two ratios were used for three main types of estimates:
a) Efficiency analysis in which no account is taken of who
receives the benefits.
b) Social analysis in which weights are attached to different
groups of beneficiaries. These weights are intended to
reflect the priority which government gives to public and
private expenditure and to the goal of income redistribution.
c) Private analysis in which the calculation of the IRR is based
upon the costs actually paid by the families and the benefits
actually received.
Each set of calculations was made with various different sets
of assumptions about land values and consumer surplus.

-273-
4.3 Evaluation of Project Benefits Through Hedonic Price Analysis 1/
One of the major problems in the evaluation of project impacts
on housing is that the normal operation of the housing market is
restricted by government reglations. Families are restricted from
renting or selling their new houses so that changes in market rent
cannot easily be used to evaluate changes in quality. One possible way
to circumvent this problem is through the use of hedonic price
analysis. Almost all project participants were previously living in
mesones. The major characteristics of the mesones in Santa Ana were
described in a set of scales and continuous variables. The variables so
described included area, quality of walls, floor and roof, type of water
supply and sanitation. In a subsequent stage certain neighborhood
characteristics were also included. All of these attributes were
included in a multiple regression analysis with rent as the dependent
variable. The coefficient of each attribute can be interpreted as
indicating the relative amount a family is willing to pay for each of
these attributes. 1/
The regression equation which was obtained was then applied to
the attributes of the FSDVM project to obtain an estimate of the imputed
market rent. Care must be taken in the interpretation of the results
as the estimates only refer to imputed rent and do not include the value
1/ John Quigley, "The Distributional Consequences of Stylized Housing
Programs,` Urban and Regional Report No. 80-18. Urban and RegionalEconomics Division, World Bank, 1980.
1/ This is an oversimplification of the meaning of the coefficients.There is considerable controversy as to the correct form ofinterpretation.

-274-
of owning as opposed to renting. One way to interpret the hedonic
estimation of rent is to assume that this indicates the amount the
family would have been prepared to pay to receive this package of
benefits. If this imputed rent is compared with the amount the family
actually has to pay to the FSDVM, the difference can be interpreted as
indicating additional benefits which the occupant obtains "for free`.
4.4 Evaluating project impact through comparisons of changes in valueof the house
An alternative method to evaluate project impact on housing
quality is to derive estimates of changes in housing value and to
compare these with changes in costs. To do this the following
indicators were calculated.
a) Imputed rent for owner occupied housing
This was derived by asking owners how much they think they
could rent their house for.
b) Imputed sale value of owner occupied housing
This was derived by asking owners how much they think they
could sell their house for.
c) Estimate of sale price/cost of construction
The process of estimating the cost of housing proved to be
extremely complex because a number of different elements come
into the purchase cost, and because different parts of the
house may have been purchased in different years so that price
adjustments have to be made. The price adjustments were in
-275-
themselves difficult to calculate because separate indices had
to be developed for materials, land, labor and a complete
house. In most cases these indices had to be developed as
none existed covering the time period in which we were
interested (going back as far as 1955). In the case of the
land index this had to be constructed from information on the
amount families had paid for land in different years. This is
not a very reliable method as it underestimates the increases
in land value (because land which is purchased later tends to
be further from the city and hence not comparable in quality
and location with the land on which we have information for
earlier years).
An example of the complexity of the estimating process can be
illustrated with the example of the colonias ilegales. The cost of the
house and land (COLCOST) was defined as follows:
COLCOST = Pl(Land) + P2(Labor for construction) + P3(Labor for
extension) + P4(Materials for construction) + P5(Materials
for extension) + P6(Value of house if purchased).
Each of these individual variables is in itself complicated to
estimate as can be shown with the example of land. The cost of land iS
calculated as follows:
LAND = A + B x (l-(l.Ol)-N/.Ol

-276-
where:
A = cash payment
B = monthly installment
N = number of months of credit payment
Monthly interest rate = 1 percent
This estimates the present value of the cost of land in the
year of purchase. The figure then had to be adjusted to 1980 prices
using the index of land prices.
Defining the indicators
Once the values of imputed rent, imputed sale value and cost
have been estimated, the following indicators were calculated:
Change in rental value
This is assumed to be directly related to changes in value of
the house.
Imputed rent/imputed sale value
This is an indicator of the rate at which the investment in
the house can be recuperated. It is often taken as a rule of thumb that
if the market is in equilibrium rent is approximately equal to 1 percent
of value.

-277-
Imputed sale price/cost
This is an indicator of the return on the investment. The
higher the ratio, the more rapidly the investment can be recuperated.
Alternatively this can be used as an indicator of the added value which
is produced for a given investment.
Projects were compared on each of these indicators, and on the
basis of the interrelationship between the different ratíos it is
possible to make some tentative judgments as to which type of housing
produces the highest benefits for occupants.

-278-
ANNEX 2: THE TERMS OF REFERENCE FOR THE EVALUATION
At the time of Appraisal the Terms of Reference for theEvaluation were defined as follows:
Evaluation
1. The Bank evaluation will seek to determine whether theobjectives mentioned elsewhere in this report are being met over time,and whether project components (both physical and institutional) yieldthe intended social and economic impacts on project participants and onassociated institutions. If they do not, evaluation should attempt toprovide explanations for the unanticipated effects. It should also testassumptions concerning the project's goals, and thus provide the basisfor recommendations on future project design and policy for both theGovernment and the Bank.
2. On-going FSVM projects are being evaluated by a team ofresearchers from the Universidad Centroamericana "Jose Simeon Canas"under a grant from the Inter-American Foundation. This evaluiationincludes a sample survey of 2,000 households within different types ofsettlements and studies of physical conditions in the neighborhoodssurveyed. Their evaluation is expected to be completed by September1975.
3. The El Salvador sites and services project has been designatedas one of the three projects on which the Bank will seek to undertake adetailed socio-economic evaluation which would be distinet from theappraisal, monitoring or post-audit evaluations undertaken in otherdepartments-of the Bank. Such an in-depth evaluation should offer theopportunity of studying the ability of a private agency to provideservices normally undertaken by Covernment agencies. The interest FSVMhas demonstrated in analyzing its own past experiences and theinstitutional base offered within the agency for future studies of asimilar nature strengthen the case for undertaking such an evaluation.The on-going evaluation should serve to provide a basis for testing theassumptions and hypotheses upon which the Bank will base its ownstudy. The Bank study has been proposed for UNDP financing under thetechnical assistance program mentioned in para. 3.20, for which the Bankwould serve as executing agency.
Methodology
4. The evaluation will be carried out in three phases: (i) beforelot occupancy; (ii) during execution; and (iii) after the project-sclosing date. Household surveys and special studies will be used togather information during each of the phases.

-279-
5. Household surveys will consist of questionnaires administeredto respondents in both project and non-project areas (control groups).The same households will be interviewed during each of the three studyphases. Participants will be chosen from stratified random samples inboth project and control areas. To the extent possible, the universe
from which the samples are to be selected will be provided by FSVMpreselection forms. At the same time that families are interviewed,information regarding housing conditions will be gathered by theinterviewers. Standardized measures and indicators will be formulatedbefore field work begins.
6. In particular, the evaluation will attempt to determine therelationship between the specified objectives of the project and themeans chosen within the project to achieve those objectives. Theobjectives - the dependent variables in the analysis - include, interalia, the following:
(a) changes in the economic and social attitudes and behavior ofproject participants;
(b) improvement in the living conditions and community servicesfor 8,000 families and reduction of the housing shortage forthe low-income population in El Salvador;
(c) demonstration of a successful alternative shelter solution toconventional fully built government housing projects;
(d) expansion of employment opportunities through the organizationof small commercial ventures and labor-intensive constructionmethods;
(e) changes in the patterns of household expenditures due toincreased capital formation and the inclusion of particularproject components such as piped water;
(f) improvement of Government planning for low-income settlements.
7. The means - material, humnan and financial - for attainingthese objectives include:
(a) provision of urbanized building lots incorporating two servicelevels;
(b) housing construction based on self-help and mutual-help;
(c) provision of credit in the form of construction materialsloans;
(d) provision of community facilities, including health clinics,community centers, sports fields, markets and schools.

-280-
(e) programs of technical assistance and credits for small-scaleindustries.
8. It will be necessary to see whether the relationship betweenthe means and the goals are affected by certain cultural, demographic orsocio-economic characteristics of the population. Thus, individualattributes (i,e., age, sex, education, income level, employment andmigratory history) will have to be taken into account in determiningthat relationship.
9. A research team, consisting primarily of local researchers,will be recruited to undertake the evaluation. Their institutionalaffiliation will be decided by the FSVM and the Bank. The terms ofreference and the research design for the project evaluation will beagreed between the two parties by December 1974.

-281-
REFERENCES
1. Michael Bamberger, "Quasi-Experimentation in an Urban Context: AReview of Experience in the Evaluation of World Bank UrbanShelter Programs". Urban and Regional Report No. 81-5, Urbanand Regional Economics Division, World Bank. 1981.
2. L. S. Burns and L. Grebler, "Housing the Nations", 1977.
3. Thomas D. Cook and Donald T. Campbell, "Quasi ExperimentationDesign and Analysis Issues for Field Settings", Rand McNally1979.
4. Daniel Ernst, "The Informal Housing Market in San Salvador`Urban and Regional Economies Division, World Bank, 1979(draft) -
5. Marisa Fernandez-Palacios and Michael Bamberger, "An EconomicAnalysis of Low-Cost Housing Options in El Salvador", Urbanand Regional Report No. 81-4, 1981.
6. Edgardo Gonzalez-Polio, "FSDVM Studies on Demand andAffordability", FSDVM Report. 1980.
7. . "FSDVM Studies on Accessibility of Projects to theurban Joor", FSDVM Report. 1980.
8. FSDVM, "Evaluacion de Proyectos Habitacionales en El Salvador,"Vols. I and II;
9. "Caracteristicas del Acceso de los Pobres a ViviendaPopular"; May 1978.
10. "Socio-Economic Study of Santa Ana, 1976. (Survey conductedby the Unidad de Evaluacion of the FSDVM and analyzed incooperation with the Urban and Regional Economics Division ofthe World Bank)
11. -Analysis of the Development Process and of AutonomousSolutions: El Pepeto Project," Vols. I and II. February 1977.
12. 22nd Report to the World Bank on the Advance of the FirstLoan, July 1980;
13. "Effectiveness of the Cooperatives as a Medium of SocialChange and the Definition of the Alternatives for Action forthe Community Enterprises Program", Report No. 17, 2 volumes,December 1977.

-282-
14. "The Effect of Construction and Mutual Help on the Generationof Employment and Income. The Case of the Projects in Santa
Ana, Sonsonate and Usulutan," Report No. 4, September 1976(revised);
15. "Special Report prepared at the request of IBRD byDepartamento de Empresas Comunitarias," September 20, 1978;
16. `Demand Study in Apopa., FSDVM Evaluation Report No. 18;1978.
17. `Demand Study in Usulutan," FSDVM Evaluation Report No. 11;1977.
18. "Analisis del Proceso Evolutivo y de las SolucionesAutonomas,` February 1977;
19. 'Evaluation of the Causes of Absenteeism and Resignation ofFamilies Selected for the 'La Periquera' Project in SantaAna,; Unidad de Evaluacion, Report No. 1, May 1976;
20. "Evaluation of Mutual Help and its Functions in the Process ofSocial Change. The Case Study in Sonsonate," FSDVM EvaluationReport No. 12, July 1977;
21. `La Vivienda Popular en El Salvador," 1976.
22. Aida Herrera and Martin Baro, "Law and Order in a Meson in SanSalvador, El Salvador," October 1978.
23. Aida Herrera and Francisco Altschul, "Proyecto Experimental deRehabilitacion del Meson El Progreso," FSDVM Report, 1979.
24. Dani Kaufmann and David Lindauer, "Basic Needs, InterhouseholdTransfers and the Extended Family," Urban and Regional ReportNo. 80-15, Urban and Regional Economícs Division, World Bank,1980.
25. Douglas R. Keare and Emmanuel Jimenez, "Affordability, Income andHousing Consumption,, Urban and Regional Economics Division,World Bank, November 1980 (draft).
26. David Lindauer, "Longitudinal Analysis of Project Turnover: SomeLessons from El Salvador," September 1979, Urban and RegionalEconomics Division, World Bank.
27. "Income and Expenditure Report", by Research and Analysis Division,National Housing Authority of the Phílippines. 1978.

-283-
28. John Quigley, "The Distributional Consequences of Stylized HousingPrograms," Urban and Regional Report No. 80-18, Urban andRegional Economics Division, World Bank, August 1980.
29. Jim Richard and Michael Bamberger, "Economic Evaluation of Sitesand Services Programs and Their Accessbility to Low-IncomeGroups in El Salvador," FSDVM Report Series on the Evaluation,No. 16, July 1977.
30. Mauricio Silva and Alberto Harth-Deneke, "Housing Built by MutualHelp and Progressive Development: To What End?" in "Self-Help: A Critique", Alexander Press, London, 1979.
31. Lyn Squire and Hermann van der Tak, "Economic Analysis ofProject,` Johns Hopkins University Press. 1975.
32. U.N. Yearbook of Construction Statistics 1968-79.
33. World Bank, "El Salvador: An Enquity into Urban Poverty," ReportNo. 2945-ES. 1980.
34. Urban and Regional Economics Division, `Analysis of the Level ofDemand for Low Cost Housing in Usulutan," Urban and RegionalReport No. ME-2, World Bank, 1978.


- 285 -
WorId Bank Oxford University Press, 1981. 192 ing maps, appendixes, bibliography,pages (including index, appendixes). index).
Puiblications LC 81-3999. ISBN 0-19-520264-3, LC 80-8023. ISBN 0-8018-2499-0,
of Related $16.95 hardcouer, ISBN 0-19-520265-1, $32.50 (£20.75) hardcover:$7.95 paperback. ISBN 0-8018-2498-2, $9.50 (£6.75)
Interest Also available in lKorean from the paperback.Korea Research Institute for HumanSettlements. Costs and Scale of
Bus ServicesThe Transformation of A. A. WaltersUrban Shelter: Upgrading World Bank Staff Working Paper No.the Housing Stock in 325. April 1979. iv + 49 pagesCartagena, Colombia (including 3 annexes, references).W. Paul Strassmann Stock No. WP-0325. $3.00.
In urban development, it is nowoften considered more practical and Economic Forces Underly-
Cities in the Developin efficient to upgrade the existing ing Urban DecentralizationWorld: Policies for Their housing stock than to transfor- Trends: A Structural ModelEquitable and Efficient mation should not only be expected for Density GradientsGrowth and tolerated, but should even be Applied to KoreaJohannes E Linn fostered as a means to increase J. R. Follain, Bertrand Renaud,
production in an important field, to and Gill-Chin LimDelineates the major policy issues generate employment, and tothat arise in the efforts to adapt to improve equity in the distribution of World Bank Reprint Series: Numberthe growth of cities in developing housing. This study shows how the 107. Reprinted from Environment andcountries and discusses policies housing stock in Cartagena was Planning A 11 (1979):541-551.designed to increase the efriciency upgraded during the 1970s by Stock No. RP-0107 free of charge.and equity of urban development. owner-occupants and, to a lesserParticular areas covered include extent, by landlords. The principalurban employment, income conclusions are supported by exten- Housingredistribution through the fiscal sive econometric tests and bysystem, transport, housing, and interviews with local experts and Reviews the importance of housingsocial services. The policy instru- authorities. within the framework of urbanments considered include public development problems, and makesinvestment, pricing, taxation, The Johns Hopkins Uniuersity Press, recommendations for World Bankand regulation. May 1982. About 224 pages. assistance in integrated urban
Oxford University Press, June 1982. LC 81-481 76. ISBN 0-8018-2805-8, planning.About 352 pages (including bibliog- $22.50 hardcover. Sector Policy Paper. May 1975.raphy, index). 75 pages (including 13 annexes).ISBN 0-19-520382-8, $27.50 hardcover- Urban and Spatial English, French, Spanish, and Arabic.ISBNl 0-19-520383~6, $12.50 paper- Development in Mexico Stock Nos. PP-7506-E, PP-7506-f,back. Ian Scott PP-7506-S, PP-7506-A. $5.00.
Examines urbanization in a countryin which that process has been Housing for Low-lncome
National Urbanization Policy particularly rapid and in which such Urban Families: Economicsin Developing Countries issues as provision of jobs, shelter, and Poli in thBertrand M. Renaud public services, and mass transit are Cy e
urgent. Also considers issues that Developing WorldNational urbanization policies in arise because of the size and form of Orville E Grimes, Jr.developing countries often attempt, the system of large cities and thewithout a fuil understanding of the nae beteen them: centraliza Analyzes the operation of urbanforces at work, to block the growth of tion, rural-urban integration, and pat- huinmaktindelpgco-the largest cities and to induce nter f al lo t. tries to determine the kinds of dwell-decentralization. This book takes a The study is relevant to other coun- ig fodbeb h ra orcritical look at such policies and their tries in which similar problems will The Johns Hopkins Uniuersity Press,weak conceptual foundations and undoubtedly become increasingly 1976. 190 pages (including statistícaldescribes problems inherent in appendix select bibliography, index).implementation. The coverage is urgent. a d,comprehensive, and both global and The Johns Hlopkins University Press, LC 76-4934. 15 Ni 0-8018-1855-2,national trends are analyzed. April 1982. About 320 pages (includ- $18.50 (£9.50) hardcover;

- 286 -
ISBN 0-8018-1854-0, $8.95 (£3.50) Sites and Services Projectspaperback. A World Bank Paper. April 1974. 47
Spanish: Vivienda para familias urbanas pages (including annex). English,de bajos irgresos: aspectos económicos French, and Spanish.y d ?.c en el mundo en desa- Stock Nos. FP-7401-E, PP-7401-F,
LoÁn! oTLcnos, 978. PP-7401-S. $5.00.i 0778-5, 480 pesetas.
__52 kr%p) al-má EfficUrban Economic and Plan-ning Modeis: Assessing the
In- u2rbam B5eU$ Potential for Cities inChca&5es Fel1bel and Developing CountriesA. A. Milalters Rakesh MohanWorla Bank Staff DYorking Paper No. Applies current urban modeling371. £ebruary 1980. 19 pages (includ- techniques to cities in developinging selected biblí0graphy). countries. Problems intrinsic to theStock IIc. WP-0371. $3.00. modeling of all urban areas are
considered along with those particu-Th e O of Bogota: Who lar to cities in poor countries.They Ae, at They Earn, The Johns Hopkins University Press,
W Dre They Live 1979. 192 pages (including bibliogra-Rakeshl Mohan phy, author index).
World Bank Staff Working Paper No. LC 78-8437. ISBN 0-8018-2141-X,.390. May 1980. 153 pages (including 2 $7.50 (<5.25) paperback.appendlxes, ñIbliography).Stock Io. WP-0390. $5.00. Urban Growth and
Economic DevelopmentPirate Subdivisions and the in the Sahel
a1ar kt Er Residential Lots Michael A. Cohen and othersWorld Bank Staff Working Paper No.
Alan CarrolI 315. January 1979. 120 pages (includ-WVorld Bank Sfaff Working Paper No. ing bibliography, 3 statistical annexes,435. October 1980. 116 pages (includ- map).ing 2 appería¡xes, tables, references). Stock No. WP-0315. $5.00.
Stock No. WF-0435. $5.00.
Resa-ee MAllocation toHoa, ig, Mnestment: Com-Metz- s. 7purther ResultsBert-rand ¿I. Renaud
.,'e Demand fr lousing inBJe v 'p Countries: The
Bertrand ,M. Renaud withJarnes Fbr,a1n and0,111_Chí,n Lirr,
ofs o' lomeerg lp ¡- a Developing
Rza ~ The Case
Bertrand i. Rernaud withU1I-Chin Lrm anid
Jarmies Frolain
World Bank RDeprint Series: Number183. Reprinted from Economic Develop-ment and Cultural Change, vol. 28, no.2 (January 1980):389-399.
Stock No. RP-0183. Free of charge.

The World BankHeadquarters:1818 H Street, N.W.Washington, D.C. 20433, U.S.A.
Telephone: (202) 477-1234Telex: WUI 64145 WORLDB3ANK
RCA 248423 WORLDBKCable address: INTBAFRAD
WASHINGTONDC
European Office:66, avenue d'léna75116 Paris, France
Telephone: 723.54.21Telex: 842-620628
Tokyo Office:Kokusai Building1-1, Marunouchi 3-chomeChiyoda-ku, Tokyo 100, Japan
Telephone: 214-5001Telex: 781-26838
ISSN 0253-2115/ISBN 0-8213-0116-0